Report 230421001/2009 L. Mollema et al.
PIENTER 2-project: second research project on the
protection against infectious diseases offered by the
national immunization programme in the Netherlands
RIVM report 230421001/2009
PIENTER 2-project: second research project on the
protection against infectious diseases offered by the
national immunization programme in the Netherlands
This report contains an erratum d.d. 2 March 2010 on the last page L. Mollema
H.E. de Melker S.J.M. Hahné J.W.M. van Weert G.A.M. Berbers F.R.M. van der Klis Contact:
L. Mollema
Centre for Infectious Disease Control Netherlands, Epidemiology and Surveillance Unit
Liesbeth.Mollema@rivm.nl
This investigation has been performed by order and for the account of the Ministry of Health, Welfare and Sports, within the framework of project no. V/230421/01/PS, PIENTER study
© RIVM 2009
Parts of this publication may be reproduced, provided acknowledgement is given to the 'National Institute for Public Health and the Environment', along with the title and year of publication.
Abstract
PIENTER 2-project: second research project on the protection against infectious diseases offered by the national immunization programme in the Netherlands
In 2006 and 2007 the RIVM carried out the second PIENTER-study by order of the Ministry of Health, Welfare and Sports (VWS). PIENTER is a Dutch acronym for: Peiling Immunisatie Effect Nederland Ter Evaluatie van het Rijksvaccinatieprogramma. The aim of this study is to gain insight into how well the Dutch population is protected against vaccine-preventable diseases through the national
immunization programme (NIP). The results will enable further improvements of the immunization programme to be made as well as identifying those population groups who are less protected.
This report describes the design of the study and provides background information on the participants. The people who took part were between 0-79 years old and lived scattered throughout the Netherlands. They completed a questionnaire on their personal details, their state of health and any diseases they have had in the past. In addition, blood samples were taken from the participants to determine the antibody levels of the diseases covered by the programme. Finally, they were asked which vaccinations they have already had. An extra group of non-Western migrants and a group of orthodox-reformed individuals, who refuse vaccination on religious grounds, were also invited to participate. The study provides insight into disease protection levels that were obtained either through vaccination or because a person has had the disease itself. It also provides information on the spread of infectious diseases. In total, 24,147 people were invited to take part in the study. Thirty-three percent of those asked, agreed to participate. Currently, blood samples are available from 7,904 people that will be tested for the presence of antibodies against all of the infectious diseases covered by the programme as well as other infectious diseases. The blood results and questionnaire information will be compared with the results of the first PIENTER-study, which was performed ten years ago. The data will be reported separately.
Key words:
national immunization programme, PIENTER, population-based study, determining antibody levels, immunosurveillance, vaccine-preventable diseases
Rapport in het kort
PIENTER 2-project: tweede onderzoek naar de bescherming tegen infectieziekten waartegen in het Rijksvaccinatieprogramma wordt ingeënt
In 2006 en 2007 heeft het RIVM in opdracht van het ministerie van VWS het tweede PIENTER-project uitgevoerd. Dit staat voor Peiling Immunisatie Effect Nederland ter Evaluatie van het
Rijksvaccinatieprogramma. Het doel is te onderzoeken of Nederland goed beschermd is tegen
infectieziekten waartegen in het Rijksvaccinatieprogramma (RVP) wordt ingeënt. De resultaten van het onderzoek kunnen bijdragen aan eventuele verbeteringen van het RVP en zullen groepen personen met minder goede bescherming tegen infectieziekten aan het licht brengen.
Dit rapport beschrijft de opzet van dit onderzoek en geeft achtergrondinformatie over de deelnemers. De deelnemers waren tussen de 0 en 79 jaar en woonden verspreid door heel Nederland. Zij hebben een vragenlijst ingevuld over hun persoonlijke gegevens, gezondheid en doorgemaakte ziekten. Daarnaast is er bloed afgenomen om te kijken hoeveel antistoffen de deelnemers hebben tegen de ziekten uit het RVP. Tot slot is aan hen gevraagd welke inentingen ze hebben gehad. Er is een extra groep mensen uitgenodigd uit de groep niet-westerse migranten en uit de groep orthodox-gereformeerden die vaccinatie afwijzen. Dit onderzoek verschaft inzicht in de mate van afweer tegen ziekten die mensen verkrijgen nadat ze zijn gevaccineerd of de ziekte hebben doorgemaakt, en in het voorkomen van infectieziekten.
In totaal zijn er 24.147 personen uitgenodigd en daarvan was 33 procent bereid om mee te doen aan het onderzoek. Van 7904 personen is bloed aanwezig dat in het laboratorium zal worden onderzocht op de aanwezigheid van antistoffen tegen alle infectieziekten van het RVP en andere infectieziekten. De resultaten van het bloedonderzoek en de vragenlijst gegevens zullen worden vergeleken met die van het eerste PIENTER-onderzoek, dat tien jaar eerder is uitgevoerd, en zullen apart worden gerapporteerd. Trefwoorden:
Rijksvaccinatieprogramma, PIENTER, populatieonderzoek, antistofbepalingen, immuunsurveillance, infectieziekten waartegen wordt ingeënt
Acknowledgement
The realization of the PIENTER 2-project could only be fulfilled through the elaborate co-operation of many parties: the Public Health Services who mediated between the municipalities and participants on the one hand and the RIVM on the other hand and facilitated the data-collection, the municipalities who drew the sample from the population register, the printing office of the RIVM who managed to get the mailing out in time every week, the PIENTER 2-project team (Nienke Jones, Nelleke Bakker, Carola Troll, Cindy Dierikx, Michiel van de Wetering), Nel Rutters, Carola Wouters-van Tellingen, Francoise van Heiningen and other colleagues of the RIVM involved in the project for their
contribution to the performance of the P2 project. Last but not least we thank the participants without whom this project never could have been realized.
List of abbreviations
CBS Statistics Netherlands / Centraal Bureau voor de Statistiek CIb Centre for Infectious Disease Control
COPD Chronic Obstructive Pulmonary Disease
EMI Expertise Centre for Methodology and Information Services EPI Epidemiology and Surveillance unit
GCP General clinical practice
GMT Geometric mean titre
GP General Practitioner
LCR National co-ordination of vaccinations for travelers / Landelijke coördinatie reizigersvaccinatie
LIS Laboratory for Infectious Diseases and Perinatal Screening LOI National consultation about infectious diseases / Landelijk overleg
infectieziekten
LVCS Low immunization coverage sample
NIP National Immunization Program / Rijksvaccinatieprogramma (RVP)
NMI Net monthly income
NS Nationwide sample
ORI Orthodox reformed individual
PC Protestant Christian
PEA Local authority for registration of vaccinations
PHS Public Health Service
PIENTER Dutch acronym for: Peiling Immunisatie Effect Nederland Ter Evaluatie van het Rijksvaccinatieprogramma
P1 PIENTER 1-study
P2 PIENTER 2-study
PR Public relations
RB Reformed Bond
RC Reformed Congregation
RIVM National Institute for Public Health and the Environment / Rijksinstituut voor Volksgezondheid en Milieu
SAS Statistical package
SOP Standard Operating Procedure
Contents
List of tables and figures 11 Summary 15
1 Introduction 17
2 Methods 19
2.1 Sample size calculation 19
2.1.1 Nationwide sample 19
2.1.2 Non-Western migrants 20
2.1.3 Low immunization coverage municipalities 21
2.2 Sampling 21
2.2.1 Nationwide sample 21
2.2.2 Migrants 22
2.2.3 Low vaccination coverage sample 23
2.2.4 Sampling for additional objectives 23
2.3 Co-operation with Public Health Services 24
2.4 Co-operation with municipalities 24
2.5 Approach of the participants 25
2.6 Clinic 26
2.7 Location clinics 27
2.8 Questionnaires 27
2.9 Non-response questionnaires 28
2.10 Vaccination certificates 28
2.11 Serum isolation and storage 28
2.12 Complaint procedure 29
2.13 Public relations 29
2.14 Ethical issues and privacy 29
2.15 Data-entry 29
2.16 Data validation 30
2.17 Data-analysis 30
2.17.1 Nationwide sample and migrants 30
2.17.2 Low vaccination coverage sample 31
2.18 Classifications of net monthly income, religion and education 31
3 Results 33
3.1 Response in the P2-project 33
3.2 Questionnaire 34
3.2.1 Completing the questionnaire 34
3.2.2 Clarity of questions 35
3.2.3 Missing values 35
3.2.4 ‘Don’t know’ and ‘Won’t answer’ answers 36
3.2.5 Questions mistaken 36
3.3 Demographic information 36
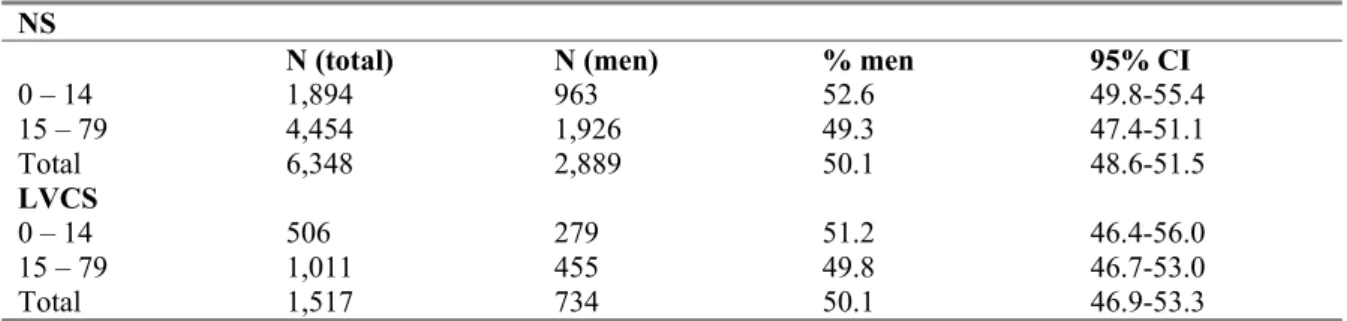
3.3.1 Distribution of gender 36
3.3.2 Net monthly income per household 37
3.3.5 Educational level 40
3.3.6 Religion 41
3.4 Other vaccinations 44
3.4.1 Latest tetanus (re)vaccination because of an injury 44
3.4.2 Latest DTP (re)vaccination 46
3.4.3 Hepatitis A vaccination 46
3.4.4 Hepatitis B vaccination 47
3.5 State of health 48
3.6 General features of the participants 52
3.7 Military service 52
3.8 Travelling data of participants 53
3.9 Pregnant women 54
3.10 Infectious diseases participants have had in the past 55 3.11 Blood donor, having received blood products and having a
piercing or tattoo 58
3.12 Outdoor activities possibly related to infectious diseases 59 3.13 Contact with cats and keeping pets and farm animals 60
3.14 Bitten by ticks 62
3.15 Vegetarian, eating raw meat and unwashed vegetables 62
3.16 Social contacts 63
3.17 Sexual history 65
3.18 Opinion on vaccinations 68
4 Conclusions/discussion 71
References 73
Appendix 1 Number of invited individuals and participants per municipality 75 Appendix 2 Number of invited and participating migrants 77 Appendix 3 Number of invited individuals and participants in low
vaccination coverage sample 79
Appendix 4 Activities for contact person of Public Health Service 81 Appendix 5 Study materials in binder for Public Health Service 82
Appendix 6 Diary 83
Appendix 7 Explanation of the P2 database 94 Appendix 8 Materials present at the clinic 95 Appendix 9 Criteria for location of the clinic 96
Appendix 10 Questionnaire 0-14 year-olds 97
Appendix 11 Questionnaire 15-79 year-olds 118 Appendix 12 Evaluation and recommendations 141
List of tables and figures
Tables
Table 2.1 Migrant groups distinguished by country of birth, age and
generation 21 Table 2.2 The Netherlands were divided into five geographic regions:
provinces and the number of inhabitants per region 22 Table 3.1 Materials obtained and response in the PIENTER2-project 33 Table 3.2 Number of participants per age group 34 Table 3.3 Who filled in the questionnaire per age group 35 Table 3.4 Percentage of men among the participants per age group 36 Table 3.5 Distribution of net monthly income (NMI*) per household per
age group 38
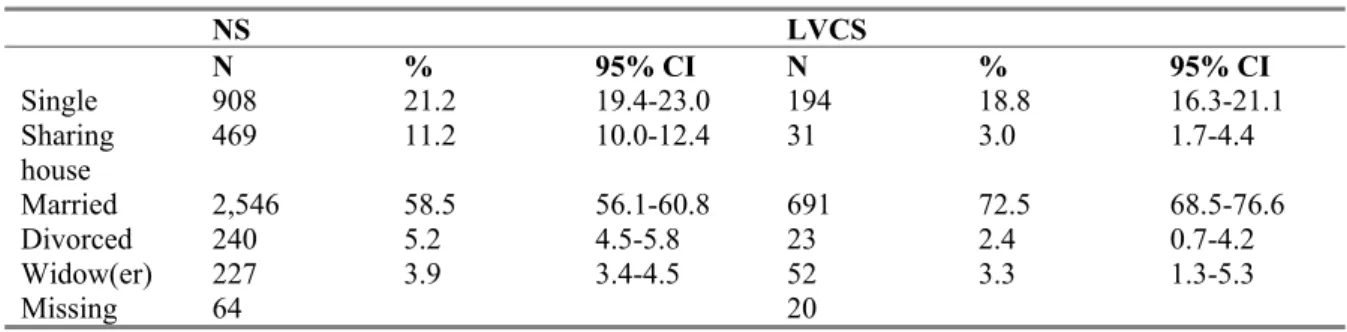
Table 3.6 Marital status of the participants aged 15 years and older 38
Table 3.7 Nationality* and native country 39
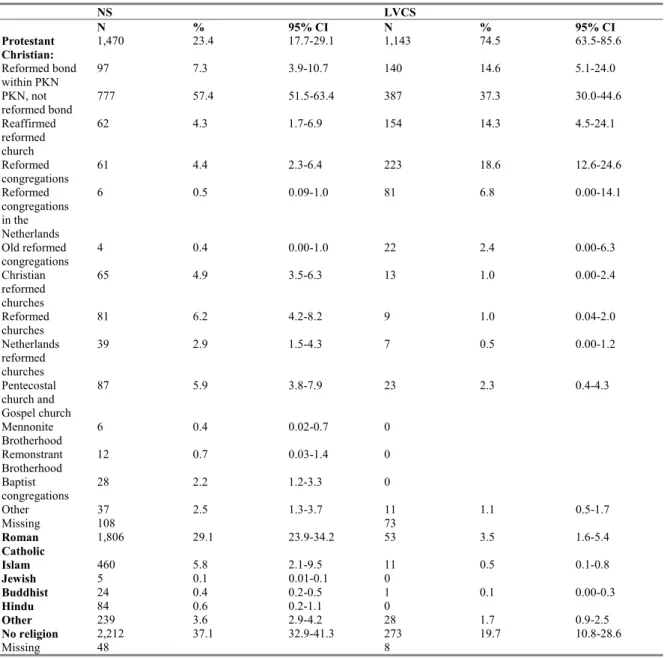
Table 3.8 Native country parents and ethnicity 40 Table 3.9 Distribution of educational level* per age group 41 Table 3.10 Reported religion of participants, specified for the
Protestant Christian belief 42
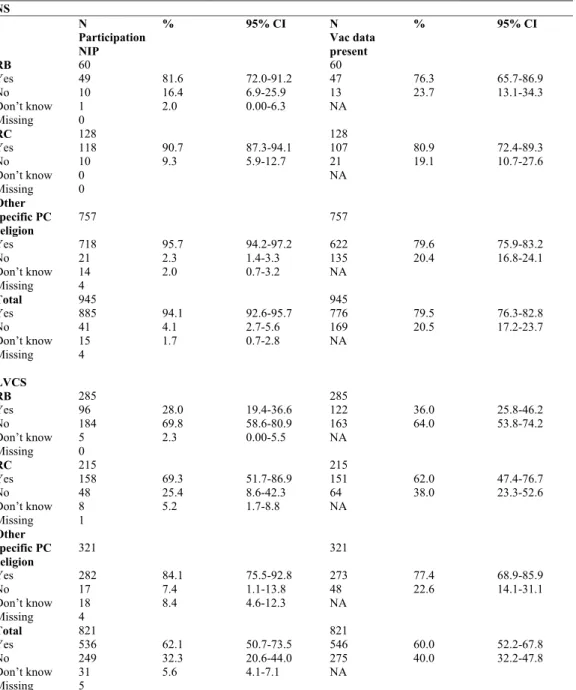
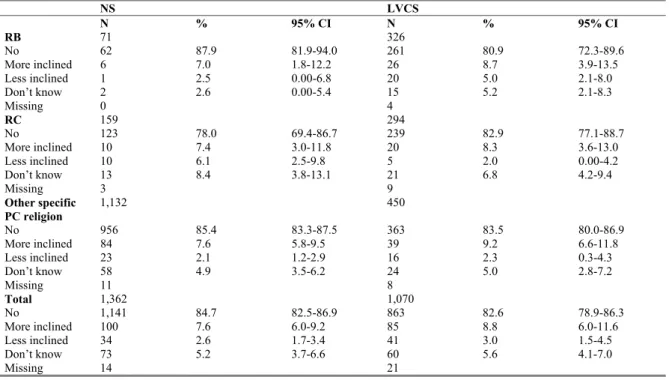
Table 3.11 Participation in the NIP and vaccination data present for different religious groups with a Protestant Christian belief* (0-55 years) 43 Table 3.12 Change in opinion on necessity of immunization in past five years
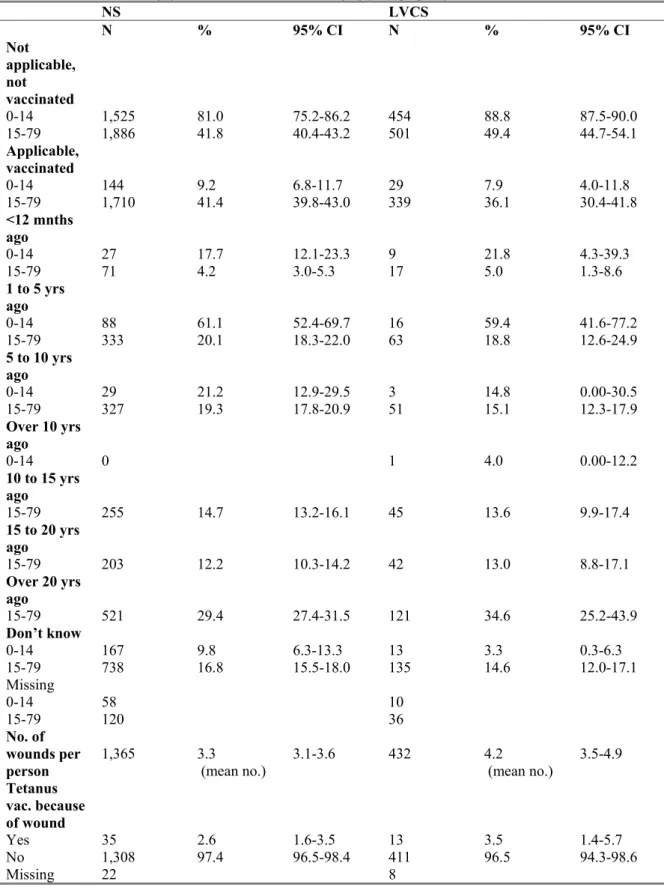
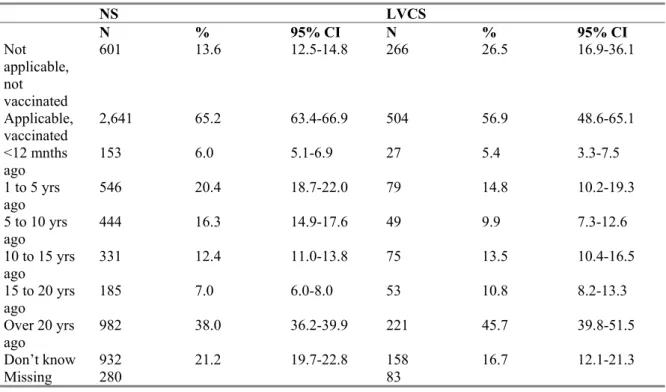
for participants with a specific Protestant Christian belief 44 Table 3.13 Latest tetanus (re)vaccination because of an injury per age group 45 Table 3.14 Latest DTP (re)vaccination for participants aged 15-79 years old 46 Table 3.15 Immunization against hepatitis A per age group 47 Table 3.16 Immunization against hepatitis B per age group 48 Table 3.17 Opinion on their own state of health 49 Table 3.18 Chronic diseases or allergies reported by participants 50
Table 3.20 General features of the participants 52 Table 3.21 Military service of participants aged 17*-79 years old 53 Table 3.22 Having been vaccinated because of their profession for
participants aged 15-79 years old 53
Table 3.23 Travelling data 54
Table 3.24 Pregnancy of female participants aged 19-44* years old 54 Table 3.25 Having had tuberculosis in the past 55 Table 3.26 Coughing and fever during last 12 months and pertussis
diagnosed 56
Table 3.27 Swollen painful cheeks and fever during last 12 months and
mumps diagnosed 57
Table 3.28 Red spots on body and fever during last 12 months and measles
diagnosed 57
Table 3.29 Having had chicken pox in the past 58 Table 3.30 Blood donor for participants aged 18*-79 years old 58 Table 3.31 Having received blood products for participants aged
15-79 years old 58
Table 3.32 Piercing or tattoo 59
Table 3.33 Playing in sandbox for participants less than five years old 59 Table 3.34 Working or playing in garden per age group 60
Table 3.35 Contact with cats per age group 61
Table 3.36 Keeping pets 61
Table 3.37 Keeping farm animals 62
Table 3.38 Bitten by ticks 62
Table 3.39 Being vegetarian 62
Table 3.40 Eating raw or half-baked meat products during last 12 months 63 Table 3.41 Regular eating unwashed raw vegetables 63 Table 3.42 Contact with groups of individuals within profession or
Table 3.43 Mean number of conversations with persons in a certain
age group and the day of the week the conversations took place 64 Table 3.44 Sexual history for participants aged 15-79 years 65 Table 3.45 Reported sexual transmitted diseases (STD)* and drug use
for participants aged 15-79 years old 67 Table 3.46 Opinion on childhood vaccinations 68 Table 3.47 Future vaccinations for child to receive will be administered for
participants aged 0-14 years old 68
Table 3.48 Maximum number of injections still acceptable for participants
aged 0-14 years old 69
Table 3.49 Childhood vaccinations are good for the protection of the health of my child for participants aged 0-14 years old 69 Table 3.50 There is no need for vaccinating healthy children for participants
aged 0-14 years old 69
Table 3.51 I have doubts about the safety of the vaccinations children receive for participants aged 0-14 years old 70 Table 3.52The immune system of my child will negatively be affected by
vaccination for participants aged 0-14 years old 70 Table 3.53 Childhood vaccinations are good for the health protection of
others for participants aged 0-14 years old 70 Table A1.1 Half-width for the 95% CI for the seroprevalence estimate of
50%, depending on the number of participating municipalities (clusters) and the total number of participants 75 Table A1.2 Increase of the number of invited individuals in certain
age groups during the study 75
Table A1.3 Number of invited individuals and number of participants
per municipality 76
Table A2.1 Over sampling migrant groups: number of individuals by
age group initially to be invited and expected 77 Table A2.2 Actual number of invited individuals and number of participants
per migrant group 78
Table A3.1 Number of individuals in LVCS initially to be invited and
Table A3.2 Actual number of invited individuals and number of participants
in LVCS per age group 79
Table A7.1 Explanation of actions in central database 94 Table A7.2 Various tools of central database 94
Figures
Figure 2.1 Selected municipalities in the study 23 Figure 3.1 Number of participants per age stratum in the NS, stratified
by gender 37
Figure A3.1 The vaccination coverage of DTP-IPV per municipality in
Summary
Background and objectives: In 2006/7 a second serum bank was set-up in the Netherlands within the
PIENTER 2-project (P2). This second serum bank was completed about ten years after the first nationwide serum bank. The aim of this project is primarily to provide insight into age-specific levels of antibodies against the vaccine preventable infectious diseases in the National Immunization Program (NIP) in the general Dutch population and also in two more specific populations namely, the low immunization coverage (LVC) municipalities and non-Western migrants. In addition, the aim is to estimate the incidence of infectious diseases, particularly those with a frequent sub clinical course. This report describes the design of the study and the back-ground information from the questionnaires from the participants of the P2-project.
Three sub studies were integrated in the P2-project: 1. to gain insight into the spread of air-borne infections by estimating the number of social contacts between individuals of various age groups; 2. to gain insight into genetic differences between vaccine responders; and 3. to investigate a possible association of vaccination with allergies.
Methods: A two-stage cluster sampling technique was used to draw a nationwide sample. In each of
five geographic regions of the Netherlands, eight municipalities were randomly selected proportionally to their size. The over sampling of non-Western migrants took place in 12 of these 40 municipalities. In addition, eight municipalities were selected where many persons live who refuse vaccination on religious grounds. Within each municipality, an age-stratified sample of
372-1,971 individuals (0-79 yrs) was drawn from the population register. In total 24,291 persons were invited to participate in the study. Invitees were asked to complete a questionnaire and to donate a blood sample. For the genetic study an extra blood sample was taken (or a buccal swab in children less than five years old). For the estimation of social contacts between individuals of various age groups a diary was handed out to about 1000 participants of the P2 study. Invitees who did not want to participate were invited to fill in a non-response questionnaire.
Results and conclusions: The response was 34% (5,860 out of 11,363) in the nationwide sample, 26%
(668 out of 2,558) in the extra sample of migrants and 36% (1,561 out of 4,366) in the LVC sample. In total a number of 7,904 serum samples are available for many sero-epidemiological studies. For 80% of the participants with a serum sample, who were eligible for the NIP, the vaccination history was confirmed. From all invitees about 50% supplied information via the questionnaires. From the other invitees information from the population registers of the municipalities is available.
Age-specific antibody levels against the different vaccine preventable diseases in the NIP, but also against other infectious diseases will be determined about which will be reported separately. The data from the questionnaires will be used for the interpretation of the antibody levels and to obtain
information on incidence and risk factors related to infectious diseases.
The assessment of antibody levels in serum for the evaluation of the NIP, by means of large population-based studies like PIENTER, becomes more and more important in view of low disease incidence and smaller numbers of cases, which is due to the success of the NIP. By repeating such studies within ten year intervals we gain insight into the changes of the immunity of the population over time and in changes in infection pressure to improve the NIP further.
1
Introduction
Measuring the serological effects of vaccination and natural infection (i.e. serosurveillance) is an important tool for the evaluation of the effectiveness of the Nationwide Immunization Program (NIP). Other surveillance tools for evaluating the effectiveness and safety of the NIP are: pathogen
surveillance, clinical surveillance, surveillance of adverse events of vaccines and surveillance of the vaccination coverage. The focus of this report is serosurveillance, which provides insight into the level of antibodies in the population, by identifying subpopulations at risk and by assessing the
(re)-emergence of disease. Moreover, it can also give insight into the long term effects of mass vaccination such as the duration of both vaccine-induced immunity and natural immunity. Under the influence of mass vaccination, the circulation of pathogens and thereupon the force of infection will decrease. As a consequence, unless adequate vaccination coverage is achieved, the mean age of infection will increase with for some pathogens a higher risk of complications for unvaccinated individuals. Due to the decrease in the circulation of pathogens, the necessary boost in the immunity which protects the newborn through maternal antibodies may be of shorter duration.
In 1995/6 the Nationwide Institute for Public Health and the Environment (RIVM) set-up a first serum bank to evaluate the (long-term) epidemiological effects of the NIP.[1] In this study, called PIENTER 1 (P1), it was shown that the NIP induced good protection. However, for certain age groups and diseases the antibody titres were below the protective level, which is supported by the fact that several
epidemics have taken place in the past ten years (pertussis (1996, 1999, 2002, 2005), measles (1999), rubella (2004) and mumps (2007)). Furthermore, since the completion of the first serum bank, many changes in the NIP have taken place such as the introduction of new (combination) vaccines and a change in the immunization scheme. These changes will also have an effect on the immune status of the Dutch population. To gain insight into the protection level of antibodies in the Dutch population, we established a second population-based immunosurveillance study. As similar data were collected ten years ago, albeit from different individuals, we are now also able to compare the results of both studies.
Since 1952 vaccinations have been offered to the Dutch population programmatically and from 1957 the NIP has been implemented. At present the NIP provides vaccinations against twelve diseases: diphtheria, tetanus, pertussis, poliomyelitis, Haemophilus influenzae (type B), meningococcal group C disease, measles, mumps, rubella, hepatitis B, pneumococcal disease and cervical cancer. The
nationwide vaccination coverage is high and ranges between 95% and 97% depending on the different vaccine combinations.[2] However, the vaccination coverage in some municipalities is much lower, which is due to that part of the population in those municipalities refuses vaccination based on religious grounds.
From February 2006 to June 2007 the second serosurveillance study (PIENTER 2 (P2)) was carried out. A representative sample of the Dutch population, aged 0 – 79 years, was invited to participate in this cross-sectional population-based study. They were asked to complete a questionnaire and to provide a blood sample.
The main objective of this study was to determine age-specific levels of antibodies against diseases included in the NIP (and for potential candidates in NIP) for the general Dutch population and for two more specific populations namely the orthodox reformed individuals who refuse vaccination on religious grounds and non-Western migrants as their immunity might be lower compared to the general population.
provide insight into the spread of air-borne infections by estimating the number of social contacts between individuals from various age groups by means of a diary.[3] The second additional study will try to provide insight in genetic factors involved in vaccine response and the third additional study aims to estimate the seroprevalence of food-allergies and will try to assess the suggested association of vaccination with (reported) allergies. [4]
The information from the questionnaires will be used to verify whether the study population is comparable to the general Dutch population and to obtain information on incidence and risk factors related to infectious diseases. Also data from non-participants were collected, which offered us the opportunity of correcting the seroprevalence data for possible selective non-participation.
In this report a description of the set-up of the serum bank is given and information on the participants from the questionnaires is described in detail with the aim to provide a background document, which can be used for further reference to this study and for future seroprevalence studies.
2
Methods
This is a cross-sectional population-based study performed in the Netherlands.
Data were collected from the general population and from eight low vaccination coverage (LVC) municipalities. In twelve of the municipalities in the nationwide sample (NS) a number of non-Western migrants were over sampled. Individuals aged between 0 and 79 years were invited. The age strata were 0 years, 1-4 years and thereafter intervals of five years 5-9, ..., 75-79. The study also included a non response survey. The study design is described below in detail.
2.1
Sample size calculation
2.1.1
Nationwide sample
The sample size calculation for P2 was performed by examining the precision of the results of P1. In P1, 40 clusters (municipalities) were included; in each of these clusters, 380 individuals were invited (total number of invited individuals 15,200). The number of clusters was chosen such that the half-width of the confidence interval for a seroprevalence would be 2.5%, assuming an overall
seroprevalence of 50% (see Table A1.1). Table A1.1 shows the half-width decreases with an increase of the number of clusters (municipalities). Note that the half-width is less influenced by the total number of participants. An assumed seroprevalence of 50% was taken since for this value the
inaccuracy is likely to be greatest. We confirmed that the half-width for the overall seroprevalences of the diseases under study in P1 was 2.5%.[5-10] Apart from determining overall seroprevalences, the total number of participants should also be sufficient to calculate age-specific seroprevalences. For this we accepted a confidence interval with a half-width of 10-15%. In several P1 studies these criteria were met.[6,11-12] Considering the above we aimed to invite in P2 as many individuals as were included in P1.
Adjusting sample size for non-participation:
Particularly in young age groups, a sufficient number of participants are needed to obtain insight into the level and rate of decay of maternal antibodies, mean age at possible natural infection and response after vaccination in the first years of life. In P1, a response of 25% was assumed for the age strata of 0 and 1-4 years and of 50% for the age strata of 5-9, 10-14 till 75-79 years.
Results of P1 showed that the response was good (above 40%) for the age strata: 0 and 1-4 years. However, the amount of blood left over for subsequent analysis of some diseases was very low for individuals aged zero years (187 of the 663 (28%) and also somewhat lower for individuals aged 1-4 years (709 of the 832 (85%) compared to the other age strata (98-100%).[12] As the two youngest age strata are very important for this research and because less serum may be present for persons of these age strata, these age strata were sampled in the same way as in P1. The reasons for not inviting more individuals in the youngest age stratum were that with the new method for detection of antibodies (i.e. Luminex) less serum is needed for analysis. In each of the first two age strata therefore
40 individuals were sampled, while in each of the following age strata 20 individuals were sampled. It was decided to start with the same number of clusters and the same number of individuals per cluster as in P1. The number of participants needed was 6,800 (=10 persons*17 age strata*40 municipalities). This meant that in total 15,200 persons (25% response for the age strata 0 and 1-4 years and
certain age-groups was lower than expected. It was therefore decided by the project team members to enhance the number of invited individuals of certain age groups several times during the data collection (see Table A1.2). The number of invited individuals per municipality varied between
380 – 500 individuals. In total 17,341 persons were invited in the NS. The exact number of persons invited in each municipality is shown in Table A1.3.
2.1.2 Non-Western migrants
An additional sample was taken of non-Western migrants from 12 municipalities in the NS as the number of non-Western migrants in the NS would be too small to determine the seroprevalence in this group with sufficient precision. We distinguished three main groups of migrants, based on the most common countries of birth of migrants in the Netherlands and on similar conditions for infectious diseases and geographic position: 1. Morocco and Turkey, 2. Suriname, Aruba and Netherlands Antilles and 3. Other non-Western countries. Furthermore three age strata (0-9 years, 10-49 years and 50-79 years) were defined, with only for the youngest age stratum a distinction between first and second generation migrants. This resulted into 12 migrant groups
(see Table 2.1).
We aimed to estimate seroprevalences for each migrant group separately. Furthermore we aimed to compare non-Western migrants in urbanization degree 1 with non-Western migrants in urbanization degrees 2-5 (in this comparison migrant groups 1-3 were combined).
The seroprevalence in young (<10 years), first generation migrants will be used to assess the effectiveness of current catch-up program for migrants (up to 12 yrs). The seroprevalence in young (<10 years), second generation migrants will be used to assess the effectiveness of the current NIP for this groups. For the older age groups no distinction was made between first and second generation. To calculate an expected seroprevalence of 50% with a precision of 10% (one-way test) and an alpha error of 5%, 68 individuals per migrant group were needed to be included.[13] In total
68*12 = 816 individuals were needed to be included in the migrant sample.
First it was estimated how many individuals in each migrant group were expected to be included in the NS. Subsequently, an additional sample was drawn from 12 municipalities of the NS, such that the numbers of individuals as listed in Table A2.1 were invited. See section 2.2. for the details about the sampling method. Also for the migrant groups we had to increase the number of invited people during the study to ensure that we would include the minimal number of participants needed. In some of the municipalities almost all migrants living in that municipality were invited. In Table A1.3 the total number of invited migrants in each municipality is given and in Table A2.2 the number of invited individuals per migrant group is given. In total 2,574 migrants were invited.
Table 2.1 Migrant groups distinguished by country of birth, age and generation
Country of birth Generation Age group Group no.
Turkey or Morocco 1st 0 – 9 1 2nd 0 – 9 4 1st and 2nd 10 – 49 7 1st and 2nd 50 – 79 10 Suriname or Dutch Antilles or Aruba 1st 0 – 9 2 2nd 0 – 9 5 1st and 2nd 10 – 49 8 1st and 2nd 50 – 79 11 Other non-Western countries of birth 1 st 0 – 9 3 2nd 0 – 9 6 1st and 2nd 10 – 49 9 1st and 2nd 50 – 79 12
2.1.3
Low immunization coverage municipalities
Individuals were selected from eight additional municipalities with low vaccination coverage to assess the seroprevalence in three age groups (0-9, 10-49 and 50-79 years of age) in socio-geographically clustered orthodox reformed groups who refuse vaccination for religious reasons. The potential for epidemics of NIP diseases is high in this group as susceptibility levels increase as a result of low circulation of pathogens and absence of vaccine induced immunity. As a result of the
socio-geographical clustering, transmission of infectious pathogens can easily occur. Several outbreaks have occurred in these communities namely polio type 3 in 1992/1993, measles in 1999/2000, rubella in 2004 and mumps in 2007/2008.[14-17]
Non-vaccinated orthodox reformed individuals (ORIs) are of particular interest for the evaluation of the NIP. Their number would be too small to determine the seroprevalence in this group and therefore extra individuals are invited within the LVC sample (LVCS). To estimate an expected seroprevalence of 50% with a precision of 10% (one-way test) and an alpha error of 5%, 68 individuals will need to be included in each group.[13] The number of individuals to be invited per LVC municipality was based on the response rates for ORIs in P1 and were listed in Tables A3.1 and A3.2. The same enhancement of the number of invited individuals as in the NS was made in the LVCS. An additional enhancement of invited individuals in the last two municipalities (Neder-Betuwe and Korendijk) was needed to have a sufficient number of non-vaccinated ORIs. The number of invited individuals per municipality varied between 380 – 952 individuals. In Table A1.3 the exact number of invited individuals in each
municipality is given. In total 4,376 persons were invited in the LVCS.
2.2
Sampling
2.2.1
Nationwide sample
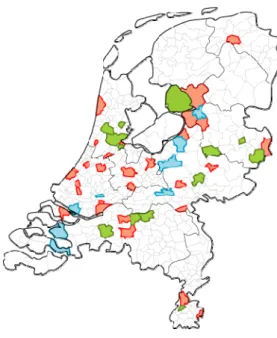
A two-stage cluster sampling technique was used to draw the NS. To ensure that all geographic regions were presented, the Netherlands was first divided into five geographical regions of approximately equal population size (see Table 2.2). Within each of the five geographic regions, eight municipalities were sampled with a probability proportional to their size. Within each of these 40 municipalities an age-stratified sample of individuals was randomly drawn from the population register of the municipality.
maximal comparability between the two studies.[1] Figure 2.1 shows the selected municipalities in the study.
Table 2.2 The Netherlands were divided into five geographic regions: provinces and the number of inhabitants per region
Region Provinces No. of inhabitants (x 1,000 1st of
January 2005)
North-East Groningen, Friesland, Drenthe,
Overijssel
2,810.9
Central Utrecht and Gelderland 3,143.3
North-West Noord-Holland and Flevoland 2,965.0 South-West Zuid-Holland and Zeeland 3,838.4
South-East Brabant and Limburg 3,548.1
The population register contained all individuals with a home or postal address. Homeless without a postal address and illegal individuals were not included in the register. The first eight municipalities from each region on the list were asked to participate. When a municipality or Public Health Service (PHS) refused or dropped out, the next municipality or PHS on the list was approached.
2.2.2
Migrants
New in the P2 study was that we aimed to determine the seroprevalence in non-Western migrants. This group has become relatively large in the Netherlands (11% of the total population in 2007, in 1996 this was 8%) and not much is known about the level of antibodies against vaccine preventable diseases in this group. Van der Wal et al. [18] showed that in 2003 the vaccination coverage for DTP-IPV for 5-12 year old first generation migrants born in Surinam, Morocco or Turkey, and living in Amsterdam, varied between 82 and 86%, which was lower than the average vaccination rate of 93%. In addition, Pauw-Plomp et al. [19] showed that in 1984 the vaccination coverage for DTP-IPV for 1-14 year olds whose mothers were born in Turkey or Morocco was respectively 41% and 43%. However, in 2003 the vaccination rates were similar for 5-12 year old children with indigenous Dutch parents and children (secondary generation) of migrants.[18] Although the data from these studies might not apply for the current situation, the level of protection against infectious diseases in the non-Western migrants may still be lower in certain age-groups than in the general Dutch population. Good surveillance of the level of antibodies against infectious diseases in these migrant groups is also relevant because certain infectious diseases are still endemic in these non-Western countries, different immunization schemes are used and frequent travelling to these countries takes place.
For the over sampling of migrants we used the distribution of migrants per urbanization degree in the Netherlands to select the municipalities in which the over sampling over migrants took place as the municipalities in the NS were not chosen based on the number of migrants but on the number of the total inhabitants in a municipality. Initially one or two municipalities in the NS were selected so that each of the five urbanization degrees was represented. As the response of migrants after the first three municipalities with an over sampling of migrants, was lower than expected we decided to invite extra individuals within the selected municipalities and also to expand the number of municipalities to invite individuals from. To decide how many individuals to invite and from which municipalities, we took into account: 1) the percentage of migrants living in the Netherlands in urbanization degree 1 versus urbanization degrees 2-5 (50%:50%); and 2) the number of individuals necessary for a reliable seroprevalence in each of the twelve migrant groups (see Table A2.2). Most of the sampling had to be done in the urbanization degrees 2-5 in order to achieve the above 50%:50%. This meant that most individuals were sampled from municipalities from urbanization degree 2 (and not from 3-5) as most migrants lived in those municipalities.
The sampling of the individuals from the population registers within each municipality was random similar to the NS. Only in Amsterdam individuals were not drawn from the whole population register but from four neighbourhoods (groups of postal codes) with the highest percentage of non-Western
migrants. In this way we expected a higher response rate than when a sample was drawn from the whole population register.
2.2.3
Low vaccination coverage sample
The municipalities in the LVCS were chosen based on a consistently low vaccination coverage (MMR and DTP-IPV; birth cohorts 1997-2001) and geographical distribution of LVC municipalities in the Netherlands (see also Figure A3.1). The vaccination coverage in these municipalities for three DTP-IPV immunizations for birth cohort 2001 varied between 68% and 83% in 2004. Subsequently within each municipality the village or town with the lowest vaccination coverage (primary series and full immunization of DTP-IPV for birth cohorts 1993-2002) was chosen from which the individuals were invited. These data were based on information from the local authorities for registration of vaccinations (PEAs). Only if insufficient individuals of a certain age (in most cases 0-1 year olds) lived in that village or town, individuals were invited from a second village or town in that particular municipality. This was the case for municipalities Tholen and Korendijk. The sampling of the individuals from the population registers of each municipality was done at random, which was similar to the NS.
Figure 2.1 Selected municipalities in the study. Red and green municipalities are included in the nationwide sample, in the green municipalities also over sampling of migrants took place. The blue municipalities are included in the LVC sample.
2.2.4
Sampling for additional objectives
The first additional study, which is part of the European modelling project Polymod, will provide insight into the spread of air-borne infections by estimating the number of social contacts between individuals by means of a diary.[3] About 1000 participants in the NS were randomly asked to
complete the diary. This one-day diary contained detailed questions on the characteristics of their social contacts (age, gender, location, duration, frequency and occurrence of physical contact).
The second sub study will provide insight in genetic factors involved in vaccine response. For this purpose an extra blood sample or buccal swab for children less than five years old was taken for DNA
The third sub study aims to estimate the seroprevalence of food allergies and to investigate the suggested association of vaccination with (reported) allergies.[4] A special question on having disorders (e.g. COPD/asthma, eczema, hay fever, food allergy (and which specific food allergy) and other allergies) and whether these disorders were diagnosed by the GP was included in the
questionnaire.
2.3
Co-operation with Public Health Services
The Public Health Services (PHSs) were essential partners in this project as they are a well known organization for the general population in their region. The data collection was carried out per PHS and covered a period of 17 months (February 2006 – June 2007). The PHSs were visited in a random order so that regions were mixed. All municipalities belonging to the same PHS were visited after each other. In November 2006 all PHSs received a letter kindly requesting their participation in the P2 project. All PHSs were willing to participate and a co-operation contract was sent. Thereafter additional
information was sent about the global planning of the blood clinics and the number of individuals to be invited in each municipality. Each PHS was contacted by telephone about nine months before the data collection in that particular municipality (or region) started. In this telephone call the following subjects were covered: background of the P2 project, activities expected of the PHS (see Appendix 4 for details about these activities), possible locations in the selected municipality (or village or city) for the clinics, contact person of the municipality, time schedule and local PR activities. After the telephone call a binder containing all the study materials of the P2 project was sent. See Appendix 5 for these study materials.
2.4
Co-operation with municipalities
After receiving the name of the contact person of a municipality from the PHS and at least 6 months before the first sampling started in the municipality a telephone call was made. In this telephone call the following subjects were covered: background P2 project, participation of municipality, time schedule of drawing sample from population register, type of sample(s) drawn (NS and/or over sampling of migrants, LVCS), and if assistance was required with drawing of sample. After the telephone call a letter explaining in detail the sample procedure and a letter with some background information on the P2 project was sent. A few weeks later the municipality was called again asking if they were willing to participate. The person from the municipality and the RIVM had direct contact on the sampling survey without mediation of the PHS. In case the RIVM was drawing the sample, the data from the municipality (e.g. PC-dump of population register) had to include an identification number (A-number) and date of birth of the participants. In case migrants had to be over sampled also country of birth of the participant and country of birth of mother and father had to be known in order to be able to draw the sample.
The sample had to be drawn approximately one month before the data collection in the municipality. After receiving the sample from the municipality, the RIVM (department EMI) was completing the sample, which took about one week, by collecting the following data of the participant: sex, date of birth, initials, use of maiden name or husband family name, whole name, family name, prefix, maiden name, prefix, street, house number, postal code (four numbers and two letters), town, country of birth, country of birth father, country of birth mother.
The sample was completed approximately two weeks before the data collection in the municipality but not much sooner because of possible changes in the accuracy of the sample through deaths or
2.5
Approach of the participants
Participants received two weeks prior to the prescheduled appointment time for blood donation an invitation package by mail including the invitation letter, a brochure containing information on the study, a questionnaire and an informed consent form. Three versions of invitation letters were available: for persons of 0-14 years, 15-18 years and 19-79 years. A full translation of the letter in Turkish was available. This translated letter together with the Dutch letter was sent to individuals born in Turkey and to Dutch children aged 0-14 years old with one of their parents born in Turkey. Part of the invitation letter was also translated in Arabian, French and English (added into one letter) and was sent together with the Dutch letter to all individuals born in a foreign country (except Turkey) and to Dutch children aged 0-14 years old with one of their parents born in a foreign country (except Turkey). On the invitation letter the initials, family name, address, town of the invited person were given. Initially no date of birth was mentioned however after some confusion with participants with identical initials and same address, the date of birth was included (best is in the letter and not in the address window). The letter contained a special P2 logo, a logo of ‘GGD Nederland’, which is the umbrella organization of all PHSs, and a logo of the RIVM. The letter was signed by the director of Centre for infectious disease control (CIb) at the RIVM. An unique individual number (U number) was assigned to every invited person, which was printed on the invitation letter. Also the date, time of the
appointment and the address of the location of the clinic was printed on the invitation letter.
In some municipalities with a large number of (invited) migrants, the mailing package also contained a flyer to clarify the contents of the letter by visualization. On this flyer three photographs were shown of: 1) taking a blood sample; 2) filling in the questionnaire; and
3) receiving the gift voucher. Also present on the flyer were the dates, time and addresses of the clinics on one side and a street map and photographs of the locations of the clinics on the other side.
The invited persons were asked to complete the questionnaire at home and to visit the special clinic to donate a blood sample. In addition, for the DNA research, individuals older than 5 years were asked to give one more extra blood sample and children less than 5 years were asked for a buccal swab. About 1000 participants of the NS were asked to fill in a diary (see Appendix 6). Participants had also been asked to bring their immunization certificates to the clinic.
With help of a planning tool in the P2 database (see Tables A7.1 and A7.2), individual appointments were proposed at times when it would suit individuals best; school-going children were invited after school hours, individuals probably having jobs were invited in the late afternoon or in the evening and older individuals (>65 years) and the youngest children (0-4 years old) had appointments in the early afternoon. Turkish and Moroccan individuals were invited at days when translators (own language and culture) were appointed. These measures were taken to enhance the response in these groups. However, after several municipalities we noticed that these efforts were not needed.
One week before the clinics in a municipality, all invited persons were approached by phone by a call centre to ask if they were willing to participate, to answer their questions, and to remind them of the study. When individuals refused to participate, they were asked to complete the questionnaire and if they also refused this, to answer some questions for the non-response survey (by telephone or by mail). When individuals were unable to come at the proposed time of appointment, they were offered an alternative: the open house clinic in the evening, the extra clinic the week after the regular hours or during the regular hours. Individuals who could not be reached by phone after three attempts were sent a written reminder card. This card was sent four of five days before the start of the first clinic in a municipality. For more information on the P2 project individuals could call the telephone number of the P2 project provided in the invitation letter and in the brochure. The telephone was staffed by a member of the P2 team at working days from 9.00 a.m. till 16.00 p.m. and half way the project from
Persons, who had not shown up at the clinic and had stated that they intended to come, were
approached again to invite them to the extra clinic one week later, which was mostly on Tuesday. Also individuals who could not be reached by phone before the regular clinics and who had not responded were approached again. Persons who refused to come to the extra clinic were asked to fill in the questionnaire and in a second instance to fill in the non-response questionnaire (by phone or mail). Individuals, who could not be reached by phone after three attempts, were sent a written reminder letter and the short non-response questionnaire.
The approach of all invited persons summarized: Days before/after clinic
• Sending mailing package -14 days • Reminder by phone (or mail) -(5-7) days
• Start of clinics 0 days
• Non-response by phone (or mail) + 1 day • Start of extra clinic +8/6 days
2.6
Clinic
The clinics were planned weekly, with the exceptions of holidays, in the period of February 2006 until June 2007. Appointments were made in general on Mondays and Wednesdays from
13.00 a.m. to 7.00 p.m. but individuals were allowed to come in until 7.30 p.m. at the open house clinic or in second instance at their own preferred time. One day in the following week an extra clinic was planned from 6.00 p.m. to 7.00 p.m. (variable time). Half way the project all clinics in a municipality were mentioned in the invitation letter so that if the appointment was not convenient, the participants could come at their own preferred time. The duration of the clinic and the number of clinics were in consultation with the municipalities.
The personal data of the invitees were downloaded to laptops. At the site wireless contact with the database at the RIVM was possible when needed. All study materials were also available at the site to change to hard copy in case of computer failure.
Participants were called in order of entry of the waiting room. Firstly, several questions were asked to verify that the participant was the invited person and did meet all inclusion criteria and the participant was asked for its informed consent. Secondly, the participant was registered in the database. An unique sample number was assigned to the participant, coupled to the U number, and scanned in the database. Subsequently a sticker with this sample number was put on all materials received from the participant. Both in the database and at the questionnaire the sample number was coupled to the U number of the participant. Thereafter, questions from the participant were answered and remarks could be made. The participant could also state whether he/she was willing to participate in the additional DNA sub study. The informed consent was checked whether this option was signed for. According to the Dutch law, both parents had to sign the informed consent in case a participant was under eighteen. Furthermore all participants over the age of twelve had to sign the informed consent. A member of the P2 project team also signed the informed consent showing the investigators were committed to perform the study according to the protocol.
The questionnaire was checked on completeness and the registered sample number was attached to the questionnaire. If necessary, missing or unclear answers were clarified, except when it concerned a question on diagnosis of sexual transmittable diseases or sexual history in order not to discomfort the participant. If the participant had been unable to fill in the questionnaire him/herself (e.g. migrants with
insufficient knowledge of the Dutch language), the questionnaire was completed in co-operation with a team member.
The vaccination certificates from the participants were photocopied and a personal sample number was attached to the copied certificate. If the participant forgot to bring the vaccination certificate(s) then he/she was asked to send a copy to the RIVM or a copy was retrieved from the PEAs.
In each of the 40 municipalities in the NS about 30 diaries were handed out during the regular clinics on Monday and Wednesday. There were three versions of the diary for: children
(0-8 years), teenagers (9-17 years) and adults (18 years and older). Six diaries were handed out in the first two age groups and 18 diaries were handed out in the adult group. The participant was asked to record the number of conversations he/she had during a certain day of the week. If the participant refused to participate, the next participant in the same age group was asked. The diary was also marked with the personal sample number.
After the intake, three tubes of 10 ml blood volume (for children between 5 and 12 years old 2-3 tubes of 10 ml blood volume and for children younger than 5 years old, 2 (maximum 4) tubes of 5 ml blood volume) were taken from each participant and marked with the personal sample numbers. If participants had agreed to participate in the additional DNA research then for children younger than 5 years a buccal swab was taken and for individuals older than 5 years an extra EDTA tube of 2.5 ml blood volume was taken, again marked with the personal sample number.
Participants were offered a gift voucher of €10 as a token of gratitude and children also received a small present. The participant signed for receipt (hard copy). At each clinic all obtained materials were registered in the computer.
The team consisted of three external medical workers and one research assistant of the RIVM. The main task of the external medical workers was drawing blood but often one of them had an administrative task and was helping the research assistant. There were two teams of three external medical workers who alternated each other every week except for the extra clinic the following week so that in general the same team was cooperating in one municipality. Depending on the number of invitees extra external personnel or personnel from the RIVM could stand in.
The materials present at the clinics are described in Appendix 8.
2.7
Location clinics
The location for the blood sampling was arranged by the RIVM in cooperation with the PHS. This could be at the PHS itself if located in the selected municipality or in any other appropriate building in that municipality. The criteria for the location are given in Appendix 9.
In general the P2 clinics were held at well known locations. For larger cities a number of clinics were planned at different locations spread throughout the cities and as close as possible to most invitees.
2.8
Questionnaires
There were two versions of the questionnaire, one for 0-14 year-olds (A) and one for 15-79 year-olds (B) with relevant questions for these age groups (see Appendix 10 and 11). As a consequence no sexual
sexual active. The questionnaire was composed to gather information on personal details, vaccinations, state of health, any diseases they have had in the past, activities possibly related to infectious diseases, sexual history and sexual related diseases (only for 15-79 year-olds) and opinion on vaccination related topics (only for 0-14 year-olds). The questionnaire was supplemented with questions requested by other RIVM researchers. The experience from the P1 study as well as the information from the pilot for the P2 questionnaire was taken into account. There were no versions of the questionnaires available in other languages.
2.9
Non-response questionnaires
Non-response questionnaires were also composed in the same two versions as the questionnaire and covered the reason for non participation, date of birth, gender, marital status (for individuals of 15 years and older), country of birth and in case the invitee was not born in the Netherlands since when inhabitant in the Netherlands, level of education (level of education of mother for children below 15 years), religion, participation in NIP, state of health and what influences their opinion on vaccination.
2.10
Vaccination certificates
The information on the certificates is important for interpreting the results of the antibodies measured in the sera. The vaccination data are also used to verify some answers in the questionnaire. A copy of the type, date and number of vaccinations received was retrieved from the PEAs for those participants who could not hand over their vaccination data. Vaccination certificates that could be retrieved were for Amsterdam for participants born in or after 1963, for the province Gelderland (prepas) for participants from birth cohort 1968 and for the other PEAs for participants from birth cohort 1970-1974.
2.11
Serum isolation and storage
The blood samples collected at the clinics were kept at room temperature. At the end of the clinics all blood and DNA samples were transported to the RIVM and stored in a refrigerator (4 °C) overnight. All materials were registered by scanning the sample number in the central P2 database.
The DNA tubes and buccal swabs were stored in a freezer at -20 °C until further processing. The tubes with blood were centrifuged for 10 minutes at 2500 rpm, 15 °C in the Hettich Rotixa/p-centrifuge. The serum was divided into portions of 5 ml serum in a bio-safety cabinet thereby keeping the samples sterile and was stored at -80 oC. Barcodes were checked throughout the aliquot procedure. After the collection of samples was finished, one tube of serum per participant was thawed and aliquoted with a robot (Tecan 150) into 10 separate Micronic blocks with different volumes and stored at -80 °C until analysis. In case the volume was lower than 5 ml not all Micronic blocks could be filled. All available volumes were recorded into the P2 database. If more than 5 ml serum was available then the second (or third) tube remained stored for future use at -80 °C.
2.12
Complaint procedure
In the information brochure (and in the invitation letter) a telephone number of the RIVM P2 project team was given. If necessary the participant could also approach the independent GP, who was not involved in the P2 project.
Complaints expressed at the clinic to the research assistant of the RIVM were passed through to the project manager. Complaints were registered at a special form and were tried to be solved at the clinic. If the complaint could not be solved at location then the project manager took further actions if necessary. The complaint procedure of the RIVM was applicable.
2.13
Public relations
The communication department of the RIVM advised the project team not to seek publicity in the national media at the start of the project in February 2006. Only a relatively small number of
individuals would be invited, therefore it was thought that the effect of national media would be minor. Two weeks before the onset of the study in a municipality, the PHS informed GPs and the local health services in that particular municipality by a standard letter for the mediators. In addition, posters in various languages were sent to the PHS by the RIVM with an accompanied letter to distribute the posters in the municipality. Also, a standard press release was available for the local press or radio. In various municipalities the P2 project was mentioned or P2 project members were interviewed in the newspaper, at the radio and/or regional television. In January 2007 the project manager was
interviewed for the national television (NOS).
2.14
Ethical issues and privacy
The study proposal was submitted to the Medical Ethical Testing Committee of the foundation of therapeutic evaluation of medicines (METC-STEG) in Almere and was approved (11th of October 2005) (clinical trial number: ISRCTN 20164309).
The P2 database was only accessible for the P2 team members. The samples drawn from the population registers and other documents containing participant data (call centre and printing office at RIVM) were saved at the server, which was only accessible for the members of the P2 team. Personal data received by email or by CD were destroyed after the data were saved at the server. The preparations for the mailing took place by a small team at the printing office at the RIVM. The telephone calls were made at the call centre and the files containing personal data were deleted after use.
All personal data had to be anonymous six months after the last clinic in a municipality. However, in some municipalities this period had to be extended because some municipalities were re-visited or information about the participants was needed to request vaccination certificates from the PEAs. The informed consents have been kept in a lockable fire-resistant safe during data collection and were thereafter archived within the RIVM for the period of minimal 15 years.
2.15
Data-entry
Questionnaires were entered via the website (https://webcollect.rivm.nl/PienterProject) in the data-entry database by an employee of an external company. All data were checked (100% control) by a second employee of the same company.
U number at the backside of the questionnaire was the same as was displayed in the data-entry database. If a questionnaire did not contain a sample number the questionnaire was entered via the U number.
Answers at supplement question(s) were entered in the database also in case the main question was not answered. After having entered a certain answer at a question in the database, the program turned automatically to the next question. Intermediate question(s) were therefore not entered in the database. The number zero was only entered if it was relevant like for example with age. If two answers were given but only one answer was allowed to, then the upper or first answer was taken, except for education where the highest education was taken. In case the years of birth of housemates were given, the age was calculated by subtracting the year of filling in the questionnaire from the year of birth. Regarding open questions, the answers were entered into the database as concise as possible. The vaccination certificates were entered in the P2 database by several P2 team members and all vaccinations were checked once by the same P2 team members. All vaccinations given were recorded in de database by month and year. In the Statistical Package SAS (9.1.3 for Windows) the day of the vaccination date was automatically set at 15. When only the year of the vaccination date was available the month was set at December.
2.16
Data validation
A comparison of the variables date of birth and gender provided in the questionnaires and in the file of the population registers was done to select possible non-invited persons who did fill in the
questionnaire and possibly donated blood (e.g. instead of a family member). When a discrepancy was found between the variables then the date of birth in the population register was considered the right one (the same was true for gender). Obtained DNA samples were removed if no consent was given at the intake form. The non-response questionnaires were removed if an invited person also had filled in the long questionnaire and if the person participated in the study. In case a person did not participate, the non-response questionnaire was kept for the extra information why the person did not want to take part in the study. In the latter case the questionnaire was leading.
Answers to questions that were not plausible (e.g. a man who is pregnant) or inconsistent (answering 14b but not 14a), wrong referenced answers (filling in a question when one should have skipped it on the basis of the answer on the previous question), or ‘missed’ answers (e.g. filling in eating daily raw meat but not have filled in eating raw meat at all) were checked in the questionnaire and corrected if possible. All adjustments were logged and signed according to GCP.
2.17
Data-analysis
Data will be analyzed in SAS. Procedure Surveyfreq will be used for calculating seroprevalences and procedure Surveymeans will be used for calculating geometric mean titres (GMTs).
2.17.1
Nationwide sample and migrants
Overall and age-specific seroprevalences and geometric mean titres will be determined for the general Dutch population for various diseases. The migrants who participated in the over sampling will be included in the analysis of the NS to increase the power, but their will be adjustment for their over representation. In case the number of participants is large enough, the seroprevalence will also be calculated by age, especially for the youngest age-strata. GMTs will be calculated taking both the positive and negative samples into account. The seroprevalence and GMT will also be determined for
each migrant group and for migrant groups in urbanization degree 1 versus migrant groups in urbanization degrees 2-5.
For the analysis of seroprevalences, GMTs and questionnaire data, the data will be weighted by age, gender, ethnicity and urbanization degree to match the true population distribution in the Dutch population at 1st of January 2007. The variables age, ethnicity and urbanization degree were re-categorized to have weight factors between 0.25 and 4. Urbanization degree was now divided into two classes namely urbanization degree 1 and urbanization degrees 2 to 5. New age groups were made for the different countries of birth. For the Dutch inhabitants the following five age groups were defined: 0-9, 10-19, 20-39, 40-59 and 60-79 years. For the other Western migrants two age-groups were defined: 0-49 and 50-79 years. For each of the three non-Western migrant groups (Morocco and Turkey, Suriname and Aruba and Netherlands Antilles, other non-Western countries) the following three age groups were distinguished: 0-4, 5-49 and 50-79 years. No distinction could be made between first and second generation individuals due to too low numbers. We also adjusted for the two-stage cluster sampling by taking into account the strata (regions) and clusters (municipalities).
2.17.2
Low vaccination coverage sample
Overall and age-specific seroprevalences and GMTs will also be determined for the LVCS and for the ORIs who refuse vaccination based on religious grounds. To be able to compare the seroprevalences, GMTs and questionnaire data in the LVCS with those in the NS, the data will be weighted by age and gender according to the Dutch population (1st of January 2007). To have weight factors between 0.25 and 4, the variable age had to be re-categorized into fifteen instead of seventeen age strata by combining the age strata 0 and 1-4 years and the age strata 40-44 and 45-49 years. We also adjusted for the one stage cluster sampling by taking into account the clusters (municipalities).
2.18
Classifications of net monthly income, religion and education
In this study persons with a net monthly income (NMI) per household less than € 1,150, between € 1,151 and € 3,050, or more than € 3,050 were classified as persons with respectively a low, middle and a high NMI, according to Statistics Netherlands (CBS).
Furthermore ORIs are defined in this study as persons with one of the following specific Protestant Christian (PC) beliefs: Reformed bond within PKN, Reaffirmed reformed church, Reformed
congregations, Reformed congregations in the Netherlands or Old reformed congregations. Within the group ORIs we distinguished Reformed Bond (RB) (Reformed bond within PKN and Reaffirmed reformed church) and Reformed Congregation (RC) (Reformed congregations, Reformed congregations in the Netherlands or Old reformed congregations).
Educational degree was classified as low (no education or primary education), middle (junior technical school, lower general or intermediate vocational secondary education) or high (higher vocational or higher general secondary education, pre-university or university education), according to CBS.
3
Results
In this report the weighted distribution of answer categories is shown for participants (i.e. persons with blood and a questionnaire) in the P2-project in the NS (including the over sampling of migrants) and in the LVCS.
3.1
Response in the P2-project
All municipalities, except one, and their PHS were willing to participate in the P2 project. Only the municipality ‘Mook and Middelaar’ did not want to participate. Therefore the next municipality on the list in that region, Heusden, was asked (and willing) to participate.
In total 24,291 persons were invited to participate. With 107 persons no contact could be made, mostly due to relocations and a in a few cases the person had died. Furthermore 37 persons were excluded because they were mentally disabled and therefore not eligible to participate in the study (exclusion criterion). In a few cases we were not convinced that the participated person was the invited person so we had to remove these materials. The following materials were removed:
6 times blood and a questionnaire, 6 times only blood, 26 times a questionnaire and 18 times a non-response questionnaire. In total 24,147 persons were taken into account in the calculation of the response rate. A responder was defined as a person who had visited the clinic for blood sampling irrespective blood sampling succeeded. The overall response was 33.5% (N = 8,089). Table 3.1 shows the number of materials collected.
Table 3.1 Materials obtained and response in the PIENTER2-project
NS LVCS
N (%) N (%)
Total invited 19,781 4,366
Total materials present of persons who visited the clinic:
Blood and questionnaire 6,348 (32.1%) 1,517 (34.7%)
Blood no info questionnaire 38 (0.2%) 1 (0.02%)
DNA* 6,207 (31.4%) 1,469 (33.6%)
Questionnaire (visited consult) 135 (0.7%) 43 (1.0%)
Diary* 824 (4.2%) NA
Vaccination booklet* 4,583 (23.2%) 932 (21.3%)
Only information from
population register 7 (0.04%)
Materials obtained otherwise:
Questionnaire 1,200 (6.1%) 354 (8.1%)
Short questionnaire 1,652 (8.4%) 450 (10.3%)
Information population register 10,401 (52.6%) 2,001 (45.8%)

![maximal comparability between the two studies.[1] Figure 2.1 shows the selected municipalities in the study](https://thumb-eu.123doks.com/thumbv2/5doknet/3090748.9715/23.892.142.810.262.406/maximal-comparability-studies-figure-shows-selected-municipalities-study.webp)