LETTER REPORT
EXPERIMENTAL FUMIGATION OF TWO OCEAN SHIPPING CONTAINERS WITH METHYL BROMIDE IN MONTFOORT, THE NETHERLANDS
On behalf of Mr W. Veldman, VROM Inspectorate regio Zuid-West
CC
Author(s) Ms T. Knol
Status of report Definitive
Date June 2007 (English publication)
Report number 609021049
RIVM number
This report comprises 3 pages (including this page )
This study was conducted in 2000 on behalf of the former Environmental Inspectorate (Inspectie
T
ABLE OF CONTENTS
1. INTRODUCTION... 3
2. AIM... 3
3. EXPERIMENTAL DESIGN... 3
3.1 DETERMINING THE AIR CHANGE RATE... 3
3.2 DETERMINING THE METHYL BROMIDE CONCENTRATION... 3
4. IMPLEMENTATION OF THE RESEARCH ... 3
4.1 EXPERIMENTAL SETUP... 3
4.2 DETERMINING THE AIR CHANGE RATE... 3
4.3 DETERMINING THE METHYL BROMIDE CONCENTRATION IN THE CONTAINER... 3
4.3.1 Sampling ... 3
4.3.2 Analysis ... 3
5 RESULTS... 3
5.1 AIR CHANGE RATE... 3
5.2 METHYL BROMIDE CONCENTRATIONS... 3
6 DISCUSSION ... 3
1.
INTRODUCTION
On behalf of the IMH (Environmental Inspectorate), the Kennis en Adviescentrum Dierplagen
Wateringen (KAD - Expertise and Advisory Centre for Pest Control) conducted research into
the leak tightness of containers during fumigation with methyl bromide. For the purposes of this study, two containers were placed in a warehouse and fumigated with methyl bromide, where a dosage of 45 g/m3 was applied. By taking measurements of the methyl bromide concentration in the air inside the containers during the fumigation period, it could be ascertained to what extent the containers were leak tight. Because the KAD did not have access to the necessary apparatus for the measurements, the sampling was conducted by the RIVM-IEM on behalf of the IMH.
2.
AIM
To determine the leak tightness of two containers during fumigation with methyl bromide.
3.
EXPERIMENTAL DESIGN
The leak tightness of the containers was ascertained by: - determining the air change rate of each container
- determining the methyl bromide concentration in each container at various points in time during the entire 24-hour fumigation period.
3.1 DETERMINING THE AIR CHANGE RATE
To determine the air change rate, sulphur hexafluoride was injected into the container as a tracer gas. The decline in concentration of this gas over time was then monitored and registered using a Miran 1B2 infrared air analyzer. During the measurements, the container remained completely closed. Finally, based on the decline of the sulphur hexafluoride concentration, the natural ventilation rate of the container was calculated.
3.2 DETERMINING THE METHYL BROMIDE CONCENTRATION
To determine the methyl bromide concentration, active charcoal tubes were used which are specifically suitable for sampling methyl bromide: SKC Petroleum Charcoal tubes part A & B. A pump was used to draw air out of the container through the active charcoal tubes; during this process methyl bromide adsorbs onto the active charcoal.
After sampling, the tubes were stored at –10°C and analyzed for methyl bromide as quickly as possible using fluid desorption followed by GC/ECD analysis.
4.
IMPLEMENTATION OF THE RESEARCH
4.1 EXPERIMENTAL SETUP
Figure 1 shows how the containers were placed in the warehouse of a fruit grower in Montfoort, the Netherlands.
Figure 1: Setup of the containers
4.2 DETERMINING THE AIR CHANGE RATE
On 11 July 2000, air change rate measurements were conducted on Container 1. Inside the container, the Miran 1B2 infrared air analyzer and a data logger were installed. Sulphur hexafluoride was then released into the container until a concentration of approximately 3 ppm was reached. The doors of the container were closed and a waiting period began until the sulphur hexafluoride concentration had declined, so the air change rate could be calculated. On 19 and 20 July 2000, the air change rate of Container 2 was determined in a comparable fashion to that described above. However, after 24 hours it turned out there was virtually no decline in the concentration of the tracer gas. After more than 24 hours of monitoring, the measurements were stopped.
4.3 DETERMINING THE METHYL BROMIDE CONCENTRATION IN THE CONTAINER
4.3.1 Sampling
Two measurement points were installed in each container: one measurement point at about 50 cm from the ceiling of the container (code B), and one measurement point at about 50 cm from the floor of the container (code O). From these points, Teflon tubes with an internal diameter of 4.25 mm were led outside through the rubber seals between the container and container door. The Teflon tubes were a maximum of 10 m long, and were closed when they were not in use. Immediately before each sampling, air was drawn through the tube for 3 minutes at a flow rate of approximately 50 ml/min in order to remove the volume of dead air from tube.
10.2 m 12.2 m 5.4 m 6.8 m Container 1 Container 2 Measurement point 2B Measurement point 2O Measurement point 1B Measurement point 1O 6.05 m
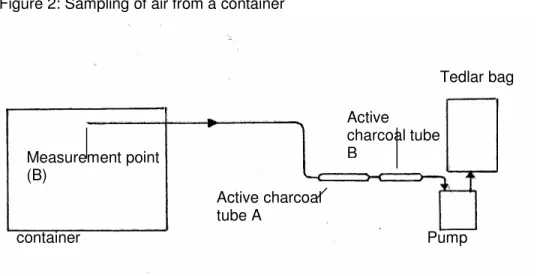
After this, a set of active charcoal tubes was attached to the air pump and air from the container was drawn through the set of tubes for a specified length of time. Both the volume of dead air and the air that was drawn through the active charcoal tubes were collected in a Tedlar bag. Figure 2 is schematic diagram of the sampling setup
Figure 2: Sampling of air from a container
After the charcoal tubes were charged, they were closed, along with the Teflon tube, and the charcoal tubes were stored at –10°C.
Table 1 lists the times after fumigation when the air in the containers was sampled, the sampled volume and the sample code.
Table 1: Sampling data
Container Sample code
(per set A/B) Time after start of fumigation (h) Sample volume (ml) 1B IEM2007-C1B-1(A/B) 1 106 1B IEM2007-C1B-2 2 106 1B IEM2007-C1B-3 3 106 1B IEM2007-C1B-6 6 106 1B IEM2007-C1B-12 12 265 1B IEM2107-C1B-24 24 530 1O IEM2007-C1O-1 1 106 1O IEM2007-C1O-2 2 106 1O IEM2007-C1O-3 3 106 1O IEM2007-C1O-6 6 106 1O IEM2007-C1O-12 12 265 1O IEM2107-C1O-24 24 530 4.3.2 Analysis
On 21 July 2000, the sets of charcoal tubes were shipped under refrigeration to the Deltalab Laboratory in Portugal, where they were analyzed for methyl bromide by means of fluid desorption and GC-ECD (gas chromatography with electron capture detector).
container Measurement point (B) Active charcoal tube A Active charcoal tube B Pump Tedlar bag
5
RESULTS
5.1 AIR CHANGE RATE
For Container 1, an air change rate of 0.389 h-1 was determined. This means that every hour, 0.389 (or 38.9%) of the air in the container was changed, or in approximately 2.5 hours, the air in the container was completely refreshed. For Container 2, the air change rate calculated during 24 hours approached zero. This means that in Container 2, there was virtually no natural ventilation.
5.2 METHYL BROMIDE CONCENTRATIONS
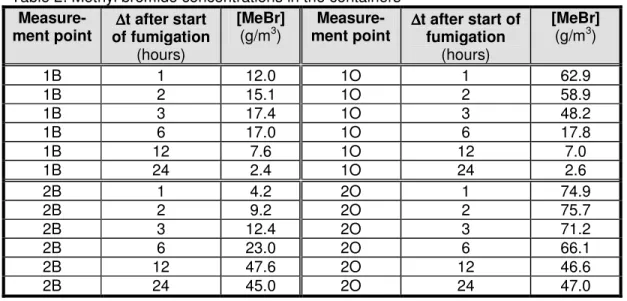
Table 2 contains the results of the methyl bromide measurements, calculated according to the concentration of methyl bromide in the container air in g/m3.
Table 2: Methyl bromide concentrations in the containers
Measure-ment point of fumigation ∆∆∆∆t after start (hours)
[MeBr]
(g/m3) ment point Measure- ∆∆∆∆t after start of fumigation (hours) [MeBr] (g/m3) 1B 1 12.0 1O 1 62.9 1B 2 15.1 1O 2 58.9 1B 3 17.4 1O 3 48.2 1B 6 17.0 1O 6 17.8 1B 12 7.6 1O 12 7.0 1B 24 2.4 1O 24 2.6 2B 1 4.2 2O 1 74.9 2B 2 9.2 2O 2 75.7 2B 3 12.4 2O 3 71.2 2B 6 23.0 2O 6 66.1 2B 12 47.6 2O 12 46.6 2B 24 45.0 2O 24 47.0
6
DISCUSSION
According to the determination of the air change rate for the two containers, the natural ventilation rate of Container 1 differs greatly from that of Container 2.
The results of the methyl bromide concentration measurements in the two containers have shown the following:
- The injected methyl bromide gas becomes completely mixed with the air in the container only several hours after the start of fumigation; this is shown by the gas concentrations at the upper and lower measurement points in the container, which did not reach the same level until 6 hours (Container 1) and 12 hours (Container 2) after the start of fumigation. - The length of time required for complete mixing of the methyl bromide gas with the air
inside the container appears to be dependent on the air change rate, among other things, of the corresponding container: the lower the air change rate, the longer it takes to achieve a homogeneous mixture.
- A significant quantity of methyl bromide appeared to disappear from Container 1. After 24 hours, only about 5% of the original dosage of methyl bromide remained. This loss could be the result of leakage from the container or adsorption of methyl bromide onto the wooden floor of this container or the rubber seals of the container doors. In view of the air change rate of this container, leakage to the outside air certainly appeared to play a role in the loss of methyl bromide from this container.
- Container 2 appeared to retain the original dosage of methyl bromide: after 24 hours, the initial dosage concentration could still be measured at both the upper and lower measuring points inside the container. No leakage or adsorption of methyl bromide appeared to occur. The low air change rate of this container had already led to the expectation that leakage to the outside air would not play a major role in a possible decline of the methyl bromide concentration in the container.
7
CONCLUSIONS
Containers that are visually identical can differ greatly in their ventilation behaviour, which can affect the degree of leakage during a methyl bromide fumigation.
The air change rate of a container appears to affect the time that is required for homogeneous mixing of methyl bromide gas with the air inside the container.
The mixing of methyl bromide gas with the air inside the container requires several hours. During this period there are local deviations in the concentrations of methyl bromide, some of them far above or below the prescribed dosage, which could influence the effectiveness of the fumigation.