RIVM
National Institute fot Public Health and the Environment Centre for
Nutrition and Food PO Box 1 3720 BA Bilthoven The Netherlands www.rivm.nl R isk a sse ssm en t o f t h e d ie ta ry e xp os u re to co n ta m in an ts an d p es tic id e r es id u es in y ou n g c h ild re n in th e N et h er la n ds Report 350070002/2009
P.E. Boon | M.I. Bakker | J.D. van Klaveren | C.T.M. van Rossum
Risk assessment of the dietary exposure
to contaminants and pesticide residues
in young children in the Netherlands
RIVM report 350070002/2009
Risk assessment of the dietary exposure to contaminants
and pesticide residues in young children in the
Netherlands
P.E. Boon* M.I. Bakker J.D. van Klaveren* C.T.M. van Rossum Contact: P.E. Boon VCP@rivm.nlWith contributions of: A.J. Baars J-D. te Biesebeek B.G.H. Bokkers M. van de Bovenkamp A. de Mul* M.C. Ocké E.H.M. Temme* G. Wolterink
* RIKILT-Institute of Food Safety, Wageningen University and Research Centre
This investigation has been performed by order and for the account of the Ministry of Health, Welfare and Sport, within the framework of projecr 5.4.10 ‘Food consumption survey - Young Children’ and for the account of the Ministry of Agriculture, Nature and Food Quality within the framework of the Statutory Research Task (WOT) Theme 1 Contaminants (RIKILT), project ‘Intake calculations and modelling’
© RIVM 2009
Parts of this publication may be reproduced, provided acknowledgement is given to the 'National Institute for Public Health and the Environment', along with the title and year of publication.
Abstract
Risk assessment of the dietary exposure to contaminants and pesticide residues in young children in the Netherlands
The diet of children aged 2 to 6 years in the Netherlands is safe regarding the exposure to fumonisin B1,
deoxynivalenol, patulin (toxic compounds produced by fungi), nitrate and organophosphorus pesticides. For dioxins, that are mainly present in animal fats, there is a limited probability that an adverse health effect will occur.For acrylamide, that is present in baked and fried foods, there is also a probability of an adverse health effect occurring in young children. However, the extent to which this could happen is as yet unclear. For aflatoxin B1 and ochratoxin A (both also toxic compounds produced
by fungi) it was not feasible to determine whether or not adverse health effects occur in this age group. These are the results of a study performed by the National Institute for Public Health and the
Environment (RIVM) and the RIKILT-Institute of Food Safety. For acrylamide, aflatoxin B1, dioxins
and ochratoxin A, more research is needed to refine the risk assessment. The most important requirements for this purpose are the generation of representative concentration data for aflatoxin B1
and ochratoxin A in food and a better understanding of the toxicological effect of acrylamide.
The aim of the study described in this report was to assess the dietary exposure and the related possible health risk, to a selected group of compounds in young children in the Netherlands. For this purpose, food consumption data from the Dutch National Food Consumption Survey 2005/2006-Young children were linked to data on the concentration of these compounds in foods. The health risk of children was subsequently assessed with the help of the available literature regarding the toxicology of these compounds.
Rapport in het kort
Risicobeoordeling van de blootstelling van jonge kinderen in Nederland aan contaminanten en residuen van bestrijdingsmiddelen via de voeding
De voeding van peuters en kleuters in Nederland is veilig voor wat betreft de blootstelling aan fumonisine B1, deoxynivalenol, patuline (gifstoffen veroorzaakt door schimmelgroei), nitraat en
organofosfor-bestrijdingsmiddelen. Voor dioxines (vooral aanwezig in dierlijke vetten) bestaat er een beperkte kans dat er een negatief gezondheidseffect optreedt. Ook voor acrylamide (aanwezig in gebakken en gefrituurde producten) is er een kans dat een negatief gezondheidseffect optreedt in peuters en kleuters. Echter de grootte van deze kans kan niet worden geschat. Voor aflatoxine B1 en
ochratoxine A (beide ook gifstoffen veroorzaakt door schimmelgroei) kon niet worden beoordeeld of de voeding veilig is voor peuters en kleuters.
Dit blijkt uit onderzoek van het Rijksinstituut voor Volksgezondheid en Milieu (RIVM) en het
RIKILT-Instituut voor Voedselveiligheid. Voor acrylamide, aflatoxine B1, dioxines en ochratoxine A is
aanvullend onderzoek nodig om de risicobeoordeling te verfijnen. De meest belangrijke elementen hiervoor zijn het genereren van 1) representatieve concentratiedata van aflatoxine B1 and ochratoxine A
in de voeding, en 2) kennis over het schadelijke effect van acrylamide.
Het doel van dit rapport was om de inname van een groep stoffen, en het mogelijk daarmee samenhangende gezondheidsrisico, te berekenen in peuters en kleuters in Nederland. Hiervoor zijn consumptiegegevens van de Voedselconsumptiepeiling onder peuters en kleuters gecombineerd met monitoringgegevens van concentraties van de onderzochte stoffen in producten. Met behulp van de aanwezige literatuur op toxicologiegebied is vervolgens het gezondheidsrisico voor de kinderen geschat.
Trefwoorden: jonge kinderen, blootstelling via de voeding, chemische stoffen, risicobeoordeling, probabilistisch modelleren
Contents
Summary 9
Glossary 11
1 Introduction 13
1.1 Vulnerability of children 13
1.2 Available exposure assessments in children in the Netherlands 13
1.3 Aim of this study 13
1.4 Outline of the report 14
2 Methods 15
2.1 DNFCS-Young Children 2005/2006 15
2.2 Study population 15
2.3 Method of dietary assessment 17
2.4 Concentration data 18
2.5 Link between food consumption data and concentration data 21
2.6 Dietary exposure calculations 22
2.7 Risk assessment 25
2.7.1 Decision tree of VWA panel 25
2.7.2 Risk assessment of chemicals addressed 26
3 Dietary exposure and risk assessment of acrylamide 31
3.1 Introduction 31
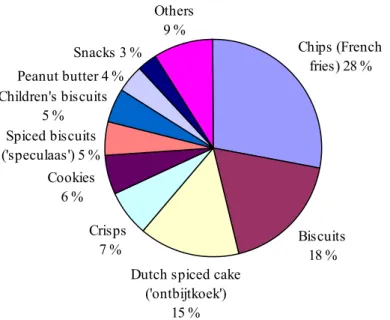
3.2 Exposure assessment 31
3.3 Risk assessment 33
3.3.1 Toxicology 33
3.3.2 Overall risk assessment 35
3.4 Conclusion and recommendations 36
4 Dietary exposure and risk assessment of dioxins 39
4.1 Introduction 39
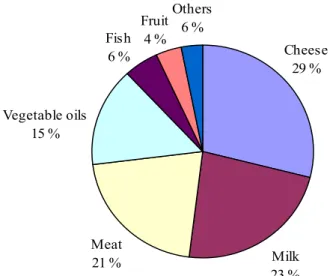
4.2 Exposure assessment 39
4.3 Risk assessment 41
4.3.1 Toxicology 41
4.3.2 Overall risk assessment 43
4.4 Conclusion and recommendations 44
5 Dietary exposure and risk assessment of selected mycotoxins 45
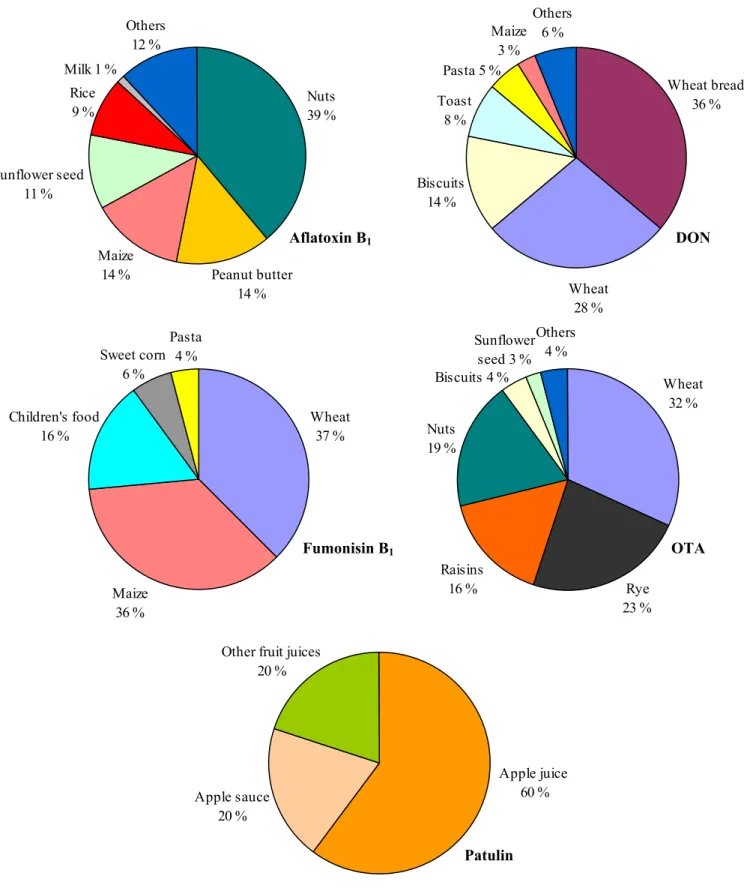
5.1 Introduction 45 5.2 Exposure assessment 46 5.2.1 Aflatoxin B1 46 5.2.2 Deoxynivalenol (DON) 49 5.2.3 Fumonisin B1 50 5.2.4 Ochratoxin A (OTA) 50 5.2.5 Patulin 51
5.2.6 Discussion exposure assessment 51
5.3 Risk assessment 54
5.3.1 Aflatoxin B1 54
5.3.3 Fumonisin B1 59
5.3.4 Ochratoxin A (OTA) 60
5.3.5 Patulin 62
5.4 Conclusion and recommendations 62
6 Dietary exposure and risk assessment of nitrate 65
6.1 Introduction 65
6.2 Exposure assessment 65
6.3 Risk assessment 68
6.3.1 Toxicology 68
6.3.2 Overall risk assessment 69
6.4 Conclusion 70
7 Dietary cumulative exposure and risk assessment of organophosphorus pesticides 73
7.1 Introduction 73
7.2 Exposure assessment 73
7.3 Risk assessment 80
7.3.1 Toxicology 80
7.3.2 Overall risk assessment 82
7.4 Conclusion and recommendations 82
8 Discussion and conclusions 83
8.1 Main findings 83
8.2 Methodological issues related to the exposure assessment 83
8.3 Risk assessment 89
8.4 Recommendations 91
8.4.1 Recommendations per compound 92
8.4.2 General recommendations 92
References 95
Acknowledgement 111
Appendix A List of concentrations used in the dietary exposure assessments (samples with
concentration below LOR were assigned ½LOR) 113
Appendix B WHO toxic equivalence factors as used in the dietary exposure assessment of
dioxins 125
Appendix C Relative potency factors for the pesticides for which concentrations above LOR
were reported in Dutch monitoring programmes of 2005-2006 126 Appendix D Details on linkage of analysed foods, food groups or raw agricultural
commodities to foods entered in DNFCS Young Children 2005/2006 128 Appendix E Long-term dietary exposure assigning either zero, ½LOR or LOR to samples
with a concentration below LOR 139 Appendix F Modelling of processing 142 Appendix G Variability between individual units within composite samples as applied in the
cumulative exposure to OPs 146 Appendix H 95 % confidence intervals (in brackets) around the best estimates of dietary
exposure (samples with a concentration below LOR were assigned ½LOR) 148 Appendix I Deviations from the decision tree of the panel ‘Children and chemical substances’
of the Dutch Food and Consumer Product Safety Authority 151 Appendix J Effect of grouping analysed biscuits and cookies on the dietary exposure to
acrylamide 152
Appendix K Toxicological profile of acrylamide 153 Appendix L Toxicological profile of dioxins 156 Appendix M Toxicological profile of selected mycotoxins 161 Appendix N Toxicological profile of nitrate, nitrite and n-nitrosodimethylamine 179 Appendix O Toxicological profile of acephate 187
Summary
Prevention of negative health effects due to pesticide residues and contaminants in food is an important world-wide issue. It has been recognized that especially children may be a potentially vulnerable subgroup in this respect due to their higher consumption levels per kg body weight and differences in physiology compared to adults.
The aim of the study described here is to assess the dietary exposure and the related possible health risk to a selected number of compounds. For this recent food consumption data of the Dutch National Food Consumption Survey-Young Children 2005/2006 were linked to recent monitoring concentration data. To assess both acute and chronic dietary exposure, the data were combined using advanced statistical models. The acute dietary exposure was calculated for the group of organophosphorus pesticides, and the chronic dietary exposure for acrylamide, dioxins (including dioxin-like PCBs), a number of mycotoxins (aflatoxin B1, deoxynivalenol, fumonisin B1, ochratoxin A and patulin) and nitrate.
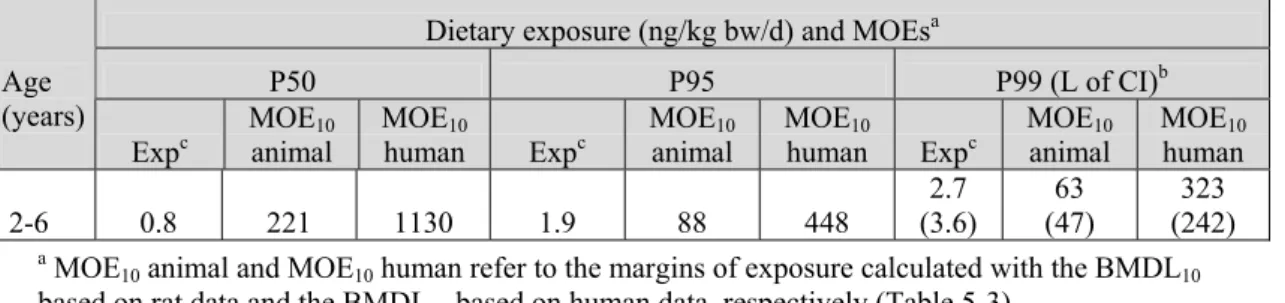
For the risk assessment the 99th percentile of exposure was compared to the health based limit value for chronic toxicity for all chemicals, except organophosphorus pesticides. For this group of pesticides, the 99.9th percentile of exposure was compared to the health based limit value for acute toxicity. If the level of exposure exceeded the health based limit value, the percentage of children exceeding this limit was estimated. For acrylamide and aflatoxin B1, possible carcinogenic compounds with a genotoxic
mechanism, a margin of exposure was derived. When the exposure exceeded the health based limit value or resulted in a relatively low margin of exposure, the available toxicity database was further reviewed with special attention to children to re-assess the risk.
The results showed that according to the present findings the diet of young children in the Netherlands is safe regarding the exposure to fumonisin B1, deoxynivalenol, patulin, nitrate and organophosphorus
pesticides present in food. For dioxins, there is a limited probability that an adverse health effect will occur. For acrylamide there is also a probability of an adverse health effect occurring in young children, although the extent to which this could happen is as yet unclear. This is due to inconsistent results from epidemiology studies concerning the carcinogenicity of this compound. For aflatoxin B1
and ochratoxin A, it was not feasible to determine whether or not an adverse health effect will occur, due to the use of (partly) targeted concentration data for these compounds.
For acrylamide, aflatoxin B1, dioxins and ochratoxin A, more research is needed to refine the risk
assessment. The most important requirements for this purpose are the generation of representative concentration data for aflatoxin B1 and ochratoxin A and a better understanding of the toxicological
Glossary
AChE acetylcholinesterase ADI acceptable daily intake ARfD acute reference dose
BBN beta-binomial-normal
BMD benchmark dose
BMDL 95 % lower confidence limit of the benchmark dose
bw body weight
CIAA Confederation of the Food and Drink Industries of the EU
CMG common mechanism group
CONTAM EFSA panel on contaminants in the food chain dioxins PCDDs, PCDFs, mo-PCBs and no-PCBs DNFCS Dutch National Food Consumption Survey
DNFCS-3 Dutch National Food Consumption Survey 1997/1998 DON deoxynivalenol
EC European Commission EFSA European Food Safety Authority EWRS Early Warning & Response System
GfK Market Research Agency (Growth for Knowledge) HBLV health based limit value
IARC International Agency for Research on Cancer
JECFA Joint FAO/WHO Expert Committee on Food Additives JMPR Joint FAO/WHO Meeting on Pesticide Residues KAP database Dutch Quality Agricultural Products database LOAEL lowest observed adverse effect level
LOR limit of reporting
MCRA Monte Carlo Risk Assessment programme MOE margin of exposure
mo-PCBs mono-ortho polychlorinated biphenyls NDMA N-nitrosodimethylamine NOAEL no observed adverse effect level
no-PCBs non-ortho polychlorinated biphenyls, the so-called ‘dioxin-like PCBs’ OPs organophosphorus pesticides
OTA ochratoxin A
PBTK model physiologically-based toxicokinetic model PCDDs polychlorinated dibenzo-p-dioxins PCDFs polychlorinated dibenzofurans
PPR EFSA panel on plant protection products and their residues PMTDI provisional maximum tolerable daily intake
PTDI provisional tolerable daily intake PTMI provisional tolerable monthly intake PTWI provisional tolerable weekly intake RAC raw agricultural commodity
RIKILT RIKILT-Institute of Food Safety, Wageningen UR RIVM National Institute for Public Health and the Environment RPF relative potency factor
SCF Scientific Committee on Food
TDI tolerable daily intake TEF toxic equivalency factor TEQ toxic equivalent
VSD virtual safe dose
1
Introduction
1.1
Vulnerability of children
Prevention of health risks due to the presence of chemicals in food is an important world-wide issue, given, for example, the presence of both international and national food safety authorities, such as the European Food Safety Authority (EFSA). It has been recognized that children may be a potentially vulnerable subgroup in this respect. Children consume more food and water compared to adults when expressed per kg body weight (bw) (National Research Council, 1993; Health Council of the
Netherlands, 2004; SCF, 1998), resulting in relatively higher exposures to compounds. Also specific dietary patterns of children may contribute to a higher exposure to contaminants present in food. Apart from having a higher exposure per kg bw, children have a different physiology from that of adults. This has been thoroughly described in a recent report published by the Dutch Food and
Consumer Product Safety Authority (VWA) (VWA, 2008). In this report, the development of children in relation to possible toxic effects of food contaminants is discussed. It is concluded that children are more sensitive and vulnerable for many compounds, while for some compounds there is no difference between the sensitivity of children and adults. Especially young children under the age of 1 may be more vulnerable, since their enzymatic activity and therefore their ability to break down chemical compounds is low compared to adults. They may therefore be longer exposed to compounds than adults (VWA, 2008). Due to significant postnatal development of different organ systems during childhood children may be more sensitive to neurotoxic, endocrine and immunological toxic effects up to 4 years of age. This is also true for children aged 5 to 12 years, however to a lesser extent for immunological toxic effects (VWA, 2008). Due to these differences between adults and children regarding exposure and physiology, it is important to address children as a separate subgroup in risk assessments.
1.2
Available exposure assessments in children in the Netherlands
In the past numerous exposure assessments have been performed in Dutch children covering a large variety of chemicals present in food, including acrylamide (Boon et al., 2005; Konings et al., 2003), dioxins (Baars et al., 2004), pesticides (Boon et al., 2004; Boon et al., 2008), brominated flame retardants (Bakker et al., 2008), mycotoxins (Bakker and Pieters, 2002; Pieters et al., 2004), aspartame (RIVM-RIKILT Front Office, 2006) and nitrate (Westenbrink et al., 2005). All these studies show a higher exposure per kg bw in children than in adults.
In the studies mentioned above food consumption data of the Dutch National Food Consumption Survey 1997/1998 (DNFCS-3) were used. Due to changes in dietary habits and introduction of new foods, as well as changes in concentration levels, it is important to continue monitoring the exposure to compounds present in food by young children.
1.3
Aim of this study
Recently, in 2005/2006, a food consumption survey was conducted in the Netherlands among children aged 2 to 6 years, the so-called Dutch National Food Consumption Survey-Young Children 2005/2006 (Ocké et al., 2008). The aim of the study described here is to assess the exposure and the related possible health risk (i.e., probability that an adverse health effect occurs) to a selected number of
compounds using the food consumption data of this study in children and the most recent concentration data available from Dutch monitoring programmes.
The results presented in this report should be seen as a first step in the identification of a possible health risk in young Dutch children related to the compounds studied. If we conclude, based on the results, that there is a possible health risk (or a health risk cannot be determined) recommendations will be given on how to refine the risk assessment of the relevant compounds aiming at a better
identification of the possible health risk involved. It is beyond the scope of this report to formulate policy recommendations regarding measures aiming at a reduction in exposure.
The compounds addressed in this report were selected by an expert group based on previous estimates indicating that these compounds may be relevant to children’s health, for example, due to their specific dietary patterns or levels present in foods consumed by children. A second selection criterion was the availability of concentration data for the compound in foods, since without sufficient concentration data reliable assessments cannot be made. Based on this last selection criterion, sulphite, T-2/HT-2 and artificial sweeteners, all identified as relevant to children’s health, were not addressed in this report. For sulphite, there were only concentration data available for a few foods in which this additive is used. Also the Dutch concentration data of the mycotoxins T-2/HT-2 were not sufficient to perform a dietary exposure assessment, due to a very low number of samples tested positive for these compounds (probably due to a high limit of reporting). For artificial sweeteners, the available concentration data did not cover the foods relevant for children. As a result of this observation, VWA has performed additional analyses on concentrations of artificial sweeteners in foods relevant for young children. The assessment of the intake of these substances will be reported elsewhere.
The compounds addressed in this report were acrylamide, dioxins (including dioxin-like PCBs), a number of mycotoxins (aflatoxin B1, deoxynivalenol (DON), fumonisin B1, ochratoxin A (OTA) and
patulin), nitrate and organophosphorus pesticides (OPs).
1.4
Outline of the report
The outline of the report is as follows. In chapter 2, first the input data and methodologies used to assess the exposure to the selected compounds will be addressed as well as the procedure of the risk assessment. The results of the exposure calculations are presented per compound (group), including a risk assessment and conclusions, in chapters 3 to 7. Finally conclusions and recommendations are drawn up in chapter 8.
In this report the terms exposure and intake are used alternatively, referring both to the ingestion of compounds via food and drinks.
2
Methods
2.1
DNFCS-Young Children 2005/2006
In this report the chemical safety of food consumed by young children is assessed using the food consumption data of Dutch National Food Consumption Survey (DNFCS)-Young Children 2005/2006. The aim of this survey was to gain insight in the diet of Dutch children aged 2 to 6 years. Children under the age of 2 were excluded from the survey, because recent food consumption data are available for Dutch infants aged 9, 12 and 18 months (Breedveld and Hulshof, 2003), as well of 8 to 12 months (Boon et al., 2004).
The DNFCS-Young Children 2005/2006 was authorised by the Dutch Ministry of Health, Welfare and Sport and coordinated by the National Institute for Public Health and the Environment (RIVM). An expert committee advised the Ministry on the quality of the survey during planning, data collection, analyses and reporting of the results. For more details, see the report on this survey (Ocké et al., 2008) and/or the website www.rivm.nl/vcp/en or www.voedselconsumptiepeiling.nl.
2.2
Study population
The target population of the DNFCS-Young Children 2005/2006 consisted of boys and girls aged 2 to 6 years living in the Netherlands. Respondents were selected from representative consumer panels of the Market Research Agency GfK. Panel characteristics, such as socio-demographic characteristics, are known to GfK. Persons in these panels participate in all types of surveys and were not specially
selected on nutritional characteristics. Institutionalised persons were excluded, as well as children whose parents/carers (from now on in this report indicated with carers) did not have sufficient knowledge of the Dutch language. Per family, only one child was included to avoid correlations in dietary consumption patterns between children of the same family.
In total 1,634 children were invited to participate in the study, of which 1,279 consented (net response of 78 %). The children were equally distributed over the four age-sex strata (Table 2-1). During recruitment, the representativeness of the study population was monitored and, if necessary, the recruitment was adjusted for age and sex, education of the head of the household, level of urbanisation, place of residence and region. The study population was representative regarding socio-demographic characteristics (including region and education of the head of the household), but densely populated areas were slightly underrepresented.
The carer of each child recorded the consumption of food and drinks on two non-consecutive days (separated by about 8 to 13 days). All days of the week were equally represented, but the winter and autumn period were slightly overrepresented compared to the spring and summer period.
Characteristics of the study population are listed in Table 2-1. About half of the children lived in four-person households and for 68 % of the children both carers were employed. Of the children 43 % had at least one carer with a high educational level. In total, 44 % of the children lived in the west of the Netherlands and 42 % in densely populated areas. The Netherlands was the country of origin of most carers in the study population.
Table 2-1. Characteristics of the Dutch children aged 2 to 6 years.
2 to 3 years 4 to 6 years Total
(n=1,279)
Boys
(n=327) (n=313) Girls (n=(327) Boys (n=312) Girls
Characteristics % % % % %
Size of household
2 to 3 23 25 27 18 22
4 49 50 50 53 45
5+ 28 24 23 29 34
Highest educational level of carer(s)
Low 11 10 10 13 11
Moderate 43 44 40 41 47
High 43 44 46 43 37
At least for one carer unknown 3 2 4 3 5
Employment status of carers
Both employeda 68 72 70 68 64
At least one carer not employed 28 26 28 28 31
At least for one carer unknown 3 2 2 4 4
Region
Three largest cities in the west of the
Netherlandsb 13 11 11 15 14
Rest of the west 30 32 30 27 29
North 10 11 11 10 9 East 23 24 24 23 23 24 23 24 24 South 24 Urbanisation High 37 35 36 40 35 Moderate 24 24 25 23 23 40 41 39 37 Low 42
Native country of carers
Both of Dutch origin 93 95 92 91 92
At least one not of Dutch origin 6 5 7 8 6
Unknown for at least one carer 1 1 1 1 2
a This category also includes single carers that were employed. b Amsterdam, Rotterdam, The Hague
During the home visit, the child’s weight and height were measured and recorded. The mean height was 107.7 cm and weight was 18.8 kg for the total study population (Table 2-2). For more details about the study population, see the previous report (Ocké et al., 2008).
The results on food safety reported in this report were not corrected for socio-demographic factors and season as done for nutrients and foods in the same study population (Ocké et al., 2008), due to the lack of statistical tools for doing so when addressing food safety.
Table 2-2. Mean height (in cm) and weight (in kg) of the Dutch children aged 2 to 6 years.
2 to 3 years 4 to 6 years Total
(n=1,279) (n=327) Boys (n=313) Girls (n=327) Boys (n=312) Girls
Height (cm) 106.0 97.3 96.2 115.3 115.2
Weight (kg) 18.3 15.7 15.1 21.3 21.2
2.3
Method of dietary assessment
The food consumption data of the DNFCS-Young Children 2005/2006 were collected in the period October 2005 to November 2006. Carers willing to participate were visited at home by a trained employee of GfK. During the home visit survey materials were presented and overall instructions were given. Survey data were collected by means of a written general questionnaire and subsequently through two food records. After completion of the second record, the respondents returned the questionnaire and food diaries to GfK by regular mail.
The questionnaire includes questions on the background of the child and family, the child’s daily rhythm and activities (developed by TNO-Quality of Life) and general characteristics of the child’s diet. Questions related to eating habits include consumption frequency of certain specific foods, use of dietary supplements, the purchase of organic foods and the volume of cups and glasses used habitually by the child.
The food records were filled in by the carer of each child. The carer recorded in pre-structured diaries the foods and drinks the child had consumed on two non-consecutive days (separated by about 8 to 13 days). The survey dates were determined for each child by GfK.
The diaries were structured according to the food consumption occasion (three meals and three in-between meals). For each food consumption occasion, the carer was asked to indicate the time and place of consumption and to tick each food on the list consumed by the child on that occasion. Ample space was provided to enter additional foods not listed. For each food, the carer was asked to indicate characteristics such as fat content, sugar content, flavour, brand name and preparation method. Portion size of the foods and meals were estimated by using photographs, domestic measures (a small and a large spoon were supplied to standardise estimates), standard units, weight and/or volume. The usual volume of cups and glasses used was measured by the carer. The final section of the diary included questions on the use (specific type and amount) of dietary supplements on the recording day and the use of toothpaste. Furthermore, carers were asked to indicate whether the recording day was special in any way, such as holiday, travelling day or illness.
Dieticians entered the data from the diaries into the EPIC-Soft computer program. EPIC-Soft is developed to process food consumption data derived from highly standardised 24-hour dietary recalls (Slimani et al., 2000), as used in the current ongoing Dutch food consumption survey among the general population (DNFCS-2007-2010; www.voedselconsumptiepeiling.nl). The dieticians were specifically trained in data entry and were given detailed instructions on how to enter specific foods.
2.4
Concentration data
The concentration data for the majority of compounds addressed in this report were derived from monitoring programmes performed in the Netherlands by the VWA. Additional organophosphorus pesticide (OP) residue data were derived from monitoring programmes performed by the Dutch Produce Association (e.g., The Greenery), Bakker Barendrecht B.V. (retail) and Food Compass. The Dutch Produce Association and Bakker Barendrecht also supplied data on nitrate. For dioxins, data were obtained from the Dutch monitoring programme on dioxins of the Dutch Ministry of Agriculture, Nature and Food Quality of 2005-2006. Additional dioxin concentration data on vegetables and fruits sampled in 2005 were extracted from (Traag and Hoogenboom, 2006). All concentration data are stored in the Quality Agricultural Products Database (KAP database1) and for OPs also in the Early Warning & Response System (EWRS2). For nitrate, which occurs naturally in tap water, concentrations in tap water were used as provided by the Centre of ‘Inspectieonderzoek, Milieucalamiteiten en
Drinkwater’. Concentrations of ochratoxin A (OTA) in meat were not available in the Netherlands. Therefore, the most recently reported concentrations in pork from Germany (SCOOP, 2002a) and in poultry from Denmark (Jorgensen, 1998) were used. For an overview of the concentrations, see Table 2-3.
In the monitoring programmes samples are reported to contain a chemical at a certain, quantifiable level. However many samples are reported to contain no contaminant or pesticide residue below a certain level (the so-called non-detects). This level is termed here the limit of reporting (LOR) and is just the value below which concentrations are reported as ‘less-than’ (see also section 2.6). In fact, the LOR reported in the present report may be the limit of detection (the lowest quantity of a substance that can be distinguished from a blank value) or the limit of quantification (the lowest quantity of a
substance that can be quantified, which is always higher than the limit of detection), but the available information did not allow for this distinction. See Appendix A for a list of all concentration data included in the exposure assessments per compound.
When the number of food samples was less than five but concentrations above the LOR were reported, these foods were examined more closely. First we tried to create food groups by grouping similar foods to increase the sample size. If this was not possible, and 1) the foods contained low concentrations, and 2) they did not belong to a food group in which the substance was expected, and 3) the consumption of these foods was low, they were excluded from the calculations. For acrylamide, dioxins, nitrate and OPs all foods sampled less than five times were included due to this approach. For mycotoxins some samples were excluded (e.g., for deoxynivalenol (DON) concentrations in blancmange powder and hazelnut spread (n = 1)). Concentration data related to indefinable foods, for example, ‘various soups, sauces and -products’, ‘remaining drinks’, ‘remaining fresh herbs’, ‘remaining fruits and nuts’, were omitted from the exposure calculations because they cannot be linked to specific consumed foods. Concentration data of mycotoxins as supplied by VWA are a mixture of both monitoring and survey concentration data. Survey concentration data are obtained from targeted sampling of batches suspected of containing (possible) higher concentrations of mycotoxins. These data are not suitable to estimate a reliable exposure to contaminants. Based on indications received by VWA survey samples were removed from the mycotoxin concentration dataset, including all peanut, fig and raisin samples, as well as all samples of other foods that were analysed more than once on the same day (the so-called duplo and triplo samples). The remaining mycotoxin concentration dataset contained only the results of
1 www2.rikilt.dlo.nl/kap/index.html 2 www2.rikilt.dlo.nl/ewrs/index.html
Table 2-3. Overview of the concentration data used to assess the exposure to different compounds in Dutch children aged 2 to 6 years.
Chemical Years included in the assessment Sourcea Representative
Acrylamide 2006-2007b VWA. Yes
Dioxins 2005-2006b • Dutch monitoring programme LNV.
• Data on vegetables and fruits from (Traag and Hoogenboom, 2006).
Yes Mycotoxins 2002-2006c • VWA (ochratoxin A concentrations of raisins from survey program).
• Ochratoxin A levels in pork and poultry were derived from literature (Jorgensen, 1998; SCOOP, 2002a), respectively.
Biased due to (partly) targeted sampling
Nitrate 2002-2006c • VWA, DPA, BB.
• Tap water concentrations from Centre of ‘Inspectieonderzoek, Milieucalamiteiten en Drinkwater’
Yes
Organophosphorus pesticides 2005-2006d VWA, DPA, BB, Food Compass. Biased due to (partly) targeted
sampling
a VWA = Dutch Food and Consumer Product Safety Authority; LNV = Dutch Ministry of Agriculture, Nature and Food Quality; DPA = Dutch Produce
Association (e.g., The Greenery); BB = Bakker Barendrecht B.V. (retail).
b Only the most recent years were included because of decreasing levels of acrylamide and dioxins in time.
c Several years were included in the assessment because adverse effects occur after long-term exposure and there is no decreasing trend in
concentrations.
samples analysed as part of the monitoring programme. Also these samples may not be completely at random, as they are sampled to ensure compliance with legal limits. This is also true for monitoring concentration data of pesticide residues. Because of this the resulting exposure levels of mycotoxins and OPs as reported here are very likely overestimates of the true exposures.
Some of the mycotoxins studied (namely aflatoxin B1, DON and OTA) may be present in the foods that
were removed from the mycotoxin concentration dataset, namely peanuts, raisins and figs. Whereas the consumption of figs by children is negligible (and hence the contribution of figs to the exposure to these mycotoxins can be ignored), the consumption of peanuts (on average 0.1 g/d) and raisins (0.9 g/d) is not. Not addressing these two foods in the assessments may therefore result in an underestimation of the exposure. For this reason, for aflatoxin B1, DON and OTA the concentrations in nuts (all nuts
grouped together because of data scarcity) were assigned to peanuts (Appendix A). Unfortunately, for raisins, which may contain aflatoxin B1 and OTA, concentrations in comparable foods were not
available. When looking at the concentrations in the survey samples of raisins (aflatoxin B1:
0.01 µg/kg, OTA: 5.3 µg/kg) it was concluded that for aflatoxin B1 these values could be safely ignored
(as the consumption of raisins is fairly low), but for OTA this was not the case. Therefore, to make sure that the exposure to OTA was not underestimated, we included the average OTA concentration of raisins in the exposure assessment, even though this value was derived from targeted survey samples.
Cumulating concentrations
Some of the compounds addressed in this report are groups of compounds with a similar mode of action. To address the risk of exposure to this group of compounds, the individual exposures should be addressed simultaneously. These groups include dioxins, OPs and the mycotoxins aflatoxins and fumonisins.
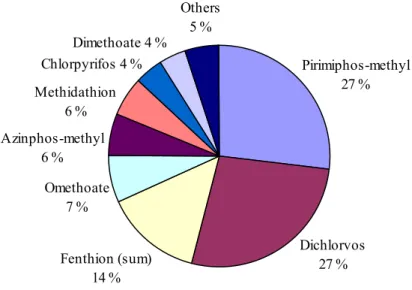
The collective term ‘dioxins’ encompasses the polychlorinated dibenzo-p-dioxins (PCDDs), the polychlorinated dibenzofurans (PCDFs), and the mono-ortho polychlorinated biphenyls (mo-PCBs) and non-ortho polychlorinated biphenyls (no-PCBs), the so-called ‘dioxin-like PCBs’. It is generally assumed that the toxicity of dioxins is expressed through a common mechanism of action and all compounds act through this mechanism, namely interaction with the cytosolic aryl hydrocarbon receptor protein (Ah receptor). During the last few decades, data from many experimental studies with dioxins are consistent with an additive model, resulting in the development of the toxic equivalency concept during the mid 1980s. This concept uses the relative effect potency determined for individual PCDD, PCDF, and dioxin-like PCB compounds for producing toxic or biological effects relative to a reference compound, 2,3,7,8-tetrachlorodibenzo-p-dioxin (TCDD) which is considered the most toxic dioxin. The total toxic equivalent (TEQ) is operationally defined by the sum of the products of the concentration of each compound and its toxic equivalency factor (TEF) value, and is an estimate of the total TCDD-like activity of the mixture (van den Berg et al., 2006). Thus, in the TEF scheme, a dose of TCDD of, for example, 1 pg TCDD/kg bw/d is considered to be equivalent to a toxic equivalence of 1 pg TEQ (properly addressed as ‘WHO-TEQ’)/kg bw/d. See Appendix B for the used TEFs. The OPs is also a group of compounds with a similar mode of action, namely inhibition of
acetylcholinesterase (AChE) by phosphorylation, resulting in a spectrum of acute cholinergic effects (ILSI, 1999; Mileson et al., 1998; Pope, 1999). Also for this group of compounds an additive model is expected at the low doses to which people are exposed (EFSA, 2008b). To address these compounds relative potency factors (RPFs) were used as previously reported in (Boon et al., 2008), using acephate as index compound (Appendix C). These RPFs were derived from benchmark doses (BMD) at which AChE activity in the brain of female rats was reduced by 10 % compared to background activity (BMD10) as reported by the US Environmental Protection Agency (EPA) (2006). BMDs were available
for eighteen of the OPs addressed in this report. For the remaining OPs RPFs were calculated as the ratio of the no-observed adverse effect level (NOAEL) for AChE inhibition, mainly obtained from JMPR (FAO/WHO Joint Meeting on Pesticide Residues, Appendix C). For more details, see Boon et al. (2008)3.
In the case of aflatoxins, the concentrations of aflatoxin B1 and aflatoxin M1 were summed. The
carcinogenic potency of aflatoxin M1 is probably one or even two orders of magnitude lower than that
of aflatoxin B1 (Bennett and Klich, 2003; EFSA, 2004b; FAO/WHO, 2001b). As a conservative
estimate the potency of aflatoxin M1 was assumed to be 10 % of that of aflatoxin B1.
Fumonisin B1 on foodstuffs is generally accompanied by fumonisins B2 and B3 in a ratio of about 8:3:1
(Sydenham et al., 1993). The intake of fumonisin B1 was therefore increased with 50 % to obtain the
intake of all three fumonisins, under the assumption that the RPFs of the different fumonisins were equal.
2.5
Link between food consumption data and concentration data
Analyses at the level of raw agricultural commodities
Most of the chemicals addressed in this report are analysed in raw agricultural commodities (RACs), including peels and non-edible parts. This is due to the fact that in legislation the majority of limits for concentrations of, for example, pesticides, dioxins and nitrate are set for RACs. For mycotoxins analyses are performed both at RAC level (e.g., wheat, maize, rye) and food level (e.g., wheat bread, tortilla crisps, biscuits). To model the dietary exposure to chemicals using concentrations analysed at RAC level a link between concentration and food consumption data needs to be established. In that way, also prepared foods (like apple cake, salads, bread) containing RACs as ingredient will be included in the exposure assessment.
At the RIKILT-Institute of Food Safety a food conversion model has been developed in 1995
(van Dooren et al., 1995), which has been regularly updated since then to cover new foods as recorded in later Dutch food consumption surveys, including the present DNFCS-Young Children 2005/2006. This food conversion model is based on the foods as listed in the Dutch food composition database NEVO (NEVO Stichting, 2006). In this model, all NEVO-codes recorded in the children’s survey have been converted to their RAC ingredients (and their mass fraction). To establish the weight fraction of RACs present in foods several sources of information were used. These included recipes from cookbooks, food legislation and information from either literature, label of the product, internet or manufacturer, as well as recipes developed and used for the purpose of NEVO (NEVO Stichting, 2006). Furthermore, nutrient concentrations as listed in NEVO were used in the conversion or as check for the amounts deduced from other sources. When there is only little information of a food, ingredient levels of a similar food were used. The type of processing a RAC has undergone before consumption is also recorded. For example, apple juice may be converted to RAC ‘apple’ with processing type
‘juicing’, apple eaten peeled to RAC ‘apple’ and processing type ‘peeling’, and apple eaten with skin to RAC ‘apple’ with processing type ‘raw’. In this way, the effect of processing on concentrations in RACs before consumption can be taken into account in an exposure assessment. For more details on the food conversion model, see van Dooren et al. (1995).
3 The RPF approach is identical to the toxic equivalency factor (TEF) approach. Unlike the term TEF, which is applied
to groups of substances with a strong degree of toxicological similarity and where TEF values are assumed to encompass all endpoints and exposure routes, the term RPF is applied in situations where the mode of action appears to be similar, but the exact mechanism is complex and maybe not known in detail (EPA, 2000b).
Analyses at food level
Apart from analyses in RACs, all compounds were also (or exclusively as for acrylamide) analysed at the level of foods as eaten. For example, acrylamide was analysed in biscuits, nitrate in frozen spinach, aflatoxin B1 in peanut butter, patulin in apple juice and pesticides in fruit juices. These foods were
either linked directly to foods coded in the food consumption survey (e.g., peanut butter) or by creating food groups. These food groups consisted of comparable foods as those analysed based on chemical concentrations and food characteristics. An exception was made for home made freshly squeezed juices (predominantly orange juice). These drinks were not linked to analyses performed in (commercially produced) fruit juices, but were linked to concentrations analysed in the corresponding RAC using the food conversion model. The reason for this is that in commercially produced fruit juices hardly any pesticides are detected.
For details on linking of analysed foods or RACs to foods coded in the food consumption survey for acrylamide, dioxins and mycotoxins, see Appendix D.
2.6
Dietary exposure calculations
The dietary exposure was calculated using Monte Carlo Risk Assessment programme (MCRA), Release 6.0 and 6.1, available for registered users at the RIKILT website (de Boer and van der Voet, 2007). Release 6.0 was used for most exposure analyses, except for the acute cumulative exposure calculations for OPs following Approach 2 (see below). This approach was not implemented in Release 6.0. All daily consumption patterns (e.g., 2,558 for the total population (2 days ×
1,279 individuals)) were multiplied with the (mean) concentration of the substance per consumed food and summed over foods consumed per day per individual. The estimated exposures were adjusted for the individual’s body weight. This resulted in an exposure distribution.
All substances studied here, except OPs, are expected to be present at levels for which chronic effects are the relevant health effects. Therefore, only for OPs a short-term intake assessment was performed, and for the other substances a long-term intake assessment. For short-term intake assessments the whole range of analysed concentrations is used to take the variation in concentrations into account. For long-term intake assessments however the mean concentration of the substances in the various foods is used, because fluctuations in daily concentrations are assumed to average out in the long run.
Samples with levels below LOR
For most of the basic exposure analyses non-detects were assumed to contain concentrations equal to ½LOR (middle bound scenario). Whether to assign ½LOR to analysed foods or RACs with only non-detect levels was determined by the possibility that the food or RAC could be contaminated. For this data from literature were used. This possibility was estimated based on information from previous studies and/or expert judgement. For example, no acrylamide concentrations above the LOR were analysed in bread. However, bread can contain some acrylamide (FSA, 2005; Matthys et al., 2005) and is consumed regularly and in large quantities by young children. Therefore, the non-detects of
acrylamide in bread were assigned ½LOR. On the other hand, congener concentrations of dioxins or dioxin-like PCBs in vegetables, fruit and cereal samples below LOR were assumed to be zero, because assigning ½LOR to these food groups very likely overestimates true concentrations. Fruits, cereals and vegetables are contaminated with dioxins only via atmospheric deposition which results in far lower concentrations compared to animal products. For pesticides non-detects were assumed to contain no pesticide residue. Because only a part of the commodities will be treated with pesticides, a large part of the non-detects will truly contain no pesticide. Therefore non-detects for pesticides are commonly assumed to be true zero’s.
Apart from assigning ½LOR to non-detects, two other scenarios were performed in which either zeros (lower bound scenario) or LORs (upper bound scenario) were assigned to these samples to study the sensitivity of the intake calculations to the concentration assigned to non-detects (except for OPs). Results of these scenarios per compound (group) are presented in Appendix E.
Note that mycotoxins are determined using several methods of analysis, each having its own LOR. Since 2004 VWA has used a screening method with relatively high LORs to screen multiple mycotoxins simultaneously, If a mycotoxin is found to be present using this screening method, the actual level is determined with a method specific for that mycotoxin (already in use before 2004). This specific method has a lower LOR. In the exposure calculations, LORs of the screening method were used to replace the non-detects, since the screening method is used to analyse (most of) the samples first. For the samples of 2002 and 2003 this was not the case. Using the LORs of the screening method will therefore have resulted in a slight overestimation of the mean concentrations. This overestimation is however likely small in comparison to the overestimation due to (partly) targeted sampling
(section 2.4).
Long-term intake
A distribution of daily exposures, calculated as described above using mean concentrations per food or food group, includes both the variation between individuals and between the two days of one
individual. However, to assess the long-term intake within a population only the former type of variation is of interest, since in the long run the variation between different days of one individual will level out. Therefore, to calculate a long-term distribution, the within-person (between days) variation should first be removed from the distribution of daily exposures using statistical models like the relatively new beta-binomial-normal (BBN) model (de Boer and van der Voet, 2007; Slob, 2006) or the foods model developed at Iowa State University (ISUF model; (Dodd, 1996; Nusser et al., 1996, 1997)). To remove the within-person variation from the daily exposures, the BBN and ISUF models transform the daily exposure distribution into a normal distribution. After removal of the within-person variation, the normal distribution is back-transformed and is now considered a long-term exposure distribution.Both models are incorporated in MCRA. In contrast with the ISUF model, the BBN model can calculate the exposure distribution as a function of age. Since the dietary exposure of children is expected to be a function of age, this is the preferred model for calculation of long-term exposures in the present study.
However, the BBN model has more limited possibilities than the ISUF model to transform the short-term intake distribution to a normal distribution. In both models, daily exposures are transformed first by a logarithmic or power function and, in the case of ISUF, this can be followed by an additional spline transformation to achieve normality. For some substances, the transformation of daily exposure distributions to normality using the logarithmic or power transformation failed due to multimodality of the daily exposure distribution, for example, due to the presence of subgroups in the population with different consumption patterns (e.g., groups that consume apple juice, but no apple sauce, groups that consume both, etc.). In those cases, ISUF was used. However, considerations as described in (de Boer et al., 2009) and preliminary results of simulation studies seem to indicate that also the ISUF model may not be optimal for non-normal (transformed) data. The preliminary results seem to indicate that in these cases ISUF most likely overestimates the true exposure. However, whether this is always true in more complex realistic situations is yet unclear.
Since a model that can always safely handle multimodal intake distributions is lacking, the ISUF model was used for those cases. When using the ISUF model, possible age-dependency of the intake cannot be modelled.
For acrylamide, nitrate, dioxins and DON the BBN model could be used to model long-term exposure and age-dependency was modelled if significant. For the other mycotoxins, including aflatoxin B1,
fumonisin B1, OTA and patulin, multimodal intake distributions were observed and the ISUF model
was therefore used. The reported percentiles of the long-term exposure distribution are P50, P95 and P99.
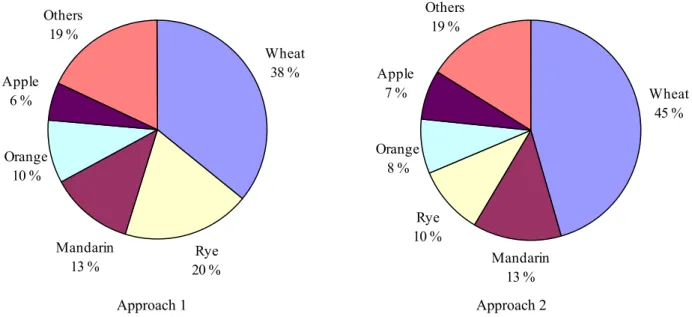
Acute cumulative dietary exposure to OPs
Acute cumulative dietary exposure modelling using the RPF method is still a fairly new methodology. There are no international guidelines on how to perform these assessments. At the RIKILT-Institute of Food Safety, two approaches have been developed to calculate the acute cumulative exposure using the RPF method. One approach (Approach 1) has already been used in a number of publications (Boon et al., 2008; Boon and van Klaveren, 2003; Caldas et al., 2006; van Klaveren et al., 2006), while a second approach (Approach 2) has been developed only recently. Both approaches were used in this study to calculate the exposure to OPs.
With Approach 1, the acute cumulative dietary exposure to OPs is estimated by linking daily consumption levels of RACs with summed OP levels per relevant RAC expressed in
acephate-equivalents. This is done by multiplying the concentration of each OP in a RAC sample by its RPF and adding up the different equivalents to one OP concentration per sample expressed in
acephate-equivalents. These samples are consequently used in the acute exposure assessment of OPs. In Approach 2, first the acute dietary exposure distribution per OP is calculated. Using the RPF per compound, the exposure distributions per compound are subsequently added to generate an acute cumulative dietary exposure distribution expressed in acephate-equivalents. For a discussion on these two approaches, see section 7.2.
For the estimation of the acute cumulative dietary exposure 100,000 randomly drawn daily
consumption patterns of RACs from the RAC consumption database were multiplied with randomly selected cumulative or compound specific concentrations per RAC. Summing over RACs resulted in an empirical estimate of the acute cumulative exposure distribution for either total OP or the exposure distribution per compound. The exposure calculated per compound was summed using the same sequence of simulated person days in each case. The total acute cumulative exposure per person day was calculated by multiplying each compound specific exposure with the corresponding RPF and summing up these exposures per person day. The reported percentiles of the acute cumulative exposure distribution in both approaches are P50, P95, P97.5, P99 and P99.9.
Processing factors
Processing factors are factors used to calculate the fraction of the substance that is lost from the food/RAC by processes as peeling, cooking, grinding, etc. For example, a processing factor equal to 0.75 means that the concentration of the compound is reduced by 25 %, and a factor one means that the compound concentration is not affected by processing. For several compounds processing factors were included in the calculations to make the assessment as accurate as possible. The compounds for which processing factors were applied include OPs, nitrate and all mycotoxins except patulin. See Appendix F for the processing factors used, as well as for the methodology to include them in the exposure
assessments.
Variability factors
When assessing the acute exposure to pesticide residues using concentrations derived from composite samples as analysed in pesticide monitoring programmes variability factors (also referred to as homogeneity factors) should be included in the assessment (EC, 2001b; FAO, 2002). These factors account for the fact that the concentration analysed in a composite sample consisting of, for example,
12 apples can originate from one individual unit of the commodity, and that consumers may be
confronted with a concentration in a single unit (e.g., an apple) rather than the average concentration as analysed in composite samples. In the acute cumulative dietary exposure assessment presented in this report, variability factors were included in the assessment. For more details on both the factors and methodology used, see Appendix G.
Uncertainty due to limited number of consumption and concentration data
There are different sources of uncertainty in dietary exposure assessments. Important sources are sampling uncertainty, under- or over reporting of foods, linkage of foods consumed to foods analysed and uncertainty due to the limited size of the dataset for both concentration and food consumption data. Sampling uncertainty refers to possible targeted sampling of those commodities expected to contain the chemical at concentrations above a legal limit and occurs because monitoring is conducted for law enforcement reasons. It is not possible to quantify this type of uncertainty, but a qualitative statement can be made; exposure assessments using these data likely overestimate the true exposure.
The other sources of uncertainty mentioned above cannot be quantified and will either result in a possible overestimation and/or underestimation of exposure. An exception is formed by uncertainties due to the limited size of the dataset that can be quantified by using the bootstrap method (Efron, 1979; Efron and Tibshirani, 1993). With this method a bootstrap database is generated of the same size as the original database for both the food consumption and concentration database by sampling with
replacement from the original datasets. These bootstrap databases are considered as databases that could have been obtained from the original population if another sample was randomly drawn. These two bootstrap databases are then used for the exposure calculations and derivation of the relevant percentiles. Repeating this process many times results in a bootstrap distribution for each percentile that allows for the derivation of confidence intervals around it. The bootstrap approach was used by
generating 100 food consumption and 100 concentration bootstrap databases and calculating the chronic or acute (with at least 10,000 iterations each) dietary exposure. Of the resulting bootstrap distributions per percentile a 95 % uncertainty interval was calculated by computing the 2.5 % and 97.5 % points of the empirical distribution. Note that by bootstrapping both the consumption and concentration database in one analysis it is not possible to quantify which part of the uncertainty was due to a limited number of consumption or concentration data. For the acute cumulative dietary exposure an uncertainty analysis using the bootstrap approach was only applied using approach where the concentrations were summed per sample (Approach 1). With Approach 2, in which the exposure distributions per compound are summed, uncertainty analyses have not yet been implemented. For the results of this on the exposure percentiles, seeAppendix H. It should be realised that this uncertainty also includes the uncertainty in the exposure due to the number of iterations used, the so-called ‘Monte Carlo’ uncertainty. The number of iterations was however selected in such a way that this uncertainty was negligible in the exposure calculations reported here.
2.7
Risk assessment
2.7.1
Decision tree of VWA panel
In 2007 a scientific panel of experts was established in the Netherlands to discuss how to perform a risk assessment for children aged 0.5 to 12 years in those cases where the dietary exposure exceeds the acceptable or tolerably daily intake (ADI/TDI) (VWA, 2008). This panel identified that children may be more sensitive to neurotoxic, endocrine and immunological toxic effects up to 4 years of age due to significant postnatal development of different organ systems during childhood. This is also true for
children aged 5 to 12 years, however to a lesser extent for immunological toxic effects (VWA, 2008). For compounds with these types of effects a ‘temporary’ exceedance of the health limit during childhood may be adverse, even though the exposures decrease below the limit when the children mature.
This panel proposed a decision tree, which includes a tiered approach, when assessing possible health risks when health limits are exceeded (VWA, 2008). This decision tree is applicable to evaluate chronic effects for which a health based limit value (HBLV; such as ADI, TDI) is established. The decision tree is not meant to evaluate compounds with acute toxic effects or genotoxic carcinogens. In this tiered approach, the risk assessment is refined via different steps including a refinement of the exposure assessment, examination of possibilities to lower the exposure (e.g., by adjustment of processing techniques, removal of foods from the market or changes in dietary patterns) and a critical evaluation of the toxicity database (including reproduction toxicity data). Important in this is whether the HBLV was derived from a study in which young animals received a higher exposure than the full-grown animals due to their lower body weight and relative high food consumption. In those cases, an additional safety factor of two is present in the derivation of the HBLV, and consequently an exposure level that exceeds the HBLV with a factor two or less may not give reason for concern (VWA, 2008)4. Based on this evaluation different conclusions regarding the compound are possible according to the panel, namely: • The exposure does not exceed the HBLV. There is therefore no additional health risk.
• The exposure exceeds the HBLV with a factor two or less. However, an additional safety factor of two is present in the derivation of the HBLV and therefore the extent and duration of the
exceedance can be considered to pose a very limited health risk.
• The exposure exceeds the HBLV with a factor two or less and no additional safety factor of two can be applied (derivation of the HBLV is not based on a study in which young animals received a higher exposure than full-grown animals) or the exposure exceeds the HBLV with more than a factor two, irrespective of whether an additional safety factor of two can be applied:
o Based on the available data there is a (very) limited health risk. However, additional research is needed to optimize the risk assessment.
o There is insufficient data to establish the size of the health risk.
o Based on the available data the exposure will result in a considerable health risk. In these conclusions the exposure refers to a high percentile of exposure (VWA, 2008).
2.7.2
Risk assessment of chemicals addressed
In the present report the decision tree of the panel was used for the risk assessment of chemicals for which non-carcinogenic, chronic toxic effects were the most critical, although there were some deviations (Appendix I). In short, to assess the consequences of any exceedance of the ADI/TDI, the available toxicity data were reviewed with special attention to effects in children. In this respect, especially the potential adverse effects in reproductive toxicology studies and on the (developing) endocrine, immunological and neurological system were addressed. In addition, it was determined whether the critical effect of the HBLV was relevant for young children and whether there were indications that the sensitivity of children to the respective chemical may differ from the general population. In addition, when the ADI/TDI was exceeded with a factor two or less, it was examined whether the young animals (in the study on which the ADI/TDI was based) received a higher exposure than the full-grown animals due to their lower body weight and higher food consumption. In that case,
4 The panel indicates that when, in the toxicitiy study on which the HBLV is based, the young animals were exposed to
constant concentrations of the compound via food or drinking water, they were exposed to concentrations about two times higher than adult animals. As a consequence, an exposure level exceeding the HBLV with a factor two or less does not give reason for concern, unless other data in the toxicity database indicate otherwise.
exceeding the HBLV with a factor two or less may not give reason for concern4. In the final step of the risk assessment, a conclusion about the health risk (i.e., probability that an adverse health effect occurs) was drawn.
For the compounds acrylamide and aflatoxin B1 for which carcinogenic effects with a genotoxic
mechanism are relevant, no HBLVs such as the ADI/TDI are available. In these cases, a margin of exposure (MOE) was calculated by dividing the (2.5 %) lower confidence limit of the benchmark dose for a 10 % increase in cancer incidence (BMDL10) by the exposure. If no BMDL10 was available, the
no observed (adverse) effect level (NO(A)EL) was used. The MOE was compared to a value of 10,000 as proposed by EFSA (2005a). An MOE of 10,000 or higher ensures a reasonable margin of safety between a dose that causes with 95 % certainty no more than a 10 % cancer incidence in an animal experiment and the estimated exposure in humans and would therefore be of low health concern (EFSA, 2005a).
For the OPs, for which acute toxicity is relevant in relation to health risks, the exposure was compared to the acute reference dose (ARfD). Note that also for acrylamide, aflatoxin B1 and OPs the whole
toxicity database was screened for relevant effects in children.
When the exposure to a chemical is below the HBLV or the MOE is higher than 10,000, the dietary exposure can be regarded as safe (or to pose a negligible health risk) for that specific chemical. If the exposure however exceeds the HBLV or results in an MOE below 10,000, there is a probability that an adverse health effect occurs. Depending on the quality of both the exposure and the toxicity data used, the extent of the probability may be identified.
In this report we aimed at dividing the compounds addressed into those for which the diet poses a negligible health risk and those for which this may not be true. For the latter group, if sufficient
exposure and toxicity data are available, the possible health risk was classified using the terminology of the VWA panel, namely very limited, limited or considerable health risk (Figure 2-1). This
classification in three degrees of severity should be seen as a guideline to prioritize resources to refine the risk assessment.
The decision whether the probability to develop an adverse health effect is deemed very limited, limited or considerable was based on four factors:
1. The percentage of children exceeding the HBLV (or with a MOE < 10,000). 2. The extent to which the HBLV is exceeded (or the size of the MOE).
3. The severity of the health effect (e.g., the occurrence of some light adverse liver effects will be considered less severe than a teratogenic effect).
4. The slope of the dose-response curve (a steep slope implies that the response to a slight increase of the dose is relatively high).
When all four factors are considered ‘low’, the probability to develop an adverse health effect is judged to be ‘very limited’. On the other hand, when one or more of the factors is ‘high’ a thorough
toxicological evaluation should form the basis for the decision whether the probability should be considered ‘limited’ or ‘considerable’. From factor 3, the severity of the health effect, it may be clear that the final conclusion on the probability to develop an adverse health effect cannot be reached in a fully quantitative way. Rather, it is based on the evaluation of both the quantitative and qualitative toxicological information present. For this reason, a conclusion on the health risk of a compound should always be accompanied by a narrative in which the decision is explained.
As described in section 2.4, concentrations of mycotoxins and pesticides used to estimate the exposure may be biased to higher concentrations than children are exposed to in real life. The reported exposure
Exposure = HBLV or MOE = 10,000
levels will therefore be very likely overestimations of the true exposures. When the exposure to these compounds does not exceed the HBLV or the MOE is 10,000 or higher, it is clear that there is a negligible health risk. However, when the exposure exceeds the HBLV or results in a low MOE, the conclusion is less clear. In those cases, the presented exposure levels indicate that the health risk may not be negligible, but due to possible overestimation of the exposure it is unclear whether this is true. The conclusion will then be that it is not feasible to determine whether there is a negligible health risk or not, and recommendations will be given how to refine the risk assessment. This conclusion can also be reached when other relevant data are lacking, such as certain toxicology data.
To summarise, the following conclusions can be drawn based on the risk assessments described in this report (Figure 2-1):
1. When the exposure does not exceed the HBLV, or exceeds the HBLV with a factor two or less in the case that an additional safety factor of two is present in the derivation of the HBLV or results in an MOE of 10,000 or higher, there is a negligible health risk (or negligible probability that an adverse health effect occurs). We did not use the same terminology as used by the panel (no additional health risk or limited health risk, section 2.7.1), because ‘negligible’ health risk is in our view a better description of the health risk related to such exposures.
2. When the exposure exceeds the HBLV, or exceeds the HBLV with a factor larger than two in the case that an additional safety factor of two is present in the derivation of the HBLV or results in an MOE below 10,000:
a. There is a very limited health risk or probability that an adverse health effect occurs. b. There is a limited health risk or probability that an adverse health effect occurs. c. There is a considerable health risk or probability that an adverse health effect occurs. d. There is a possible health risk, but the extent cannot be identified
e. Determination of the health risk is not feasible.
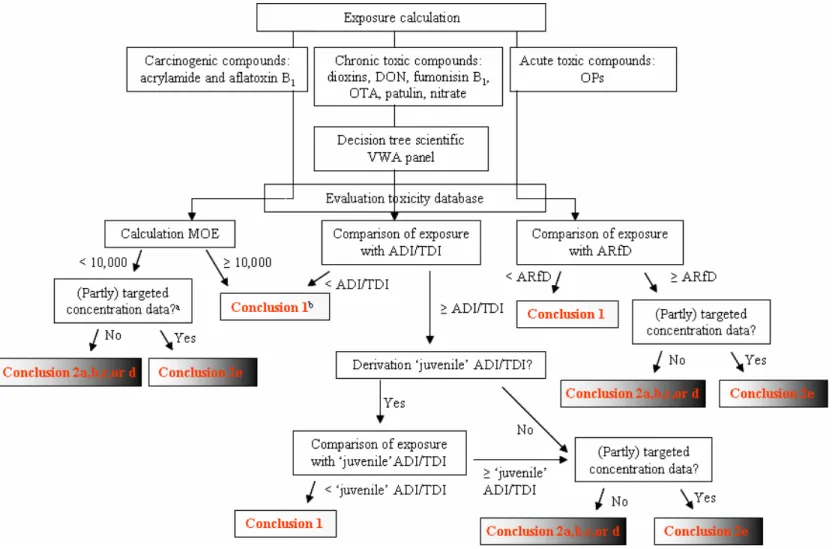
For an overview of the steps of the risk assessment procedure for all compounds addressed in this report and the possible conclusions, see Figure 2-2.
Selection reference value of exposure for risk assessment
To assess the health risk due to the dietary exposure to compounds, an exposure level needs to be selected for comparison to the HBLV or for the calculation of an MOE. Internationally there are no guidelines which dietary exposure percentile to select for this for both acute and chronic dietary exposure assessments. As discussed by the US EPA, which uses probabilistic modelling as part of the pesticide registration process in the USA, the choice of the percentile may, for example, depend on the (un)certainties related to the data used in assessment (EPA, 2000a). These are among others related to representativeness and size of the food consumption and concentration database (see also section 2.6).
Figure 2-1. Different degrees of health risk
(HBLV = health based limit value; MOE = margin of exposure).
Negligible Very limited Limited Considerable
Increasing probability of health risk
Exposure > HBLV or MOE < 10,000 Exposure = HBLV or MOE = 10,000 Exposure > HBLV or MOE < 10,000
Negligible Very limited Limited Considerable
Increasing probability of health risk
Exposure = HBLV or MOE = 10,000 Exposure = HBLV or MOE = 10,000
Figure 2-2. Flow diagram of the risk assessment. For more details, see section 2.7.2, and for an explanation of abbreviations used the Glossary.
The less uncertainty there is in the data the higher the selected percentile can be.
For acute dietary exposure assessment (OPs), the US EPA (EPA, 2000a) advises the use of the P99.9 in probabilistic assessments of exposure to pesticides. The Board for the Authorisation of Pesticides in the Netherlands (CTB) followed this recommendation in their evaluation of pesticides using the
probabilistic approach (CTB, 2001). Use of the P99.9 by both bodies is applicable to the regulation of pesticides, where consumption levels are combined with concentration data derived from experimental studies in which pesticides are applied to relevant crops. Which percentile to use when dealing with only monitoring concentration data, as in this study, has not been addressed anywhere so far. We therefore followed the recommendation of the US EPA and used the P99.9 to assess a possible health risk for OPs.
For long-term dietary exposure assessments (relevant for all chemicals addressed in this report except OPs) the VWA panel, via a footnote of the decision tree, observed that the P97.5 could be used as a reference point, stating that this level is applied in EFSA-opinions. However, they also stated that based on, for example, the compound another choice can be made.
Due to the extensive amount of consumption and concentration data available in the present study and because we are dealing here with young children, a vulnerable sub-group, a more conservative level of exposure, the P99, was chosen. When the P99 or P99.9 of exposure exceeded the corresponding HBLV the exact percentage of children exceeding this limit was calculated.