Netherlands Environmental Assessment Agency, June 2009
Policy Studies
Electric driving; an attractive challengeOver the past years, electric driving has become more and more attractive because of the development of better batteries. Driving electric vehicles could drastically reduce CO2 emissions, especially if more electricity would be generated by using sustainable energy. As most passenger cars are not used at night, this is the ideal time for charging their bat-teries. This would be cost-effective because, at that time, there is a surplus of generating capacity, and wind energy could also be used more effectively. Moreover, consumers will be able to drive clean and quiet vehicles at costs that seem surmountable in the future. At least two obstacles still need to be overcome. The first of which is the current maximum range of electric vehicles of around a hundred kilometres. Battery producers and universi-ties are working hard on the development of batteries that could be charged within 5 to 10 minutes at EV fast-charge stations. This limited range would not be a drawback for the so-called plug-in hybrid electric vehicles (PHEVs), which can run on both fossil fuel and electric power, and are expected to come onto the market in the near future. However, these hybrids reduce less CO2 and carry slightly higher costs. The second obstacle is the need for a standardised European network of charging stations, and electrical outlets near residences and at commercial and public parking facilities.
This report shows the challenges facing the government and the business community of utilising the benefits of electric driving and of overcoming the obstacles.
Electric driving
Evaluating
transitions based
on system options
Electric driving
Evaluating transitions based
on system options
Electric driving – Evaluating transitions based on system options
© Netherlands Environmental Assessment Agency (PBL), January 2009 PBL publication number 500083013
Corresponding Author: Dick.Nagelhout@pbl.nl
Parts of this publication may be reproduced, providing the source is stated, in the form: Netherlands Environmental Assessment Agency: Electric driving – Evaluating transitions based on system options 2009.
This publication can be downloaded from our website: www.pbl.nl/en and is also available in Dutch.
The Netherlands Environmental Assessment Agency (PBL) is the national institute for strate-gic policy analysis in the field of environment, nature and spatial planning. We contribute to improving the quality of political and administrative decision-making by conducting outlook studies, analyses and evaluations in which an integrated approach is considered paramount. Policy relevance is the prime concern in all our studies. We conduct solicited and unsolicited research that is both independent and scientifically sound.
Office Bilthoven PO Box 303 3720 AH Bilthoven The Netherlands Telephone: +31 (0) 30 274 274 5 Fax: +31 (0) 30 274 44 79 Office The Hague PO Box 30314 2500 GH The Hague The Netherlands Telephone: +31 (0) 70 328 8700 Fax: +31 (0) 70 328 8799 E-mail: info@pbl.nl Website: www.pbl.nl/en
Abstract 5
Electric driving; an attractive challenge
Over the past years, electric driving has become more and more attractive because of the development of better bat-teries. Driving electric vehicles could drastically reduce CO2 emissions, especially if more electricity would be generated by using sustainable energy. As most passenger cars are not used at night, this is the ideal time for charging their batteries. This would be cost-effective because, at that time, there is a surplus of generating capacity, and wind energy could also be used more effectively. Moreover, consumers will be able to drive clean and quiet vehicles at costs that seem surmount-able in the future.
At least two obstacles still need to be overcome. The first of which is the current maximum range of electric vehicles of around a few hundred kilometres. Battery producers and universities are working hard on the development of batteries that could be charged within 5 to 10 minutes at EV fast-charge stations. This limited range would not be a drawback for the so-called plug-in hybrid electric vehicles (PHEVs), which can run on both fossil fuel and electric power, and are expected to come onto the market in the near future. However, these plug-in hybrids reduce less CO2 and carry slightly higher costs. The second obstacle is the need for a standardised European network of charging stations, and electrical outlets near resi-dences and at commercial and public parking facilities. This report shows the challenges facing the government and the business community of utilising the benefits of electric driving and of overcoming the obstacles.
Key words: electric vehicle; plug-in hybrid; transport; transi-tion; battery
Contents 7
Contents
Abstract 5 Summary 9 1 Introduction 11 1.1 Progress of transition 111.2 The system option of electric driving 11 1.3 Work method and reader 12
2 Description of the system option:
outlining the future 13
2.1 Short outline of the basic idea 13
2.2 Changes in the structure of production 13 2.3 Adjustments to mobility behaviour 16 2.4 Institutional changes 17
2.5 Spatial planning 17 2.6 Important actors 18
2.7 Relation with other researched system options 18
3 Judging potential effects of this system option
19
3.1 Safety 19 3.2 Noise 20
3.3 Energy and climate 20
3.4 Local and large-scale air pollution 21 3.5 Long-term costs 22
3.6 Natural resources 23
4 Results from activities in the
pre-
development phase 25
4.1 Development in problem perception 25
4.2 Vision for the future (for vehicles and electricity) 25 4.3 Research & Development 26
4.4 Practical experiments 27 4.5 Learning curves 27
4.6 Relationship between activities 28
5 Motive for system change
31
6 Conclusions
35
Appendix 1 Interview round
37 Literature 38 Colophon 41
Summary 9 Electric vehicles combined with electricity production based
on renewable sources and clean fossil fuel, potentially, could reduce CO2 emissions from passenger cars and other light-duty vehicles by 80 to 90%, in the long term. Electric transport would also substantially reduce traffic noise within cities. Costs do not appear to become an issue, as batteries are expected to become substantially cheaper. With respect to user friendliness, the most important short-term disadvan-tages of electric vehicles are their limited ranges, the lack of available recharging points, and battery charging times. Despite any improvements that still could be made to vehi-cles’ current propulsion systems, it is unlikely that these will enable the transport sector to achieve its long-term green-house gas reduction targets. Achieving these targets would require large-scale transition towards alternative fuels and advanced vehicle technology. Apart from electrically pro-pelled vehicles, alternatives also include fuel-cell vehicles and the use of biofuels, all of which have both advantages and disadvantages. Fuel-cell vehicles on hydrogen would require a complex hydrogen infrastructure, and the fuel cell itself would need to become a good deal more affordable for it to compete successfully with conventional vehicles. Moreover, the costs of the necessary steps for such an energy conver-sion, cause the performance of this alternative to be low. For biofuels, the disadvantage would be the large areas of land required to grow biofuel crops, creating possible conflict with food crops and biodiversity. This causes the availability of biomass to be limited. Other reports have been published on both of these alternatives; this report looks specifically at the option of the electric driving system.
The advantages: clean, quiet, and less dependent on oil and gas
Electric driving is no obvious choice for heavy freight traffic. For private vehicles and other light-duty transport, however, it is considered a viable option; in the long term (around the second half of this century), looking at the characteristics of average car use, up to 90% of all kilometres driven could be electric. Per kilometre, the emission could even be nil, depending on the future technology of energy production per kilowatt hour. Renewable sources and clean fossil fuels would enable very low emission levels; with costs of produc-tion and transport, by 2050, roughly estimated only 2 or 3 euro cents per kWh more than today. Like fuel-cell vehicles, electric driving would also create advantages for the quality of the city living environment. Air pollution could be brought down even further than with future clean conventional cars
or hybrids, and noise pollution within cities – especially from acceleration – could decrease. Electric driving could also be an alternative for mopeds, scooters and motorcycles, which cause major noise annoyance (around 20% from scooters) to over 10% of city populations. Moreover, electric-vehicle users, themselves, could also enjoy the quieter mode of transport. Another advantage would be a decreasing dependence on oil and gas. Independence from the latter has to do with the charging systems, and requires some explaining. Electric driving could cause an increase in the demand for electricity; around 10% on a national scale, and up to 50% or more in urban areas. In our present situation, electricity supply during the night outweighs demand, and this would be the time during which most batteries of electric vehicles would require charg-ing. In an ideal situation, cars (which are not used for up to 23 hours a day) would be plugged into the grid, as much as pos-sible. This would create a better balance between supply and demand, with both a central and local management system, monitoring network capacity, user’s individual wishes regard-ing the fuel price, and when they would need a fully charged battery. Automated management systems would be able to make better use of wind energy, with its fluctuating level of supply, thus, decreasing the dependency on gas power sta-tions which are currently being used for enlarging flexibility in energy supply.
The disadvantages: less flexible in use
The disadvantages of electric driving have to do with the limited range of electric vehicles and practical problems around charging. The energy density of batteries is such, that a sizeable and expensive battery system (the aim is for 1 kg/ km) would be needed to achieve a range of a few hundred kilometres, and it takes several hours to recharge. Although most daily distances could be driven on one fully charged battery, the need to recharge would be a handicap for longer trips. Solutions are being sought for solving this problem, and a workable alternative will become commercially available in the short term: the so-called plug-in hybrid. This vehicle could, for example, drive electrically for 50 kilometres, after which a switch is made to conventional fuel combustion. In this way, a CO2 emission reduction of over 50% is achieved. However, these two propulsion systems make this type of vehicle relatively expensive. Other solutions could be found by expanding the options for sharing or renting vehicles for longer journeys. Currently, a system is being developed for fast-charging electric vehicles at specific charging stations. Technically, today’s batteries could not cope with such a
system, however, the industry and researchers are aiming for charging times of five to ten minutes. In addition, develop-ers are also working on battery-swapping stations where flat batteries could be swapped for fully charged ones, within minutes. However, this would require standardisation, and it would limit car manufacturers’ options for fitting a sizeable battery packet into the vehicle where it would take up the least possible room.
The price tag in the long term: dependent on user-friendliness
The costs of electric driving are expected to be lower than those of conventional or hybrid vehicles, by between 2020 and 2040 – even if there would be no difference in taxation per kilometre. It is the battery price that largely determines the price of electric vehicles. According to the literature, battery prices could drop to between 150 and 300 euros per kWh storage capacity, on the assumption that, in the future, there will be enough lithium available – an important element in the most promising types of batteries. As increased battery capacity would mean an increased range, this would make electric driving not only more user-friendly, but also more expensive. The same applies to plug-in hybrids. However, once fast charging at acceptable prices in under five minutes becomes a reality, with a system that is available throughout Europe, not much will stop electric driving.
Short-term barriers: the charging facilities
Looking at production costs and fuel prices, electric driving in the next ten years could be expected to become more expensive than driving conventional vehicles. However, from a consumer point of view, this is not necessarily true; taxation on fuel is higher than on electricity. Moreover, several policy instruments also apply to electric vehicles: no tax on private vehicles and motorcycles, and no VRT (Vehicle Registration Tax) or road tax. Therefore, the costs to consumers are about the same as for driving conventional vehicles (at a petrol price of 1.60 euros per litre). In addition, certain companies are developing a system for leasing batteries, which removes the investment barrier, and places certain battery lifespan risks elsewhere (for there is no vehicle at the moment that drives around for fifteen years with the same battery). However, one of the conditions would have to be that consumers can recharge their batteries at home, as well as at various other locations. Today, less than half of all vehicles are being parked at or near peoples homes; if motorists have no guarantee that they can either charge their cars near their homes, near their workplace or elsewhere convenient, than this could become a major barrier to electric-vehicle sales.
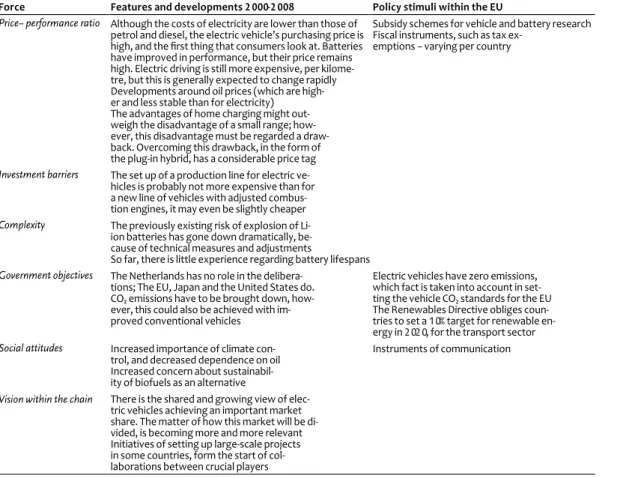
European policy impulses are aimed at the automotive industry
The barriers for consumers also largely determine the choices made by the automotive industry to market electric vehicles. European regulation provides few impulses; although electric vehicles could help to achieve the expected CO2 standards and the 10% target for renewable energy in transport, they are not essential for achieving this. Without specific rules and regulations on the subject, the industry will be less motivated to develop and manufacture electric vehicles. The design of battery lease plans will cause vehicle manufacturers, battery manufacturers, electricity companies and the companies that supply the charging facilities to enter into certain agreements.
For consumers, leasing these batteries would require specific attention to how the risks are covered regarding lifespan of the batteries, a situation for which there is no practical experi-ence to draw on.
Introduction 11
Progress of transition
1.1
In 2001, the fourth National Environmental Policy Plan (NMP4: VROM, 2001) gave a policy impulse towards changing systems, in the long term, to overcome persisting, environ-mental problems. The policy plan also instigated various policy actions, which have shaped the term transition man-agement within the context of sustainable development. In 2005, an interdepartmental directorate for energy transition was set up, enabling an improved management of the transi-tion process across the various government departments. In consultation with all the ministries involved, the Netherlands Environmental Assessment Agency published a first evalua-tion in 2006, of the progress of the transievalua-tion process, and of the role of policy, based on an analysis of six system options. In addition, in 2008, a report was published on solar energy in domestic housing.
The seven system options and the summarising reports are: Liquid biofuels (Ros and Montfoort, 2006);
‘Green’ services in agriculture (Reudink
et al., 2006); ‘Green’ bio-feedstocks (Van den Born and Ros, 2006);
Fish feed for aquaculture (Rood
et al., 2006);
Fuel-cell vehicles on hydrogen derived from concentrating
solar power (Nagelhout and Ros, 2006);
Micro co-generation and the virtual power station (Elzenga
et al., 2006);
Transition processes in connection with the role of policy
(Ros et al., 2006b);
Solar energy in the living environment (Montfoort and
Ros, 2008).
In this report, we present an analysis of eight system options built around electric driving.
The development of a better system for the long term, has received extra attention through the fourth National Environmental Policy Plan (NMP4), but the NMP4 was not the start of it. Numerous research programmes were already underway, and there were many ideas on new institutional design, as well as many policies influencing them, directly or indirectly. Looking at developments of the last years would be pointless without considering this context. Moreover, there are many relevant international developments. Therefore, starting point for the evaluations was the actual progress of these processes. This included an indication of the incentives presented by Dutch policy, and their effectiveness. In their
pre-developmental phase, transitions are target-seeking processes.
Without any clear targets, it is hard to determine what should be monitored and evaluated. We searched for an approach in which the evaluation could be narrowed down to concrete elements in the transition process. This led to a choice of system options as a starting point for determining any progress. A system option shows how part of a future system could look; it forms a potential target. The evaluation focuses on the process of realising a particular system option, and on the conditions required to cash in on its potential. This gives the evaluation a somewhat backcasting character. In the formulation of end conclusions, one has to consider that alternatives – supplementary or competitive – within the broad transition process, are also being developed.
This report focuses on three elements:
an estimation of the potential of the new technological
system – that is, the highest achievable application, within reason, for the long term (around 2050);
an assessment of the effects of the implementation of the
system option, compared to those of the existing, fully developed, system;
an analysis of the current process of realising the system
option, and the role of policy within this process.
The system option of electric driving
1.2
This report describes the system option of electric driving, and evaluates the activities and policy around it. Electric driving, in this report, encompasses not only the all-electric vehicle, but also the plug-in hybrid. The latter charges its battery from the power grid, with which then tens of kilome-tres could be driven before an internal combustion engine would take over. Hybrid vehicles that are currently on the road – which have a battery supporting the internal combus-tion engine – are only mencombus-tioned indirectly. The same applies to the fuel-cell vehicle which was discussed in an earlier publi-cation (Nagelhout en Ros, 2006). Our current report describes not only the developments of the vehicle, but also the set up of the entire system around it. The data in this report were based on literature research and interviews with actors who were working on batteries, electric vehicles and the power grid.
Work method and reader
1.3
For this report, the evaluation method for transitions were used, together with the indicated building blocks, as set up by the Netherlands Environmental Assessment Agency (Ros et
al., 2006a; Ros et al., 2009).
First, it is important to have a description and, especially, a definition of the regarded system option, which together form the picture of the possible future, provided in Chapter 2. This entails the coherent combination of techniques, proc-esses, institutions and structures. The attitudes of the various actors are partly determined by the potential and possible effects of the system option. Therefore, Chapter 3 focuses on the highest achievable application, within reason, and its effects, especially on CO2, local air pollution, safety, noise, feedstock supplies, and costs.
Evaluations of environmental policy are mostly based on monitoring of emissions, environmental quality, and where possible, the effects on nature and human health. However, in the case of running transitional processes, the intended changes in these areas are achieved only in the long term. Therefore, policy should focus, first, on the pre-development of such a process of change, in which the following activities are assumed:
the development of a sense of urgency, based on the per-
ception of the problem;
the development of a joint vision for the future;
researching and developing new technologies and
institutions;
carrying out practical experiments for parts of the new
system, or for the set up of certain niches. Chapter 4 lists the actual developments in the pre-de-velopment phase of the transition over the past years. It states the activities in this area and the corresponding policy actions, and discusses the coherence between the developments. Special attention is given to the correspond-ence between the cycle of ‘creating vision→Research & Development→experiments’, aimed at the long term, and the cycle of ‘action orientation→creation of markets and niches’, which is aimed at the short term.
Chapter 5 discusses the degree of motivation that is gener-ated by the activities in the pre-development phase and by government policy, and whether these fulfil the needed pre-conditions for implementation of the actual system change. To research this, crucial actions were identified which could lead to investments in production capacity. Subsequently, all factors were combined in a force field analysis. Chapter 6 contains conclusions on the possible effects, the progress, and the influence of Dutch policy.
The appendix presents a list of the people who were inter-viewed for this study. We appreciate them providing their time and expertise.
Description of the system option: outlining the future 13
Short outline of the basic idea
2.1
This chapter provides a look into the future. What could a system of electric driving look like, around 2050? The exact year is unimportant, it just needs to be far enough into the future so that a substantial system innovation would seem possible, without it being too far away, becoming more like science fiction. We have not attempted to provide a detailed blue print of the future system, because there simply would be too many possible variations on such an optimised system. It is an outline, indicating the many things involved in a pos-sible realisation of the system.
Contrary to conventional vehicles, which have internal combustion engines running on petrol, diesel or gas, electric vehicles operate electric motors which run on electricity provided by a battery. Electric vehicles have the advantage of causing considerably less stress on the local environ-ment, and of being more energy efficient than vehicles with internal combustion engines. That makes this system option interesting – even without considering how the electricity would be generated. This system option assumes that, in the long term (by around 2050), an important number of today’s conventional vehicle drivers, will be driving all-electric vehicles. Another part of the motoring population is expected to be driving plug-in hybrids, vehicles which drive part of the journey on electricity. Local freight traffic would mostly be covered by electric vehicles such as vans and small trucks, quietly and cleanly driving around town. This study did not consider heavy freight trucks, as these are thought to be less suitable for driving on batteries, because of the weight and size of the required battery.
This system option also includes the charging system used by motorists, and the anticipation of possibilities of future electricity supply. For instance, batteries could be recharged mostly during the night, using the overcapacity in electricity generated by wind turbines. Another possibility would be a link with locally generated electricity (solar PV), or to have solar energy from the Sahara Desert transported through a
High-Voltage Direct Current (HVDC) system. In addition, there would be fast-charging points/battery swapping stations,
especially along motorways, charging facilities near public car parks, and near domestic parking areas reserved for motorists without a garage or other charging option at their homes. Electric vehicles appear to be most suited for short and medium-range distances, because of the weight and purchas-ing price of the batteries. Assumpurchas-ing that users will travel longer distances, too, means that any future system would need to include either fast-charging and battery-swapping facilities, or offer an easily accessible, readily available, pool of rental or shared vehicles, for instance, based on hybrid technology. Advantages to the local living environment, of electric vehicles of all variants between bicycles and cars, could lead to a relatively large accessibility of inner cities for electric traffic.
Changes in the structure of production
2.2
The automotive industry is characterised by a limited number of factories that produce the vehicles, and a large number of companies that supply them – some of which in alliances with the vehicle manufacturers. However, parts which are needed for conventional vehicles, such as combustion engines, petrol tanks, exhaust systems, catalysts, starting motors, and transmissions, are all not needed in electric vehicles. Instead, they need electric motors, chargers, and of course batteries for the power supply to the vehicle. In short, this means that the structure of the production in and around the automo-tive industry would need to change. Moreover, besides the existing infrastructure for the distribution of liquid or gaseous fuels, there would also be a need for coupling facilities for connecting vehicles to the grid. Furthermore, additional elec-tricity would have to be produced, and that in a clean manner, to prevent transferring part of the emissions elsewhere.
The passenger car 2.2.1
For a proper understanding of the subject, a few words on the passenger car are necessary. The hybrid vehicle which entered the market over ten years ago (‘Prius’), and for which sales figures are currently growing, has a battery that is charged through the combustion engine. This battery
Description of the
system option:
enables the vehicle to use fuel in the most efficient way. Also, because of the battery application, the vehicle’s motor can be lighter (more economical). However, this hybrid can only run on electricity for a few kilometres. There are also certain hybrids – already on the market, and in development – with only one particular feature, such as a stop-start system that saves energy by turning off the motor when the vehicle is stationary, or regenerative braking, a system through which electricity is fed back into the battery.
The plug-in hybrid, however, is much more advanced. It has a large battery which is charged from the power grid. Depend-ing on the size of its battery and some other aspects, this vehicle can drive tens of kilometres on electric power, and then switch to fossil fuel. It is also possible to use part of the remaining battery capacity in the same efficient way as regular hybrid vehicles do. Plug-in hybrids also come in several types; there are vehicles with two complete propulsion systems, and hybrids with a small, constantly running com-bustion engine that, when required, functions as a generator supplying electricity to the battery and the electric motor that drives the vehicle (the extended range electric vehicle, such as the future Chevrolet Volt). Another future option could be an electric hybrid with not only a battery, but also a fuel cell and a hydrogen tank.
An all-electric vehicle only has a battery and one or more electric motors, and relies fully on electricity from the power point. A comprehensive overview is provided by Passier et al., 2008.
The battery 2.2.2
The success of electric driving depends on the improvement of the battery, because this determines the price and user-friendliness of the vehicle. As early as around 1900, there were vehicles on the road that were partly or fully driven by electricity. Their demise was caused by a range and top speed that were too low (and they made too little noise!).
A battery consists of one or more cells; a cell is formed by two different electrodes – an anode and a cathode − electrolyte and a separator in the electrolyte. This chemically stores the energy. The combination of anode, cathode and electrolyte
varies per battery type. Batteries are often named for their main combination of chemical elements, such as lead, nickel, cadmium, cobalt, hydrogen and lithium. Batteries have to meet various requirements; the ideal battery has a high energy density (low weight and small size), can deliver a lot of power, be charged quickly, has a long lifespan, and is safe and cheap. The importance of the various requirement depends on the intended use of the battery. For hybrid vehicles, the emphasis is on delivering a (short) strong burst of power. For electric vehicles or plug-in hybrids, the energy density is of major importance (the amount of energy that can be stored per kg).
The balance between energy density and power density can vary slightly, through the choice of cell size and the set up of the total battery system. Figure 2.1 shows the characteristics of a number of battery types (Mulder and Wagemaker, 2008). Currently, hybrid vehicles use NiMH (nickel metal hydride) batteries (H ions flow between anode and cathode), and the market is expanding. For the coming decades, batter-ies containing lithium (Li-ion batterbatter-ies) are generally seen as the most promising choice for electric driving. The current Li-ion battery has a much higher energy density than the NiMH battery. However, Li-ion batteries are susceptible to overcharging; to expand its lifespan, a battery management system is required, which constantly monitors the condition of the cells (Notten, 2006). There are several other battery types containing lithium, such as the Li-ion polymer battery, which is flexible and even lighter than the Li-ion battery; and the lithium iron phosphate (LiFePO4) battery, which is cheaper than the conventional Li-ion battery, but also has a lower energy density. The latter has a longer lifespan, because the LiFePO4 is more stable than other electro materials. This enables frequent charging and discharging of the battery. The average lifespan of a passenger car is fifteen years, and, ideally, this should also apply to its battery – especially seeing the current and future battery prices. A battery which delivers the energy for 250 kilometres of driving per charging cycle, with a lifespan of 2000 charging cycles, would enable 500,000 kilometres of travel. A speculative option for used batteries, once they loose too much of their charging capacity to be used in vehicles, would be to use them for electricity storage.
Figure 2.1 10 100 1000 10000 Power density (W/kg) 0.01 0.1 1 10 100
1000 Energy density (Wh/kg) Battery systems Lead acid Ni-Cd Ni-MH Li-Ion Ultracapacitors Double-layer capacitor Al-Electrolytic capacitor
Description of the system option: outlining the future 15 For new generation Li-ion batteries, there is the important
aspect of their improved safety, which has removed the major bottleneck of their previous inflammability.
Apart from the battery, which chemically stores energy, there is also the so-called ultracapacitor (or electrochemical double
layer capacitor) for physical storage of electricity. It has a relatively low energy density, which makes this technology less suitable for storage in vehicles. The advantage of ultraca-pacitors, however, is that they can be fast-charged and can release their power quickly, which could enhance a system’s performance.
The electricity supply 2.2.3
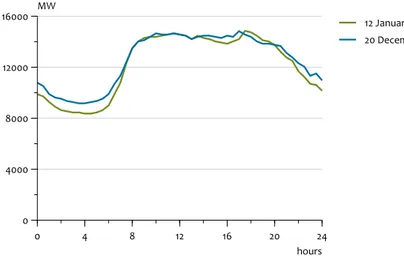
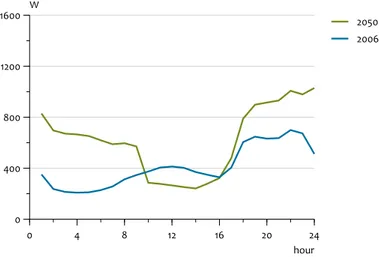
For the Netherlands, the electricity demand of all mostly electric vehicles, in the future, could go up to between 10 and 15 TWh per year, or 10% of the total electricity demand. This means not only that the supply of electricity will have to be attuned to this demand, but also that this offers opportuni-ties for improving the balance between supply and demand. In winter, the greatest demand for electricity is during the daytime and early evening, see Figure 2.2 (TenneT, 2008). If, in a manner of speaking, everyone would purchase an electric vehicle tomorrow and charge it only during the night, a large part of the needed electricity could be supplied by the existing installations. For there is a large difference between the demand during the day and during the night, the so-called peak hours and off-peak hours. However, the low-voltage network is not geared to situations of everyone charging a battery at the same time. Using several scenarios, KEMA (electrical safety testing and certification company) esti-mated the daytime and nighttime electrical activities of the average household, in a few suburban districts, differentiating between summer and winter. Activities ranged from the use of air conditioning, heat pumps, micro cogeneration, to solar energy, but also to upcoming electric driving activities (De Boer and In ‘t Groen, 2009). Figure 2.3 shows an example of these calculations, indicating the current daytime electricity use for an average household, in an average suburb, com-pared to their expected use by 2050. In this comparison, a future penetration is assumed of 50% for heat pumps, 10% for air conditioning, and 40% for electric vehicle use (being 60 to
75% of all households). In this figure, it is assumed that electric vehicles are being charged between 23:00 hrs and 05:00 hrs. By 2050, in this example, nearly 40% of the suburban electric-ity demand would be spent on electric driving.
If, in today’s suburban areas, nighttime charging would be managed to spread charging over time, the low-voltage network would be able to cope, in the medium term. This would require an automated central management system. However, by 2050, when every vehicle requires charging, extra investments would be needed. This moment of extra investment could be delayed by offering attractive options, such as charging points in car parks, so that vehicles can remain plugged into the grid anytime they are not driving. Building a new, low-voltage network in an existing urban area is very expensive. This is different for new urban areas, where such facilities could be built in from the start.
At night, relatively cheap coal and nuclear power stations currently cover basic power needs. During the daytime, more expensive, gas-fired power stations chip in. In the near future, much capacity will be added in the form of wind energy; wind turbines also work at night, when demand is low. Wind energy could be used more efficiently, if electric vehicles were charged during the night. Moreover, for electricity compa-nies, electric driving also offers the advantage of being man-ageable. For balancing supply and demand, this means that the dependence on gas-fired power stations could decrease. Electricity companies could communicate with their custom-ers through a specific communications system, to come to an agreement on the specific time whereby a vehicle would need to be recharged to a certain capacity, and at which price (Postma, 2008a and 2008b; Better Place, 2008; Lowenthal, 2008). Also, for plug-in hybrids, deals could be made, for instance, about not fully recharging when the station’s capac-ity is low or when the price is too high; in which case the vehicle’s combustion engine would be used more (Kintner-Meyer et al., 2007).
And then there is the option for charged batteries to supply electricity to the grid at peak hours during the daytime (vehicle
to grid), or the even cheaper alternative of using surplus energy in the home. Opinions vary on whether this would be
Figure 2.2 0 4 8 12 16 20 24 hours 0 4000 8000 12000 16000 MW 12 January 2006 20 December 2007
a viable option, because of the home adjustments that would need to be made.
Charging options are various; around 30% of Dutch citizens have a garage (though not often used for parking vehicles), or carport, and some motorists can park their vehicle on private property. Apart from these options, a network of charging points would be required: along streets, in car parks, and at the workplace. In the long term, current filling stations would convert to offering electricity from fast-charging points. Table 2.1 provides an overview of the charging options, the conditions, and the advantages and disadvantages. General conditions would consist of standardisation and a solid privacy-proof gauging and payment system.
Adjustments to mobility behaviour
2.3
Batteries take up space within vehicles. However, it is assumed that, in the future, the space available to passengers and luggage will remain at today’s level, because batteries (flexible in shape) can be positioned anywhere in the vehicle, and – in all-electric vehicles – some conventional motor parts will be left out. Limitations could only arise if robotic battery-swapping systems were used. The vehicle would still be as reliable as it is today, the comfort would be enhanced by the quiet motor, the acceleration would be faster than that of vehicles using petrol, and the safety of the battery would be no different from that of the current ones used in conven-tional petrol systems.
The electric vehicle would be attractive to consumers if, just like today, there is sufficient choice between small and large vehicles. Looking at the pricing of the batteries, it seems likely that consumers will be able to choose between vehicles which have either short or long ranges, or which perhaps are customised. Electric driving could be fitted in various ways, to meet people’s mobility behaviour. As ranges of at least 300 kilometres would need to be covered, and the battery packs that meet this demand will remain expensive, it is reasonable to assume that – for longer (business) trips and
holidays – fast-charging options will be a practical option (most sources speak of five to ten minutes per charge, which is a little slower than conventional fuel fill-ups). Research has shown that many people want to arrive at their destinations as quickly as possible, and that they ignore the advice to take two-hourly breaks (Belvilla, 2008). On this point, therefore, users of all-electric vehicles could feel limited.
Instead of owning long-range vehicles, a suitable alternative could be an advanced and easy-to-use system of renting or sharing such vehicles (hybrids or plug-in hybrids). Having to get used to another vehicle, could be a disadvantage of such a system; however, an advantage would be that, even into the far and distant future, batteries could be recharged any-where. It is possible to tow a caravan or trailer with an electric vehicle (using a high torsion bar), if the electric motor was designed to prevent overheating. It would, of course, shorten its range, but this also applies to vehicles that operate com-bustion engines, and there are other transport options to use, such as bording a car train.
In 2050, just like today, the choice of vehicle will depend on several things: family composition, income, vehicle price, commuting distance, local amenities, and required space within the vehicle (for extra passengers, holidays or trans-porting goods). When households use two or more vehicles, it stands to reason that one of them is electric. For single households or one-car households, the choice for an electric vehicle seems less certain, as they would also, occasionally, wish to travel longer distances.
Table 2.2 provides an overview of the main options.
According to CBS (Statistics Netherlands), the Netherlands has 5.3 million commuters per day, covering an average distance of 17 kilometres. Of these commuters, 2.8 million travel by car, over an average distance of 22 kilometres (one-way trip) (CBS, Statline). Please note that these are averages; the apportion-ment is unknown. Worldwide, most commuter trips appear to stay under 50 kilometres, as do a large parts of daily trips (Kendall, 2008). Vehicles are also used for study travel, busi-ness, shopping, visits, and holidays. The usual pattern is that of occasional longer trips, combined with mostly short trips,
Figure 2.3 0 4 8 12 16 20 24 hour 0 400 800 1200 1600 W 2050 2006
Description of the system option: outlining the future 17
Charging options in a future system
Charging principle Conditions Advantages and disadvantages
Power point at home Own garage, or carport, or
park-ing space on private property Possible at night
Charging point in suburb Right to a parking space with
charg-ing point close to home; Suited to low-voltage network; Vandal-proof
Possible at night
Charging point in car parks,
also at the workplace Decreases the needed range;Mostly during the daytime
Fast-charging points at charging stations Specific facilities for high energy density Relative short recharging times;
Possible en route; Mostly during the daytime; Fast charging produces much heat, which is bad for the battery; Cooling advisable
Changing battery packs at swapping stations Charging capacity at swapping stations;
Standardised packs and stand-ard fitting in vehicles, needed for robotic swapping method; Robotic system for swapping, storage and recharging
Recharging takes a relatively short time; Storage and charging takes up much space; Decreases space in smaller
vehi-cles that use small batteries
Charging lanes along roads System for safe coupling of
ve-hicles to charging cables Charging en route saves time (benefit dependent on actual charging speed); (too?) high investments
Table 2.1
including on weekends (CBS, Statline). It is thought that more than 99% of passenger cars cover less than 300 kilometres per day (Goodspeed, 2009).
Electric driving is especially suited to short-distance travel, such as within cities. This travel does not have to be by car; methods of transport change constantly – think of the options that already exist, such as electric bicycles, Segways and scooters.
Institutional changes
2.4
This system option requires some technological and institu-tional changes. Some of these changes are highlighted below.
Much in the way of batteries is still under development.
Grid management requires a certain amount of standardi-sation, essential to the charging of batteries. In the future, charging a battery (fast or not) and paying for the amount of electricity should become possible throughout Europe, which requires a standardised system.
With the introduction of electric driving and nightly charg-
ing, power companies will have less overcapacity during the night (and summer), which will lead to different work routines (e.g., maintenance schedules).
Ultimately, taxation imposed on traffic participation is
expected to be the same for everyone; if revenues from fuel taxes decrease, this could lead to higher
electric-ity prices for motorists (and not for households without electric vehicles).
Vehicle manufacturers, garages, and emergency services,
all will have to adjust their areas of expertise; working on an electric vehicle requires other and extra skills in the field of electronics. This would not only apply to vehicle-repair shops, but also to ambulance workers, the police and fire brigade.
Garages would work less on all-electric vehicles as these
have less wear and tear on parts and, therefore, require less maintenance and repair.
For owners of small electric vehicles who infrequently
need a larger vehicle, existing rental systems would have to be expanded. This also applies to vehicle-sharing systems.
The current battery recycle system would also need to
expand to include Li-ion car batteries.
Spatial planning
2.5
Within cities, there would be fewer fast-charge station than there are now filling stations, because recharging would be done mainly at home, during the night. As not everyone has private parking next to their home, other charging facilities would have to be set up, such as along streets or in car parks, with safe and vandal-proof systems. The charging stations along motorways would need to be larger than they are now (charging a battery takes more time than filling up with
Some options for private use of electric vehicles
Situation Short distances Medium-range distances Long distances
Households: two vehicles Small electric vehicle Plug-in hybrid
Small electric vehicle Hybrid
Large electric vehicle Hybrid
Plug-in hybrid Hybrid
Two plug-in hybrids (possibly with different ranges)
Households: one vehicle Small electric vehicle Sharing or renting system, or public transport
Large electric vehicle Sharing or renting system, or public transport Plug-in hybrid
petrol), and for battery-swapping stations, this need is even greater. Another aspect would be that, within urban environ-ments, from a safety point of view and compared to conven-tional petrol stations, charging stations probably would be easier to build. Vehicles could also be recharged in car parks at people’s workplace or in public car parks. To improve the quality of the environment, electric vehicles could receive preferential treatment regarding access to the inner city (easy access to parking facilities, such as in London and Oslo). Such preferential treatment, however, would only be needed in the transitionary phase; at full implementation of electric driving this would no longer be necessary.
Important actors
2.6
Several parties will be involved in the realisation of the system option. For some, their positions will be strengthened, while others will experience a weakening or will have to change their role. And then there are parties specifically needed to achieve the transition. A brief impression:
The automotive industry will need to make adjustments;
first to one model, later to more. Running investments, such as in conventional combustion engines, may need to be written off sooner than expected. Opportunities will arise for new participants from the world of electronics. Battery manufacturers will experience a fast growing
market.
Power companies and grid managers can also expect an
expansion in their field of work.
IT companies will supply knowledge, needed to manage
electricity supply and data communications.
Garages will do less of their current work, and do another
type of work.
For universities, often in collaboration with commer-
cial companies, there is much fundamental and applied research to be done.
Oil companies will lose part of their market share.
District councils will facilitate the realisation of charging
points.
Consumers have to start purchasing.
Central government can ease the transitional process by
removing obstacles.
The following chapters will elaborate on most of these actors.
Relation with other researched system options
2.7
Electric driving is one of the alternatives to current – fossil fuel driven – vehicles, for achieving substantially cleaner modes of transport. In addition, there is also the use of biofu-els and fuel-cell vehicles on hydrogen. These modes of trans-port can be partly supplementary and partly competitive. The related system options are given in the overview in Section 1.1. For local electricity generation (solar PV or micro cogen-eration), the unused electricity could be stored in batteries, instead of fed back into the grid. Another report on local energy systems is due to be published (Faber en Ros, 2009).
Judging potential effects of this system option 19 A system option becomes more interesting if it harbours
solu-tions to large, social problems. However, changes at system level can be so far-reaching, that any possible effects could only be judged by using a wide approach. Therefore, this chapter starts with a general, qualitative discussion, using an assessment scheme that was taken from the sustainability matrix (VROM/NSDO, 2002), before carrying out a qualita-tive analysis on certain specific issues. To judge something as being ‘better’ or ‘worse’, a reference is needed – in this case, we took the system currently dominating road transport: that of the combustion engine running on fossil fuels. We also took into account a future, further improvement of existing vehicles on petrol and diesel. The aspects of safety, noise, climate effects, air pollution, costs, and raw materials, will be discussed in separate sections.
Safety
3.1
Without specific built-in modifications, electric driving would create diminished road safety for cyclists, pedestrians, the blind, and children, because these road users rely partly on sound as a warning system of approaching traffic. They would hear the approach of quieter electric vehicles at a much later stage. According to the Gezondheidsraad (the Dutch Health Council), however, this problem would not eventu-ate, as there are indications that ‘when road-traffic changes occur, the risk of accidents goes down, at least temporarily’. (Gezondheidsraad, 2008). Nevertheless, research has shown that quieter trams and the use of mp3 players both lead to a slight increase in road accidents (Stoop, 2008). Moreover, practical research by Mitsubishi in cooperation with TNT post also indicated that lack of noise leads to dangerous situations. There are suggestions for installing small loudspeakers on the exterior of electrical vehicles, producing a swishing sound or other identifiable sound (such as ringtones of mobile
Judging potential effects
of this system option
3
Electric driving sustainability test
Social Economical Ecological
The Netherlands Noise Energy security1) Local air pollution
Safety Acidification
Landscape3)
User-friendliness GDP2)
Purchasing power
Elsewhere Food security Natural resources Land use4)
Nature value/biodiversity Climate effects
1) Security of supply has increased by a decreasing dependence on oil. After all, electricity can be generated from various
sources. The dependence on gas in electricity production is also decreasing, as gas is specifically used for additional generation of electricity when demand peaks, and these peaks in demand are expected to level off. Another aspect of security of supply is the risk of power failure – which is not such a hot item in the Netherlands – and is less acute because of the possibility of storing electricity in batteries (V2G).
2) Refineries are becoming less important. Batteries will probably be manufactured mostly in the Far East, but there are
opportu-nities for the Dutch automotive industry to manufacture parts for electric vehicles (analogous to CENEX-ARUP, 2008), as is also the case in the current automotive industry.
3) At night, much electricity could be supplied through the existing power grid. Once electric driving would be fully
imple-mented, an expansion of the grid could possibly be needed, with accompanying adverse effects on landscape. However, it is assumed that much of the future demand for electricity will be generated locally, so that an expansion of the grid might not be necessary.
4) A large application of electric driving could cause a decrease in the use of biofuels. Applying biomass in electricity generation
would be much more efficient as it would lead to decreased land use (less biomass per kilometre).
Table 3.1
phones). However, emitting a less-than-modest sound would create a trade-off with the subject of the following section. As indicated earlier, it is assumed that another potential safety aspect – the inflammability of certain Li-ion batter-ies – could be solved by technical management measures and inherently safer combinations of materials. In addition, emergency services are also expected to know how to handle electric vehicles.
Noise
3.2
Surveys show that road traffic is the most important source of serious noise nuisance. The number of people affected has remained constant over the period from 1993 to 2003. Scoot-ers cause most of the noise (19%), followed by motorcycles (11%), and trucks (10%). With only 6%, passenger cars score below nuisance from neighbours or neighbourhood activi-ties. The percentage of people affected by noise nuisance from passenger cars has decreased (Franssen et al., 2004). Depending on noise level and duration, noise nuisance can lead to sleep disturbance, bad school results, high blood pres-sure, and cardiovascular disease (Berglund et al., 1999). In the Netherlands, an assumed 12 percent of the adult population is believed to suffer from serious sleep disturbance caused by road-traffic noise. Up to 270,000 people suffer from high blood pressure caused by traffic noise (Knol and Staatsen, 2005), leading to cardiovascular disease. Please note that
traffic noise is a broader category than road-traffic noise. Measuring noise according to road type shows that 50 km/h zones score the highest (Franssen et al., 2004). Noise from traffic is determined by the vehicle engine, its tyres and the road surface. For passenger cars, their tyres start to cause noise nuisance at speeds from 40 km/h; at lower speeds, it is the engines which cause noise nuisance, especially during acceleration and changing gears. A shift towards electric passenger cars and plug-in hybrids (when driving electrically), and especially also electric mopeds, scooters and motorcy-cles, could mean that noise nuisance within cities largely dis-appears. In addition, adverse health effects would decrease substantially, although noise nuisance from motorways would diminish only partly.
Energy and climate
3.3
With 25 Mt CO2 eq/y, Dutch road traffic covered in this system option, currently adds around 12% to greenhouse gas emis-sions. Passenger cars currently on the road emit an average of 170 g CO2/km. Although traffic is expected to increase further, the emission factor for conventional petrol and diesel vehi-cles is expected to drop. This could happen relatively soon, because of improvements to tyres, aerodynamics, lighting, material reductions and substitutions. In addition, changes could be made to engines, such as a large-scale introduction of variable valves, turbos, and compressors. All together, this could mean an average efficiency improvement for all vehicles, of over 30% (OECD/IEA, 2008a; King, 2007; Heywood, 2008). Since 2002, vehicles have become around 1.5% heavier, because of added safety precautions and increased comfort
demands, and this trend is expected to continue at least up to 2012 (Smokers et al., 2006). In addition, since 1998, Dutch motorists have scaled their class of vehicles up a notch (KiM, 2007), and it is unclear if this trend will continue. Such a devel-opment will greatly influence the total in CO2 emissions, but in the comparison of vehicle types it is less important, as the development probably also would apply to electric vehicles and hybrids. A number of expected improvements, such as those in aerodynamics, tyres and lighting, will also apply to plug-in hybrids and electric vehicles. The hybrid, with a battery that is charged through its combustion engine which optimises fuel use, has an additional reduction in CO2 emis-sions of around 15% (OECD/IEA, 2008a).
Please note that, by 2050, conventional oil will have been partly replaced by non-conventional oil from tar sands, and gas or coal. On a well-to-wheel basis, these fuels are over twice as carbon intensive as current fuels (OECD/IEA, 2008a). Greene estimated a market share of 10% in a reference sce-nario for 2030, and a share of 20% in a high oil-price scesce-nario (OECD/ITF, 2007). In addition, the market share of biofuels may increase further.
Energy efficiency is higher in a system of electric driving, than in a system that uses petrol or diesel. Although the efficiency of a power station is less than that of a refinery, this is amply compensated by the electric motor’s more efficient conver-sion to kinetic energy, compared to the combustion engine. This difference increases even further for processes of liquid fuel production (including biofuels) that require more energy, as is the case with feedstocks such as coal or biomass (Eick-hout et al., 2008).
The direct greenhouse gas emission factor for electric vehi-cles is nil. Any greenhouse gas emissions, across the entire chain, depend strongly on the efficiency of the battery, and on the CO2 emission from the production of electricity needed for charging it. With current electricity production within the Netherlands, greenhouse gas emissions of less than 100 g CO2 eq/km from electric vehicles are considerably lower than those from conventional vehicles.
What will electricity supply be like, around 2050? Although they are an important part of this system option, this report does not explicitly discuss the technological variants. Assum-ing that a global emission reduction of 25 to 60% is needed, compared to 1990 levels, for reaching climate targets (Van Vuuren et al., 2006; OECD/IEA, 2008a), then an emission factor would be needed of certainly less than 100 g CO2 eq/kWh. This could even go down to zero or be negative (by application of biomass and CO2 storage), if measures in other sectors (such as transport) turn out relatively expensive, causing electric-ity production to be taken a step further. This could also be necessary, if the demand for electricity rises, substantially. In the case of stringent CO2 reduction in electricity production, the emission per kilometre would end up to be 80 to 100% below that from the future, economical hybrid. For plug-in hybrids, CO2 emissions depend on the distance that is driven on electricity, instead of on fossil fuel (part biofuel). Determi-nants are battery capacity, number of kilometres per trip or day, and charging frequency. It is assumed that around 60 to 70% of kilometres are driven electrically, with batteries that
Judging potential effects of this system option 21 allow for 50 kilometre trips (OECD/IEA, 2008a; Kromer and
Heywood, 2007).
What could be the share of electric vehicles in total road traffic of light vehicles? Table 3.3 provides some indication. The starting point was an estimation of the number of vehi-cles that currently travel less than 100 km/day and 250 km/ day, and their share in the total kilometres driven. For plug-in hybrids, there would be no limitation on the number of vehi-cles – not even for holidays – just on the number of kilome-tres. When, occasionally, longer distances would be covered, we assumed the use of fast-charging stations or battery-swapping stations, or rental vehicles or sharing vehicles. This would concern only a small number of vehicles, but – rela-tively speaking – more kilometres. The increasing lifespan of vehicles was also taken into account.
A large demand for electricity to charge electric vehicles could change the balance between supply and demand over the course of twenty-four hours. Batteries could be charged mostly during the night, especially if home-charging would be the norm. This depends on the possibilities of home-charging, vehicle price differences between the various ranges, and any differences in tariffs. A predominately nighttime demand
for electricity could influence the choice of the optimum technology package for electricity generation. For example, the option of using wind energy more efficiently, with its rela-tively large nighttime supply, is often mentioned. Thus, elec-tric driving offers the possibility of using both wind energy and running coal-fired power stations, during the night, five percentage points more efficiently (CENEX-ARUP, 2008) Table 3.4 shows an estimation for a possible technology package, dividing night and day.
Local and large-scale air pollution
3.4
With a switch to electric (or hydrogen) vehicles, exhaust emis-sions from road traffic would go down to zero. This would cause PM2.5 concentrations in the Netherlands, by 2050, to drop by an average of 0.6 μg/m3 compared to 2030, and in busy streets this could even go down to 1.5-3 μg/m3. It would mean a reduction of 10% in the contribution from anthropo-genic sources to average PM2,5 concentrations in the Neth-erlands; and in busy streets this could even be between 15 and 30%. Compared to the expected reduction for the period between 1990 and 2030, this reduction is relatively small, because vehicles that meet Euro 6 standards already have low
Estimation of CO2 emissions from certain types of vehicles, now and in 2050
Electricity mix1)
2050 NL 2004 NL 2005 EU15
Current conventional vehicle 170
Conventional vehicle 2050 1202)
Hybrid 2050 952)
Plug-in hybrid 2050 502) 90 85
Electric vehicle 2050 10 75 60
1) Emission factor for electricity production (in CO
2 eq/kWh) in the Netherlands; in 2004, according to the Energy report of
the Dutch Ministry of Economic Affairs: 468 (EZ, 2008); in 2005, in de EU15: 389 (De Visser et al., 2006); and in 2050, based on assumptions used for creating Table 3.4
2) Without taking into account the application of non-conventional, fossil fuels or biofuels
Estimation of CO2 emissions from certain types of vehicles, now and in 2050, at the electricity mix of around 2005,
and a possible future mix (in g CO2/km).
Table 3.2
Estimation of the maximum imaginable application of electric driving, around 2050
Situation Maximum % of vehicles Maximum % of electrically driven kilometres
EV with range of < 100 km 30-50 20-40
EV with range of < 100 km, plus
PHEV with range of < 50 km 30-50supplemented to 100 50-70
EV with range of < 250 km 70-90 60-80
EV with fast-charging or swapping stations 95 90
Table 3.3
Possible spread of an energy mix for electricity production between day and night, in 2050
Share (%) day Share (%) night
Coal (largely with CCS) 26 29
Nuclear energy 20 25
Biomass (partly with CCS) 9 8
Wind 25 30
Solar 3
Gas (largely with CCS) 12 3
Cogeneration gas (partly central) 5 5
Total 100 100
emissions. Particulate matter emissions from wear and tear of tyres and road surfaces, however, will not alter with a switch to electric vehicles. Although the reduction in concentrations is limited, it is relevant to human health. Moreover, an emis-sion reduction will take place at the production of fuels (from refineries, among other things), and – although this is partly countered by an increase in emissions from the electricity sector – in real terms, the application of electric vehicles will mean an improvement in urban air quality.
Health benefits from emission reduction measures are calculated in studies on the reform of EU directives (see, for example, AEAT, 2005). Using the same methods, health benefits from a change-over to electric vehicles could also be calculated. Estimations of health benefits can be translated in around 0.5 to 1 billion euros per year.
Long-term costs
3.5
To many, the costs of transport and energy are an impor-tant part of overall costs. How much do the costs of electric driving vary from those of driving conventional vehicles? This section discusses the long-term costs (for short-term costs, see Chapter 5), for the time when technologies that are needed in the new system are much further along in their development. The learning curve will have been largely or fully completed. The costs include those of vehicles, batter-ies, renewed electricity facilitbatter-ies, and liquid fuels – excluding taxes, deductions and surcharges. In this comparison with the conventional system, the emphasis is on the additional costs. The conventional system concerns diesel and petrol, and fully developed passenger vehicles.
Such a cost estimate for some decades into the future could only be indicative. However, an attempt has been made to
offer some insight. Table 3.5 presents the aspects that deter-mined the cost estimate.
Table 3.5 Some important parameters for determining the additional costs of electric driving
The price of the battery largely determines the price of the vehicle, and as such, also the depreciation costs. In turn, the battery price is dependent on the required vehicle capacity. Buyers have to weigh the benefit of having a larger range (without having to recharge), against a higher purchasing price. Figure 3.1 shows the additional costs per kilometre driven, related to the vehicle range. Total costs of battery systems vary per type of vehicle, but costs of battery manage-ment systems are of the same order for all vehicles. Module costs, however, depend on type of vehicle and required output (Kalhammer et al., 2007). Moreover, the costs per kilo-metre are determined by the distance travelled (for annual averages, see Figure 3.1). Figure 3.1 shows the additional costs, which indicate that electric vehicles are cheaper than petrol or diesel vehicles, in the long term. Plug-in hybrids remain slightly more expensive, especially for large distances. Calculating costs over such a long period of time can be no more than an indication. Since there are many assumptions influencing the outcome, a sensitivity analysis was performed, with varying parameters. Starting point for this analysis was an electric vehicle with a range of 300 kilometres, because this type of vehicle – together with the chosen parameters – has no additional costs. Figure 3.2 shows the influence of the varying parameters.
In conclusion, it can be said that the costs of achieving cleaner air might decrease, as it could prove to be cheaper to apply central flue gas cleaning at power stations than for each vehicle, individually.
Some important parameters for determining the additional costs of electric driving
Cost aspect Costs or additional costs, with respect to the reference case Explanation
Production and transport costs of electricity1) € 0.105 per kWh For 2050 (PBL analysis of
green-house gas emission reduction of 60% between 1990 and 2050)
Production costs of petrol € 0.92 per litre of petrol/diesel
(ex-cluding taxes/surcharges) Oil price in 2050: $ 120 /bar-rel (OECD/IEA, 2008b)
Battery price2) Module costs
€ 230-310 per kWh PHEV3
€ 200-230 per kWh city EV3
€ 135-140 per kWh EV
battery system management including plug € 1900 EV
€ 1600-2000 PHEV
Costs per unit of energy capacity. This is dependent on battery design, which needs to be tuned to desired output (e.g. Kalhammer et al., 2007)
Additional costs vehicle (excluding batteries) City car EV - € 2000
Family car PHEV circa + € 1000 Family car EV - € 3500
For EV, saving on costs of combus-tion engine and accompanying parts
Additional annual costs of maintenance Small city car EV - € 75-100
Family car PHEV + € 25-50 Family car EV - € 120-150 Depending on amount of kilo-metres driven, annually
Very rough estimate: electric vehicle has fewer moving parts, therefore, less wear and tear, which means it needs less maintenance and re-pair than conventional vehicles
Depreciation period At 5,000 km/y: 20 years
At 15,000 km/y: 15 years At 40,000 km/y: 8 years
1) Assuming that costs of setting up charging points will be paid out of the extra electricity sales. Additional costs for
fast-charg-ing or swappfast-charg-ing stations have not been taken into account.
2) Once an older battery is no longer suitable for use in vehicles, it can be used within the network for temporary storage of
electricity. Any remaining value has not been included.
3) (Plug-in Hybrid) Electric Vehicle
Judging potential effects of this system option 23
Natural resources
3.6
Electric driving will slow down the oil stocks depletion. Various sources can be used for electricity generation, of which smaller (gas) or larger (coal) stocks are available. In addition, renewable energy could be used, and dependency on gas for a more flexible electricity supply is becoming smaller.
Experts consider several variants of the Li-ion battery the most likely choice for the coming decades. However, one
battery contains approximately 1.75% lithium (CENEX-ARUP, 2008), and the availability and purity of lithium is being called into question, as the titles of some publications also show:
The Trouble with Lithium, Peak Lithium (a variant of the Peak Oil discussion), An Abundance of Lithium, The Saudi Arabia
of Lithium (Bolivia), and Bolivia holds key to electric car future (Tahil, 2007; Meridian International Research, 2008; Evans, 2008; Forbes, 2008; BBC, 2008; and www.evworld.com, November 2008).
Indication of additional costs of electric driving, compared to diesel or petrol, for various vehicle types and battery capacities, in the long term
Figure 3.1
0 100 200 300
range (battery capacity) in km -0.04
0.00 0.04
0.08 euros/km Plug-in hybrid 15000 km/year 40000 km/year City car
5000 km/year 15000 km/year Electric family car
15000 km/year 40000 km/year
Compared to petrol/diesel
Additional costs of electric driving in 2050
Influence of varying parameters on the estimated additional costs of electric driving, in the long term, compared to driving on petrol or diesel
Figure 3.2
Capacity 0,15 kWh/km 0,25 kWh/km Price battery module 150 euros/kWh 250 euros/kWh Additional cost vehicle -5000 euros -2000 euros Maintenance benefit 200 euros/year 0 euros/year Electricity price 0,08 euros/kWh 0,15 euros/kWh Oil price 150 $/barrel 50 $/barrel Efficiency ICE vehicle 0,06 l/km 0,04 l/km
-0.04 -0.02 0.00 0.02 0.04 0.06 euros/km
Electric car with 300 km radius compared to driving petrol/diesel
Lithium is not only used in batteries; over half of today’s production is being used for making glass, ceramics and alu-minium, and it is also used in synthetic rubber and lubricants. For this last category, alternatives to lithium do exist. Lithium is relatively easy to extract from beneath the salt flats in Chile, Argentina, Bolivia, the United States, Australia, Russia and China. Rapid introduction of plug-in hybrids and electric vehicles would lead to a much higher production and increase the search for possible extraction areas. In addition, the price of lithium is likely to increase, in the long term. However, it appears that there would be enough lithium available to supply all future vehicles with a lithium-ion battery. In the EU, waste batteries have to be collected, and lithium could also be recycled, although to which percentage and quality is yet unknown (CENEX-ARUP, 2008; ICMM, 2008).