An overview of IMAGE 2.4
Edited by
MNP publication number 500110002/2006 Language editing
R.E. de Wijs, M.P.M. Hartman Graphics
M. Abels, C. Bartels, J. de Ruiter, A. Warrink, F. de Blois Design and layout
Uitgeverij RIVM ISBN-10: 90-6960-151-6 ISBN-13: 978-90-6960-151-9
The publication can be downloaded from the website (www.mnp.nl/en) or a printed copy requested via email (reports@mnp.nl). Be sure to include the MNP publication number.
Parts of this publication may be reproduced provided acknowledgement is given to the Netherlands Environmental Assessment Agency. Include the following information:
For the book :
MNP (2006) (Edited by A.F. Bouwman, T. Kram and K. Klein Goldewijk), Integrated modelling of global environmental change. An overview of IMAGE 2.4. Netherlands Environmental Assessment Agency (MNP), Bilthoven, The Netherlands.
For an individual chapter:
[Author(s)] (2006). [Chapter title] in: MNP (2006) (Edited by A.F. Bouwman, T. Kram and K. Klein Goldewijk), Integrated modelling of global environmental change. An overview of IMAGE 2.4. Netherlands Environmental Assessment Agency (MNP), Bilthoven, The Netherlands, [page numbers].
The Netherlands Environmental Assessment Agency (MNP in Dutch) functions as the interface between science and policy, producing independent assessments on the quality of the environment for people, plants and animals to advise national and international policy makers.
Netherlands Environmental Assessment Agency PO Box 303
3720 AH Bilthoven
Phone: +31 (0) 30 274 27 45 Fax: +31 (0) 30 274 44 79 E-mail: info@mnp.nl
Page
Foreword 5
1 The IMAGE model: History, current status and prospects 7
T. Kram and E. Stehfest
2 People in the pixel: Grid-based population dynamics using PHOENIX 25
H.B.M. Hilderink
3 TIMER 2: Model description and application 39
D.P. Van Vuuren, B. Van Ruijven, M.M. Hoogwijk1, M. Isaac and H.J.M. De Vries
4 Modelling agricultural trade and food production under
different trade policies 61
B. Eickhout, H. Van Meijl2 and A. Tabeau2
5 Modelling livestock-crop-land use interactions in global
agricultural production systems 77
A.F. Bouwman, K.W. Van Der Hoek3 and G. Van Drecht
6 HYDE 3: Current and historical population and land cover 93
K. Klein Goldewijk and G. Van Drecht
7 Simulating carbon exchange between the terrestrial biosphere and
the atmosphere 113
J.G. Van Minnen, B. Strengers and B. Eickhout
8 Modelling the fate of nutrients through the soil and
hydrological system 131
A.F. Bouwman, A.H.W. Beusen, K.W. Van Der Hoek3 and G. Van Drecht
9 Climate: Variability, predictability and interactions with land cover 153 B. Strengers, M. Schaeffer and B. Eickhout
R. Alkemade, M. Bakkenes, R. Bobbink4, L. Miles5, C. Nellemann6, H. Simons7, T. Tekelenburg
11 FAIR: A model for analyzing environmental and cost implications of
future commitment regimes 187
M.G.J. Den Elzen and P.L. Lucas
References 207
1 Ecofys, Utrecht, The Netherlands
2 Agricultural Economics Research Institute, Wageningen University and Research Centre, The Hague, The Netherlands
3 Laboratory for Environmental Monitoring, National Institute for Public Health and the Environment, Bilthoven, The Netherlands
4 Landscape Ecology, Faculty of Biology, Utrecht University, The Netherlands 5 UNEP, World Conservation and Monitoring Centre, Cambridge, UK
6 UNEP GRID Arendal, C/O NINA Lillehammer, Norway 7 IUCN Netherlands Committee, Amsterdam, The Netherlands
Foreword
Continued population growth and rising per capita income, leading to industrializa-tion and ever-increasing flows of materials, are giving rise to concern about how to ensure more sustainable forms of global human development. It is widely accepted that following a similar development path in developing countries to the one taken in many industrialized countries for many decades will lead to an unsustainable fu-ture. In particular, problems associated with climate change, loss of biodiversity, wa-ter scarcity and the accelerated nitrogen cycle are encounwa-tered at global, continental and regional scales. Solving them will demand a comprehensive understanding of the Earth system. According to the Millennium Ecosystem Assessment, the challenge is ‘to investigate what goods and services are provided to humans by the natural and man-aged ecosystems, and how the ability to provide those services is put at risk by human activities’.
Only through a better understanding of the global environment and how it responds to anthropogenic pressure, can policy makers make the decisions pertinent to a more balanced interaction between human development and the natural system. Giving sound advice to policy makers, who are challenged in their selection of the most effec-tive and efficient measures against large-scale or even global environmental threats, requires a specific mixture of knowledge and innovative tools that are not immediately obvious. Recommendations should have a sound base in the natural sciences, recog-nizing the uncertainties of the complex Earth system but also drawing on the social sciences.
An Earth system model such as the Integrated Model to Assess the Global Environment (IMAGE) will be a helpful tool in investigating the global issues, and their causes and links, in a comprehensive framework. This will include the major feedback mecha-nisms in the biophysical system. The version of IMAGE presented here represents the result of many years of development at the National Institute for Public Health and the Environment (RIVM); work on IMAGE is continuing at the Netherlands Environmental Assessment Agency (MNP), now separate from the RIVM. MNP has been operating as an autonomous agency since 1 January 2006. The first, single-region version of IMAGE, called the Integrated Model to Assess the Greenhouse Effect, was developed in the late 1980s. Since then, updates, as presented in several publications, have culminated in the latest incarnation, the IMAGE 2.4 framework.
IMAGE 2.4 shares many of the basic structural components of its predecessors. Assum-ing change, population and the macro-economy as key drivers, the model establishes physical indicators for both the energy/industry system and the agriculture/land-use system for assessment of changes in land cover, climate, and the carbon and nitrogen cycles. Besides showing several improvements in IMAGE and the extension of issues offered, this book illustrates how IMAGE can be used to feed broader policy-explor-ing tools. Examples are tools for assesspolicy-explor-ing impacts on biodiversity, global sustainabil-ity focused on vulnerabilsustainabil-ity and food secursustainabil-ity, and comprehensive climate mitigation strategies.
The contributions of IMAGE to international assessments of global environmental problems and sustainable development illustrate the continuing desire to improve the model framework so as to address the issues raised. Recently, IMAGE results have played a key role in several global studies, including the IPCC Special Report on Emis-sions Scenarios (SRES), the UNEP Third Global Environment Outlook(GEO-3), the Mil-lennium Ecosystem Assessment (MA), the Second Global Biodiversity Outlook, and the Global Nutrients from Watersheds project of the UNESCO Intergovernmental Oceano-graphic Committee. At the European level, IMAGE has been involved in the Eururalis study on future prospects for agriculture and the rural areas of the EU-25 countries, and the Greenhouse Gas Reduction Policy (GRP). At MNP, IMAGE is a major contributor to the Sustainability Outlook. In addition to its involvement in several projects funded by the European Commission, IMAGE 2.4 is currently employed in four global environ-mental assessments, all scheduled for release in 2007: the Fourth Assessment Report of the IPCC, the UNEP Fourth Global Environment Outlook, the IPCC Agricultural Assess-ment (IAASTD) and the OECD Second EnvironAssess-mental Outlook.
Following one of the recommendations of the IMAGE Advisory Board in 2000, model extensions and improvements are being increasingly pursued in close co-operation with institutions, both in the Netherlands and abroad, who have expertise comple-mentary to the IMAGE team at MNP. Today a core network of partners is taking shape around IMAGE; within this setting, instrumental joint projects have been submitted with partner institutions to secure the necessary resources. The Netherlands Meteoro-logical Institute (KNMI), the Potsdam Institute for Climate Impact Research (PIK) and various departments and institutes of Wageningen University and Research Centre (Wageningen UR) now work closely with MNP on a variety of topics. Other network partners also contribute their knowledge and expertise in bringing collaborative ac-tivities to fruition.
The current version of IMAGE, 2.4, offers valuable stepping stones in securing the posi-tion of IMAGE as one of the leading frameworks for integrated assessment of global sustainability issues. Further developments initiated within the network of collaborat-ing institutions offer excellent prospects for the future of the IMAGE model framework in contributing to the analysis of crucial interactions between human well-being and ecological goods and services.
Professor N.D. van Egmond
1
THE IMAGE MODEL: HISTORY, CuRRENT STATuS
AND PROSPECTS
1.1 Introduction
The current version (2.4) of the Integrated Model to Assess the Global Environment (IMAGE) documented in this publication represents the latest incarnation of a develop-ment that goes back as far as the late 1980s, when a team at the National Institute for Public Health and the Environment (RIVM), Bilthoven, the Netherlands, embarked on developing a global model to explore relevant aspects of climate change, emerging in those years as an important case for internationally concerted policy deliberations. The first version (1.0), formerly known as the Integrated Model to Assess the Greenhouse Effect (IMAGE), was a global, single-region model describing global trends in driving forces and the ensuing consequences for climatic change and impacts on key sectors through a coupled set of modules representing the main processes involved (Rotmans, 1990). At the time, IMAGE 1.0 was among the first pioneering examples of Integrated Assessment Models addressing climate change.
6 Rest of South
America 12 Central Europe 11 Western Europe
5 Brazil 17 Middle East 22 Indonesia
1 Canada 7 Northern Africa 13 Turkey 18 South Asia 23 Japan
3 Mexico 9 Eastern Africa 15 Kazachstan region 20 East Asia 25 Greenland 4 Central America 10 Southern Africa 16 Russia 21 Southeast Asia 26 Antarctica 2 USA 8 Western Africa 14 Ukraine region 19 Korea region 24 Oceania IMAGE regional breakdown
Since then, IMAGE has evolved through a series of new versions, each introducing ma-jor revisions, enhancements and extensions up to the current version (2.4) documented here. This version marks an important milestone on the development path towards a next generation model, referred to as IMAGE 3, aimed at capturing – to a larger extent – the different aspects and domains of sustainability, with emphasis on the ecological domain but also related to the economic and social domains.
Specific features of the IMAGE model include comprehensive coverage of direct and indirect pressures on human and natural systems closely related to human activities in industry, housing, transport, agriculture and forestry. Whereas socio-economic activi-ties and drivers of change are elaborated at the 24-region level (Figure 1.1), the climate, land-cover and land-use change-related processes are represented in a geographically explicit manner on the 0.5 by 0.5 degree grid scale. It is this latter characteristic, rela-tively rare in integrated assessment models, that makes IMAGE particularly suited to exploring interactions between human and natural systems.
Key elements of sustainable development include provision of affordable energy while keeping air pollution and climate change under control; management of water sys-tems in support of agriculture, industry and human settlements; increasing agricul-tural production while protecting soil, groundwater and surface water quality, and slowing down and eventually halting further loss of biodiversity. More generally, these issues can be described as the challenge to strike the balance between human devel-opment and the goods and services provided to humans by the natural and managed ecosystems, which are put at risk by human activities (Millennium Ecosystem Assess-ment, 2006a). An integrated assessment model like IMAGE 2.4 presents a helpful tool for investigating these interactions in a comprehensive framework, including the ma-jor feedback mechanisms within the biophysical systems.
As previously stated, the current version of IMAGE is the result of many years of devel-opment at the National Institute for Public Health and the Environment (RIVM), and –following a recent re-organization – the now separate Netherlands Environmental Assessment Agency (MNP). The development stages can be followed in a series of three books (Rotmans, 1990; Alcamo, 1994; Alcamo et al., 1998). Substantive further develop-ment work was undertaken between 1998 and 2001, resulting in the version 2.2 model used to elaborate the IPCC-SRES scenarios (Nakicenovic et al., 2000). The documenta-tion on version 2.2 covering the implementadocumenta-tion of the SRES scenarios is included on two CD-ROMs (IMAGE-team, 2001a; IMAGE-team, 2001b).
The main focus of this book, Integrated modelling of global environmental change: an overview of IMAGE 2.4, is to document the new developments in the IMAGE model between 2001 and 2006. More specifically, section 1.3 summarizes version 2.4 of the model (which the subsequent ten chapters of this book further elaborate). After high-lighting the new key features of version 2.3 in the framework of a historical overview, this first chapter summarizes the current status of the development process up to mid-2006 (section 1.3). It goes on to compile uncertainty and sensitivity analyses carried
out for the main model components (section 1.4), which is followed by an overview of recent and current IMAGE applications (section 1.5). The chapter concludes with ongoing and planned initiatives for improvement beyond version 2.4 and on the way to IMAGE 3 (section 1.6).
1.2 History of the IMAGE model
The IMAGE model had its beginnings back in the mid-1980s, when RIVM decided to build a simple prototype model to capture the relationships between human activities and climate change. The experience gained from the prototype was subsequently used to build the Integrated Model to Assess the Greenhouse Effect (IMAGE 1.0, Rotmans (1990)). IMAGE 1.0 was a global (single-region) model to capture major cause–effect relationships making up the complex greenhouse problem. It constituted a averaged integrated structure combining energy and agriculture models for green-house gas emissions, a global carbon cycle model, parameterized global radiative forcing, temperature change and sea level rise. IMAGE 1.0 was used to explore global scenarios for further developing the first set of scenarios for IPCC. With regard to effects of climate change, and possible feedbacks, a regional set of modules was implemented to drive grid-based impact calculations as part of the ESCAPE framework (European Commission, 1992).
Building further on innovative approaches taken in the ESCAPE framework to estimate emissions resulting from energy and land use for world regions, IMAGE’s focus was shifted to a regional base, and became known as version 2.0 (Alcamo, 1994). In this ver-sion land-cover and land-use modelling was done on a resolution of 0.5 by 0.5 degrees, drawing on experience with geographically explicit global models. At the time (1994), IMAGE 2.0 was the first published global integrated model having geographic resolu-tion. All subsequent incarnations of IMAGE 2 have retained this two-strand approach of regional drivers and grid-based biophysical modelling.
In essence, IMAGE 2.0 consisted of three linked clusters of modules: the Energy-Indus-try System (EIS), the Terrestrial Environment System (TES) and the Atmosphere-Ocean System (AOS). The EIS generates industrial and energy emissions for 13 regions using simplified energy-economy relationships. TES, which has hardly changed in subse-quent versions, establishes global land-cover change on the grid scale, taking (agro-)economic and climate factors into account. Changing land cover and other factors are used to compute the (net) flux of carbon dioxide (CO2) and other greenhouse gases to the atmosphere. The BIOME model (Prentice et al., 1992), the terrestrial carbon model and an FAO-based crop-growth model are important determinants of the changes in land-cover and associated emissions. The collective emissions from EIS and TES are then fed into AOS, which subsequently computes the build-up of greenhouse gases in the atmosphere. The zonal average temperature and precipitation patterns are calcu-lated from the atmospheric composition changes,.
Guided by recommendations from international review meetings, further refinements and extensions were implemented in IMAGE 2.1 (Alcamo et al., 1998). Here, the aim was to enhance the model’s performance and broaden its applicability. Major steps included improved computation of future regional energy use in EIS. Since the de-velopment of IMAGE 2.1 future fuel prices have influenced the selection of fuels in the model, depending on resource depletion on the supply side and price-dependent energy conservation on the demand side. The initial land-cover map, from which the global simulations start, was updated on the basis of DISCover version 1 (Belward and Loveland, 1995), together with improved allocation of agricultural land, computation of vegetation responses to climate change. The map also included the demand of land for timber production.
The third session of the IMAGE Advisory Board in 1999 resulted in a list of recom-mendations and suggestions for further development work on IMAGE (Tinker, 2000). The board recommended making Global Change the target area, extending it beyond climate change, and building on integration of socio-economic and natural systems. While development up to IMAGE 2.1 had up to this point been largely an in-house effort by RIVM staff, collaboration with other domestic and international research groups was now suggested for further steps. Scientific recommendations included the development of cost curves for land-use emission reductions, meta-models and scan-ner models to address policy discussions and a revision of agro-economic modelling to be more in concert with approaches in other sectors. Furthermore, it was recom-mended to include interannual climate variability in relation to vegetation and water, and its effects on climate impacts, and to replace the zonal-mean climate-ocean model with a two-track approach. Here, a fast track would employ a simple climate model and a second track, a climate model of intermediate complexity. In addition, a list of more detailed recommendations and suggestions proposed concrete steps to consider in the development of IMAGE 2. As previously was the case, the recommendations and suggestions from the Advisory Board formed a welcome guide for the IMAGE team, with the majority of recommendations being incorporated in the subsequent work. One of the major changes in IMAGE 2.2 concerned the recommended two-track strat-egy for the climate model. The earlier zonal-mean climate-ocean model in IMAGE was replaced by a combination of the simple MAGICC climate model and the Bern ocean model. In the new approach, the resulting global average temperature and precipita-tion changes were scaled using temperature and precipitaprecipita-tion patterns generated by complex, coupled Global Circulation Models (GCMs). The widely accepted method of Schlesinger et al. (2000) for scaling patterns of aerosol-induced climate change was also adopted. This new approach is now the standard method for the first, simple and fast tracks to deal with climate change in the IMAGE model. A specific advantage is that patterns from different GCMs can be used to explore the uncertainties in the behaviour of the global climate system (IMAGE-team, 2001b). Parallel to this develop-ment, a second track – aiming to couple a climate model of intermediate complexity – was explored in co-operation with the Netherlands Meteorological Institute (KNMI). To date, this track currently operates in a parallel mode through the ECBilt model (see chapter 9) and more recently the SPEEDy model.
On the economy–energy side, the linkages between the TIMER energy model, which had replaced the EIS, and the macro-economic model Worldscan were improved; this included down-scaling from the 12 regions in Worldscan to the – by then – 17 active regions in TIMER and the rest of the IMAGE framework.
This IMAGE 2.2 version (IMAGE-team, 2001a) was used to contribute to the work on the Special Report on Emissions Scenarios of the Intergovernmental Panel on Climate Change (Nakicenovic et al., 2000), in particular the B1 scenario (De Vries et al. 2000). Besides changes in the model structure, much effort was therefore devoted to generat-ing model input parameters in line with the overall story lines and the required harmo-nization of key input data of the SRES exercise. Special efforts were made to attune emis-sion factors to available data in the start-year and their scenario-specific development over time. In this sense, the participation in the IPCC-SRES process has greatly enhanced the capacity of both the model and the IMAGE team to explore scenarios and obtain results geared to the requirements of various international assessment processes. After completion of version 2.2 and the SRES scenarios, the model and model results were published in the form of a CD-ROM, facilitated by the development of the User Support System (USS) and allowing for interrogation of the model structure, input data and the vast number of results through a user-friendly interface.
The experiences gained from the SRES process had, however, reinforced the desire to seriously reconsider the future of the IMAGE model. It had become abundantly clear that further major steps in model development would be beyond the capacity of the IMAGE team, both in terms of expertise to support in-house development and in re-sources to simultaneously pursue further applications of the model. This tension had already been flagged by the Advisory Board in 1999 and required firm decisions on priorities and operational structures to pursue the overall goals and ambitions. As part of the process, the Dutch Ministry of Housing, Spatial Planning and the Environment (VROM) was involved in setting out strategic directions for IMAGE. The combined result of the Advisory Board report, the internal discussions within MNP and the consulta-tions at the Ministry of VROM was put together in a strategy report entitled ‘An IMAGE of the Future’ (Kram, 2003).
One of the main conclusions in the report is that the IMAGE framework had received adequate international recognition to warrant or justify further investment in paral-lel with policy-relevant applications. Furthermore, broadening the scope to serve the emerging demand for analyses in support of global sustainability debates was adopt-ed as the main challenge, and a more active stand taken on setting up co-operative arrangements with other research groups was seen as indispensable. A set of model enhancements was identified and later initiated; these enhancements taken jointly will constitute the next generation model, IMAGE 3. However, parallel to this, a small set of model changes, internally referred to as version 2.3 and mainly concerned with the integration of energy crops and carbon plantations, was implemented for the analysis of mitigation options (Van Vuuren et al., 2006).
The main milestone on the road to realizing IMAGE 3, however, is the IMAGE 2.4 ver-sion described in this book, which already addresses much of the overall development strategy and new challenges.
1.3 IMAGE 2.4
In the last couple of years a series of improvements, enhancements and extensions of the IMAGE model have been initiated and framed in an overall model strategy towards broader coverage of sustainable development issues. The development activities in-creasingly take place in close collaboration with national and international partner institutes, with the aim of jointly benefiting from shared expertise and models. A scheme of the current model structure is given in Figure 1.2. The subsequent chapters of this book will follow the main model components, describing in more detail the new developments in IMAGE 2.4 and the challenges offered by the envisaged IMAGE 3. Looking at the top of the scheme in Figure 1.2, we see a description of the basic driving forces, including demographics (chapter 2), energy supply and demand (chapter 3), and agricultural demand, and trade and production (chapter 4). All of these interact through land use and emissions with the Earth systems. Subsequently, important elements in the biophysical modelling of land cover and land-use processes are also addressed, i.e. land cover and land use (chapter 5), contemporaneous and historical land cover (chapter 6), the carbon cycle (chapter 7) and nutrients (chapter 8), followed by climate and climate variability, including its interaction with land cover (chapter 9). Finally, the use of data and information from IMAGE as input for broader exploring tools is discussed for both global biodiversity (chapter 10) and comprehen-sive climate mitigation strategies and regimes (chapter 11). Several chapters, notably 9, 10 and 11, present model components that are not strictly integrated with IMAGE 2.4. The scheme of the IMAGE 2.4 model framework in Figure 1.2 shows many of the basic structural components of its predecessors. The key drivers of change, population and the macro-economy, can be derived from various external and internal sources. For macro-economic drivers the exogenous source depends on the study in which IMAGE 2.4 is applied. One of the most important challenges for IMAGE is the integration of a macro-economic model in the modelling framework in order to be able to address feedbacks from the environmental system to the economy. In the remainder of this section the main model components, and their improvements and extensions incor-porated in IMAGE 2.4, are summarized.
Demographics
Population projections (chapter 2) are taken primarily from authoritative exogenous sources like the UN or IIASA, but may also be adopted from the in-house demographic model PHOENIX (Hilderink, 2001). In IMAGE 2.4, grid-based population dynamics have been improved by introducing a new downscaling algorithm. Population within a grid cell is calculated with a proportional method using available country-specific data
combined with the trends on the level of world regions, as determined by PHOENIX. This approach allows for simulating shifts in population within IMAGE regions.
Energy supply and demand
In the TIMER model (chapter 3), aggregated economic indicators like GDP, household consumption and value added in industry, services and agriculture are used to estimate the demand for energy services. Energy supply chains with substantial
technologi-Demography Carbon Nitrogen Water Climate impacts IMAGE 2.4 Framework Socio-economic system Earth system Impacts Agricultural Economy and Trade World Economy Energy supply and demand Managed Land Natural
Vegetation Atmospheric Chemistry Atmosphere- Ocean System Land allocation
Policy options (FAIR)
Emissions Land degra- dation Water & Air pollution Water
stress diversity Bio-
cal detail are then selected on the basis of relative costs to meet the resulting final energy demand after autonomous and price-induced energy savings. Market shares for energy resources and technologies are calculated via a multinomial logit distribu-tion funcdistribu-tion (De Vries et al., 2001). TIMER includes explicit treatment of tradidistribu-tional biofuels, vintages of capital stock, learning-by-doing (i.e. technologies improve with their cumulative build-up of installed capacity) and resource depletion (driving up costs for extraction of exhaustible energy resources). It generates primary and final en-ergy consumption by enen-ergy type, sector and region; capacity build-up and utilization; cost indicators, and greenhouse gas and other emissions. Important new elements that have been introduced in the TIMER 2.0 model (part of IMAGE 2.4) are hydrogen production and more detailed descriptions of the electric power system and renewable energy, including bioenergy.
Agricultural demand and trade
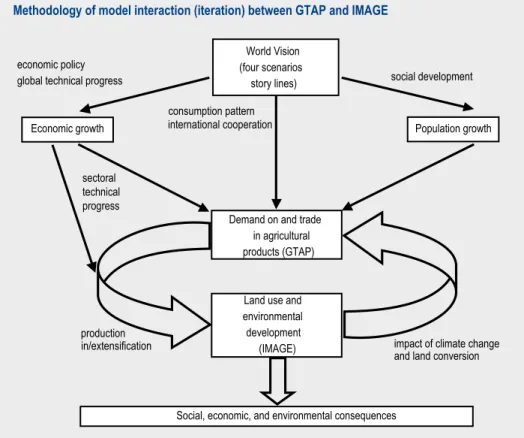
Demand for and production of agricultural products on the basis of population changes and economic developments are simulated through a linkage to the global trade analysis project (GTAP) model (see chapter 4). GTAP calculates consumption and trade of agricultural products by taking into account regional and world market prices, which are calculated explicitly from production functions including capital, labour and land prices. In return, IMAGE 2.4 provides land-supply curves, yields and yield changes, which result from climate change and expansion of agriculture to less productive areas, and simulates the geographically explicit environmental impacts. This iterative coupling between GTAP and IMAGE allows assessment of the economic and environmental consequences of specific trade policies.
Land use and land cover
One of the most striking parts of IMAGE 2.4 is the geographically explicit land-use modelling, considering both cropping and livestock systems on the basis of agricultural demand (chapter 4) and demand for energy crops (chapter 3). The rule-based allocation accounts for crop productivity (Agro-Ecological Zones approach; FAO, 1978-1981), and other suitability factors like proximity to existing agricultural land and water bodies. The land-cover type ‘energy crops’ is now included in IMAGE 2.4. A more detailed description of animal production systems has been introduced in IMAGE 2.4 to portray the spatial var-iability in grazing systems, and to address the rapid development of intensive ruminant production on managed grassland and the rapidly increasing use of various feedstuffs (chapter 5). Moreover, a new initial land-use map for 1970 is incorporated on the basis of satellite observations combined with statistical information (chapter 6). Historical land cover (HyDE 3) for the period 1700-1970 (chapter 6) is based on census data, the land’s suitability for agricultural production and historical population density distributions. Changes in natural vegetation cover on undisturbed or abandoned land are simulated in IMAGE 2.4 on the basis of a static natural vegetation model (Prentice et al., 1992).
Carbon cycle
The consequences of these land-use and land-cover changes for the carbon cycle are simulated by a geographically explicit terrestrial carbon cycle model (chapter 7). If
agricultural land is abandoned, it is assumed to revert gradually to its more natural state, with implications for the carbon stock. The carbon cycle model, implemented in the IMAGE framework since version 2.0, has been subjected to a thorough evaluation, which showed that the model is suitable for simulating global and regional carbon pools and fluxes. The model accounts for important feedback mechanisms related to changing climate, CO2 concentrations and land use. In addition, it allows for evalu-ating the potential for carbon sequestration in natural vegetation and carbon planta-tions (chapter 7).
Nitrogen cycle
IMAGE 2.4 also includes a new module to assess the consequences of the changing population, economy, land use and technological development for surface-nutrient balances and reactive nitrogen emissions from point sources and non-point sources (chapter 8). These surface balances form the basis for describing the major fluxes in the global and regional nitrogen cycle, as well as the effects on water and air quality (Figure 2.1). Processes that are accounted for in this module are human emissions, wastewater treatment, surface nitrogen and phosphorous balances for terrestrial sys-tems, ammonia emissions, denitrification and N2O and NO emissions from soils, nitrate leaching, and transport and retention of nitrogen in groundwater and surface water. In order to derive spatially explicit scenarios, tools were developed to translate region-al or country-specific information to grid-specific input parameters.
Atmosphere – ocean system
Emissions from the energy system (chapter 3) and emissions due to land-use changes (see chapters 7 and 8 for the terrestrial carbon and nitrogen cycle) determine the composition of the atmosphere. IMAGE 2.4 uses the Atmosphere–Ocean System model developed for IMAGE 2.2 (Eickhout et al., 2004). However, important non-linear interactions between the land, the atmosphere and the ocean cannot be studied with IMAGE 2.4 due to limitations of the current climate model and the natural vegetation module. Therefore a series of studies was carried out to explore a possible pathway to include a more detailed climate model in IMAGE (chapter 9). As an outcome of this exploration, the detailed climate circulation model (SPEEDy) coupled to the Dynamic Global Vegetation Model LPJ will be part of future IMAGE versions.
Biodiversity
In addition to these environmental impacts of global change calculated within the core biophysical modules, results are also used as input to drive impact models in the broader IMAGE 2.4 framework, such as the biodiversity model GLOBIO 3. GLOBIO (chapter 10) can be used to assess the impacts of climate and land-use change, infra-structure, and nitrogen deposition on biodiversity and ecosystems. Likely effects of scenario assumptions or political interventions are estimated by calculating trends in mean species abundance.
Climate Policy options
IMAGE results are also used for the evaluation of climate policies in conjunction with the policy decision-support model FAIR (chapter 11). FAIR is widely used to assess the environmental and abatement cost implications of international regimes for the differentiation of future emission reductions of greenhouse gases. The model links long-term climate targets and global reduction objectives with regional emission allowances and abatement costs, accounting for the Kyoto Mechanisms.
1.4 uncertainty and sensitivity
Obviously, numerous sources of uncertainty in the various components of IMAGE 2.4 influence its analytical results, ranging from data imprecision and model uncertain-ties, to scenario assumptions in applications. To date, no comprehensive and system-atic exploration has been performed of key uncertainties and how they are propagated throughout the entire IMAGE model to influence the final results. Currently, plans are being developed to undertake this demanding exploratory task. What has been done in many instances is to look at uncertainties in underlying data and model formulations in sub-systems of the overall framework, thus providing partial sensitivity analyses for IMAGE 2.4 framework. An overview of the available sensitivity studies for the main modules is given below.
An earlier version of the TIMER energy and emissions model was systematically exam-ined to establish the most important parameter settings and model assumptions influ-encing model results. This exploration using the NUmeral Spread Assessment Pedigree (NUSAP) system (Van der Sluijs et al., 2005). Input variables and model components most sensitive to projected CO2 emissions were population and economic growth; shifts in economic structure; technology improvement factors; fossil and renewable resource cost/supply curves, and autonomous and price-induced efficiency gains. Com-bined with the outcome of expert appraisal of the parameter ‘pedigree’, estimates of the ‘strength’ of the parameters were added to their sensitivity.
Obviously, any projection of future environmental conditions rests critically on the underlying emission factors and their relationship with relevant human activities or drivers. The IMAGE model has incorporated the most recent and authoritative sources. Despite ongoing efforts to collect data and enhance statistical procedures and model-ling, many emission sources of greenhouse gases and other anthropogenic trace gases remain uncertain. Van Aardenne et al. (2001) have overviewed the qualitative analysis of activity data, emission factors and grid maps as in IMAGE. As a rule, emissions from large point sources like power plants tend to be of acceptable quality, while smaller and dispersed sources are typically poor to very poor. Whereas global or large-scale regional aggregate budgets are generally reasonably well known, the contribution of sectors and activities by geographic location is for the most part much more uncertain. Emission factors that depend on fuel properties, like CO2 and sulphur dioxide (SO2), can be estimated within narrow ranges, but others are very sensitive to technological
details, local conditions like soil properties, and management practices. This induces not only uncertainties in the initial inventories, but also in future emission projec-tions.
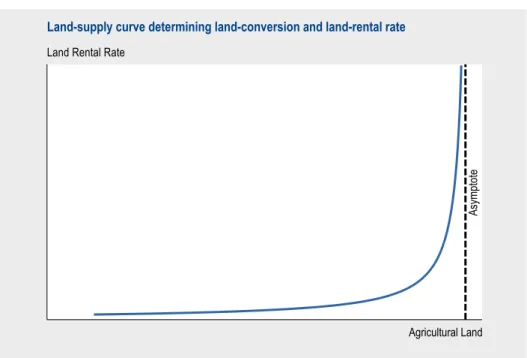
In the coupled application of the agro-economic GTAP model and IMAGE, land-supply curves play a crucial role in establishing agricultural demands, production and trade flows. Derived from biophysical properties in IMAGE, land-supply curves are used in GTAP to find solutions of equilibrium for agricultural land volumes and the associated land rental rate (see chapter 4). To test the sensitivity, simulation experiments were run with the asymptote 2.5% lower and 2.5% higher than the central estimate; the impacts on model results for land supply, the real land rental rate and production changes were investigated (Tabeau et al., 2006). Analyses show that changing the asymptote of the land supply function leads to significant changes of land supply for countries where agricultural land is relatively scarce. However, the induced production changes are rather low. The aggregated agricultural production elasticity with respect to the asymptote change varies from 0.1 for countries where agricultural land is abundant to 0.5 for countries where the agricultural land is scarce. This means that the simulation results for production development are rather robust with regard to the estimated land supply-curve parameters.
The sensitivity of ammonia (NH3) volatilization in agricultural production systems to variation in input parameters was investigated by Bouwman et al. (2006). Various parameters were selected, including nitrogen excretion per head, animal stocks, the distribution of production over pastoral, and mixed and landless systems, fertilizer inputs and the NH3 emission factors for animal housing, etc. The results suggest that on the global scale, excretion of nitrogen per head and animal stocks are the most important parameters in the model. However, the importance of the various parameters varies among world regions and countries. For example, in China fertilizer use is a far more important determinant for total ammonia loss than in other world regions, while in India the use of manure as fuel is a very important process. The overall conclusion is that nitrogen excretion per head merits our attention in future research. Research will focus on the difference between N excretion in extensive versus intensive systems, and modelling excretion as a function of production characteristics such as milk pro-duction per head and nutrient intake by feed category (see chapter 5). This study also made clear that the spatial modelling of nutrient use presented in chapter 8 allows for analysis of various policy alternatives and consequences for the nitrogen cascade. A series of experiments examined the role of the terrestrial carbon cycle in overall climate change scenarios implemented in IMAGE 2.2 (Leemans et al., 2002). The ex-periments yielded a broad spectrum of atmospheric CO2 concentrations, ranging, for example, in the IPCC-SRES A1B scenario from 714 to 1009 ppmv in 2100. The spread of this range is comparable to the full range arising from the different SRES scenarios with respect to the IMAGE 2.2 default settings for the carbon cycle: 515-895 ppmv. The most important respective negative and positive feedback processes are CO2 fertiliza-tion and soil respirafertiliza-tion. In recognifertiliza-tion of the importance of a proper
parameteriza-tion of the major feedbacks on the carbon cycle and land use, and thus in determining the future state of the climate system, the issue has more recently been further pur-sued (see chapter 7).
With regard to the response of the climate system to changes in atmospheric com-position and associated radiative properties, two core aspects were tested. The first parameter addressed was climate sensitivity, which describes by how many degrees the equilibrium global mean temperature will rise if the CO2-equivalent concentration of greenhouse gases in the atmosphere doubles compared to the pre-industrial level. The simple climate model in the Atmosphere-Ocean System (AOS) of IMAGE 2, attuned to represent the generally accepted central estimate for the climate sensitivity of 2.5 degrees, was adjusted to explore the range from 1.5 to 4.5 degrees. As expected, this amplified or reduced all climate-related impacts very tightly for any given emission projection. For climate change impacts, however, global mean effects are of limited significance. Therefore, a second sensitivity analysis addressed the spatial patterns of temperature and precipitation projections. IMAGE employs exogenous patterns from complex climate models (GCMs) to scale the impacts of the endogenously derived glo-bal mean temperature change. The robustness of regional impacts on different GCM patterns was tested by UNEP/RIVM (2004). Results indicate that while GCM outcomes for some regions are fairly consistent, in other regions the temperature effect is very different. With regard to annual precipitation the disagreement between models is even stronger. In some regions, e.g. South America, they do not even agree on the direction of change.
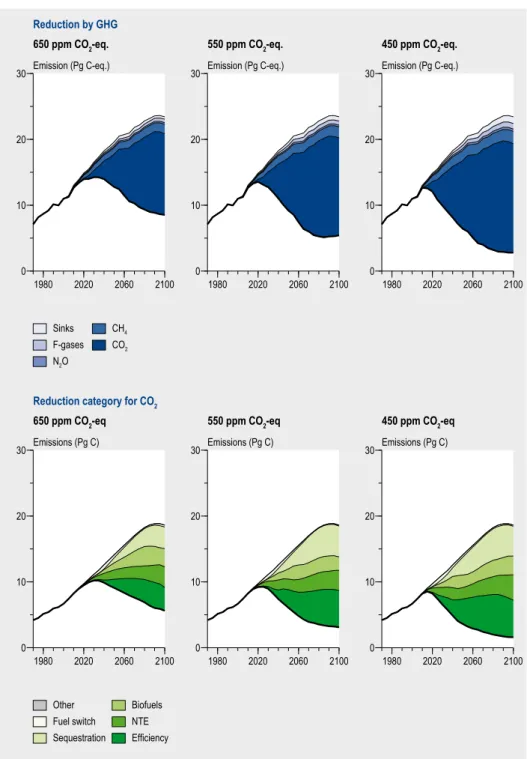
Estimates of the costs of emission reductions, even within a well-defined scenario con-text are subject to considerable uncertainties, as the potential contribution and cost of abatement options are spread across wide ranges. A sensitivity analysis was performed for a scenario that stabilizes at 550 ppm CO2-equivalent (Van Vuuren et al., 2006) in order to identify for which abatement options the alternative assumptions had a signif-icant impact on overall abatement costs. Selected options were tested one by one, but also all together and simultaneously. Most individual options did not affect the total abatement costs by more than 10% (up or downwards) until 2050, with the exception of energy crops. When accepting the high end of the literature estimates on the supply potential, and introducing the option to capture and store CO2 from bioenergy, costs dropped by up to 40%. The compounded effect of all options taken together, however, results in 40% lower to almost 100% higher costs in 2050. Beyond 2050 the impact of uncertainties in options increases further. This applied particularly to options that are expected to become viable on a large scale in the longer term, such as hydrogen (± 20% in 2100). The compounded effect of all options considered collectively falls into the range of -40% to +250% by 2100.
1.5 Applications
In parallel with the development steps outlined in the previous section, the IMAGE model has been applied to a variety of global studies. The specific issues and questions addressed in these studies have inspired the introduction of new model features and capabilities, and in turn, the model enhancements and extensions have broadened the range of applications that IMAGE can address. Since the publication of IMAGE 2.1 (Alcamo et al., 1998), subsequent versions and intermediate releases have been used in most of the major global assessment studies and other international analyses, as listed below:
• IPCC-Special Report on Emissions Scenarios (SRES): implementation of the B1 marker scenario and calculation of the other harmonized set of comprehensive emissions scenarios up to 2100 (De Vries et al., 2000; Nakicenovic et al., 2000; IMAGE-team, 2001a);
• uNEP Third Global Environment Outlook (GEO-3): assessment of environmental impacts from four global scenarios to 2030 (UNEP, 2002; UNEP/RIVM (2004); • Millennium Ecosystem Assessment (MA): development of four global scenarios
for the development of ecosystem services up to 2050 (Millennium Ecosystem Assessment, 2006b);
• EuRuralis-1: assessment of future prospects for agriculture and the rural areas in the EU-25 countries (Eickhout et al., 2006);
• Fourth Assessment Report of the IPCC (AR4): comprehensive global mitigation scenarios explored using IMAGE/TIMER/FAIR (Van Vuuren et al., 2006). Besides par-ticipating in the mitigation scenarios study, several MNP experts serve as contribut-ing/lead authors to the Working Group III report. A sensitivity study on the terres-trial carbon cycle was also done with IMAGE to obtain an adequate baseline against which to evaluate the potential for carbon sequestration options.
• Greenhouse Gas Reduction Policy (GRP) study: exploration of alternative climate change abatement goals and regimes in support of EU policy making using IMAGE/ TIMER/FAIR (European Commission, 2005);
• Second Global Biodiversity Outlook (GBO-2): background report for the UN Con-vention on Biodiversity: evaluation of baseline trends in biodiversity loss and effects of policy actions in different fields with IMAGE/GLOBIO up to 2050 (Alkemade et al., 2006);
• MNP Sustainability Outlook (DV): assessment of sustainability issues in land use and energy resulting from different scenarios, reflecting various perspectives on future directions for Dutch society (Netherlands Environmental Assessment Agency, 2004a,b);
• Global Nutrients from Watersheds (NEWS): preparation of data on global nutri-ent surface balances for the UNESCO-Intergovernmnutri-ental Oceanographic Commit-tee NEWS project (Seitzinger et al., 2005).
Currently, IMAGE 2.4 is engaged in three global environmental assessments, all sched-uled for release in 2007. In varying combinations with other teams, IMAGE forms part of a range of modelling frameworks, as outlined below:
• Fourth Global Environment Outlook of UNEP (GEO-4) will have ‘Environment for Human Well-being’ as the central theme, linking environment and development. IMAGE will play a major role, contributing to the energy outlook, land-use change and climatic consequences of the four updated GEO scenarios (see http://www.grid. unep.ch).
• International Assessment of Agricultural Science and Technology for Development (IAASTD) (http://www.agassessment.org) will be published in the autumn of 2007. Together with the International Food Policy Research Institute (IFPRI), the IMAGE team plays a pivotal role in the quantification of agricultural markets and environ-mental consequences. The scenarios of the Millennium Ecosystem Assessment (Mil-lennium Ecosystem Assessment, 2006b) will be used as a basis.
• Second Environmental Outlook of OECD is to be published in 2007. IMAGE’s task will be to develop the environmental baseline according to the economic projec-tions of OECD’s economic model ENV-Linkages for the first part of the Outlook. In the second part, the impacts of several policy packages will be analyzed, centering on the theme ‘policy coherence’. This applies to coherence across different policy areas within OECD and to more coherence between OECD and non-OECD member states, with a special focus on major players, the so-called BRIICS countries (Brazil, Russia, India, Indonesia, China and South Africa).
In addition to these global assessments, IMAGE is also widely used in other projects and studies at sub-global scale, mostly European and more often than not in consortia, including the main partners of the IMAGE development network. Examples include Nitro-Europe, MATISSE (on sustainability assessment methods and tools) SCENAR2020 (agriculture scenarios), ADAM (EU climate-response strategies comprising balanced adaptation and mitigation) and Eururalis 2.
1.6 What comes after IMAGE 2.4?
Concrete steps are being taken to initiate the development of further enhancements and extensions of IMAGE beyond what is offered in version 2.4. Following one of the recommendations of the IMAGE Advisory Board in 1999, these developments are pur-sued in close co-operation with institutes in the Netherlands and abroad with expertise complementary to the IMAGE team at MNP. Today a core network of partners is being built around IMAGE, and, where instrumental, joint projects have been submitted with partner institutes to secure the necessary resources. The Netherlands Meteorological Institute (KNMI), the Potsdam Institute for Climate Impact Research (PIK) and various departments and institutes of Wageningen University and Research Centre (WUR) now work closely together with MNP on a variety of topics. In addition, other network
partners contribute their knowledge and expertise in collaborative arrangements. The most important activities are highlighted below.
Emissions Reduction Allocation
In co-operation with the Netherlands Organization for Applied Scientific Research (TNO), a new Emissions Reduction Allocation Module (ERAM) was developed that allows for a flexible approach to different classes of environmental problems (acidifi-cation, climate change). Separate and simultaneous emission targets can be imposed, with full feedback on structural and technological adjustments in TIMER. The ERAM model covers emissions from all sectors, but in its current form only feedbacks on energy-related emissions are fully implemented. In a following phase, ERAM will be expanded with explicit optimization routines, and land-use emission reductions will be implemented that are comparable to the energy sector emissions.
Crop modelling
In co-operation with WUR-Plant Production Systems a plan has been developed for improved crop modelling on the IMAGE grid scale. The new model will link crop growth to climate, soil, water, nutrients and management parameters and thereby mark a substantial improvement in the current, less integrated treatment of the various processes and linkages in IMAGE 2.4. The work is envisaged as a joint WUR/MNP PhD research project.
Water supply and demand
Further integration of water supply and demand with other parts of IMAGE being con-sidered under a co-operative agreement with the WUR Centre for Water and Climate. Currently, the WaterGAP model of the University of Kassel (Alcamo et al., 2003) func-tions as a soft-link to IMAGE 2.4 in the form of an impact model to reflect changes in water supply and demand, and associated levels of water stress. The new model to be developed should provide a more integrated treatment of water in key processes like variable precipitation (SPEEDy), evapotranspiration (LPJ and the new crop model) and extraction for irrigation (the new crop model), households and industry.
SPEEDY/LPJ climate-vegetation modelling
The successor to the ECBilt model, the intermediate complexity 3D climate model SPEEDy has now, again in close co-operation with KNMI, been transferred to MNP to be linked to IMAGE. After several adjustments to make this coupling viable, the model was successfully coupled with the dynamic vegetation model LPJ at MNP. Test runs confirm the proper functioning of the coupled dynamic climate-vegetation system, although a few remaining flaws still need to be dealt with. Further work will involve a coupled ocean model, already ongoing at KNMI, and integration with the IMAGE framework. This integration will allow for capturing changes in climate variability and their im-plications for other sections of the model, e.g. natural vegetation, agricultural produc-tion and the hydrological cycle. It will also enable assessment of climatic impacts from changes in radiative forcing and land use.
In conjunction with the dynamic climate model SPEEDy (see above), the current BIOME vegetation model of IMAGE will be replaced by the dynamic vegetation model LPJ of the Potsdam Institute for Climate Impact Research. The LPJ model has been made available to MNP as part of a broader co-operation plan and has been adapted to fit into the IMAGE structure. The linkage to LPJ will allow a better representation of bio-geochemical cycles and analysis of the compounded effect of changes in these cycles, and biogeophysical changes associated with land use and hydrology.
Land allocation
An improved and extended land-allocation module for IMAGE will be developed using the WUR-Soil Inventory and Land Evaluation, to start with, the collaborative research focused on the European region in the first Eururalis project (Eickhout et al., 2006). This research is currently being continued in Eururalis-2. A country-by-country representation of drivers and parameters of future land-use determinants will be implemented consistent with regional totals and country information from LEI’s GTAP model. The main purpose is to better reflect determinants of spatial allocation proc-ess. A nested version of IMAGE has already been technically implemented as a start to achieving a better representation of Europe. This nested or ‘zoom’ version offers more intra-regional breakdown into smaller regions and countries and more spatial detail in one of the larger global IMAGE regions; all other regions are modelled at the standard IMAGE resolution and act as ‘background’. A new land-cover base map with 5 by 5 minute resolution was developed from satellite-based data for this purpose (Klein Goldewijk et al., 2006), and 5 by 5 minute resolution maps of soil characteristics and derived soil properties were prepared for use in IMAGE by ISRIC-World Soil Informa-tion (Batjes, 1997; 2002).
Bioenergy
In cooperation with the WUR Agro-economic Institute (LEI), work has been initiated on the inclusion of the currently lacking land use for bioenergy in the overall agro-economic modelling. To capture relevant aspects of the demand for energy crops, this will most probably imply an extension to the GTAP-E model, with explicit representa-tion of bioenergy in the relevant sectors, including land in the producrepresenta-tion funcrepresenta-tions. The GTAP-E model will have to be attuned to the more detailed TIMER model to ensure internal consistency.
Global Integrated Sustainability model
The Global Integrated Sustainability MOdel (GISMO) will be developed to quantita-tively address, position and analyze global sustainability questions, with a focus on the link between development and the environment. GISMO will build mainly on the already existing (global) simulation models within the IMAGE framework, but will also seek collaboration with (modelling) groups outside the MNP. These groups include, for example, the University of Denver for economy modelling; the institute for Medical Technology Assessment (iMTA-Erasmus University Rotterdam) for health modelling; and the Institute for Environmental Studies (Vrije Universiteit Amsterdam) for analyses of the role of institutions. The project does not intend to create a large new model,
but rather to develop a framework to address broad sustainable issues and assess the trade-offs and co-benefits of specific policies in an integrated way. Topics to be covered include population and health, poverty and biodiversity, the role of institutions in sustainable development and, elaborating on the work of Lucas and Hilderink (2004), on vulnerability and food security.
Valuable steps are being taken in the development of IMAGE 2.4 to secure the position of IMAGE as one of the leading frameworks for integrated assessment of global sustainability issues. The further developments initiated within the network of collaborating institutes offer excellent prospects for the future, in which the IMAGE model framework will make an important contribution to the analysis of crucial interactions between human well-being and ecological goods and services.
2
PEOPLE IN THE PIXEL: GRID-BASED POPuLATION
DYNAMICS uSING PHOENIX
• Population change and population distribution are important drivers of global environmental change. Population projections are either derived from external sources, or simulated within the IMAGE 2.4 framework by the PHOENIX model. • In IMAGE 2.4, grid-based population dynamics have been improved by introducing
a new downscaling algorithm. Population within a grid cell is calculated with a pro-portional method using available country-specific data combined with the trends on the level of world regions, as determined by PHOENIX. This approach allows for simulating shifts in population within IMAGE regions.
• For further improvement of grid-based population projections, an attractiveness function is proposed, which allocates population changes based on allocation factors varying in both time and space. This attractiveness function can be used to mimic higher urbanization rates in specific locations or initiate the formation of new urban areas.
2.1 Introduction
The proportion of the population living in urban areas is expected to increase in the coming decades. In 2007 roughly 50% of the world population will be living in urban areas, while in 1950 this was only about 30% (UN, 2003). Urbanization can result in the worsening of living conditions in urban areas. Crowding itself already increases oppor-tunities for easily transmittable diseases such as tuberculosis (Gray, 2001). In addition, poverty and psychosocial health problems may occur in urban areas, including increased health risks from malnutrition and HIV/AIDS, but also higher lifestyle-re-lated health risks such as smoking, addictive substances and limited social support (Harpam et al., 2003). Moreover, environmental problems such as inadequate water and sanitation, and various forms of contamination, can also affect health. The (long-term) effect of global environmental change on water and food availability through, for example, temperature increase, land degradation and changing precipitation patterns can worsen these environmental conditions and even affect demographic processes by increasing health risks (Parry et al., 2001). Similar to these urban-specific determinants of health and mortality, the other two basic demographic components, fertility and migration, are interlinked with socio-economic and environmental aspects (Hilderink, 2000b), which are different for urban than for rural areas. In developing countries, the total fertility rate (TFR) in cities with a population over 5 million is half of that in rural areas (Montgomery et al., 2003).
The pressure on the environment may also increase as a result of urbanization. Ex-pansion of cities forces the production of bulk food to move away from where people live, making food supply more dependent on energy for transport and infrastructure. Production of vegetables and meat often takes place in peri-urban areas, where highly
intensive production systems act as point sources of emissions of ammonia, nitrate, methane and other pollutants. Water scarcity and deteriorating water quality are often difficult to prevent since a growing city generally depends on water supply within its area, provided by surface water or groundwater resources.
Both the environmental and socio-economic aspects are included in various popu-lation projections (Rotmans and De Vries, 1997; Hilderink, 2000b; Lutz and Goujon, 2001). However, spatially explicit population projections are rare. The European Union is one of the few exceptions, carrying out projections up to 2025 on sub-national level on the basis of the sophisticated cohort-component methodology (Eurostat, 2005). In IMAGE, regional population changes are mostly obtained from exogenous sources, for example, the IPCC SRES scenarios (Nakicenovic et al., 2000) and the downscaling to the 0.5 by 0.5 degree grid cells under the assumption of uniform population changes. A limitation of IMAGE 2.4 (and earlier versions) is that the built-up (urban) area is assumed not to change in scenarios, and this may lead to unrealistic results of downscaling regional population estimates.
This chapter explores how the current methodology can be refined and improved in order to simulate spatially explicit population dynamics for urban and rural popula-tions at a high resolution. First, data limitapopula-tions related to population growth in rural and urban areas (section 2.2) and future population changes, components of population growth and modelling population changes (2.3) are discussed. Subsequently, we present a number of improvements to the modelling of population dynamics in IMAGE, and further possibilities for improvement (section 2.4).
2.2 urbanization and population density:
data limitations
Urbanization
The possible impacts of urbanization, both on the human and the environmental system, are beyond dispute. However, the definition of what is considered to be urban area is rather ambiguous. The World Urbanization Prospects of the United Nations (2001) use data provided by National Statistical Offices (NSO) of all countries. As a result, definitions of urban area and urban population within UN projections show a very broad variation depending on the methodology applied by each NSO.
Most definitions are based on the number of inhabitants in a city. The threshold value of the number of persons to be counted as ‘urban area’ ranges between 200 (Norway, Greenland) and 20,000 (Nigeria). Other countries use a selection of their major cities (in Denmark this comprises the capital city and all provincial capitals, while, for example, in India a minimum population density of 390 persons per square kilometre is com-bined with indicators for the structure of the economy to define urban population. In
addition to differences in interpretation, definitions also change over time in countries such as China, making comparisons difficult (White et al., 2003).
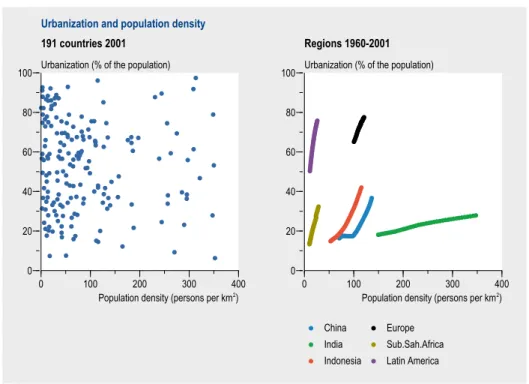
Population density and the level of urbanization do not seem to be correlated, at least on the national scale (Figure 2.1). Time-series analysis suggests, however, that the pro-portion of urban population increases with increasing population density.
Population density
Instead of using the number of inhabitants of a city or other characteristics mentioned above, population density could be used as a proxy for urban area. The gridded popu-lation of the world (GPW) (CIESIN, 2005) provides popupopu-lation density data with a spa-tial resolution of 2.5 by 2.5 minutes for 1990, 1995 and 2000 from population census data for 399,747 administrative units. LandScan (2001) provides population density maps at an even higher spatial detail of 1 by 1 km. In addition to population census data, LandScan (2001) included other factors such as roads, slope, land cover, night-time lights and coastlines.
In IMAGE 2.4 urban area or built-up area is derived from the DISCover version 2 database (Loveland et al., 2000). Built-up areas are assumed not to be available for any other type of land use. IMAGE 2.4 does not simulate changes in the size of the built-up area. An implication of this assumption is that the urban population only increases with changes in the population living within the constant built-up areas.
0 100 200 300 400
Population density (persons per km2) 0
20 40 60 80
100 Urbanization (% of the population)
191 countries 2001
Urbanization and population density
0 100 200 300 400
Population density (persons per km2) 0
20 40 60 80
100 Urbanization (% of the population)
China India Indonesia Europe Sub.Sah.Africa Latin America Regions 1960-2001
Figure 2.1. Urbanization and population density for 191 countries for the year 2001 and for selected countries and regions for the period 1960-2001 (World Bank, 2004).
2.3 Future population
Population change
Changes in population size are the simplest way of dealing with demographic changes. The world population passed the number of 6 billion people in 1999 and is current-ly growing at a rate of 1.3% per year. Most of this growth occurs in Asia and Africa, while the growth of the population in the EU25 is only slightly positive (Eurostat, 2005); the population for Europe as a whole has even been decreasing since 1998 and may continue to decrease for at least the coming 50 years (UN, 2004). In Eastern Asia (dominated by China) a negative growth rate may be reached just before 2040. All growth percentages show a gradual decline in the coming decades. Some of the regions had their peaks in growing percentages in the 1950s (Northern America and Europe) and in the 1960s (Eastern and South-eastern Asia), while growth rates of Africa peaked in the 1980s.
The combination of these growth percentages with the population size yields the absolute change in population. Despite the fact that growth percentages are rapidly declining, the peak of population increase in absolute terms is still to come in some regions (Figure 2.2). Africa, for example, shows a growing increase of the population up to 2030. Around that year, the population is expected to increase by more than 25 million per year. The world population showed a growth of almost 80 million per year in 2002 and is expected to decrease to around 40 million per year in 2050.
For exploring future population changes we rely on the available population projec-tions, mostly at national or regional level. Most of these projections do not distinguish between urban and rural population. One of the few exceptions is formed by the world urbanization prospects of the United Nations (UN, 2003), providing urbanization rates for 228 countries for the period up to 2030. The methodology applied to these tions was already used in the 1970s and 1980s (UN, 1974; 1980); it consists of projec-ting the urbanization ratio using a logistic pathway with a ceiling of 100%. Combining these ratios with the projections for the total population yields the urban population projections (UN, 2003).
Rogers (1985) developed a more advanced methodology, applying different growth rates for both the urban and rural populations and including migration flows between rural and urban populations. This method has been refined and used for analysis of causes of urban growth (White et al., 2003), taking into account different underlying population dynamics. Urban growth can be attributed to three causes: (i) overall population growth through natural increase; (ii) rural-to-urban migration; and (iii) reclassification of rural areas as urban areas.
Reclassification occurs when a certain population density threshold is exceeded and rural area becomes urban area, but also by changing the definition of urban area. Natural increase, i.e. the difference between births and deaths, along with
reclassifica-tion, accounts for an average of 61% of urban population growth in developing coun-tries, while rural-to-urban migration accounts for the other 39% (Gross et al., 1997).
Components of population change
Calculating the changes in total population does not provide insight into the under-lying components of such changes. The (natural) growth of the world population is a result of the difference between the total number of births and deaths. Births and death rates can be related to the total population size, which results in the crude birth rate (CBR) and the crude death rate (CDR), reflecting the numbers of births and deaths, respectively, per 1000 persons in a given year. The growth rate of the world population is thus determined by the difference between the CBR and CDR.
Another basic component of population change is migration, determined by external (international migration) and internal flows. External flows are usually applicable to the urban population, although the flow is often preceded by the internal migration within a country, the actual urbanization process. Socio-economic factors (e.g. income, employment opportunities and schooling) and health risks (e.g. pollution, crowding ef-fects, access to safe drinking water, sanitation and food availability) have a major effect on the urban and rural population growth.
1950 1970 1990 2010 2030 2050 -1 0 1 2 3 % Africa Asia Europe
Latin America & Caribbean Northern America Oceania World
Relative growth
Net annual population change
1950 1970 1990 2010 2030 2050 -10 0 10 20 30 million persons Africa Europe Latin America & Caribbean
Northern America Asia: Eastern Asia: South-central
Absolute growth
Figure 2.2. Net annual population change (annual growth percentage and absolute growth) for selected regions, 1951-2050, medium variant of the UN (UN, 2000).