Int eg rat ed A ss es sm ent o f G lo ba l E nv iro nm ent al C ha ng e w ith I M AGE 3 .0 PB L N et he rla nd s E nv iro nm ent al A ss es sm ent A ge nc y
Integrated
Assessment
of Global
Environmental
Change with
Model
description
and policy
applications
IMAGE
3.0
Integrated Assessment of Global
Integrated Assessment of
Global Environmental Change
with IMAGE 3.0
Model description and policy
applications
Editors
This publication can be downloaded from: www.pbl.nl/en.
Parts of this publication may be reproduced, providing the source is stated, in the form: Stehfest, E., van Vuuren, D., Kram, T., Bouwman, L., Alkemade, R., Bakkenes, M., Biemans, H., Bouwman, A., den Elzen, M., Janse, J., Lucas, P., van Minnen, J., Müller, C., Prins, A. (2014), Integrated Assessment of Global Environmental Change with IMAGE 3.0. Model description and policy applications, The Hague: PBL Netherlands Environmental Assessment Agency.
PBL Netherlands Environmental Assessment Agency is the national institute for strategic policy analysis in the field of environment, nature and spatial planning. We contribute to improving the Integrated Assessment of Global
Environmental Change with IMAGE 3.0. Model description and policy applications © PBL Netherlands Environmental Assessment Agency The Hague, 2014 ISBN: 978-94-91506-71-0 PBL publication number: 735 Corresponding authors
Elke Stehfest, elke.stehfest@pbl.nl Tom Kram, tom.kram@pbl.nl Editors
Elke Stehfest, Detlef van Vuuren, Tom Kram, Lex Bouwman
Lead authors
Elke Stehfest, Detlef van Vuuren, Tom Kram, Lex Bouwman, Rob Alkemade, Michel Bakkenes, Hester Biemans (WUR), Arno Bouwman, Michel den Elzen, Jan Janse, Paul Lucas, Jelle van Minnen, Christoph Müller (PIK), Anne Gerdien Prins
A list of authors is provided for each section.
Acknowledgements
We are grateful for the cooperation with Potsdam Institute for Climate Impact Research, Wageningen UR and Utrecht University Programming and website
Liesbeth de Waal, Alja Vrieling, and Rineke Oostenrijk
English editing
Annemieke Righart, Helen West Graphics
Beeldredactie PBL Cover photo Colourbox.com Design & layout Textcetera, The Hague Production co-ordination PBL Publishers
Printer
Purpose and set-up of this book
• This book presents a complete and concise description of IMAGE 3.0, the Integrated Model to Assess the Global Environment version 3.0.
• The book has been prepared for those working at the science-policy interface, a client, partner or user for assessments with IMAGE 3.0.
• All model components are described in broad terms, focusing on
functionalities, feedbacks, uncertainties, and policy applications. For more detail, reference is made to underlying scientific papers, listed at the end of each section as key publications.
• Chapter 1 (Introduction) and Chapter 2 (Overview IMAGE 3.0) provide an introduction to IMAGE 3.0, and the main model setup.
• All model components presented in Figure 1 are described in respective Sections of Chapters 3 to 8, and can be read separately.
• Each model component is described as follows: 1) Introduction, 2) Model description, 3) Policy issues, and 4) Data, uncertainties and limitations, 5) Key publications and 6) Input/Output Table. Figures include a model flow diagram, baseline results, and results for one or several policy interventions. • The results illustrate the type of studies that can be carried out with IMAGE. They are based on recent IMAGE assessments, and as far as possible taken from peer-reviewed literature or published PBL reports. Thus, the underlying baselines may vary throughout the book.
• The content of this book is presented on the IMAGE website (www.pbl.nl/ image), where additional information and model updates can be found. This website also contains a user interface to view IMAGE scenario results.
Figure 1
IMAGE 3.0 framework
Source: PBL 2014
Drivers
(Population, economy, policies, technology, lifestyle, resources)
Climate policy Air pollution and energy policies Land and biodiversity policies Policy responses Human system Earth system Impacts Agricultural economy
Land cover and land use Emissions
Energy supply and demand
Land-use allocation Forest
management Livestocksystems
Agriculture and land use
Land Atmosphere and Oceans
Energy demand Energy conversion
Atmospheric composition and climate Carbon cycle and
natural vegetation
Crops and grass
Water Nutrients
Energy supply
Climate impacts
Agricultural
impacts Water stress
Terrestrial
biodiversity biodiversityAquatic Flood risks degradationLand Ecosystemservices developmentHuman
333 4.2.14.2.1 4.2.1 4.1.1 4.1.1 4.1.1 4.1.24.1.24.1.2 8.1 8.1 8.1 8.1 8.1 8.2 8.2 8.2 8.2 8.2 8.3 8.3 8.3 8.3 8.3 4.1.34.1.34.1.3 5.25.25.2 5.15.15.1 4.2.2 4.2.2 4.2.2 4.2.24.2.24.2.2 6.16.1 6.1 7.2 7.27.2 7.2 7.1 7.1 7.1 7.1 7.1 7.17.1 7.1 7.17.17.17.17.17.17.17.1 7.17.17.17.17.17.17.17.1 xx x 7.3 7.3 7.3 7.3 7.47.47.47.4 7.57.57.57.5 7.67.67.67.6 7.77.77.77.7 6.26.26.2 6.46.4 6.4 6.56.56.5 6.36.36.3 4.2.3 4.2.3 4.2.3 4.2.3 4.2.3 4.2.44.2.44.2.44.2.44.2.4 Section pbl.nl
Dark-coloured boxes refer to model components with section reference. Impacts are calculated in model components shown in the lower box, and also inside the Human system and Earth system (see Section 7.1).
Contents
1 Introduction 12
2 Overview of IMAGE 3.0 32 3 Drivers 55
4 Human system 70
4.1 Energy Supply and Demand 71 4.1.1 Energy demand 75
4.1.2 Energy conversion 89 4.1.3 Energy supply 99
4.2 Agriculture and land use 110 4.2.1 Agricultural economy 111 4.2.2 Forest management 123 4.2.3 Land-use allocation 133 4.2.4 Livestock systems 145
5 Interaction between the Human and the Earth system 154
5.1 Land cover and land use 155 5.2 Emissions 159
6 Earth system 174
6.1 Carbon cycle and natural vegetation 177 6.2 Crops and grass 187
6.3 Water 197 6.4 Nutrients 209
6.5 Atmospheric composition and climate 221
7 Impacts 232 7.1 Overview 233 7.2 Terrestrial biodiversity 235 7.3 Aquatic biodiversity 247 7.4 Flood Risks 255 7.5 Land degradation 265 7.6 Ecosystem services 275 7.7 Human development 289 8 Policy responses 302 8.1 Climate policy 303
8.2 Air pollution and energy policies 313 8.3 Land and biodiversity policies 321
9 Concluding remarks 334 10 References 338
9
Preface |
Preface
The IMAGE suite of models, run by PBL, is a dynamic integrated assessment framework to analyse global change. IMAGE allows us to look into the future and helps to identify and map out major challenges ahead. A more balanced interaction between human development and the natural system is needed. IMAGE supports policymakers to address major transitions regarding the use of energy, land and water.
The version of IMAGE presented here represents the result of many years of develop-ment. The first, single-region version of IMAGE focused on climate change and was developed in the late 1980s. Since then, updates and extensions, as presented in several publications, have culminated in this latest incarnation, the IMAGE 3.0 framework. IMAGE is now better equipped to analyse, among other things, water-related issues. IMAGE can be used as a tool to construct long-term scenarios and is often deployed to feed policy analysis. The modelling framework and the results have provided core input for major international assessments and scenarios studies, such as the Intergovernmental
Panel on Climate Change (IPCC), the Global Environment Outlooks (GEOs) by the United Nations Environment Programme (UNEP) and the OECD Environmental Outlooks. The purpose of this publication is to elucidate both the model’s current structure and how it can be applied in scenario development and policy analysis. Input assumptions and data, model functionality and impact indicators are described and illustrated by examples from recent work. The same documentation, in a more dynamic way, can also be found on the new IMAGE website (www.pbl.nl\image).
This new version of IMAGE may be ‘grown up’, retirement is still way beyond our horizon. There is a constant drive to extend and improve the model framework in order to address emerging policy questions. With increasing public awareness of key sustain-ability challenges, the focus is moving away from identifying problems towards assess-ment of solutions and policy responses. This publication offers valuable stepping stones towards better facilitating well-founded scientific analyses, supporting a transition towards global sustainable development. The IMAGE update secures the framework’s value for the coming years, and thus the position of IMAGE as one of the leading frameworks for integrated assessment.
Over the years, many people have contributed to the development of IMAGE. PBL is indebted to all of them.
Maarten Hajer Director-General
11 1 Introduction |
Introdu
Ct
Ion
Introdu
Ct
Ion
1 Introduction
Tom Kram, Elke Stehfest, Detlef van Vuuren, Lex Bouwman
1.1 Setting the stage 13 1.2 IMAGE 3.0 in a nutshell 17 1.3 A brief history of IMAGE 22
1.4 Organisational set-up and scientific quality 25 1.5 Uncertainties 26
13
1 Introduction | 13
1 Introduction |
1
1.1 Setting the stage
Background
The IMAGE 3.0 framework addresses a set of global environmental issues and sustainability challenges. The most prominent are climate change, land-use change, biodiversity loss, modified nutrient cycles, and water scarcity. These highly complex issues are characterised by long-term dynamics and are either global issues, such as climate change, or manifest in a similar form in many places making them global in character. Typically, these global environmental issues have emerged as human societies have harnessed natural resources to support their development, for instance to provide energy, food, water and shelter.
Economic growth and increasing wealth have brought enormous benefits to human societies but have been accompanied by large-scale changes to the global environment system. These changes result from clearing land, burning biomass, domesticating animals and developing crop production systems, and from human activities that have lead to emissions of air pollutants and greenhouse gases. Mankind’s influence on the state and functioning of the natural environment has steadily increased in degree and spatial scale over the last 150 years.
Science now recognises humans as a geological force (Zalasiewicz et al., 2010) and suggests that the most recent age should be called the Anthropocene, a man-made era. In the last decades, concern has been growing that the scale of human interaction with the natural environment is reaching levels that could have consequences for the Earth’s capacity to continue supporting an increasing population. For example, the risk that emissions and atmospheric build-up of greenhouse gases from the use of fossil fuels and from other sources will seriously affect global climate.
Key policy challenges are how to avoid or reduce current and future tension between human activity and natural systems. This requires understanding the present ‘state-of-the-world’ as a result of the main drivers in the past. It is also essential to explore how the world could unfold in the future and the implications for human development, including how degradation of natural systems influences opportunities for human development. Then, alternative pathways can be identified, and their merits and downsides assessed to guide policy-making.
To understand these complex, global and long-term issues, and to design effective response strategies, integrated assessment models such as IMAGE 3.0 have been developed. Integrated assessment models cover key processes, ranging from human activities as the primary drivers, to the behaviour of the natural system, and impacts on the natural environment and on human development.
Integrated environmental assessment
Integrated assessment models (IAMs) have been developed to describe the key processes in the interaction of human development and the natural environment. IAM methods and tools draw on functional relationships between activities, such as provision of food, water and energy, and the associated impacts. Traditionally, most IAMs focused on climate change and air pollution. More recently, these models have been expanded to assess an increasing number of impacts, such as air and water quality, water scarcity, depletion of non-renewable resources (fossil fuels, phosphorus), and overexploitation of renewable resources (fish stocks, forests). IAMs are designed to provide insight into how driving factors induce a range of impacts, taking into account some of the key feedback and feed-forward mechanisms. To achieve this effectively, IAMs need to be sufficiently detailed to address the problem, yet simple enough to be applicable in assessments, including exploration of uncertainties, and without loss of transparency because of the complex relationships involved (see Section 1.2).
Objective and scope of IMAGE
IMAGE is a comprehensive integrated modelling framework of interacting human and natural systems. Its design relies on intermediate complexity modelling, balancing level of detail to capture key processes and behaviour, and allowing for multiple runs to explore aspects of sensitivity and uncertainty of the complex, interlinked systems (see Section 1.5).
The objectives of IMAGE are as follows:
– To analyse large-scale and long-term interactions between human development and the natural environment to gain better insight into the processes of global environmental change;
– To identify response strategies to global environmental change based on assessment of options for mitigation and adaption;
– To indicate key interlinkages and associated levels of uncertainty in processes of global environmental change.
IMAGE is often used to explore two types of issues:
– How the future unfolds if no deliberate, drastic changes in prevailing economic, technology and policy developments are assumed, commonly referred to as baseline, business-as-usual, or no-new-policy assessment;
– How policies and measures prevent unwanted impacts on the global environment and human development.
The baseline scenario is used to assess the magnitude and relevance of global environmental issues and how they relate to human activities. This is important at the
15
1 Introduction | 15
1 Introduction |
1
practices. To some degree, impacts may be taken into account in an endogenous feedback loop by the integrated assessment procedure. For instance, changes in temperature and precipitation resulting from climate change have an effect on agricultural productivity and water availability. Biophysical feedbacks of this type are part of the IMAGE model, see Chapters 4 to 8.
Often, alternative scenarios explore possible solutions to a problem, such as climate change, by assuming societal and policy responses to the impacts projected under baseline conditions. To this end, alternative cases are developed and implemented in model compatible terms to test how the outcomes change. They also reveal synergies and trade-offs between policy issues. For example, with increasing crop yields, less land is required to grow a given amount of crops, and thus loss of natural areas is reduced to the benefit of ecosystems rich in biodiversity. Carbon emissions from land use are also reduced when less land is converted to agriculture, but fertiliser application may increase to sustain the higher yields with emissions to air, groundwater and surface water as a consequence. Furthermore, higher yields may contribute to lower food prices and thus to reducing undernourishment and hunger to the benefit of human health.
IMAGE in comparison to other IAMs
Various types of IAMs have been developed, evolving from different classes of models with a specific disciplinary focus and point of entry. These are discussed briefly in order to identify the position of IMAGE in relation to other IAM models. The common feature of all IAM models is that they all describe a combination of the Human and Earth systems to gain better understanding global environmental problems.
As indicated above, a key trade-off in IAMs is detail versus simplification. Sufficient detail is required to include all relevant processes in both the Human and the Earth system according to state-of-the-art knowledge. Simplicity is needed to ensure sufficient transparency in complex model systems, and to explore uncertainties. For instance, a crop growth model with data input on observed, local climate, soil layers and crop variety parameters may perform well at field scale. However, such a model is less suitable for use in an IAM that requires more generic crop growth representation operating as part of a global scale system. Another limitation to the level of detail captured in IAMs is the lack of consistent and complete datasets with global coverage. While models are developed for different purposes, and thus have limited overlap in scope and detail, in practice many hybrid models are in use. As illustrated in Figure 1.1, IAM models are between models with a primary focus on the Earth system (Earth System Models) and models that focus on the Human system such as pure economic models.
Within the IAM group clearly different model groups exists, and IMAGE is characterised by relatively detailed biophysical processes and a wide range of environmental indicators. IMAGE 3.0 also includes an economic model to represent the agricultural
system, and a process model to describe the energy system, but has less detail on economics and policy instruments than other energy models. In terms of application, many models are designed and used for climate policy analysis, such as FUND and DICE, while other models address a broader range of issues. IMAGE was originally designed to assess the global eff ect of greenhouse gas emissions and now covers a broad range of environmental and sustainability issues.
Another reason for diff erences between IAM models is their history. Many have evolved from technical process models of energy systems to cover environmental issues, such as air pollution and more frequently also climatic change. Technical process models describe the physical fl ows of energy from primary resources through conversion processes, and transport and distribution networks to meet specifi c demands for energy carriers or energy services. The costs associated with the various components are tracked, and relative costs of competing technologies and supply chains determine
Figure 1.1
Different types of global models distinguished according to level of detail
Source: PBL 2014 Complex environment Simple environment Complex economics Simple economics Earth system models IMAGE Integrated assessment models Economic integrated assessment models Computable general equilibrium models pbl.nl
IAM models and other models with global coverage diff er in their level of detail on economic aspects (horizontal) and biophysical/technical aspects (vertical).
17
1 Introduction | 17
1 Introduction |
1
Other IAMs have their roots in economics and have evolved from models assessing the production of economic outputs to contribute to consumer utility by allocating input factors, such as capital, labour and increasingly also energy, materials and natural resources. Substitution between sectors, inputs and commodities produced depends on their relative prices, taking into account policy interventions, such as taxes and subsidies, import regulations and other market and non-market instruments. Economic models include the OECD model ENV-Linkages and the model MAGNET. The latter has been integrated into IMAGE 3.0 (see Section 4.2.1). While economic models account for consistency between economic sectors, these models tend to treat the economy in terms of material flows, biochemical, physical and ecological processes in a stylised way, which limits their capacity to capture feedback mechanisms of the natural system. Finally, IAMs can also be distinguished by the level of geographic detail in land-based activities. To address geographical distribution of bio-geochemical and bio-geophysical processes in conjunction with human development, the IMAGE framework has been developed with a high level of geographic detail. IMAGE provides a relatively high level of detail on land-based processes, such as water, carbon and nutrient cycles, and derived indicators for biodiversity loss and flood risks, also in temporal and spatial resolution.
1.2 IMAGE 3.0 in a nutshell
IMAGE 3.0 is a comprehensive integrated modelling framework of interacting human and natural systems. The model framework is suited to large scale (mostly global) and long-term (up to the year 2100) assessments of interactions between human development and the natural environment, and integrates a range of sectors, ecosystems and indicators. The impacts of human activities on the natural systems and natural resources are assessed and how such impacts hamper the provision of ecosystem services to sustain human development.
The model identifies socio-economic pathways, and projects the implications for energy, land, water and other natural resources, subject to resource availability and quality. Unintended side effects, such as emissions to air, water and soil, climatic change, and depletion and degradation of remaining stocks (fossil fuels, forests), are calculated and taken into account in future projections.
IMAGE has been designed to be comprehensive in terms of human activities, sectors and environmental impacts, and where and how these are connected through common drivers, mutual impacts, and synergies and trade-offs. IMAGE 3.0 is the latest version of the IMAGE framework models, and has the following features:
– Comprehensive and balanced integration of energy and land systems was a pioneering feature of IMAGE. Recently, other IAMs have been developed in similar directions and comprehensive IAMs are becoming more mainstream.
Figure 1.2
IMAGE 3.0 framework
Source: PBL 2014
Drivers
(Population, economy, policies, technology, lifestyle, resources)
Climate policy Air pollution and energy policies Land and biodiversity policies Policy responses Human system Earth system Impacts Agricultural economy
Land cover and land use Emissions
Energy supply and demand
Land-use allocation Forest
management Livestocksystems
Agriculture and land use
Land Atmosphere and Oceans
Energy demand Energy conversion
Atmospheric composition and climate Carbon cycle and
natural vegetation
Crops and grass
Water Nutrients
Energy supply
Climate impacts
Agricultural
impacts Water stress
Terrestrial
biodiversity biodiversityAquatic Flood risks degradationLand Ecosystemservices developmentHuman
333 4.2.14.2.1 4.2.1 4.1.1 4.1.1 4.1.1 4.1.24.1.24.1.2 8.1 8.1 8.1 8.1 8.1 8.2 8.2 8.2 8.2 8.2 8.3 8.3 8.3 8.3 8.3 4.1.34.1.34.1.3 5.25.25.2 5.15.15.1 4.2.2 4.2.2 4.2.2 4.2.24.2.24.2.2 6.16.1 6.1 7.2 7.27.2 7.2 7.1 7.1 7.1 7.1 7.1 7.17.1 7.1 7.17.17.17.17.17.17.17.1 7.17.17.17.17.17.17.17.1 xx x 7.3 7.3 7.3 7.3 7.47.47.47.4 7.57.57.57.5 7.67.67.67.6 7.77.77.77.7 6.26.26.2 6.46.4 6.4 6.56.56.5 6.36.36.3 4.2.3 4.2.3 4.2.3 4.2.3 4.2.3 4.2.44.2.44.2.44.2.44.2.4 Section pbl.nl
Dark-coloured boxes refer to model components with section reference. Impacts are calculated in model components shown in the lower box, and also inside the Human system and Earth system (see Section 7.1).
19
1 Introduction | 19
1 Introduction |
1
– Coverage of all emissions by sources/sinks including natural sources/sinks makes IMAGE appropriate to provide input to bio-geochemistry models and complex Earth System Models (ESMs).
– In addition to climate change, which is the primary focus of most IAMs, the IMAGE framework covers a broad range of closely interlinked dimensions. These include water availability and water quality, air quality, terrestrial and aquatic biodiversity, resource depletion, with competing claims on land and many ecosystem services. – Rather than averages over larger areas, spatial modelling of all terrestrial processes
by means of unique and identifiable grid cells captures the influence of local conditions and yields valuable results and insights for impact models. – IMAGE is based on biophysical/technical processes, capturing the inherent
constraints and limits posed by these processes and ensuring that physical relationships are not violated.
– Integrated into the IMAGE framework, MAGICC 6.0 is a simple climate model calibrated to more complex climate models. Using downscaling tools, IMAGE scales global mean temperature change to spatial patterns of temperature and
precipitation changes, which vary between climate models.
– Detailed descriptions of technical energy systems, and integration of land-use related emissions and carbon sinks enable IMAGE to explore very low greenhouse gas emissions scenarios, contributing to the increasingly explored field of very low climate forcing scenarios.
– The integrated nature of IMAGE enables linkages between climate change, other environmental concerns and human development issues to be explored, thus contributing to informed discussion on a more sustainable future including trade-offs and synergies between stresses and possible solutions.
Model components
The components of the IMAGE framework are presented in Figure 1.2, which also shows the information flow from the key driving factors to the impact indicators. An overview of the model components is provided in Chapter 2, and the components are described in Chapters 3 to 8.
Future pathways or scenarios depend on the assumed projections of key driving forces. Thus, all results can only be understood and interpreted in the context of the assumed future environment in which they unfold.
As a result of the exogenous drivers, IMAGE projects how human activities would develop in the Human system, namely in the energy and agricultural systems (see Figure 1.2). Human activities and associated demand for ecosystem services are squared to the Earth system through the ‘interconnectors’ Land Cover and Land Use, and Emissions (see Figure 1.2).
Assumed policy interventions lead to model responses, taking into account all internal interactions and feedback. Impacts in various forms arise either directly from the
model, for example the extent of future land-use for agriculture and forestry, or the average global temperature increase up to 2050. Other indicators are generated by activating additional models that use output from the core IMAGE model, together with other assumptions to estimate the effects, for example, biodiversity (GLOBIO; see Sections 7.2 and 7.3) and flood risks (see Section 7.4).
Currently, impacts emerging from additional models do not influence the outcome of the model run directly. The results obtained can reveal unsustainable or otherwise undesirable impacts, and induce exploration of alternative model assumptions to alleviate the problem. As the alternative is implemented in the linked models, synergies and trade-offs against other indicators are revealed.
To apply IMAGE 3.0, all model settings are adjusted so that the model reproduces the state-of-the-world in 2005. The model calculates the state in 2005 over the period starting in 1970, using exogenous data to calibrate internal parameters. From 2005 onwards, a range of model drivers rooted in more generic narratives and scenario drivers must be prepared either by experts or teams at PBL or in partner institutes to provide inputs, such as population and economic projections. For more information on drivers, see Chapter 3. These steps are taken in consultation with stakeholders and sponsors of the studies, and with project partners.
An IMAGE run produces a long list of outputs representing the results of the various parts of the framework, either as end indicator or as intermediate inputs driving operations further downstream. Together the outputs span the range from drivers to pressures, states and impacts.
The IMAGE 3.0 model has a wide range of outputs, including: – energy use, conversion and supply;
– agricultural production, land cover and land use; – nutrient cycles in natural and agricultural systems; – emissions to air and surface water;
– carbon stocks in biomass pools, soils, atmosphere and oceans; – atmospheric emissions of greenhouse gases and air pollutants;
– concentration of greenhouse gases in the atmosphere and radiative forcing; – changes in temperature and precipitation;
– sea level rise;
– water use for irrigation.
These standard outputs are complemented with additional impact models with indicators for biodiversity, human development, water stress, and flood risks.
21
1 Introduction | 21
1 Introduction |
1
This depends on location-specific biophysical conditions, and on the level of human development (for example high income, industrialised versus low income, subsistence agriculture dominated regions, and all levels in between). It implies that indicators at the level of global totals or global averages are rarely adequate to reveal the real problems. Furthermore, policy interventions and governance structures are not uniform across scales and administrative entities, and are bound by cultural and political history. To capture spatial and multi-scale differences, IMAGE models socio-economic developments in 26 world regions (see Figure 1.3). Land use, land cover, and associated biophysical processes are treated at grid level to capture local dynamics. The grid size has been reduced to 5x5 arcminutes in IMAGE 3.0 (corresponding to 10x10 km at the equator), from 30x30 arcminutes (0.5x0.5 degrees) in IMAGE 2. Operating within global boundaries, the regional approach provides insight to identify where specific problems manifest, where the driving factors are concentrated, and how changes in some regions influence other regions.
Figure 1.3
The 26 world regions in IMAGE 3.0
Canada USA Mexico Central America Brazil Rest of South America South Africa Rest of Southern Africa Northern Africa Western Africa Eastern Africa Western Europe Central Europe Turkey Ukraine region Central Asia Russia region Middle East India
Rest of South Asia Indonesia region Southeast Asia Japan Korea region China region Oceania Antarctica Greenland Source: PBL 2014 pbl.nl
Areas of application
An integrated framework, such as IMAGE 3.0, covers a wide range of components of the Human and Earth systems, and contains variables in many domains. Development and applications of the IMAGE framework focus on two interrelated clusters: energy and climate; and food, land, water and biodiversity.
There are many relationships between these two clusters in IMAGE. For instance, climate change has impacts on agriculture and nature, land use for bioenergy has implications for food prices, and water for irrigation competes with water for coolant in electric power plants. Synergies and trade-offs are interesting from the perspective of policy discussions with regard to the complicating effects of unintended and often undesirable impacts. IMAGE 3.0 has the capacity to generate a long and widely diverging set of indicators for different sectors and regions.
Modular structure
Over the years, various components of the IMAGE framework have been replaced by expert models developed outside IMAGE, which can be used either as stand-alone models or within the IMAGE framework.
The IMAGE 3.0 core model comprises most processes in the Human system, the Earth system and their connectors Land cover/Land use and Emissions, and parts of the impacts (see Figure 1.2). This core model consists of IMAGE/TIMER energy and IMAGE/ Land&Climate. The latter also includes the LPJmL model, which is an essential component of any IMAGE model run, representing carbon, water, crop and vegetation dynamics.
The IMAGE 3.0 framework contains other models that are employed to generate impacts (such as, GLOBIO, GLOFRIS and GISMO), and models that describe parts of the Human system, such as agro-economic models (MAGNET and IMPACT) to project future agricultural production requirements. Furthermore, policy models, such as FAIR, are used in exploring effectiveness, efficiency and equity of climate policy regimes, and to provide input on emission constraints and price signals arising from climate policy proposals (see Figure 1.2).
1.3 A brief history of IMAGE
IMAGE 3.0 is the most recent, operational version of the model framework progressively developed since in 1980s. Over the years the model was enhanced and extended continuously through incremental changes, and more profound revisions.
23
1 Introduction | 23
1 Introduction |
1
the first Integrated Assessment Models to address climate change, IMAGE contributed to raising awareness of the long-term consequences of human development. In the absence of regional or spatially explicit algorithms, the model operated on trends in global total and average parameters, such as world population and averaged emission factors per unit of activity.
IMAGE 2.0 to 2.2
In the 1990s, the new generation IMAGE 2 was developed with regional drivers of global change and gridded, process-oriented modelling of the terrestrial biosphere, land cover and land use (Alcamo, 1994). IMAGE 2.0 comprised three subsystems:
– 13-region Energy-Industry System (EIS);
– Terrestrial Environment System (TES) operating at regional and at 0.5x0.5 degrees grid-scale;
– Atmosphere-Ocean System (AOS) to compute the resulting changes in the composition of the atmosphere leading to climate change.
Further refinements and extensions were implemented in IMAGE 2.1 (Alcamo et al., 1998) to enhance model performance and broaden its applicability to issues other than climate change.
The enhanced capabilities of IMAGE 2.2 were demonstrated in the contribution to the IPCC Special Report on Emissions Scenarios (IMAGE-team, 2001). The earlier zonal-mean climate-ocean model was replaced by a combination of the MAGICC climate model and the Bern ocean model. The resulting global average temperature and precipitation changes were scaled using temperature and precipitation patterns generated by complex Global Circulation Models (GCMs) to provide spatially explicit climate impacts and feedback. For economy and energy, the EIS of version 2.0 was replaced with the TIMER energy model, which also improved linkage with the macro-economic model Worldscan.
IMAGE 2.4
A range of developments were implemented stepwise in intermediate versions, leading to the release of IMAGE 2.4 (MNP, 2006). In close cooperation with the agro-economic research institute LEI, links were established with agro-agro-economic modelling in IMAGE 2.4. This ensured the inclusion of biophysical conditions in modelling future agricultural production based on intensification of production and expansion of agricultural area.
Furthermore, to align closer with policy discussions, the number of regions was increased to 24 to reveal the position of major global players. Other extensions included a link with the global biodiversity model GLOBIO to study impacts of global change drivers on natural and cultivated land.
Many of the components were enhanced, including the energy model TIMER, emission modelling and the carbon cycle. Experimental links with an intermediate complexity climate model were discontinued and the simple climate model MAGICC with a strong feature to represent uncertainties in the climate system was adopted as the default. IMAGE 2.4 has played a key role in supporting various international environmental assessment studies.
Towards IMAGE 3.0
After publication of the IMAGE 2.4 book and a subsequent progress review by the IMAGE Advisory Board, the framework has been further developed. These developments were published in journal articles and conference papers, but no new versions were officially released. For example, representation of energy demand was improved by more bottom-up modelling of household energy systems in TIMER for rural and urban population by income level. Selected industries were better represented in more technical detail to underpin energy demands and emissions. The forestry sector included forestry management options in addition to clear-cutting.
In cooperation with Wageningen University (WUR) and the Potsdam Institute for Climate Impact Research (PIK, Germany), the IMAGE natural vegetation and crop components were replaced with the LPJmL Global Dynamic Vegetation Model. This enabled modelling of linked carbon and water cycles, and adding a global hydrology module to IMAGE, which was not available in previous versions. Modelling biodiversity impacts was extended to cover freshwater systems as well as terrestrial biomes.
IMAGE 3.0
The following new developments have been incorporated in IMAGE 3.0:
– Energy demand modules to address household energy demand and energy carrier preferences for urban and rural populations, and per income level in developing and emerging economies. Energy demand also includes selected energy-intensive industries using technological production alternatives with their costs and efficiencies in delivering energy services.
– Forestry management module covering different production systems per region. Management systems include clear-cutting, selective cutting (conventional and reduced impact logging) and dedicated forest plantations. Wood products are also retrieved from areas deforested for agriculture and other purposes.
– Plant growth and carbon modelling by LPJmL, coupled to IMAGE. LPJmL simulates plant growth as a function of soil properties, water availability, climatic conditions and plant and crop growth parameters. Carbon stocks and fluxes, biomass yields and water surplus are integrated and internally consistent.
25
1 Introduction | 25
1 Introduction |
1
– Nutrient (N, P) soil budgets for natural and anthropogenic land use to assess nutrient cycles in agricultural and natural ecosystems, fertiliser use, and efficiency and integration of manure in crop production systems. In addition to these non-point sources of nutrients, non-point sources of urban wastewater are modelled. The fate of the nutrients in the river systems determines the load in coastal waters at a river mouth, creating risks of hypoxia and algal blooms.
– Landscape composition on a 5x5 minutes resolution, instead of the 0.5x0.5 degrees grid used in all IMAGE 2.x versions. Depending on the components, 5 minute information is processed either directly or translated into fractional land use at the 0.5 degree scale.
– MAGICC 6.0, which updates the climate model and associated data, is a simple climate model that estimates global average temperatures as the result of net greenhouse gas emissions, carbon uptake, and atmospheric concentrations of climate forcing agents. The global average temperature is used to scale grid-based climate indicators emerging from complex climate model studies.
– Additional impact components, providing information on aquatic biodiversity, flood risks, soil degradation, ecosystem services, and human health.
– Optimal greenhouse gas emission reduction pathways for overall climate policy goals are explored under assumptions for participation timing, rules and emission targets under global strategies. A cost-benefit analysis tool has been added to test the net economic outcome of mitigation efforts, adaptation costs and residual climate change impacts at different levels of forcing, subject to cost and damage assumptions found in the literature.
1.4 Organisational set-up and scientific quality
Network strategy
The IMAGE team at PBL (and predecessors RIVM and MNP) works in close collaboration with institutes and universities in the Netherlands and other countries to develop and apply the IMAGE framework. PBL coordinates and integrates IMAGE development, and works in a network to ensure scientific excellence, and to extend expertise for IMAGE beyond the resources available at PBL.
As a result of the network strategy, several expert models have been incorporated to improve and extend the IMAGE framework. For instance, the MAGNET model has been included as the agro-economic model, GLOBIO as the biodiversity model, LPJmL as the crop, carbon, and hydrology model, and CLUMondo as the land-use dynamics model.
IMAGE Advisory board
To ensure scientific quality, the IMAGE framework is subject to external review. The IMAGE Advisory Board reviews each new release of the IMAGE model on scientific rigor and quality of the methods and data, and advises on strategic directions for further model development.
1.5 Uncertainties
Uncertainties and limitations with regard to IMAGE are described in Chapter 2 and for each IMAGE component separately in Chapters 3 to 8. Generic aspects of uncertainty in IMAGE are outlined below.
Structural key data uncertainty is due to incomplete knowledge of historical time
series of model data, for example on energy demand and supply, emissions, and land use and land-use change. Other key input data, such as soil maps and temperature and precipitation maps, are uncertain, but data sets are continuously improved. This uncertainty is not addressed explicitly but the best data available are used and harmonised with other modelling teams and partners.
There is structural and methodological uncertainty (incomplete knowledge of relationships) in many parts of the IMAGE framework, for instance the impact of climate change on crop yields, and local climate change. This uncertainty can be addressed to some extent by alternative model formulations, such as for crop growth/natural vegetation, carbon cycle, land-use allocation, climate change (via climate sensitivity and temperature/precipitation patterns). Structural uncertainty can be also be addressed in model inter-comparison studies and other multi-model studies to compare IMAGE results with the range of outcomes from other models and with results for ranges found in literature, and to provide information on model functioning. The overall model uncertainty arising from uncertain processes and data can be assessed in systematic sensitivity analyses. This has been done, for example, on the CO2 fertilisation factor in crop and natural vegetation growth (Brinkman et al., 2005) and for many parameters of the energy model TIMER (Van Vuuren, 2007).
Uncertainty in future scenario drivers, such as population, economic growth, and
technology, is mostly addressed by exploring variants in assumed reference pathways, such as high/low variants of population projections, or by assuming contrasting future scenarios. Similarly, uncertainty in policy targets and societal trends is addressed by exploring alternative scenarios, varying one or more key input parameters, such as learning-by-doing parameters, composition of human diets, and other lifestyle choices. A distinct source of uncertainty arises from the level of aggregation, with socio-economic processes represented by 26 regions, and the terrestrial biosphere modelled at 5 or 30 minute grid cells. At region and grid cell, all behaviour is average behaviour, not taking into account heterogeneity within a region (e.g., in income distribution, economy, farming systems), and at grid cell (e.g., climate, soils, and landscape composition). Major differences between countries in a world region are masked and
27
1 Introduction | 27
1 Introduction |
1
1.6 Applications
IMAGE has been used for a variety of purposes and studies as shown in the following examples.
Input to global integrated assessments of environmental issues
– Millennium Ecosystem Assessment (MA): Assessment of four global scenarios on the development of ecosystem services up to 2050. The IMAGE framework was used to focus on the role of ecosystem services to support human development (MA, 2005).
– OECD Environmental Outlook to 2030 (OECD, 2008) and the OECD Environmental
Outlook to 2050 (OECD, 2012): IMAGE was used to develop the environmental
baseline according to the economic projections of the OECD economic model ENV Linkages, and to analyse selected policy intervention cases.
– UNEP Global Environment Outlooks 3 and 4 (GEO-3 and -4): These outlooks focused on environment for human well-being as the central theme linking environment and development. IMAGE contributed to the energy outlook, and calculated the land-use change and climate consequences of the four updated GEO scenarios (UNEP, 2002; UNEP/RIVM, 2004).
– Roads from Rio+20: Alternative scenarios were explored with IMAGE to reach international development and environment targets, such as halting biodiversity loss and limiting climate change (PBL, 2012). In reaching these targets, alternative pathways were assumed for globally coordinated or regionally differentiated strategies, by either relying primarily on technology solutions or combining these with changes in dominant consumer preferences and behaviour (diets, transport mode).
Global sector and topical assessments of biodiversity, climate, and energy and bioenergy
– Global Energy Assessment (GEA): Exploration of different normative energy futures. IMAGE was used to supplement the work presented by the MESSAGE model from IIASA (GEA, 2012).
– Protein Puzzle: This PBL study assessed environmental issues related to
consumption and production of animal products and other protein-rich foodstuffs for the EU-27 and on a global scale. IMAGE was used to analyse options to reduce environmental impacts from animal products via changes of diets and in the supply chain (PBL, 2011).
– Representative concentration pathways (RCPs): IMAGE was used to develop RCP2.6 and in coordinated work related to the overall development of the RCPs (Van Vuuren et al., 2012).
– Shared socio-economic pathways (SSPs): Building on the RCP work, integrated assessment models including IMAGE are being used in developing Shared Socio-Economic Reference Pathways (SSPs) together with the RCPs as the backbone of
a new generation of scenarios for climate change research (Moss et al., 2010; Van Vuuren et al., 2014).
– IPCC Assessment Reports (AR4 and AR5): IMAGE/TIMER/FAIR were used to explore comprehensive global mitigation scenarios (Van Vuuren et al., 2007a), and IMAGE experts are contributing to the Working Group I, II, and III reports.
– Global Nutrients from Watersheds (NEWS): preparation of IMAGE data on global nutrient surface balances for the UNESCO-Intergovernmental Oceanographic Committee NEWS project (Seitzinger et al., 2005; Seitzinger et al., 2010). – Rethinking Global Biodiversity Strategies: Building on earlier biodiversity
assessments (Alkemade et al., 2006), the IMAGE framework was used in assessing options to reduce pressure on biodiversity from human activities in addition to the more commonly applied conservation measures (PBL, 2010).
Strategic EU policy support
– Greenhouse Gas Reduction Policy (GRP): IMAGE including TIMER and FAIR was used to explore climate change abatement targets and regimes in support of EU policy making (European Commission, 2005);
– Support of international climate policy (DG Climate): The FAIR model supported by other components of IMAGE is used to analyse international climate policy in a series of projects for DG Climate.
– DG Environment studies: To support strategic orientation, IMAGE was used in identifying new and emerging aspects of under-exposed problems in other world regions as a result of activities and proposed policies in the EU-27 (Kram et al., 2012). IMAGE was also used in assessing prospects for resource efficiency enhancements in the five key areas of energy, land use, phosphorus, fresh water, and fish stocks (Van den Berg et al., 2011).
– EuRuralis: Assessment of alternatives to the current EU Common Agricultural Policies (CAP) to support discussions on reforms by and between Member States. IMAGE was used to assess future prospects for agriculture and the rural areas in the EU-25 (Eickhout et al., 2007)
Model comparison projects
– Energy Modelling Forum (EMF): IMAGE has contributed to several studies, such as EMF-22 on global and regional mitigation strategies for greenhouse gas emissions, and the Asian Modelling Exercise (AME) focusing on climate emissions and mitigation in the Asian region, comprising global and regional/national model analyses.
– AgMIP, ISI-MIP: IMAGE was used in two model inter-comparison projects to assess climate change impacts projected by a range of models for IPCC 5th Assessment Report. Under the auspices of AgMIP and ISI-MIP, the effect of climate change on
29
1 Introduction | 29
1 Introduction |
1
agro-economic models included the IMAGE agro-economic model, MAGNET (Nelson et al., 2014; Von Lampe et al., 2014).
Research
– EU Seventh Framework Programme (FP7): IMAGE has been used and further developed in several FP7 projects, including PEGASOS, COMBINE, RESPONSES, ADVANCE, FOODSECURE, AMPERE, LIMITS, PERSEUS, LUC4C and PATHWAYS. – Dutch National Science Foundation (NWO): several PhD and Post Doc studies have
been funded including EC-IMAGE (exploring linking IMAGE and the complex climate model EC-Earth, in cooperation with Utrecht University and the Dutch Meteoro-logical institute KNMI); Global Land-Use Systems (developing a new land use dynamics model for IMAGE, with VU University Amsterdam); and Planetary
Boundaries for Fresh Water (using IMAGE to explore the boundaries for sustainable
water use in cooperation with Wageningen University).
– Knowledge Infrastructure Sustainable Biomass (KISB): A joint research project of the IMAGE team, LEI and Utrecht University to explore future biomass supply, funding three PhD students.
– Climate Changes Spatial Planning: Dutch research project co-financed two PhD studies at Wageningen UR/Alterra on agricultural intensity (Neumann, 2010) and on upscaling crop growth modelling (Bussel, 2011). In addition, another PBL/Alterra co-funded PhD study contributed to hydrological modelling for IMAGE (Biemans, 2012).
– PBL uncertainty analysis: Several uncertainty analyses were carried out using the IMAGE energy model TIMER, including a systematic Monte Carlo type analysis (Van Vuuren, 2007), and experiments to identify the uncertainty related to model calibration (Van Ruijven et al., 2010b).
– PBL research: IMAGE was used to investigate areas of specific interest to policy makers and the wider public, such as contribution of dietary changes to climate policy (Stehfest et al., 2009), the future of aquaculture and environmental consequences (Bouwman et al., 2011; Bouwman et al., 2013b) and the potential for bioenergy and carbon capture storage (CCS), and geo-engineering as part of mitigation strategies (Van Vuuren and Stehfest, 2013).
31 2 Overview of IMAGE 3.0 |
o
ver
vI
ew
o
ver
vI
ew
2 overview of
IMAGe 3.0
Detlef van Vuuren and Elke Stehfest
2.1 Introduction 33 2.2 Model description 33 2.3 Policy issues 48
33
2 Overview of IMAGE 3.0 | 33
2 Overview of IMAGE 3.0 |
2
Key policy issues
– How could global environmental issues such as climate change, biodiversity loss and air pollution evolve?
– What are the consequences of these changes for international targets for biodiversity protection (addressed by the CBD), climate change (UNFCCC) and human development (addressed by the Millennium Development Goals and Sustainable Development Goals)?
– How could response strategies limit environmental pressures and foster more sustainable development?
– What are the linkages between environmental change and human development? What are key uncertainties?
2.1 Introduction
Integrated assessment models, such as the IMAGE framework, are established as powerful tools in assessing complex, large-scale environmental and sustainable development issues. As many of these issues are closely interlinked, integrated models are needed to analyse the consequences of these linkages, and the substantial inertia in the human-environment system can only be captured in long-term scenarios. Here, an overview of the IMAGE framework and its use in assessing long-term environmental and human future is presented.
2.2 Model description
The IMAGE framework is structured according to the causal chain of key global sustainability issues (see Figure 1.2). IMAGE comprises two main systems. The Human
or socio-economic system describes the long-term development of human activities relevant for sustainable development. The Earth system describes changes in the natural environment. The two systems are linked by the impacts of human activities on the Earth system, and by the impacts of environmental change in the Earth system on the Human system.
1. Key features of IMAGE
Spatial scale
The Human system and the Earth system in IMAGE 3.0 are specified according to their key dynamics. The geographical resolution for socio-economic processes is 26 regions defined based on their relevance for global environmental and/or development issues, and the relatively high degree of coherence within these regions (Figure 2.1). In the Earth system, land use and land-use changes are presented on a grid of 5x5 minutes, while the processes for plant growth, carbon and water cycles are modelled on a 30x30 minutes resolution.
Temporal scale Figure 2.1
The 26 world regions in IMAGE 3.0
Canada USA Mexico Central America Brazil Rest of South America South Africa Rest of Southern Africa Northern Africa Western Africa Eastern Africa Western Europe Central Europe Turkey Ukraine region Central Asia Russia region Middle East India
Rest of South Asia Indonesia region Southeast Asia Japan Korea region China region Oceania Antarctica Greenland Source: PBL 2014 pbl.nl
35
2 Overview of IMAGE 3.0 | 35
2 Overview of IMAGE 3.0 |
2
or 2100 depending on the issues under consideration. For instance, a longer time horizon is often used for climate change studies (see Section 1.6). IMAGE also runs over the his-torical period 1971-2005 in order to test model dynamics against key hishis-torical trends.
2. Modular structure
IMAGE has been set-up as an integrated assessment framework in a modular structure, with some components linked directly to the model code of IMAGE, and others connected through soft links (the models run independently with data exchange via data files). This architecture provides more flexibility to develop components separately and to perform sensitivity analyses, recognising that feedback may not always be strong enough to warrant full integration. For example, the various components of the Earth system are fully linked on a daily or annual basis. However, components of the Human system, such as the TIMER energy model and the agro-economic model MAGNET, are linked via a soft link, and can also be run independently.
The IMAGE core model comprises most parts of the Human system and the Earth system, including the energy system, land-use, and the plant growth, carbon and water cycle model LPJmL. The IMAGE framework includes soft-linked models, such as the agro-economic model MAGNET, and PBL policy and impact models, such as FAIR (climate policy), GLOBIO (biodiversity), GLOFRIS (flood risks) and GISMO (human development).
Below, the various components of the IMAGE system are described briefly, and in further detail in the subsequent chapters. Results from the Rio+20 study (PBL, 2012, see Box 2.1) and some other studies are used in this chapter to illustrate the main model output.
Box 2.1: The Rio+20 study
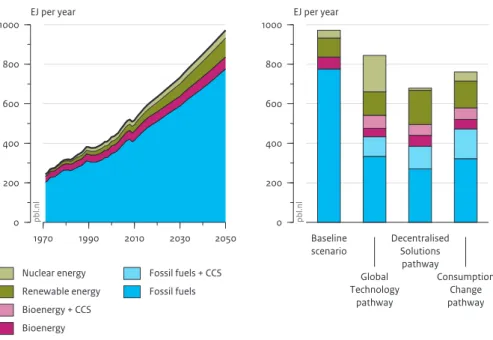
Using the IMAGE model, the PBL study Rio+20 (PBL, 2012) assessed pathways to achieve ambitious global sustainability targets in 2050, including limiting climate change to 2 °C, stabilising biodiversity loss and providing full access to energy, water and food. The baseline scenario assessed possible development without major changes in current policies. Three alternative scenarios assessed possible routes to achieving the sustainability targets. The first scenario (Global Technology) was directed to achieving the target mainly through large-scale introduction of advanced technologies. The second scenario (Decentralised Solutions) assessed achieving the long-term targets by introducing small-scale technologies and emphasising local-small-scale solutions. The third scenario (Consumption Change) focused on the role of lifestyle changes in achieving the targets. In this chapter, the Rio+20 study is used to illustrate potential assessments with IMAGE.
3. Drivers (population, economy, policies, technology)
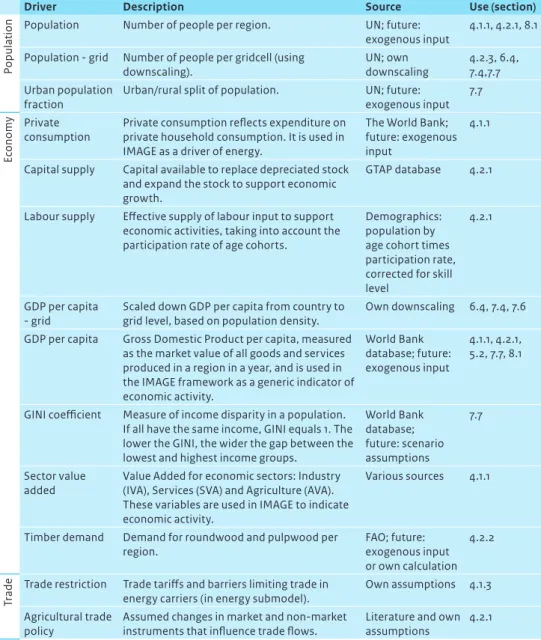
Key model inputs are descriptions of the future development of so-called direct and indirect drivers of global environmental change. These include population, economic development, lifestyle, policies and technology change (Chapter 3). Most drivers such as technology change are input in various IMAGE components (see Table 3.1). To ensure that exogenous assumptions about these factors are consistent, brief scenario story-lines are formulated on how the future may unfold and are used to derive internally consistent assumptions for main driving forces. For example, yield assumptions in the agricultural economy model and performance of solar power production in the energy model depend on a more generic description of the rate of technology change. Population and economic development can be provided as quantitative outputs from external sources or models, and dealt with quantitatively as exogenous model drivers. Other drivers mostly concern assumptions in other parts of IMAGE.
For population, IMAGE uses exogenous assumptions, such as total population per region, household size and urbanisation rate. However, GISMO population projections can also be used, which enable feedback of environmental factors, such as air pollution and undernourishment on population growth to be taken into account (Section 7.7). Exogenous assumptions are used for economic variables, such as GDP. In most studies, economic projections are developed by macro-economic models based on the scenario storylines. Sector-specific economic indicators and household consumption can be derived directly from such models, and complemented by income categories, reflecting the GINI coefficient, a measure of disparity in income distribution.
Example: In the Rio+20 study (PBL, 2012), global population is based on the UN medium projection and grows to about 9 billion people in 2050, the increase occurring mostly in developing countries (Figure 2.2). The economic projection of the Rio+20 study shows that developing countries increasingly dominate the world economy in terms of total GDP (Figure 2.2). For the OECD countries, the baseline scenario assumes a long-term economic growth rate of 1 to 2% per year over the whole scenario period. In the short term, per capita growth rates in Asia and Latin America are much higher, but converge gradually to a long-term growth rate of around 2% per year. In contrast, Africa shows a later peak in economic growth.
4. The Human system: Energy supply and demand and
agricultural systems
37
2 Overview of IMAGE 3.0 | 37
2 Overview of IMAGE 3.0 |
2
Energy demand and supply
The IMAGE framework uses the detailed energy system model “The IMage Energy Regional model” (TIMER) to describe the long-term dynamics of the energy system (Sections 4.1.1 to 4.1.3). The model includes a description of demand for energy services and end-use energy carriers, and also describes the future role of fossil fuels versus alternative supply options, such as renewables and nuclear power to meet the demands. The model determines demand for energy services with population and income as primary drivers and assumptions on lifestyle. Demand is met by final energy carriers, which are produced from primary energy sources. The mix of final energy carriers and the technologies to produce them are chosen on the basis of their relative costs. Key processes that determine these costs include technology development and resource depletion, and also preferences, fuel trade assumptions and policies.
The model output demonstrates how energy intensity, fuel costs and competing non-fossil supply technologies develop over time. Emission mitigation is generally modelled on the basis of price signals. A carbon tax (used as a generic measure of climate policy) induces additional investment in energy efficiency, and in fossil-fuel substitution,
Figure 2.2 1970 1990 2010 2030 2050 0 2 4 6 8 10 12 billion people Source: PBL 2012 pb l.n l Sub-Saharan Africa Southeast Asia South Asia China region
Middle East and northern Africa Russian region and central Asia
Japan, Korea and Oceania Western and central Europe Central and South America North America
Population per region
Global demographics and economic growth under the baseline scenario
1970 1990 2010 2030 2050 0 50 100 150 200 250 300 trillion USD (2005) pb l.n l GDP per region
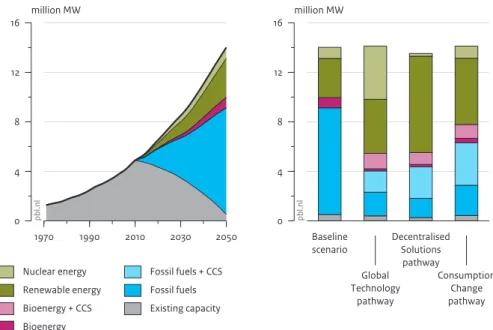
bioenergy, nuclear power, solar power, wind power and carbon capture and storage. The energy model is linked to other parts of IMAGE via calculated emissions and demand for bioenergy production (generating input into the land use model). Example: The model can be used to make detailed projections of the energy system, with and without climate policy. In the Rio+20 study, the baseline scenario without climate policy projects a 65% increase in energy consumption in the 2010-2050 period, driven by continued population and economic growth. With no fundamental change in current policies, fossil fuels are expected to retain a large market share as their market price is expected to remain below the price of alternative fuels for most applications. In climate policy scenarios, the inclusion of a carbon price leads to an increased share of alternative technologies and resources, such as carbon capture and storage, nuclear power and renewables (Figure 2.3).
Figure 2.3 1970 1990 2010 2030 2050 0 200 400 600 800 1000 EJ per year Source: PBL 2012 pb l.n l Nuclear energy Renewable energy Bioenergy + CCS Bioenergy Fossil fuels + CCS Fossil fuels Baseline scenario
Global primary energy supply under the baseline and sustainability scenarios
Baseline scenario Global Technology pathway Decentralised Solutions pathway Consumption Change pathway 0 200 400 600 800 1000 EJ per year pb l.n l Per pathway, 2050
39
2 Overview of IMAGE 3.0 | 39
2 Overview of IMAGE 3.0 |
2
Food consumption and agriculture
Demand for and production of agricultural products are modelled by the soft -linked agro-economic models MAGNET or alternatively IMPACT (Section 4.2.1). The IMAGE crop (Section 6.2) and land-use (Section 4.2.3) models supply information to MAGNET on land supply by region and changes in potential yields. MAGNET provides information on future agricultural production levels and intensity by region, matching regional demands through trade. MAGNET assesses production of agricultural products based on combinations of primary (land, labour, capital and natural resources) and intermediate production factors. For the livestock sector, IMAGE makes scenario-specifi c assump-tions about livestock production in diff erent systems (Section 4.2.4). A key purpose of the agro-economy model is to determine regional production levels and the associated yields and livestock effi ciencies, taking into account changes in technology and bio-physical conditions. An increase in demand for agricultural production can be met by land expansion (using the regional land supply curves) and/or intensifi cation of land use and increasing yields. IMAGE 3.0 also calculates timber demand and forest management (Section 4.2.2). Figure 2.4 1970 1990 2010 2030 2050 0 10 20 30 40 50 million km2 pb l.n l History Baseline scenario Pastures Crops
Range from the literature Pastures Crops Land use 1970 1990 2010 2030 2050 0 100 200 300 400 500 Index (1970 = 100) Source: PBL 2012 pb l.n l History Baseline scenario Crop production Animal production
Range from the literature Animal production Crop production
Food production
Figure 2.5
Distribution of land systems
2005
2045
Cropland systems
Extensive with few livestock Extensive with bovines, goats and sheep Extensive with pigs and poultry Medium intensive with few livestock Medium intensive with bovines, goats and sheep Medium intensive with pigs and poultry Intensive with few livestock Intensive with bovines, goats and sheep Intensive with pigs and poultry
Forest systems Dense
Open with few livestock Open with pigs and poultry Grassland systems
Natural With few livestock With bovines, goats and sheep Mosaic (semi-)natural systems Mosaic cropland and forest systems
With pigs and poultry Extensive; with few livestock Medium intensive; with few livestock Mosaic cropland and grassland systems
With bovines, goats and sheep With pigs and poultry Extensive; with few livestock Medium intensive; with few livestock Intensive; with few livestock
pbl.nl
41
2 Overview of IMAGE 3.0 | 41
2 Overview of IMAGE 3.0 |
2
Example: Almost all IMAGE baseline scenarios, including the Rio+20 baseline, project an increase in agricultural production driven by population growth and changes in dietary patterns associated with increasing per capita income (Figure 2.4). Consistent with historical trends, most of the increase is met by higher production per hectare (intensification). In the Rio+20 baseline, slow expansion of the agricultural area in developing countries can be observed, mainly for crops and to a lesser extent for pasture (Figure 2.4). Alternative scenarios explore ways to mitigate agricultural expansion, including the influence of enhanced yield increase, dietary changes, and reduction in post-harvest losses.
5. Interaction between the Human system and the Earth
system: land cover/land use and emissions
The Human system influences the Earth system in various ways, such as land use and atmospheric emissions, but also water extraction, and water and soil pollution. The representation of key factors of land use and atmospheric emissions in the IMAGE model are discussed below.
Land cover and land use
Using demand for agricultural products, including food, feed and bioenergy, the Land-use allocation model locates production areas on a 5x5 minute grid (Section 4.2.3). A region-specific regression based suitability assessment and an iterative allocation procedure are used. Alternatively, the land-use model can also integrate CLUMondo (using a more complex allocation procedure). In most regions, the main determinants of suitability for agricultural expansion are population density, accessibility, topography, and agricultural productivity. In the model, suitability is used in combination with regional preferences for different types of production systems (determined from historical calibration) to allocate land use to the grid. In addition, the IMAGE land use and land cover module (Section 5.1) collects and combines information from the agricultural system and the Earth system to provide maps of land-use and land-cover parameters, including fertiliser input, livestock densities, rain-fed and irrigated crop fractions, bioenergy crops, and forest management.
Example: In most baseline scenarios, increased agricultural production in tropical regions leads to loss of natural ecosystems and associated biodiversity loss. Most expansion is projected to occur in highly productive ecosystems close to agricultural areas, including tropical forests and woodland, and other high nature value savannah and grassland areas. The agricultural area is contracting in temperate zones and the grid cells least suitable for production potential are abandoned. The resulting changes in land use are depicted in Figure 2.5 (see also Section 4.2.3).