CHINESE OUTWARD FOREIGN DIRECT
INVESTMENTS IN EUROPE: A SHIFT TOWARDS THE
EUROPEAN PERIPHERY?
AN ANALYSIS OF CHINESE INVESTMENT TRENDS IN EUROPE FROM 2000 TO 2020.
Aantal woorden: 17850Jonas Tombeur
Stamnummer: 01508972Promotor: Prof. dr. Rudy Aernoudt
Commissaris: Prof. dr. Jos Meir
Masterproef voorgedragen tot het bekomen van de graad van:
Master of Science in de Handelswetenschappen
Afstudeerrichting: Finance and Risk Management
VERTROUWELIJKHEIDSCLAUSULE
Een A-4 met één van volgende clausules dient opgenomen te worden in de masterproef.
PERMISSION
Ondergetekende verklaart dat de inhoud van deze masterproef mag geraadpleegd en/of gereproduceerd
worden, mits bronvermelding.
Naam student:………
NO PERMISSION
Ondergetekende verklaart dat de inhoud van deze masterproef niet mag geraadpleegd en/of gereproduceerd
worden.
Naam student:………
Jonas TombeurNederlandstalige samenvatting
In deze scriptie trachtte ik door middel van een secundaire data-analyse een antwoord te vinden op de vraag: ‘Is de bestemming van Chinese outward foreign direct investments (OFDI) verschoven richting de periferie van de Europese Unie?’. West-Europa is lang de dominante eindbestemming voor Chinese OFDI geweest, maar de laatste jaren is China meer aandacht beginnen besteden aan andere EU-regio’s met het oog op het bouwen van economische en politieke relaties. In het kader van The Belt and Road Initiative (BRI) zijn de Centraal- en Oost-Europese (CEE) landen integraal om China en Europa met elkaar te verbinden. Deze toename veroorzaakt echter onrust in Europa. Europese toeschouwers vrezen namelijk dat China de OFDI zal gebruiken om diepe economische banden te bouwen met de regio, en die banden vervolgens zal gebruiken om politieke invloed op lidstaten uit te oefenen, hetgeen de eenheid van de Europese Unie kan bedreigen.
Dit gebeurt in zekere mate zelfs al. China richtte het 17+1 initiatief op dat 17 EU-lidstaten samenbracht met het oog op het bevorderen van bedrijfs- en investeringsrelaties in het kader van de BRI. Hongarije is een prominent voorbeeld van een land dat beïnvloed wordt binnen het initiatief. Het land heeft al meermaals de Europese rangen gebroken en reacties van de EU tegen China geblokkeerd of bekritiseerd. Dit met als doel de bilaterale relatie met China te verbeteren en meer investeringen aan te trekken. Er worden aan de CEE-landen dan ook veel beloftes gemaakt over toenames van binnenstromende Chinese investeringen, veel van deze beloftes blijken echter leeg te zijn. Een groot deel van de aangekondigde projecten in de regio voldoen niet aan de verwachtingen en een aantal worden zelfs volledig afgeschaft. Daarnaast toont de data dat Chinese OFDI in de regio uitermate laag blijft en dat de regio ver onder haar economische gewichtsklasse bokst; vergeleken met de rest van de EU ontvangt de CEE-regio de allerlaagste hoeveelheid investeringen. Verder blijkt er ook geen indicatie van een verschuiving in de bestemming van Chinese OFDI te zijn, er is echter wel een neerwaartse trend in heel de EU (en de wereld) merkbaar. West-Europa blijft wel de aantrekkelijkste locatie dankzij de geavanceerde productie en technologische bedrijven die zich in de regio bevinden, waarbij het Verenigd Koninkrijk, Duitsland en Frankrijk het grootste aandeel verkrijgen.
Ondanks dat er geen verschuiving plaatsvindt heeft de EU toch besloten haar houding tegenover China aan te passen: Chinese investeerders krijgen niet langer de vrijheid die ze vroeger genoten. In 2019 kondigde de Europese Commissie een FDI-screening framework aan, met als doel beoordelen of investeringen een risico vormen voor de nationale veiligheid en publieke orde. Het framework is op vrijwillige basis toepasbaar door de lidstaten en niet specifiek op China gericht, desalniettemin heeft het potentieel om Chinese investeringsactiviteit in de EU aanzienlijk te beïnvloeden. Naast het framework is er ook een EU-China Comprehensive Agreement on Investments (CAI) in de werken. De CAI heeft als doel een level playing field tussen de twee partijen te creëren en een eerlijke behandeling van Europese bedrijven in China te verzekeren. Onderhandelingen over het akkoord zijn al zéér lang aan de hand, beide partijen willen het dan ook in de nabije toekomst afwerken.
Wat de toekomst inhoudt voor Chinese OFDI in de EU is onzeker. De Covid-19 Pandemie heeft de hele wereldeconome tijdelijk stilgelegd en zowel de EU als China ernstig aangetast. Het is afwachten geblazen welke maatregelen overheden zullen nemen en hoe Chinese investeerders zullen reageren op de nieuwe EU-regulering.
Preamble
This paper is the culmination of five years of academic formation and cultivation. I was spurred onto this topic after encountering someone abroad who was born in Hong Kong and had lived there for most of her life. My conversation with her piqued my interest in China and its complex economic and political system. I was able to combine the knowledge gained from my education with this interest and this dissertation is the end result.
I would like to thank my family, friends and GRN for the support they’ve given me throughout my academic career. Without them I wouldn’t have gotten where I am today. Special thanks to Bram, Afif and Victor for proofreading and helping me express my ideas in a coherent manner, as well as constructing a finer end result.
Covid-19 pandemic’s impact
The original intent of utilising a secondary data analysis remained unchanged. The Covid-19 pandemic did not have any effect on the way my research was conducted, as I did not need to carry out fieldwork, or search for literature outside of the online databases. As such, I was able to fully complete the paper as I had envisioned at the start of this academic year.
This preamble is drawn up in consultation between the student and the supervisor and is approved by both.
Abstract
In this dissertation I conducted research to find an answer to the question: ‘Has there been a shift in the destination of Chinese outward foreign direct investments (OFDI) towards the European periphery?’. Western Europe has long been the dominant attractor of this kind of investment, but throughout the years China has been courting other European regions in order to establish deeper economic and political ties. In the context of China’s Belt and Road Initiative, a lot of attention is being given to the Central and Eastern European (CEE) countries, who find themselves as the gateway into Europe in the initiative. This increase in attention has sparked anxiety in Europe. Observers fear that China plans to use OFDI to form stronger economic connections with the CEE countries and subsequently use those in order to influence policy and sow political discord in the European Union.
This is already happening to a certain degree, with China forming the 17+1 initiative, which brings together 17 EU member states to promote business and investment relations in the context of the Belt and Road Initiative. A prominent example of a country influenced within this format is Hungary, who has repeatedly broken ranks and opposed or criticized the EU’s reactions to China, in an attempt to improve bilateral relations and attract more investments. However, while an increase in investments has often been promised to CEE countries by Chinese officials, data shows that these promises remain empty. Many of the announced projects in the region turn out to not live up to expectations, a number of them even being outright cancelled. Moreover, Chinese OFDI into the CEE region remains woefully small, with the region punching far below its economic weight and receiving the smallest amount of investments of all regions. Ultimately, while there does not seem to be any indication that a shift towards other EU regions is taking place, there does, however, seem to be a declining trend in the EU and the world at large. Despite the global trends, Western-Europe, thanks to its advanced manufacturing and technological enterprises, remains by far the most attractive location for Chinese investors, with the United Kingdom, Germany and France seeing the bulk of all transactions.
Although a shift does not seem to have taken place, the EU has started to change its stance towards China. It plans to no longer grant Chinese investors the ability to invest unchecked. In 2019, the implementation of an FDI screening framework was announced. The goal of this framework is to review investments that may form a threat to national security and public order. Even though it remains voluntary for member states and is not specifically aimed at Chinese investors, it has the potential to significantly affect Chinese activity in the EU. Besides the framework, an EU-China Comprehensive Agreement on Investments (CAI) is also in the works, meant to level the playing field between the two and ensure fair treatment of European firms in China. The CAI has been in the works for quite some time, but both parties are determined to complete it as fast as possible.
What the future holds for Chinese OFDI in Europe is unsure. The Covid-19 Pandemic has temporarily halted the entire world economy and has severely affected both the EU and China. It remains to be seen which measures governments will take and how Chinese investors will react to the new European regulations.
Table of contents
Introduction _________________________________________________________________________ 8 The ins and outs of FDI _______________________________________________________________ 10 Definition and entry modes _________________________________________________________ 10 Definition ______________________________________________________________________ 10 Benefits of FDI __________________________________________________________________ 11 FDI entry modes ________________________________________________________________ 12 Chinese state-owned and private FDI __________________________________________________ 13 Methodology of FDI data ___________________________________________________________ 16 Chinese datasets ________________________________________________________________ 16 European datasets _______________________________________________________________ 16 Rhodium Group dataset __________________________________________________________ 17 Economic history of China and its relationship with the EU ___________________________________ 19 Short history of China ______________________________________________________________ 19 Chinese economy under Mao Zedong _______________________________________________ 19 The Chinese economic reforms _____________________________________________________ 19 China’s going out __________________________________________________________________ 22 The ‘Going Global’ policy __________________________________________________________ 22 The Belt and Road Initiative _______________________________________________________ 24 Made in China 2025 ______________________________________________________________ 26 China and the European Union _______________________________________________________ 27 Motivations of Chinese OFDI in the EU _______________________________________________ 28 European Perceptions on Chinese OFDI ______________________________________________ 29 The 16+1 Initiative _______________________________________________________________ 32 Chinese OFDI trends in Europe _________________________________________________________ 35 Beginning of the surge (2000-2011) ___________________________________________________ 35 Historic trend ___________________________________________________________________ 35 Geographic distribution ___________________________________________________________ 37 Reaching of the peak (2011-2016) ____________________________________________________ 38 Historic trend ___________________________________________________________________ 38 Geographic distribution ___________________________________________________________ 41 The descent (2017-2020) ___________________________________________________________ 42 Historic trend ___________________________________________________________________ 42 Geographic distribution ___________________________________________________________ 44
The Belt and Road Initiative’s effect ___________________________________________________ 46 The European Response ______________________________________________________________ 49 EU FDI Screening Regulation _________________________________________________________ 49 A new legal framework ___________________________________________________________ 50 Implications for Chinese investors __________________________________________________ 51 EU-China Comprehensive Agreement on Investment _____________________________________ 52 Conclusion and Discussion ____________________________________________________________ 54 Bibliography ________________________________________________________________________ 56
List of abbreviations
BIT – Bilateral Investment Treaty BRI – Belt and Road InitiativeCAI – Comprehensive Agreement on Investment CCP – China’s Communist Party
CDB – China Development Bank
CEEC – Central and Eastern European Countries CCCC – China Communications Construction Company EXIM – China Export – Import Bank
CRBC – China Road and Bridge Corporation ETNC – European Think Tank Network on China’s EU – European Union
FDI – Foreign Direct Investments FPI – Foreign Portfolio Investment IMF – International Monetary Fund M&A – Mergers and Acquisitions MES – Market Economy
NAPA – North Adriatic Port Association
OECD – Organisation for Economic Cooperation and Development OFDI – Foreign Direct Investments
PRC – People’s Republic of China RHG – Rhodium Group
SNA – System of National Accounts SOE – State-owned Enterprises
List of tables
FIGURE 1-CHINESE FDITRANSACTIONS IN THE EU-28BY TYPE OF INVESTOR,2000-2014 ___________________ 14 FIGURE 2-VALUE OF COMPLETED CHINESE FDITRANSACTIONS IN THE EU BY OWNERSHIP ____________________ 15 FIGURE 3-CHINESE GDP UNTIL 2018 IN US$ __________________________________________________ 20
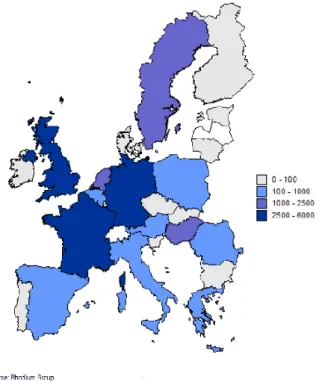
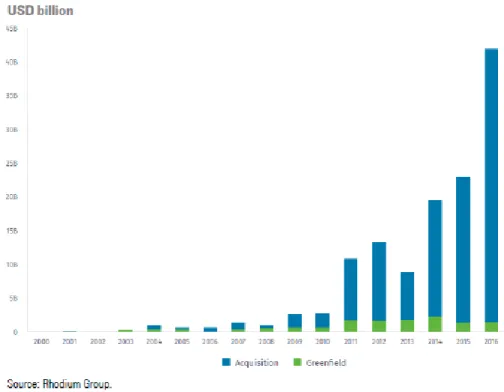
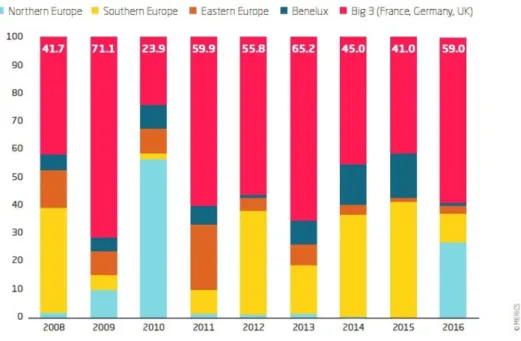
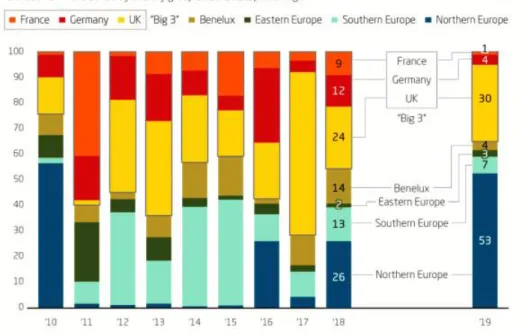
FIGURE 4-CHINESE DIRECT INVESTMENT IN THE EU-27,2000-2011 __________________________________ 36 FIGURE 5–MAP VIEW OF CHINESE DIRECT INVESTMENT IN THE EU-27,2000-2011 _______________________ 38 FIGURE 6-VALUE OF NEWLY ANNOUNCED CHINESE FDITRANSACTIONS IN THE EU _________________________ 39 FIGURE 7-CORE EUROPEAN ECONOMIES ARE IN THE FOCUS OF CHINESE INVESTORS ________________________ 41
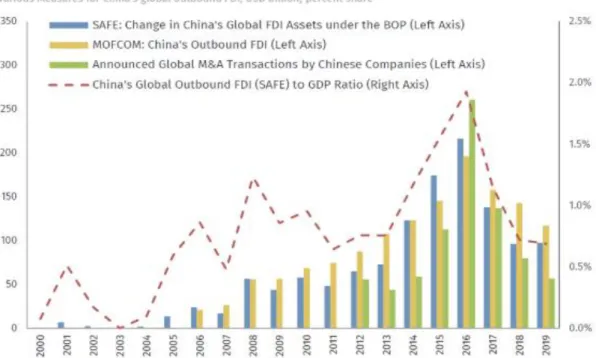
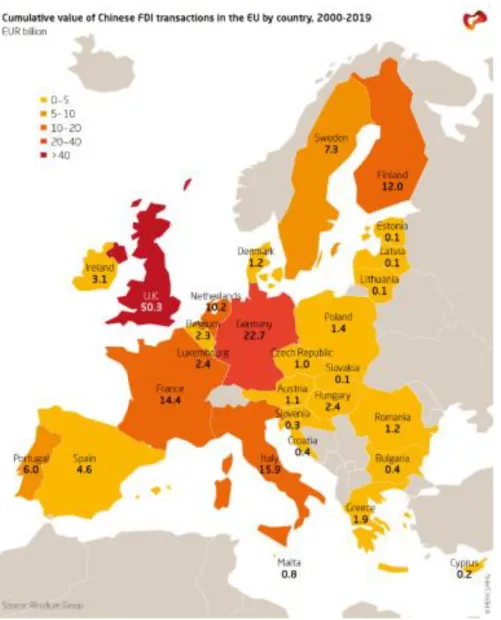
FIGURE 8-CHINA'S GLOBAL OUTBOUND INVESTMENT BOOM IS TAKING A BREAK __________________________ 43 FIGURE 9-CHINESE FDI DISTRIBUTION IN EUROPE IN 2019 _________________________________________ 44 FIGURE 10-OVERALL DISTRIBUTION OF CHINESE FDI IN EUROPE _____________________________________ 45
Introduction
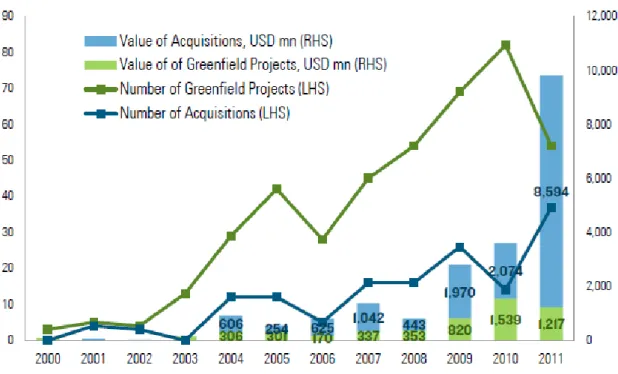
In the past decade Chinese capital export has risen considerably, China becoming a net exporter in a very short amount of time. From 2005 to 2016 total Chinese outward foreign direct investments (OFDI) went from an inconsiderable US$14 billion to an all-time high $216 billion, a fifteenfold increase in only a decade. These investments can be seen as part of China’s ‘Going Out’ Policy and its ‘Belt and Road Initiative’. The former an overarching industrial policy meant to support Chinese companies and transform them into global industry leaders. And the latter a global development strategy starting in 2013 that aims to connect China and Europe through the creation of a New Silk Road. In the context of both, the European Union (EU) has become a key element in Beijing’s economic plans and has seen a notable increase in acquisitions and greenfield projects. Notable examples being the acquisition of Pirelli by the state-owned enterprise ChemChina in 2015 (Flak & Anzolin, 2017), the acquisition of an initial stake in Daimler by Geely’s (Ferris, 2018), and the purchase of a majority stake in the port of Piraeus in Greece by state-owned COSCO in 2016 (Georgiopoulos, 2016).
This significant rise in trade and investment brings more than just economic growth. After the financial crisis of 2008, countries within the EU became more prone to applying short term solutions when it comes to acquiring capital (Meunier, 2014b, p. 301). This division is most evident between capital importers (Central and Eastern European countries) and capital exporters (Western-European countries). With China aggressively courting the capital importers because of their lax or even non-existent regulatory conditions for entry and need for more inward investment flows (Bran, 2014; Meunier, 2014b). The EU’s reaction to these investments and their impact on economic and political relations can be criticized for being uncoordinated and incoherent. The structural difficulties stemming from the European integration process and the area of tension between intergovernmental and communitarian forces within the countries themselves can be pointed to as the cause of this lacklustre reaction (Algieri, 2002, p. 70).
Parts of the European community have expressed their fear that the increasing support for the Central and Eastern European countries under the Chinese foreign direct investment campaigns could lead to lower standards for production, unfair competition, a risk of deteriorating workers’ rights (Butollo, 2015) and the EU being challenged on matters such as its export of national development models and norms (Zhao, 2016, p. 110). Some even label the incoming foreign direct investments (FDI) as a tool to divide and conquer Europe, accusing China of making use of a fractured EU to more easily propagate and achieve China’s economic and political goals. With the European Union still not fully recovered from the tensions and effects of the European debt crisis, a rupture of this kind could have far-reaching implications.
Thus, the goal of this thesis is to analyse the Chinese OFDI in order to assess whether the European fear that the destinations are shifting towards Eastern and Central Europe is warranted. This subject proves to be relevant today, with the EU finding itself in a position wherein European unity is repeatedly tested; Hungarian anti-EU campaigns and Brexit being other key examples. To find a suitable answer to the main research question this thesis aggregates existing literature and carries out a secondary data analysis.
The main question is divided in the following five sub-questions:
• What are “outward foreign direct investments” and which idiosyncrasies do Chinese OFDI have? • What are the motivations behind these Chinese investments?
• What is the current climate surrounding Chinese OFDI in the EU?
• Has there been a disruption of the historical trend and has the Belt and Road Initiative caused an increase of investments in Central and Eastern European countries (CEEC)?
• What is the EU’s response?
To clearly present this dissertation’s findings, it is structured according to the aforementioned questions. The first chapter presents an overview of FDI in which the definition and types are explored, the state-owned enterprises’ role in Chinese OFDI is discussed and the methodology of the FDI data used is clarified. The second chapter takes a look at the economic history of China and the EU to provide context for the later chapters. A succinct overview of the Belt and Road Initiative is also given. The third chapter explores Chinese OFDI trends in the EU to see whether the Belt and Road Initiative has caused a disruption and whether a significant rise in the amount of transactions completed in the CEEC exists. In addition, an analysis of which industries these investments have targeted is made to get a sense of the motivations behind them. The fourth chapter contains a summary of the EU’s response to the worries and fears that have been festering. The fifth and final chapter presents the conclusion of this paper, a discussion on the shortcomings of this thesis and further avenues of research.
The ins and outs of FDI
This dissertation begins with the definition of FDI, followed up by a presentation of the benefits of FDI and different kinds of entry modes used. In addition, the role and effect of state-owned enterprises in Chinese FDI are discussed. To conclude, the methodology of data used is discussed.
Definition and entry modes
Definition
According to the Organisation for Economic Cooperation and Development (OECD) “Direct investment is
a category of cross-border investment made by a resident in one economy (the direct investor) with the objective of establishing a lasting interest in an enterprise (the direct investment enterprise) that is resident in an economy other than that of the direct investor.” (OECD, 2008).
Expanding on this, “The motivation of the direct investor is a strategic long-term relationship with the
direct investment enterprise to ensure a significant degree of influence by the direct investor in the management of the direct investment enterprise. The “lasting interest” is evidenced when the direct investor owns at least 10% of the voting power of the direct investment enterprise. Direct investment may also allow the direct investor to gain access to the economy of the direct investment enterprise which it might otherwise be unable to do. The objectives of direct investment are different from those of portfolio investment whereby investors do not generally expect to influence the management of the enterprise. “
(OECD, 2008).
Before diving into the benefits and different kinds of FDI entry modes, the other channels of capital export have to be shortly discussed. Four other categories can be distinguished according to the System of National Accounts (SNA), which is an international standard set of principles used by the OECD, the International Monetary Fund (IMF) and other international organisations. While the EU receives capital through all these channels, FDI has emerged as one of the most important categories (Hanemann & Huotari, 2017b). The four other categories of cross border investment flows are (European Central Bank, 2012):
1. Portfolio investments: a shorter-term investment in corporate debt instruments or in liquid securities with no control, for example holdings of equity shares with less than 10% voting rights. 2. Derivatives: financial instruments which are only contractually related to the underlying value of
real assets, notable examples being swaps, futures, and options.
3. Reserves: entails liquid instruments in the form of gold, foreign exchange or special drawing rights at the IMF, and are held by governments or central banks.
4. Other investments: a leftover category which entails investments such as foreign bank deposits, cross border loans, currency holding, or trade credits that can’t be classified in the other categories.
A commonly made mistake is clumping FDI together with foreign portfolio investments (FPI), although these are quite distinct from each other. FDI are made with the purpose of having control, or a deciding voice, in the management of a company. It not only includes an initial acquisition of equity capital, but also subsequent transactions of capital between the foreign acquiror and acquired entity (Foreign direct investments - Eurostat, z.d.). An FPI is made with the primary goal aimed at receiving financial returns, for example when buying financial assets. These investments are much more volatile due to their liquidity and sensitivity to outside effects (UNCTAD, 1999). In the data used in this research, FDI are called strategic investments and FPI are called financial investments.
Benefits of FDI
Multinational enterprises from developed economies often have a number of advantages compared to domestic firms that, despite additional costs, allow them to successfully compete in foreign markets. Them gaining this advantage from their superior technological capacities, larger capital resources or better management practices (OECD, 2008). The general consensus on the effects of their FDI is that an overall positive effect on both the economy of the host country and the economy of the home country is generated by contributing to economic growth, technology spill-overs, international trade integration, development of human capital and the creation of a competitive business environment (European Commission, 2020c; OECD, 2002). In this regard, especially developing economies stand to gain from foreign investment to aid their economic development. However, these benefits do not accrue automatically. Host countries need to provide a healthy business environment for both foreign and domestic companies. Limiting factors such as low education levels, insufficient openness to trade, inadequate regulatory frameworks and lacking infrastructure will severely hamper the effectiveness of FDI (OECD, 2002).
According to Dunning (1994), the benefits for a host country are achieved by advancing the competitiveness of the country in five main ways. Each of these five ways is contributed to by a particular type of FDI. These types will be discussed in one of the following chapters regarding Chinese motives for FDI in Europe. The five main ways Dunning identified are:
1. Countries’ firms produce whatever they are currently producing much more efficiently, for example, by reducing the firm’s organizational costs and/or raising labour or capital productivity.
2. Innovations and Improvements are made in the quality of existing products, production processes and organization structures.
3. Resources and capabilities are reallocated to produce that are more in line with countries’ comparative dynamic advantage.
4. New foreign markets are captured, provided that this is cost effective for the firm.
5. The costs are reduced, or the process is sped up, of structural adjustments to changes in global demand and supply conditions.
While there exists an extensive amount of quantitative and qualitative research on the motives of Chinese FDI, there is a remarkable lack of empirical research on the benefits and drawbacks of being acquired by Chinese investors for enterprises. This shortage is especially noticeable with regards to performance of acquired companies, for which Buckley et al. (2017) identified the three weakest elements responsible. The first being the recentness of outward flowing FDI, not allowing long runs of data to be carried out. Secondly, research of the subject is complicated due to methodological problems in assessing performance and lack of transparency of Chinese companies. Thirdly, business plans and capabilities of foreign investors might not be sustainable or sufficient for long run operations. A fear for this manifests itself especially in sectors such as manufacturing and electronics, in which asset-stripping, where a company acquires a company to transfer technology and other key assets to the acquiring firm, might take place ((Buckley et al., 2017, p. 13; De Naeyer, 2019).
FDI entry modes
Greenfield investments, M&A’s and Joint ventures
When looking at how a company is attempting to directly invest into a foreign enterprise three types of entry mode can be distinguished, namely greenfield investments, joint ventures, and mergers and acquisitions (M&A).
• A greenfield investment is when a parent company opens a subsidiary in a foreign country. Buying a ‘green field’ and building upon it, hence the name. Operations are built up from scratch and can range from the opening of a regional headquarter to research and development centres or warehouses.
• In a joint venture, companies combine their knowledge and resources to pursue one goal while retaining their individuality. Each participant is responsible for the profits, losses and costs associated with the launched venture, yet the venture is its own entity.
• M&A are the consolidation of companies through financial transactions. This can be achieved through either a merger or an acquisition. A merger is when two distinct companies fuse with each other in order to form one entity. Mergers are often confused with joint ventures, yet key difference between the two is that in a merger the associated companies lose their individuality. An acquisition is when one company acquires a majority stake in another company, giving it influence in the decision-making process without changing the acquired companies’ name or legal structure.
Each entry mode has its own pros and cons. An econometric analysis conducted by Cozza, Rabellotti, & Sanfilippo (2015) found that greenfield investments show a greater and faster positive impact on a company’s size and total sales, whereas acquisitions led to negative financial performances but made it easier for the acquiring company to gain early access to intangible assets such as knowhow. Thus, when utilising a market-seeking strategy a greenfield investment is the most appropriate choice, while the utilisation of a strategic asset seeking strategy warrants the use of an acquisition. Raff, Ryan & Stähler (2009) found that the profitability of greenfield investments influences preferred entry mode not only directly, but also indirectly since it determines the outside option of potential acquisition targets and joint venture partners. Specifically, even when a greenfield investment is a viable option, the acquiring company can prefer joint ventures over M&A’s, and M&A’s over greenfield investments. Although this does require that both the M&A and joint venture scenario involve sufficiently low fixed costs. The reasons being that the profitability of a greenfield investment reduces acquisition prices for M&A’s, and local firms are given incentive to agree to carrying out a joint venture (Raff, Ryan, & Stähler, 2009, p. 7).
Chinese state-owned and private FDI
State-owned enterprises (SOE) are an important part of the Chinese economy, estimations suggesting that they represent 23-28% in China’s GDP (Chunlin, 2019), and have historically played an important role in the outflow of direct investments. They are legal entities created or acquired by the Chinese government in order to conduct economic activities in certain sectors. The most commonly used datasets classify a company as an SOE when it’s owned and controlled for at least 20% by the government or a central SOE (Kratz, Huotari, Hanemann, & Arcesati, 2020). Most strategic sectors in China, such as chemicals, transportation and infrastructure and fossil fuels, are run by SOE. This in order to ensure that a country’s (i.e. China) strategic interests in these sectors are protected. This also causes them to enjoy advantageous treatment by the government when compared to private companies. However, despite the aforementioned advantages, SOE have lower economic performance than non-SOE due to their lower production efficiency (Lin, Lu, Zhang, & Zheng, 2020, p. 43).
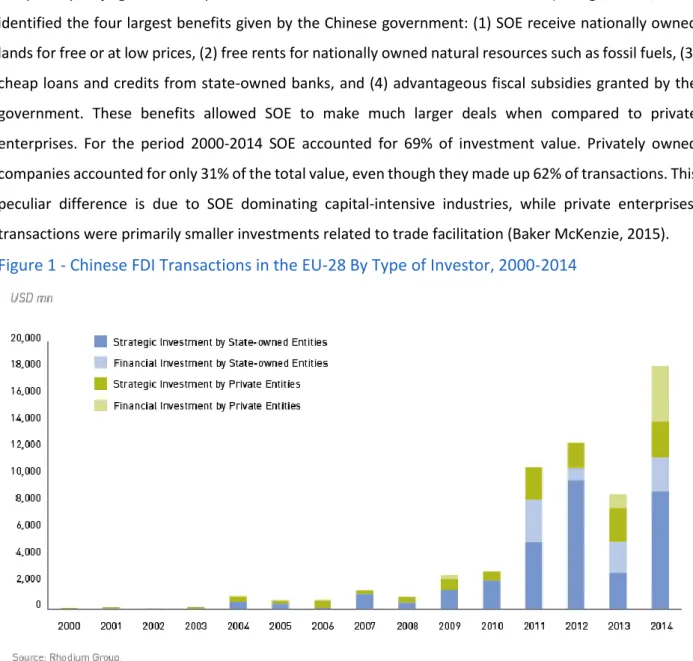
A report by Beijing based independent think tank Unirule Institute of Economics (Sheng & Zhao, 2012) identified the four largest benefits given by the Chinese government: (1) SOE receive nationally owned lands for free or at low prices, (2) free rents for nationally owned natural resources such as fossil fuels, (3) cheap loans and credits from state-owned banks, and (4) advantageous fiscal subsidies granted by the government. These benefits allowed SOE to make much larger deals when compared to private enterprises. For the period 2000-2014 SOE accounted for 69% of investment value. Privately owned companies accounted for only 31% of the total value, even though they made up 62% of transactions. This peculiar difference is due to SOE dominating capital-intensive industries, while private enterprises’ transactions were primarily smaller investments related to trade facilitation (Baker McKenzie, 2015).
Figure 1 - Chinese FDI Transactions in the EU-28 By Type of Investor, 2000-2014
When it comes to China’s industrial policies, domestic private companies have often found themselves at the short end of the stick. Haggard and Huang (2008) found that policies would swing between being favourable or discriminatory for them. Exemplified in earlier research (Song, Storesletten, & Zilibotti, 2011, p. 220), which showed that private firms in China are subject to discrimination when trying to receive credit from state-owned banks. In the 1980’s, the domestic private sector was partly liberalized and state-owned banks were pushed to give more support to private enterprises seeking financing. At the turn of the decade, the post-Tiananmen leadership did away with these measures and the private sector once again saw constraints on its financing options, with policy treatment even favouring foreign firms over domestic private firms (Haggard & Huang, 2008, p. 349).
In March 2004, China’s leadership acknowledged that government policies had been giving a more favourable treatment to foreign companies. It undertook action to ensure a more equal treatment of domestic private firms and foreign firms. The threshold for the examination and approval of large overseas investment projects was raised from $30 million to $300 million for companies in the natural resources sector and from $10 million to $100 million in the other sectors. Despite the government’s gestures, the divide between state-owned and private still persists, as key state-owned enterprises can file their overseas investments without examination and approval (Davies, 2013).
These measures paired with the Chinese parliament passing a constitutional amendment that enhanced property rights for private investors paved the way for fairer treatment, made concrete thanks to a State Council directive that stated, “all the economic sectors open to FDI should be open to domestic private
participation”. Domestic private firms were now allowed in sectors that were previously monopolized by
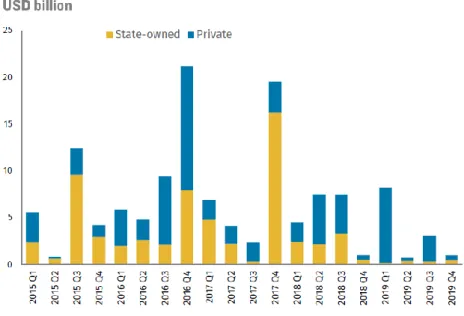
state-owned firms and given to foreign firms since the 1990’s (Haggard & Huang, 2008, p. 348). Private companies are now finally finding their way to the EU, with them leading the way when looking at the number of deals made. However, SOE lead the way when it comes to transactions values, comprising 78% of total investment value between 2008 and 2013 (Hansakul & Levinger, 2014). Thus, even though deals made by private enterprises are starting to become more prevalent, SOE still play the largest role in the dissemination of FDI to foreign countries, with them comprising 71% of the total amount of completed Chinese FDI transactions in 2017 and 41% in 2018. A change in the status quo might be nearing, however, as 2019 marks the smallest amount of FDI transactions made by SOE in the EU in years (Rhodium Group, 2019b).
Methodology of FDI data
There exist three main sources for datasets containing direct investment transactions and flow: (1) official statistics provided by the Chinese government, (2) official data from European or international institutes such as the OECD, Eurostat or the European Central bank, and (3) data compiled by independent research groups such as the Rhodium Group. All three sets have their own way of compiling data and are thus incomparable. Although there is a variety of data providers to choose from, the collection of FDI data coming from emerging countries such as China is complicated by slow and unreliable data. In order to decide which datasets is most adequate a closer look is taken at the pros and cons of each one.
Chinese datasets
When it comes to official Chinese statistics, Schüller-Zhou & Schueller (2009) found that due to varying methodologies and data collection problems Chinese FDI statistics do not live up to international collection standards. There are two datasets published by two different agencies. The first set is published by the China’s central bank (People’s Bank of China - PBoC) and its regulator (the State Administration of Foreign Exchange - SAFE). The second by the Chinese Ministry of Commerce (MOFCOM). When comparing these two datasets, large discrepancies in values can be noticed due to the collectors having insufficient experience and the providers submitting incomplete information. Attempts to streamline data gathering have been made, but the dual agency system remains complicated and discrepancies continue to show (Hanemann & Rosen, 2012a). In addition, Chinese statistics do not adequately capture OFDI that flow through offshore financial centres and thus do not accurately represent the final destinations of these outflows (Thilo Hanemann, 2014, p. 140). They also do not provide breakdowns by entry mode, country or industry, which prohibits researchers from making a disaggregated and detailed investigation of FDI coming into the EU (Amighini, Cozza, Rabbeloti, & Sanfillipo, 2014).
European datasets
Institutes such as the OECD, the IMF and Eurostat also provide figures for inwards FDI stocks and flows, which are compiled according to an international standard that considers globalisation and allows for researchers to more easily identify deviations and conduct comparisons between countries. Data-sourcing is done according to the Benchmark Definition of FDI compiled by the OECD which provides complete and detailed guidance on the coverage, collection, compilation and dissemination of FDI statistics (supra). Between 1990 and 2013 data was gathered according to the third edition, while between 2014 and 2018 data gathering was carried out according to the updated fourth edition. The fourth edition adds elements specific to a globalised world that were previously missing, such as cross-border M&A, special purpose
entities and ultimate investing country (“OECD Benchmark Definition of Foreign Direct Investment - 4th Edition - OECD”, 2008).
According to research, these statistics are more accurate than those provided by Chinese sources (Hanemann & Rosen, 2012a; Baker McKenzie, 2015). Nonetheless, a number of shortcomings still exist. First and foremost, these statistics are released with a considerable delay. Datasets such as Eurostat rely on data submissions from national governments, leading to datasets having large time lags. Most reports are released with an eighteen-month delay (Hanemann & Huotari, 2015). Secondly, these statistics fail to accurately measure the correct amount of investments due to an ever-increasing use of offshore constructions by companies. Practices such as round-tripping, whereby companies route funds to themselves through tax havens; and trans-shipping, the channelling of funds into a tax haven, in order to reinvest those funds in a third country; skew the data for large periods of time (Baker Mckenzie, 2015). Furthermore, many of these datasets do not provide detailed information on separate European countries and industries. These shortcomings make it hard for researchers to gather an up-to-date view for analysis.
Rhodium Group dataset
The Rhodium Group (RHG) is an independent research provider for economic data and policy insights on global trends, having an expertise in Chinese economic development. The group gathers data on ultimately Chinese-owned companies active in all 28 (as of 01/01/2020 EU-27) member states of the EU. The dataset is compiled using a transactional approach which utilises a host of channels, including but not limited to official sources, company reports, investment promotion agencies and industry contacts. In their methodology report (Hanemann, 2015) they further state that transactions are qualified as FDI if they are greenfield projects or acquisitions of stakes that exceed the 10% level of equity or voting shares, with the minimum value for inclusion being $1 million. Of these transactions only completed ones are included, while pending and agreed upon transactions are not included. Completed transactions include closed acquisitions and greenfield projects that have been started. When a greenfield project is very large, spanning multiple years with a value over $100 million, it’s recorded incrementally. The values of these transactions are based on the publicly announced values or on estimations made by studying project’s details such as employee number or value of similar projects. Transaction values reported in Chinese Renminbi RMB or other foreign currencies are converted using the mean exchange rate of the year the deal is accounted for.
Usage of RHG data enables researchers to avoid problems present in official datasets such as time lag and the use of offshore constructions. It also allows fora detailed, real-time analysis of the distribution of the
investments in regions, industries, ownership and type. It should be noted that data compiled this way is not comparable with official datasets due to the latter using a different compilation principle and generally being lower than RHG data. This has two main reasons. First, investments used in the dataset are traced back to the ultimate owners. Official statistics do not conduct this back-tracing, leading them to missing investments that have been routed through offshore entities. Secondly, the RHG data counts the complete value of the completed M&A, meaning that reverse flows back to China through intracompany transactions or divestitures are not included (Hanemann & Huotari, 2015).
When weighing the pros and cons of all three sources of datasets, the Rhodium Group seems to be the most useful in the context of this dissertation. It gives a holistic, real-time overview of Chinese OFDI trends without gaps or distortions. However, due to the RHG dataset itself not being accessible by the undersigned author, the majority of data was sourced from reports made by the Rhodium Group and other organisations such as Baker McKenzie and MERICS (which utilise RHG data).
Economic history of China and its relationship with the EU
Short history of China
In order to understand why Chinese OFDI garners so much attention on the international stage, a look must be had at the general history of the Chinese economy and its journey to becoming the powerful global actor we know today.
Chinese economy under Mao Zedong
In Maoist China, economic policies were distinctively Soviet style. Socialist policies such as central planning were the standard of the time. This meant distribution of capital and tools was organised by state actors, economic output arranged by 5-year plans, and prices controlled by the central government. The ultimate goal of the policy was to transform China into a self-sufficient communist powerhouse. As such, foreign trade was limited to goods China could not internally provide and was primarily conducted with the Soviet Union, while foreign investments were shunned out of fear for foreign capitalist influences. Nearing the end of this period ¾ of industrial output was controlled by SOE due to said shunning of private enterprises and foreign investments (Morrison, 2014).
This quarter century of socialist rule led to mixed results. On one hand, it resulted in a mean GNP-growth of 4.2% and progress in fields such as education, industry and life expectancy. On the other hand, disruptive non-economic policies, lack of competitiveness and weak institutions led to an enormous gap between potential and realized economic output (Brandt & Rawski, 2008). Added to this were extreme events such as ‘the Great Leap Forward’ (1958-1962) and ‘the Cultural Revolution’ (1966-1976), which were the result of devastating economic, social and political decision-making and led to the deaths of tens of millions of citizens.
The Chinese economic reforms
The erratic and chaos-causing Maoist management came at an end with the death of Mao Zedong in 1976. His death was seen by many as a turning point for China, the new Chinese leadership realizing that changes had to be made for the country to reach its full potential. And these changes would come under the guidance of Deng Xiaoping, then paramount leader of the People’s Republic. Observing the growth of the at the time so called Asian tigers (Hong Kong, Taiwan and Singapore), Deng concluded that the introduction of the market economy was the right course to take. Defending the strategy with the quote:
“Black cat, white cat, what does it matter what colour the cat is as long as it catches mice?” (Morrison,
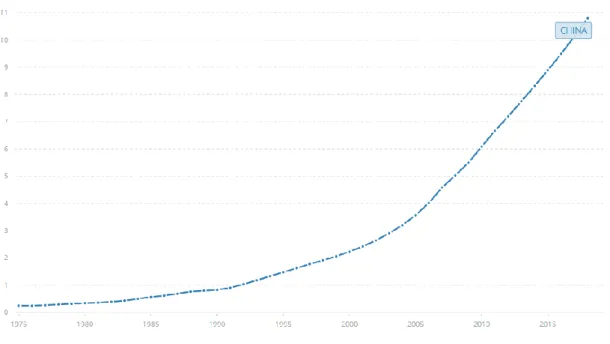
they worked. These reforms, in combination with China’s accession to the World Trade Organisation (WTO), allowed the nation’s economy to integrate more closely with the world economy through trade and finance, and were the primary drivers for its economic growth (Sachs & Woo, 2003, p. 24). In just a few decades the country transformed from a lacklustre performing developing country to an economic powerhouse with real GDP per capita growing at a rate of 8.16% per year between 1978 and 2004 (Loren Brandt, Hsieh, & Zhu, 2008, p. 712).
Figure 3 - Chinese GDP until 2018 in US$
According to Brandt and Rawksi (2008), these new economic policies enacted by Deng elected to focus on the systematic elimination of what he saw as the “big problems”. These including the lack of incentives for companies and workers, mobility, price flexibility, competition and openness of the economy. Activating these key elements of the economy proved to be a major factor in China’s economic ascent. The country slowly shifted from having a primarily agricultural economy to a non-agricultural one. This in combination with the relaxation of restrictions on rural labour mobility led to enormous productivity growth and allowed for much more attention to innovation, productivity and research & development (Brandt & Rawksi, 2008). This paired with the government slowly starting to be more permissive of private enterprises and market outcomes led to a much-needed increase in competition. The subsequent growth of the non-state non-agricultural sector allowed the country to experience a massive economic expansion, leading to a universal increase in the living standard and the lifting of hundreds of millions of citizens out of poverty (Brandt & Rawski, 2008; Brandt, Hsieh & Zhu, 2008).
This sudden change of heart towards more capitalist market systems was not without ulterior motives. Deng’s goal was not to let the economic reforms lead to gradual political reforms, as happened in the Soviet Union. On the contrary, the goal was to ensure the survival of the regime using all available strategies, of which economic growth and prosperity was the most suitable one. Ultimately, the strategy did succeed in reinforcing the Communist Party of China’s (CCP) position for decades to come (Roland, 2019). However, it must be noted that the Chinese government’s allowance of capitalist systems did not mean capitalist principles were embraced or that private firms were given free reign. Close ties were kept to industries it found to have strategic importance such as energy and infrastructure. Only in industries that were deemed to have no strategic interest were market processes allowed to function normally (Brandt & Rawski, 2008).
Brandt et al. (2008) found that these state sectors were a major impediment to overall growth. Provinces with larger state sectors in 1978 showed slower structural growth even though a larger percentage of investment was going to these sectors. This misallocation at the expense of the more productive nonstate sectors slowed the pace of growth and led to reduced resource transfer and productivity change of these sectors. It was only in 1990, after more reforms, that the size of the less efficient state sector and its negative influence was reduced.
Since the 1990’s many industries that were once completely under state control such as banking, automotive manufacturing and coal mining have been deregulated. However, restrictions are still put in place by the Chinese government by using various policy means, leading to private companies having to exist in these industries on unequal footing with the SOE (Brødsgaard & Li, 2014, p. 71). According to Roland (2019) this is mostly due to the belief that an increasing level of privatization would form a challenge to communist rule. A growing private sector and the accumulation of private wealth would allow private businesses to act independently from the CCP and even use this wealth to influence decision-making.
Between 2001 and 2004 the amount of SOE had decreased by 48% and in 2005 the domestic private sector accounted for over 50% of the GDP for the first time, illustrating that the sector was growing larger and larger (Rahman, Sultana & Chanthamith, 2018). To combat the possible negative effects for party rule, the Chinese government uses a strategy of co-opting the private sector, meaning that party units are embedded in the private sector and successful entrepreneurs are absorbed in the CCP. Boundaries between state-owned and private enterprise have thus become fluid, with party secretaries emplaced inside private enterprises to provide advisory support (Roland, 2019). More recent reforms have also not
combined with a strengthening of their economic capacities using M&A. These reinvigorated SOE have become a key element in Beijing’s industrial policies, including its newer strategies such as the Made in China 2025 strategy (Bickenbach & Liu, 2018, p. 20).
China’s going out
Even though the reforms did not transform China into a western-like economy like western observers hoped, it nonetheless performed as Chinese leadership intended and transformed the country into an economic powerhouse, while also paving the way for the next step in its grand strategy: the ‘Going Global’ policy.
The ‘Going Global’ policy
With the nation having established itself as an up and coming economy at the turn of the century, Chinese leaders began seeing the necessity of shifting from being primarily a receiver of FDI towards being a provider of FDI. In order to achieve this goal, the ‘Going Global’ strategy was contrived. Announced in the tenth Five Year Plan (2001-2005), the goal was (and still is) to promote Chinese companies in the global value chains, meaning a shift from purely manufacturing towards the upstream (resources, research and development, branding) and downstream (distribution and retail), thereby shedding its images as factory of the world and transforming it into the research laboratory of the world (Hanemann & Rosen, 2012a; Bertelsmann Stiftung & Jungbluth, 2018). In doing this, a need to acquire resources that would increase the competitiveness of Chinese companies arose. OFDI allowed Chinese companies to gain technology, skills, and brand image in markets where their late entrance put them at a disadvantage (Wu, 2005a). The government played a primary role in the promotion of OFDI by laying out the goals of the policy in clear terms, gradually easing regulations, reducing bureaucratic hassles, providing supporting information and allocating credit for major investments (Davies, 2013). Encouraging OFDI was also coherent with the, at the time, existing Chinese trade surplus and the positive gap between savings and investments (Wong & Chan, 2003).
While ‘Going Global’ was announced at the turn of the 21st century, the policy was built upon foundations laid all the way back in 1979. According to Bellabona and Spigarelli (2007), the strategy can be divided in five distinct phases in time.
1. The first phase (1979-1983) started with China having no specific regulations or norms for FDI. OFDI was controlled on a case by case basis and limited to SOE.
2. During the second stage (1984-1992) the Chinese government started pushing corporations to begin acquiring technology and market share abroad in order to improve the performance and knowhow of
domestic companies. To support this approval procedures and associated administration were standardized to make applying easier.
3. In the third stage (1993-1998) a selection of SOE was given support to invest into strategic sectors such as energy, electronics, mining, etc, in order to test the internationalisation policy. This meant that the enterprises were given incentives to partake in the strategy and allowed greater autonomy regarding decision-making. However, simultaneously, OFDI began to be controlled more strictly in order to avoid dangerous speculation and losses for the SOE.
4. In stage four (1999-2002) the government started to encourage companies to invest into less strategic, ‘light’ industries. Financial and administrative support was given to enterprises that made use of raw materials or Chinese components in order to boost innovation, technology, and ultimately the reputation of Chinese companies.
5. In the fifth stage (2002-2005) the ‘Go Global’ strategy was introduced, at which point the government switched roles from supervisor to promotor of OFDI projects. Specific guidelines were introduced for different sectors and governmental agencies began providing information and assistance where needed.
The policy proved to be highly successful, the country showed an enormous rise in Chinese OFDI. After 2002 the OFDI flow steadily increased, doubling between 2007 and 2008. In 2010 China even ranked second as the largest source of international M&A’s worldwide with 10% (Davies, 2013), which inevitably started drawing attention. Cynical observers viewed the strategy as a way for China to build a sphere of influence in Asia and beyond (Wang, 2016). To mitigate these negative impressions and condemning opinions, China focused on improving their image through public diplomacy and the creation of a positive narrative surrounding the policy. In 2003, a campaign was launched which focused on ‘China’s peaceful rise’ and used debates in which concepts such as ‘peaceful development’ and ‘harmonious world’ were emphasized (Glaser & Medeiros, 2007, p. 306). In addition, the Chinese government started to make use of media accessible in the West to improve its public image. The leadership saw external communications using new media as forms of propaganda more readily accepted in the West. Thus, government departments booted up websites accessible to non-mandarin speaking people and an emphasis was laid on mobile connectivity using social media. Traditional media was also used, radio and television were subjected to new policies and Chinese newspapers such as the People’s Daily, the Global Times and the China Daily were tasked with carrying out overseas PR (Zhao, 2015).
The policy continued to be stressed in the following Five-Year Plans, maintaining it as a primary objective of China’s international investment policy. Exemplified in then Premier Wen Jiaboa’s statement: “We will
examination and approval procedures, and provide assistance for qualified enterprises and individuals to invest overseas. We will encourage enterprises to operate internationally in an active yet orderly manner. We will strengthen macro guidance over overseas investments, improve the mechanisms for stimulating and protecting them, and guard against investment risks.” (Davies, 2013).
The Belt and Road Initiative
In 2013 the country embarked on the next step of the ’Going Global’ strategy, a project called the new Belt and Road Initiative (BRI); an undertaking of staggering proportions. Unveiling it during a visit to Republic of Kazakhstan in September 2013, freshly appointed President Xi Jinping announced his vision for the development of a 21stcentury silk road. The name finds its roots in the eponymous ancient Silk Road, a major trading route between the Far East and Europe active from around 114 BCE until the fifteenth century CE. A time wherein China was one of the dominant trading powers in the world. Which is why the name was chosen for Xi Jinping’s project, it hearkens back to the rich history of China and the crucial role it played in the development of the historic known world. The new trans-continental road is supposed to be comprised of an astonishingly broad network of roads, railways and sea-lanes stretching across the 11,000-kilometer long Eurasian content, connecting western Chinese cities to Western Europe and passing through Central Asia, Iran, Turkey, Russia, the Caucasus, and the Balkans. The route would be accompanied by a parallel network of fibre optic cables, pipelines and telecommunication links (Rolland, 2017, p. 140).
Xi Jinping himself summarised the BRI as follows: “China will actively promote international co-operation
through the Belt and Road Initiative. In doing so, we hope to achieve policy, infrastructure, trade, financial, and people-to-people connectivity and thus build a new platform for international co-operation to create new drivers of shared development” (OECD, 2018). To summarise, these five key goals are central to the
initiative and have remained so since 2013 (Xu & Chen, 2018):
1. Policy coordination - cooperation agreements have been signed with over 40 countries and organisations and negotiating more.
2. Facilities connectivity - connecting previously (nearly) unconnected regions of the world using railways, sea-lanes and airways. E.g. the New Eurasian Continental Bridge and the China-Mongolia-Russia Economic Corridor.
3. Unimpeded trade - over 50 economic cooperation zones have been established in over 20 countries, with China’s investments in those countries surpassing $50 billion. (4)
4. Financial connectivity - the creation of new or improved banks and investment funds to handle the dispersion of capital.
5. People-to-people bonds - China is promoting cooperation in fields such as science, health and education, in order to cultivate cultural connections between itself and host countries.
By putting effort in these 5 goals, China means to create interconnected economic corridors meant to ensure improved security, trade growth and strategic penetration (Fallon, 2015, p. 145). Providing the substantial amounts of financial resources needed for the project are sovereign wealth funds such as the Silk Road Fund, policy-banks like the China Development Bank (CDB) and the China Export-Import Bank, and new multilateral institutions such as the New Development Bank and the Asia Infrastructure and Investment Bank (De Decker, 2018). According to the OECD (2018) financing is already well underway, with main sources of funding being the Silk Road Fund and two of the large state-owned commercial banks. In 2018, the China Development Bank had supported 400 projects in 37 economies worth $110 billion, with more potential projects being tracked and the China Exim bank had supported 1000 projects in 49 economies worth $80 billion. The Silk Road Fund had gathered a comparatively smaller amount compared to the aforementioned banks, with a pledged capital of $40 billion. However, the fund works together with other institutions in consortiums and the government has confirmed that even more capital will be pledged. Finding an estimate for the total cost of the initiative has proven to be a bit harder. Popular estimates put the total cost of the BRI anywhere between $1 trillion and $8 billion. Trying to fine-tune a narrower estimate has proven hard due to the loosely defined and constantly expanding scope of the project (Hillman, 2018).
At the moment, most of the BRI investments have gone to Southeast Asia and South Asia. Although Africa, South America and Europe also benefit from the influx of Chinese capital (Deloitte, 2018). In Europe work on one of the first BRI infrastructure projects started in November of 2014: a $3.8 billion railway line connecting the capital of Serbia, Belgrade to the Hungarian capital Budapest (Reuters, 2017). This railway combined with the refurbished Greek Piraeus port, now majority-owned by the Chinese SOE COSCO and seen by Beijing as an integral part in connecting China to Europa, is meant to be the start of a streamlined BRI access point to Europe.
China claims the initiative to be an opportunity for both developing and developed countries, with the former gaining much needed upgrades in infrastructure and trade agreements, and the latter gaining more access and integration within Chinese markets. A win-win situation according to Chinese officials (Reuters, 2019). The initiative also supports the goal put forward in the Going Global policy of moving up in the value-added chain, moving towards high-technology and service sectors, creating an external demand for Chinese technology and knowhow, and further extending the life of older industries by creating new demand (OECD, 2018).
While many countries are getting excited at the thought of enormous investments flowing towards their industries, others are getting suspicious of China’s ulterior motives. As Rolland (2017) states in her paper “The BRI has been described as a mercantilist endeavour designed to recycle some of China’s accumulated
capital and utilize its overcapacity in construction materials to boost the exports of Chinese state-owned enterprises (SOEs) in new markets and to increase the speed of the renminbi’s internationalization.” Some
critics even perceive the initiative as China exporting its own development philosophy. One that is largely self-interested, has a lacking legal structure and supports state development with the goal of building a stronger Chinese state (Brown, 2018).
Furthermore, critics, such as Brahma Chellaney, also refer to the large debts BRI participants are taking on and the associated risk of default. Chellaney associates the BRI with what he calls the Chinese debt-trap diplomacy, in which China provides excessive credit to BRI countries in order to receive economic and political concessions when the debtor is incapable to repay their debt obligations (Chellaney, 2017). Yet, contrary to concerns, an analysis conducted by the Center of Global Development found that the initiative is unlikely to cause systemic debt crises, while also providing cases of China aiding countries with debt relief and additional credit when necessary to avoid defaulting (Hurley, Morris, & Portelance, 2018).
In order to give the initiative a more positive context, the Belt and Road Initiative was politically and officially presented in the paper Visions and Actions on Jointly Building Silk Road Economic Belt and 21st
Century Maritime Silk Road which was issued by the National Development and Reform Commission, the
Ministry of Foreign Affairs and Ministry of Commerce of the People’s Republic of China. In this document a large amount of attention was paid to depict the BRI as part of the ‘Peaceful Rise of China’ (Picciau, 2016). Added to this, China’s Executive Vice-Minister of Foreign Affairs, Zhang Yesui, highlighted that the Belt and Road Initiative is guided by joint contribution and shared benefits and again emphasised that taking part is mutually beneficial and thus a win-win situation (Chinadaily, 2019).
Made in China 2025
One of the more recent Chinese economic strategies, Made in China 2025, aims to transform China into a world leader in the most advanced and competitive industries by targeting virtually all high-tech industries that strongly contribute to economic growth (Wübbeke, Meissner, Zenglein, Ives, & Conrad, 2016). While most of the attention is focussed on the domestic market, the strategy also has an outward-looking dimension. In order to catch up with the Western economies on a technological level the country is supporting the acquisitions of core technologies through investments abroad, in order to form national champions that are able to compete with the established foreign competitors. Support is given in the form
of funds such as the National Integrated Circuit Fund, these funds receive large amount of financing through state organs and state-backed enterprises, the most recent example being a $29 billion stimulus for investment in the semiconductor industry (Bloomberg, 2019). These actions have alerted Western governments, who perceive China’s quest for technological dominance as a pressing challenge (Wübbeke et al., 2016).
Technological leaders such as Germany, South Korea and Taiwan are especially vulnerable to the negative effects caused by the Chinese industrial ambition (Bloomberg, 2018). An example of this can be seen in the rising tensions between Huawei and Germany. Germany is currently embroiled in a heated debate over whether to allow Huawei, the Chinese telecom multinational, to help in the construction of the next generation 5G network. The United States has been pressuring European countries to ban Huawei because of the danger of Chinese espionage through the network. However, Huawei has warned that if Germany was to decide to exclude Huawei from the German market, there would be consequences. Which might translate into retaliatory actions where it would hurt the German economy the most, namely the car industry (Cerulus, 2020a); Bennhold & Ewing, 2020). While Germany and the EU have not enacted a full-blown ban of the company, they have taken steps to move away from using Chinese suppliers by releasing a set of tools to limit the bloc’s dependence on the telecom giant (Cerulus, 2020b).
China and the European Union
Modern contacts and diplomatic ties came into existence with the recognition of the PRC as China’s sole government under the ‘One-China policy’ in 1975. Under this policy, the EU acknowledges the PRC as the sole government of the sovereign nation China. Leaving Taiwan, an independent island nation which China views as a breakaway province, in diplomatic isolation (“What is the ‘One China’ policy?”, 2017). This agreement forms the fundamental bedrock upon which all agreements are built and was essential for the development of trade relations between the EU and China.
Kay Möller’s research (as cited in Edmonds, 2002) states that the historic relations between the EU (then European Community) and China started as a sideshow, a reaction ensuing out of American and USSR policy towards China. As time went on the PRC began to see the European nations as more than convenient placeholders. Economic and technical cooperation rose and both sides slowly started acknowledging each other as powers in their own right. Of course, there have been ruptures along the way. Events, such as the Tiananmen Square incident in 1989 and subsequent European embargo on arms or the European refusal to give China the status of Market Economy (MES), sullied relations and caused
internal discussions regarding the possible withdrawal of agreements. However, pragmatism and economic interest always prevailed, protecting the economic bond the two nations enjoy (Picciau, 2016).
Today the EU and the People’s Republic of China (PRC) have become the two largest trading partners in the entire world. The PRC is the EU’s second largest trading partner after the United Stated of America (USA), while the EU is China’s largest. Exports to China are being valued at $234 billion (€210 billion) and imports at $439 billion (€395 billion), with on average $1.11 billion (€1 billion) being traded each day (European Commission, z.d.). When taking a look at data on Chinese FDI in the EU, it wasn’t until recently that China could be considered a notable source of investments in Europe. By the end of 2015, China only accounted for 2% of total FDI stock in the EU according to Eurostat. However, with China continuing to move towards ever more advanced economic development, a further increase in its OFDI can be expected (Seaman, Huotari & Otero-Iglesias, 2017).
Motivations of Chinese OFDI in the EU
So, besides the governmental encouragement flowing from the ‘going out’ policies, what exactly are the motivations behind Chinese investments flowing towards the EU? According to Deng (2004), Chinese companies follow the same five major motivational forces as other multinationals investing abroad. These forces being (1) resource-seeking, (2) technology-seeking, (3) diversification-seeking, (4) market-seeking, and (5) strategic-asset-seeking (Deng, 2004, p. 10; Dekeyser, 2017).
1. Resource-seeking is the establishment of foreign subsidiaries to exploit natural resources and to secure a continued supply of raw materials for own industrial operations.
2. Technology-seeking is investing in developed economies to acquire sophisticated technologies through acquisitions of existing firms, this in order to compensate for competitive disadvantages. 3. Diversification-seeking is decreasing a companies’ risk position by investing abroad. The Chinese
government encourages this in order to develop ‘national champions’. An example being the HNA group, which went from being a simple airline operator to a holding company in multiple sectors ranging from tourism to real estate (Financial Times, 2017).
4. Market-seeking is acquiring companies in order to ensure access to the foreign markets. This is often done to get past trade barriers such as import quotas or anti-dumping procedures. Chinese companies have reached their effective demand limits in several industries, resulting in production capacity and causing them to look abroad.