This is a publication of:
P.O. Box 1 | 3720 BA Bilthoven The Netherlands www.rivm.nl October 2011 002888
Benchmark
study for a
flammable
liquid depot
Benchmark study for a flammable liquid depot
Benchmark study for a flammable liquid
depot
A comparison of two risk assessments
RIVM Report 620001002/2011 DRA-09-102989-08638A
Colophon
© RIVM 2011
Parts of this publication may be reproduced, provided acknowledgement is given to the 'National Institute for Public Health and the Environment', along with the title and year of publication.
Lenoble, CJA, INERIS
Kooi, ES, RIVM
Antoine, FN, INERIS
Contacts:
CJA Lenoble
ES Kooi
INERIS
RIVM
clement.lenoble@ineris.fr
eelke.kooi@rivm.nl
This investigation has been performed by order and for the account of MEDDTL (France) and RIVM (Netherlands), within the framework of the programme ‘‘DRA 74: Appui à la mise en oeuvre de la réglementation liée à l’appréciation de la maîtrise des risques et de l’urbanisation’’ (MEDDTL) and the ‘‘Strategic research programme RIVM’’ (RIVM)
RAPPORT D’ÉTUDE
30/06/2009
N° DRA-09-102989-08638A
Programme EAT-DRA 74 – Opération 1: Negociation
territoriale des risques
Benchmark study for a flammable liquid depot
A comparison of two risk assessments
Bilthoven (The Netherlands)
This investigation has been performed by:
Preamble
This report has been drafted on the basis of information provided to INERIS, data available in the public domain, and regulation(s) applicable at the time of the study.
INERIS cannot be held liable if information received from the client organization should prove inaccurate.
Any findings, recommendations, suggestions, or equivalent described by INERIS in the present report may serve as support to decision-making processes that the client organization may wish to engage in.
However, INERIS may not, in any way, be held responsible for any decision made on the basis of this report, nor of the consequences of such decision.
The addressee or client organization shall use the results comprised in this report as a whole or, if used only partly, in an objective way. Using this information in the form of excerpts, such as synthesis memos for instance, shall be done only under the full and complete responsibility of the addressee. The same applies to any modification made, by the addressee, to this report.
INERIS does not bear any liability for any use of this report outside the scope of the service provided.
Drafting Proof-reading Checking Approval
Name Clément LENOBLE Agnès VALLEE Christophe BOLVIN Sylvain CHAUMETTE Guillaume CHANTELAUVE Marie-Astrid SOENEN Quality
Risk assessor Risk assessor Head of the ‘Quantitative Risk
Assessment’ unit
Head of the assessment
division Risk assessor Responsible for the
support to authorities Division Accidental Risk Department Accidental Risk Department Accidental Risk Department Accidental Risk Department Signature
Abstract
Benchmark study for a flammable liquid depot A comparison of two risk assessments
In France and in the Netherlands, regulations apply to determine the risk of companies with toxic, flammable or explosive substances and mixtures to the surroundings. The outcomes of risk calculations are used for permit granting and for land-use planning. The way in which risk is calculated in France and in the Netherlands, differs significantly. The regulatory framework is different and technical hypotheses vary. Nevertheless, the risk outcomes for a fictitious storage depot of flammable liquids show considerable similarity.
This is the result of a study carried out by the French INERIS and the Dutch RIVM. Public authorities can use the findings of this study to evaluate their frameworks for risk calculation.
For this study, the risk of a fictitious storage depot of flammable liquids was calculated in accordance with the French and Dutch regulations. Several significant differences were observed. Differences in policy framework involve the norms for acceptance of risk and the way in which outcomes are used for permit granting and land-use planning. Furthermore, the methodology to be used is laid down in
legislation in The Netherlands, while in France the methodology is chosen and justified by the permit-holder. Technical differences relate to the accident scenarios used, the probabilities assigned to these accident scenarios and the size of the area where damage may occur.
The area where vulnerable objects are undesirable and where future vulnerable objects should be avoided is largely the same in the two risk assessments. The area where severe consequences from a potential accident have to be considered is comparable as well.
Keywords:
Rapport in het kort
Benchmark studie voor een opslag van ontvlambare vloeistoffen Een vergelijking van twee risicobeoordelingen
In Frankrijk en in Nederland is regelgeving van kracht om te bepalen wat het risico is van bedrijven met giftige, ontvlambare of explosieve stoffen voor de omgeving. De uitkomsten van risicoberekeningen worden gebruikt voor vergunningverlening en voor ruimtelijke ordening. De wijze waarop deze landen risico’s berekenen, verschilt aanzienlijk. De beleidsmatige context verschilt en technische aannames lopen uiteen. Desalniettemin komen de uitkomsten voor een fictieve opslag van ontvlambare vloeistoffen op hoofdlijnen grotendeels overeen.
Dit blijkt uit onderzoek van RIVM en het Franse INERIS. Beleidsmakers kunnen de bevindingen van het onderzoek gebruiken om de uitgangspunten voor het maken van risicoberekeningen nader te evalueren.
Voor het onderzoek is het risico van een fictief opslagdepot met ontvlambare vloeistoffen berekend volgens de Franse en de Nederlandse regelgeving. Hierbij zijn meerdere significante verschillen geconstateerd. Beleidsmatig verschillen de
normstelling en de manier waarop uitkomsten worden gebruikt in de vergunningverlening en de ruimtelijke ordening. Verder is de te gebruiken rekenmethodiek in Nederland in regelgeving vastgelegd, terwijl in Frankrijk de vergunningaanvrager de rekenmethodiek kiest en verantwoordt. In technisch opzicht verschillen de ongevalsscenario’s die worden gehanteerd, de veronderstelde kansen voor verschillende typen ongevallen en de omvang van het gebied waar schade optreedt.
In de uitkomsten voor de twee landen is het gebied waar bestaande kwetsbare objecten ongewenst zijn en waar toekomstige kwetsbare objecten vermeden moeten worden grotendeels gelijk. Ook het totale gebied waarin rekening gehouden moet worden met ernstige gevolgen van een eventueel incident is vergelijkbaar.
Trefwoorden:
Synthèse
Benchmark sur le cas d’un dépôt de liquide inflammable Une comparaison de deux évaluations des risques
Aux Pays-Bas et en France des réglementations imposent l’évaluation et la maîtrise des risques générés par les établissements utilisant des substances dangereuses (toxiques, inflammables ou explosives). Les résultats de ces évaluations sont notamment utilisés par l’administration pour autoriser l’exploitation de ces
établissements et pour maîtriser l’urbanisation autour de ces sites. Ces évaluations de risque sont réalisées de manière différente aux Pays-Bas ou en France. Le cadre réglementaire est également différent et les hypothèses et les méthodes de calculs varient. Néanmoins, leurs résultats dans l’exemple des dépôts de liquides
inflammables montrent des similarités considérables.
Ce rapport présente le résultat d’une étude menée par l’INERIS et le RIVM. Les autorités peuvent utiliser les résultats de cette étude pour se construire une opinion sur les évaluations de risque.
Dans le cadre de cette étude, le risque généré par un dépôt de liquide inflammable fictif a été calculé en concordance avec les réglementations française et
hollandaise. Quelques différences significatives ont été observées. Les différences existantes dans le cadre réglementaire concernent notamment les niveaux d’acceptabilité du risque et la manière dont les résultats des calculs sont utilisés pour délivrer le permis d’exploitation et lors de la définition des actions à mener pour la maîtrise de l’urbanisation. Elles concernent également les méthodologies de calcul utilisées: alors que celle-ci est imposée dans la réglementation aux Pays-Bas, en France, cette méthodologie est choisie et justifiée par l’industriel. Les
différences techniques relevées dans les modes de calcul sont liées aux scénarios d’accident évalués, leur probabilité et les dimensions estimées des zones où des dommages pourraient se faire ressentir.
Enfin, les résultats de ces deux approches montrent que les zones où les
constructions vulnérables sont considérées comme indésirables et les zones où leur implantation future doivent être évitées sont largement les mêmes, que ce soit aux Pays-Bas ou en France. De même, les zones où il est estimé qu’un accident majeur pourrait entraîner des conséquences graves sont comparables.
Mots clés
Contents
List of tables and figures—13 Summary—15
1 Introduction—19
2 Legislative context and technical methodology—21
2.1 French regulatory context—21
2.1.1 Scope of regulations (which types of industries?)—21 2.1.2 Objectives of the risk assessment—21
2.1.3 Acceptance levels—25 2.1.4 Methodology to be used—32
2.2 Technical methodology used by INERIS for current study—32 2.2.1 Scenarios and frequencies—32
2.2.2 Ignition probabilities—34
2.2.3 Consequence and damage criteria—35 2.3 Dutch regulatory context—36
2.3.1 Scope of regulations (which types of industries?)—37
2.3.2 Objectives of the risk assessment (including acceptance levels)—37 2.3.3 Methodology to be used—41
2.4 Dutch technical methodology—42 2.4.1 Scenarios and frequencies—42
2.4.2 Ignition probabilities and event types—44 2.4.3 Consequence and damage criteria—46 2.5 Summary and conclusions—47
3 Description of the depot—51
3.1 Generalities—51
3.2 Storage—53
3.3 Loading area and pump area—53 3.4 Pipes – incoming—54
3.5 Surroundings of the depot—55
4 Central events: causes and consequences—57
4.1 Causes and central events—57
4.1.1 Methodology used by INERIS in this study—57 4.1.2 RIVM methodology—58
4.1.3 Comparison of central events (INERIS and RIVM)—59 4.2 Consequences of central events—61
4.2.1 INERIS methodology—61 4.2.2 RIVM methodology—70
4.2.3 Comparison of consequences—74
5 Risk results—83
5.1 INERIS results—83
5.1.1 Risk matrix – permit to operate—83
5.1.2 Land-use planning: Plan de prévention des risques technologiques (PPRT)—84
5.2 RIVM results—86
5.2.1 Individual risk—86 5.2.2 Societal risk—88 5.2.3 Discussion—90
5.3 Comparison of results—91 5.3.1 Permit to operate—91 5.3.2 Land-use planning—92 6 Conclusions—95 References—99 Vocabulary—101
Appendix 1 Bow-tie diagrams—105 Appendix 2 Domino effects—123
Appendix 3 Number of persons counted (French context)—125 Appendix 4 Detailed aléa maps (INERIS)—127
List of tables and figures
Tables
Table 1 French end-point values for the intensity of thermal radiation,
overpressure and toxic effects 26
Table 2 Probability classes used in the French regulatory context 27 Table 3 French scale for the classification of the severity of a potential
accident 27
Table 4 French risk matrix 28
Table 5 Definition of Aléa levels 30
Table 6 Guidance for the definition of real estate measures for existing
constructions 30
Table 7 Guidance for land-use planning in the vicinity of top tiers SEVESO
facility 31
Table 8 Frequency class table (INERIS) 33
Table 9 Failure probability table for barriers (INERIS) 34 Table 10 Ignition probabilities used by INERIS in the current study 34 Table 11 Scenarios for single containment atmospheric storage tanks (RIVM) 43 Table 12 Scenarios for transfer of chemicals to/from tank trucks (RIVM) 43
Table 13 Scenarios for pumps (RIVM) 44
Table 14 Scenarios for pipelines (diameter 150 mm or more) (RIVM) 44 Table 15 Probability of direct and delayed ignition for atmospheric liquids 45 Table 16 Consequence for heat radiation (RIVM method) 47
Table 17 Consequences of overpressure (RIVM method) 47
Table 18 Products handled in the facility 52
Table 19 French and Dutch product classification 52
Table 20 Description of the bunds 53
Table 21 Description of the storage tanks 53
Table 22 Description of the pump area 53
Table 23 Description of the loading area 54
Table 24 Description of the incoming pipeline 54
Table 25 Number of persons present in the vicinity of the depot 55 Table 26 Central events, causes and barriers (INERIS) 58
Table 27 Overview of central events (RIVM) 59
Table 28 Scenarios for floating roof tanks (INERIS) 62
Table 29 Scenarios for fixed roof tanks (INERIS) 63
Table 30 Scenarios for loading arms (INERIS) 63
Table 31 Scenarios for tank trucks (INERIS) 64
Table 32 Scenarios for pumps (INERIS) 64
Table 33 Scenarios for pipelines (INERIS) 64
Table 34 Models used by INERIS 65
Table 35 Results of the quantification of the probabilities and the consequences
of dangerous phenomena (INERIS) 68
Table 36 Consequence models used by RIVM 71
Table 37 Consequence distances for RIVM scenarios (in meters) 73 Table 38 Risk matrix for Fictive en Tulipe (no common emergency plan) 83 Table 39 Risk matrix for Fictive en Tulipes (common emergency plan) 84 Table 40 Contributions of scenarios to individual risk at site boundary 88
Table 41 Description of barriers used by INERIS 122
Table 42 INERIS study of domino effects 123
Figures
Figure 1 Spatial distribution of risk (INERIS and RIVM approach) 17 Figure 2 French permit to operate process for a SEVESO establishment 23 Figure 3 French land-use planning process for upper tiers SEVESO
establishments 24
Figure 4 Diagram showing causes and central events for scenario ‘Tank leak’ according to the methodology used by INERIS 35 Figure 5 Assessment of the safety report and effectuation in permitting and
land-use planning 41
Figure 6 Formation of a vapour cloud in SAFETI-NL 45
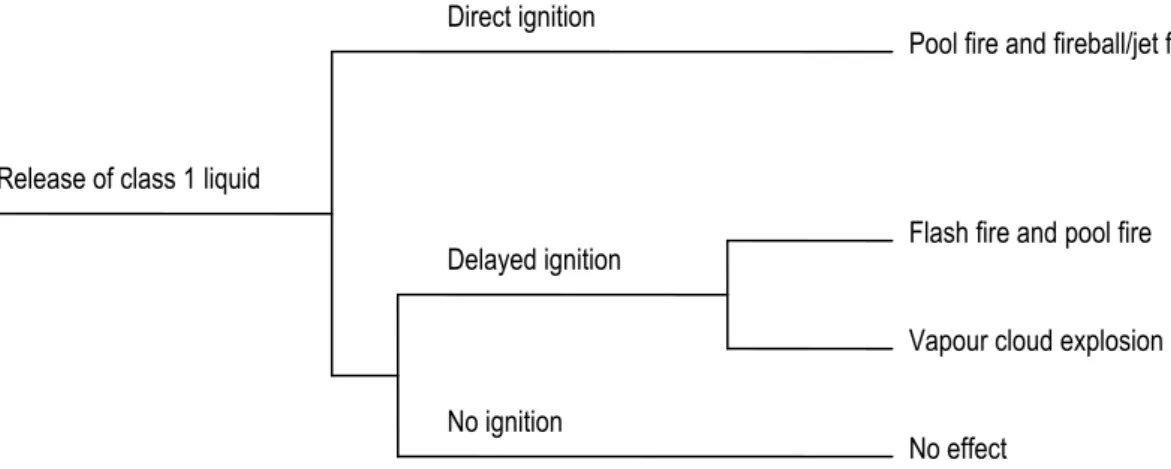
Figure 7 Event tree for dangerous phenomena following a release of class 1
flammable liquids 46
Figure 8 Event tree for dangerous phenomena following a release of class 2
flammable liquids 46
Figure 9 Layout of the flammable liquid depot 51
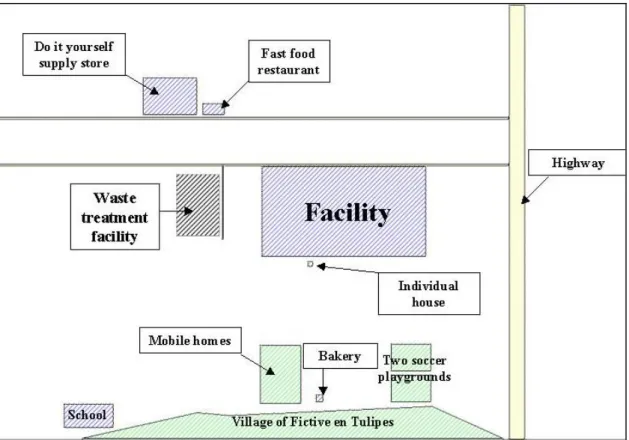
Figure 10 Surroundings of the depot 55
Figure 11 Ignition sources in the surrounding of the depot, as used by RIVM (ignition sources outside the facility are only relevant for societal
risk, see section 2.4.2) 56
Figure 12 Fire phenomena for storage tanks in bund A (weather type D5) 76 Figure 13 Explosion phenomena for storage tanks in bund A (weather type D5)77 Figure 14 Fire phenomena for the loading area (weather type D5) 78 Figure 15 Explosion phenomena for the loading area (weather type D5) 79 Figure 16 Fire phenomena for the pipeline (weather type D5) 80 Figure 17 Explosion phenomena for the pipeline (weather type D5) 81 Figure 18 Synthesis of aléas without low kinetic dangerous phenomena for
Fictive en Tulipes 86
Figure 19 Individual risk contours for Fictive en Tulipes (Dutch methodology) 87 Figure 20 FN-curve for Fictive en Tulipes (Dutch methodology) 89 Figure 21 Maximum effect zone (to be used for Dutch land-use planning) 90 Figure 22 Dutch individual risk contours and French aléas levels for
Fictive-en-Tulipes 93
Figure 23 Overpressure aléas map 127
Figure 24 Thermal aléas map 128
Figure 25 Synthesis of the aléas with low kinetic dangerous phenomena 129 Figure 26 Individual risk contours for the entire facility, the storage area, the
pump and loading area and for the pipelines (RIVM method) 131 Figure 27 Individual risk contours for the entire facility (RIVM method) 132 Figure 28 Individual risk contours for the storage area (RIVM method) 133 Figure 29 Individual risk contours for the pump and loading area (RIVM
method) 134
Summary
In France and in the Netherlands, risk calculations are carried out to determine hazardous areas around Seveso companies. In both countries, industries are responsible for carrying out the risk calculations. Public authorities are responsible to check the quality of the risk assessment. The regulatory context differs between France and the Netherlands. A benchmark exercise was carried out by INERIS and RIVM to compare the two approaches. This benchmark comprises a fictitious storage facility for flammable liquids (upper tier Seveso II), with fictitious surroundings.
The framework for risk calculations
In France risk calculations can be carried out at all times. It is prescribed to use probability ranges for the likelihood of incidents and intensity and severity scales for the consequences of incidents. Companies are free to choose their preferred methodology for the selection of scenarios and probability ranges and to choose appropriate models for consequence analysis. These choices have to be justified in the safety report and are assessed by the public authorities.
In the French context, two indicators are used for policy decisions; the risk matrix is used for the permitting process and the set of aléa zones is used for land-use planning. In the risk matrix, the likelihood of scenarios is set out against the number of people exposed to undesirable consequence levels. If too many scenarios are in the intolerable region and additional safety measures cannot resolve this situation, the permit to operate could not be supplied for a new situation and could be withdrawn for an existing situation. The set of aléa zones is a set of seven areas in which consequences of different intensity and different frequency are expected. Specific requirements for land-use are defined for each of these seven zones. A distinction is made between existing constructions and new developments. In the highest risk area existing house owners should be
expropriated and new constructions are banned. Additional safety measures can also be discussed in a debate between various stakeholders in the context of the formulation of the Plan de Prévention des Risques Technologiques (PPRT) if their costs are lower than land-use planning measures (such as expropriation). In the Netherlands risk calculations are only relevant when a policy decision is required by legislation, for example when there is a request for an environmental permit (new activity), when there is a request for a change in the permit (change of activities), when there is a request for a change in the zoning scheme and when the relevant risk calculation methodology changes. The methodology for the realisation of the risk calculations and the software to be used are both prescribed by regulations.
In the Netherlands, two indicators are used for policy decisions as well. The first indicator, individual risk, is defined as the likelihood that a fictitious person at a certain location will die as a consequence of an incident at the industry. Individual risk is a spatial indicator and decreases with distance. Strict limitations for existing constructions and new spatial developments apply within the zone where the individual risk exceeds 10-6 per year. New activities that generate a conflict will not be allowed for and existing conflicting situations should be resolved within terms defined by legislation. The second indicator, societal risk, is a graph in which the
likelihood of an incident with a certain number of fatalities is shown for different numbers of fatalities. The competent authority then needs to define a number of risk mitigation measures, including technical measures at the industry, relocation of the industry and modifications in the land-use around the industry. Subsequently, the competent authority must assess with stakeholders the desirability of each of these measures, in terms of costs and expected amount of risk reduction, and give a public account of the outcomes for the local council.
In relation to the above, the following differences were observed:
Different indicators are used as a basis for policy decisions on land-use planning and permitting. In the Netherlands public decision tools use the IR 10-6 contour and the FN-curve. The French public decision tools use ‘aléa zones’ and risk matrices.
In the Netherlands, the methodology and software to be used are laid down in legislation. In France, the framework of the risk assessment is prescribed, but the specific methodology and software to be used, is a choice to be made by the industry. This choice has to be justified in the safety report and is assessed by the public authorities.
With respect to land-use planning, seven zones are distinguished in France, each with specific limitations on existing and future land-use. In the
Netherlands, only two regions are distinguished. In the inner zone (IR 10-6 per year) very strict limitations on existing and future land-use apply. In the outer zone (the envelope where incidents may have lethal consequences), land-use limitations and safety requirements for constructions are negotiated by the competent authority and other stakeholders.
With respect to the permitting process, in France, risk calculations are carried out when the safety report is updated. The outcomes of this process could result in the withdrawal of a permit or in a demand for additional safety measures. In the Netherlands, the acceptability of risk will only be assessed when a change in the permit or the zoning scheme is requested or when the risk calculation methodology changes.
Outcomes for the flammable liquid depot
Risk assessments were carried out by INERIS and RIVM for the French and Dutch context respectively. INERIS has based a number of its choices on guidelines edited by the relevant French ministry or by a national working group on storage of flammable liquids. Other choices were based on tools developed by INERIS. RIVM made use of the prevailing Dutch guideline.
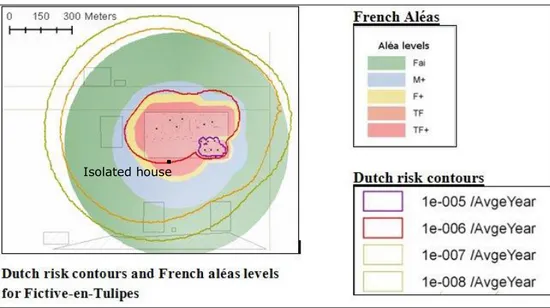
Figure 1 presents the map with French aléa levels and Dutch individual risk
contours. From a general point of view, both methodologies identify the same areas with a ‘high risk’ and a ‘low risk’. In more detail, several interesting differences were observed. The most important difference involves the different selection of scenarios considered to be relevant for the risk assessment. This difference can be explained by differences in legislative context and by different aims attached to the risk assessment. In France, the identification of scenarios aims to be exhaustive and the calculated consequences must be representative. In the Netherlands, emphasis is laid on the reproducibility of outcomes and overall reliability of the method.
Figure 1 Spatial distribution of risk (INERIS and RIVM approach)
Concerning the existing land-use, both methodologies underline a problem with a single isolated house just south of the facility. In the French regulatory context, this individual house would be expropriated through the PPRT. The PPRT may also implement additional measures for existing buildings in blue and green areas, such as an increased resistance of structures and windows to overpressure effects. The costs for all these measures will be divided between the local authority, the industry, real estate owners and the state. In the Dutch regulatory context, the house just south of the facility is highly undesirable, but there is no formal requirement for expropriation or relinquishment. Safety measures to existing buildings outside the IR 10-6 contour may be desired. However, as long as there is no change in activities on the depot, these measures must be paid for by the local council. As the current societal risk is well below the guide values, it is unlikely that the council will demand for such additional safety measures.
Regarding future land-use, new constructions are strictly banned in the red and yellow zones (France) and the IR 10-6 contour (Netherlands). The map above shows a remarkable match between these two areas. In more distant regions, the French PPRT will probably introduce some land-use restrictions in blue, green and low kinetic areas (not shown in Figure 1). These restrictions will mainly concern the type, the density and the design of buildings. In the Dutch regulatory context, changes in the zoning scheme in the surroundings of the facility must be accounted for by the competent authority, with reference to the increase of risk generated by the new land-use. As the calculated societal risk is well below the Dutch ‘guide values’, small new developments will probably be accepted.
Finally, for the permit to operate, the French risk matrix shows an ALARP situation. It could be asked to the operator to improve its safety level on the basis of safety improvements proposed in the safety report. Within the Dutch context there are no formal obligations to the permit. The permit will generally make reference to industrial standards, in such a way that good practise is sufficiently incorporated.
▪
1
Introduction
In France and in the Netherlands, risk calculations are carried out to determine hazardous areas around Seveso companies. The outcomes of the risk calculations are subsequently used for permitting and land-use planning. The regulatory context behind the risk calculations and the methodologies used for calculation differ between France and the Netherlands. A benchmark exercise was carried out to compare the French and Dutch approaches. This benchmark comprises a fictitious storage facility for flammable liquids (upper tier Seveso II) in fictitious
surroundings.
This report includes a description of the regulatory context in France and in the Netherlands, a description of the methodologies used to calculate risk, a description of the installations in the facility, a description of the outcomes for the French and Dutch approach, and a comparison of both the methods and the outcomes. This report does not deal with local emergency plans and public information in the vicinity of Seveso establishments.
The work carried out by INERIS was commissioned by the French ministry MEDDTL (Ministère de l’Ecologie, du Développement durable, des Transports et du
Logement). The work carried out by RIVM was financed by the Strategic Research Programme RIVM.
A similar benchmark study for a storage of LPG was recently carried out by INERIS, RIVM, HSE and FPMs (see [1], [2]).
2
Legislative context and technical methodology
In the current chapter, the French regulatory context and Dutch regulatory context are described and compared. Specific attention is paid to the methodologies used to calculate third party risk.
The description of the regulatory contexts applies to Seveso companies in general. The description of methodologies focuses on the storage of flammable liquids.
2.1 French regulatory context
This section deals with the following issues:
the classification of industrial activities in France with regard to Seveso establishments;
the requirements for the safety report in France and the public decision-making process related to this document;
the acceptance levels used in France;
the methodology used for the realisation of a safety report.
2.1.1 Scope of regulations (which types of industries?)
In the French regulatory framework industrial activities are classified according to their hazard potential. Three classes of industrial activities are defined, with for each class specific conditions for obtaining a permit to operate:
low hazard: a simple declaration at the Préfecture is required;
medium hazard (also called ‘A establishments’): a safety report and an environmental impact assessment are compulsory;
high hazard (also called ‘AS’ or ‘Upper tier Seveso establishments’): a safety report and an environmental impact assessment are compulsory. Land-use planning restrictions are possible.
A safety report also needs to be made for the following constructions and activities: dams;
shunting yards (if more than fifty tank wagons containing hazardous substances are present simultaneously);
parking areas for tank trucks transporting hazardous substances (if there are more than one hundred parking spaces);
river ports (more than one million tonnes of goods); seaports (more than four million tonnes of goods).
The descriptions of the regulation in force in France which will be presented below concern only upper tier Seveso establishments. Moreover, this report will only deal with the permit to operate process and the land-use planning process. Local emergency plans and public information requirements will not be discussed in detail.
2.1.2 Objectives of the risk assessment
The French regulation introduces the obligation for industrialists to carry out a compulsory risk analysis for each Seveso establishment (upper and lower tier) and to update it every five years.
The risk analysis has to identify all known and possible major accident scenarios, together with their prevention and mitigation barriers. The safety report must be a synthesis of this risk analysis. It has to be specific to the plant considered. This document must present the probability, the kinetic(1) and the possible
consequences of each major accident identified in the risk analysis.
The safety report is a technical document. It aims to demonstrate the risk control of the operator. It is a basis for the continuous improvement of the safety in a facility and a tool for the inspection by the authorities.
The results of the safety report are used in the following decision processes: the permit to operate and definition of the requirements for risk reduction on site;
the land-use planning; information to the public; design of emergency plans.
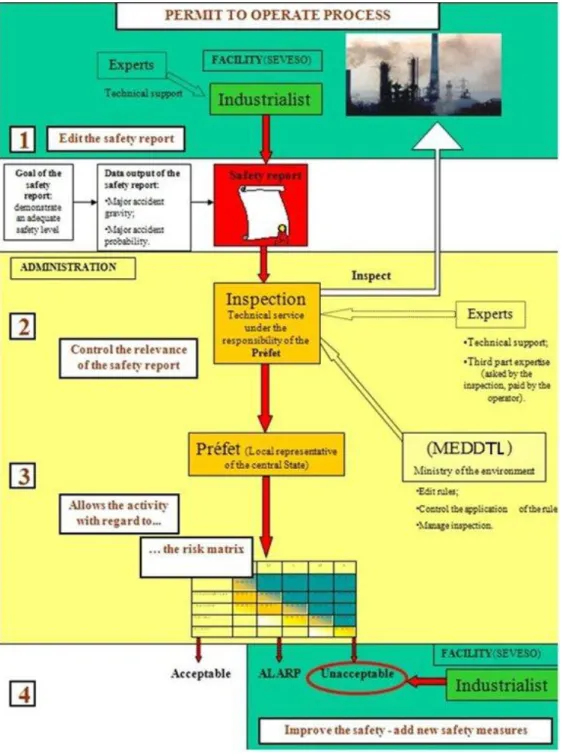
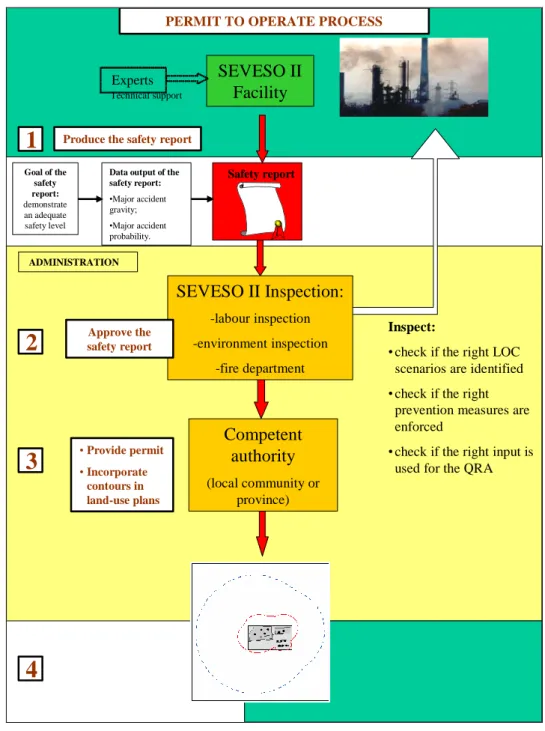
Probabilities of major accidents and the number of people exposed to their possible consequences are introduced in a risk matrix. This matrix allows the authorities to assess the societal acceptability of the risk generated by a facility in a given environment. If the risk matrix is acceptable, the facility is considered to be compatible with its environment and the authorities will deliver or prolong the permit to operate (see [3]). Figure 2 describes the permit to operate process. Land-use planning restrictions and land-use modifications may also be applied in the vicinity of existing and future upper tier Seveso establishments (‘AS
establishments’) (see [4]). Effect distances, kinetics and probabilities of dangerous phenomena are used to define areas of high, medium and low risk (‘aléa’) for thermal, overpressure and toxic consequences. This geographical information is then used for land-use modifications and planning for current and future urbanisation through the ‘Plan de Prévention des Risques Technologiques’ (Technological Risk Prevention Plan). This plan is usually referred to as ‘PPRT’. It aims at mitigating the residual risk, after risk prevention measures at the source have been taken. Zones (based on ‘aléa areas’) are defined within which
requirements can be imposed on existing and future buildings, such as: restrictions on future construction and land-use;
consolidation of existing constructions (example: blast-proof windows) expropriation of existing buildings and constructions in the areas exposed to very high ‘aléa’ levels;
relinquishment: in areas exposed to high ‘aléa’ levels, owners could be given the right to force the city (or the local community in charge of land-use planning) to buy their real estate.
Moreover, additional risk reduction measures at the source could be investigated if the costs of these measures balance the real estate costs that are avoided.
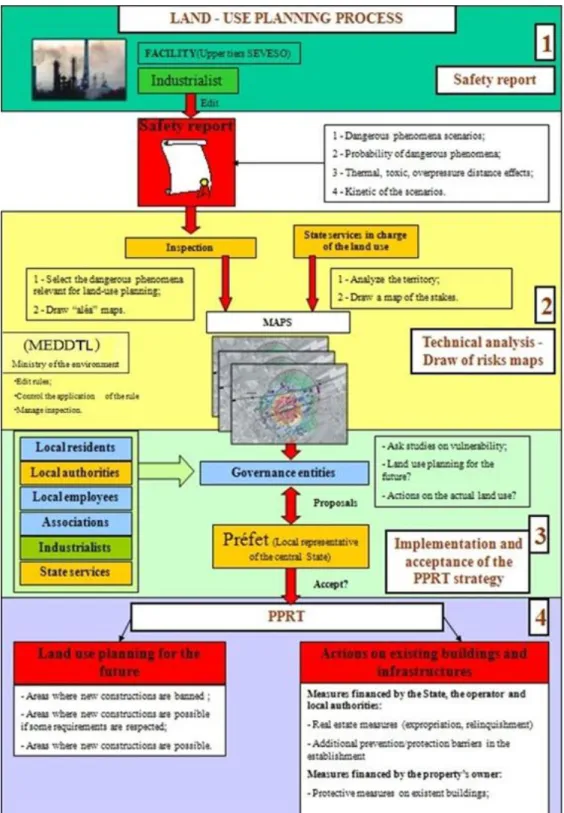
Once the PPRT is accepted, it will be implemented in general local urbanisation documents and plans. Figure 3 describes the ‘PPRT’ process.
Figure 3 French land-use planning process for upper tiers Seveso
2.1.3 Acceptance levels
2.1.3.1 Generalities
Some of the results of the safety reports are used for the two main public decision support tools: the permit to operate process and the land-use planning. These results are the following:
Concerning the permit to operate: kinetic of major accidents; intensity of major accidents; probabilities of major accidents; severity of major accidents. Concerning the land-use planning: kinetic of dangerous phenomena; intensity of dangerous phenomena; probabilities of dangerous phenomena.
Terminology in the French context:
- Accident: Undesirable event such as a discharge of toxic substance, a fire or an explosion which causes consequences and damages on a human being, goods or the environment. The accident is produced by a dangerous phenomenon, when vulnerable targets are exposed to the effects of such a dangerous phenomenon. - Dangerous phenomenon: Release of energy or substance that may produce
damage to vulnerable targets (living beings or objects).
- Effect of a dangerous phenomenon: Characteristics of physical and chemical phenomena linked to dangerous phenomena: thermal radiation, toxic concentration, overpressure and missiles.
- Intensity of the effect of a dangerous phenomenon: Physical measure of dangerous phenomena effects (thermal dose, toxic dose, overpressure level). - Scenario of a dangerous phenomenon: Event sequence, starting from root
causes, that leads to a dangerous phenomenon. Various scenarios may lead to the same dangerous phenomenon. In this case, there are as many scenarios as there are possible event combinations leading to a same dangerous phenomenon. Scenarios studied in the safety report are defined through a risk analysis.
- Central event: Event defined in the risk analysis, usually at the centre of a dangerous phenomenon. This event is often a loss of containment when fluids are studied, and a loss of physical integrity when solids are studied;
- Safety measure: A whole formed by technical and/or organisational elements necessary and sufficient in order to ensure a safety function. The following safety measures may be distinguished:
o Prevention measures: these measures aim to prevent the occurrence of a central event or to decrease the probability of a central event;
o Mitigation measures: these measures aim to decrease the intensity of the effect of a dangerous phenomenon. When these kinds of safety measures are studied in a risk assessment, both dangerous phenomena resulting from the function and the malfunction of the safety measure have to be considered;
o Protection measures: these measures aim to limit the consequences of an accident through diminishing the vulnerability of potential targets.
The different scales and definitions that are used in the French regulation framework are explained in the next few paragraphs.
Kinetic of major accidents and dangerous phenomena:
The term ‘kinetic’ refers to the time scale of the incident and the time needed for evacuating local populations. Fast kinetic phenomena involve dangerous
phenomena that may occur rapidly after the beginning of the central event. Examples of fast kinetic phenomena are flash fire, pool fire, tank explosion and vapour cloud explosion. Slow kinetic phenomena are phenomena that only occur after some delay. This delay would allow local population to evacuate. Some examples of low kinetic dangerous phenomena are boil-over and fireball after pressurisation (due to heat impingement).
Intensity of dangerous phenomena:
Four levels are distinguished to classify the intensity of dangerous phenomena: significant lethal effect (about 5% probability of fatality);
lethal effect (about 1% probability of fatality); irreversible effect (irreversible health effects); indirect effect (e.g. broken windows).
The first three levels are used for both the permit to operate process and the land-use planning process. The latter (indirect) is only land-used for the land-land-use planning process.
The end-point values for the intensity of thermal radiation, overpressure and toxic exposure are shown in Table 1.
Table 1 French end-point values for the intensity of thermal radiation,
overpressure and toxic effects
Effects Level of effects
Significant lethal effect threshold(2) Lethal effect threshold(2) Irreversible effect threshold (2) Indirect Thermal radiation 8 kW/m2 or (1800 kW/m2)4/3s 5 kW/m2 or (1000 kW/m2)4/3s 3kW/m2 or (600 kW/m2)4/3s /
Overpressure 200 mbar 140 mbar 50 mbar 20 mbar
Toxic exposure 5% lethality 1% lethality irreversible
health effects
2 The heat radiation levels are used for prolonging fires, heat radiation doses are used for short duration fires,
Probability of accidents:
The probability of accidents must be expressed as a range value. These range values are defined in Table 2.
Table 2 Probability classes used in the French regulatory context
Probability class E D C B A
2.1.3.2 Range of probability (per year)
0 to 10-5 10-5 to 10-4 10-4 to 10-3 10-3 to 10-2 10-2 to 1
Severity of major accidents:
In the French regulatory framework, the number of fatalities following a major accident is not calculated. Instead, the severity of accidents is determined from the number of people potentially exposed to certain effects. Five levels are
distinguished: disastrous; catastrophic; significant; serious; moderate.
The severity of a potential accident is derived from the number of persons potentially exposed to thermal radiation effects, overpressure effects or toxic effects of different intensity. For each accident, three intensity thresholds (significant lethal effect, lethal effect and irreversible effect, see previous page) define three different effect envelopes (areas). The severity of a given potential major accident is deduced from the number of persons situated in these areas following a national scale presented in Table 3. If the table is indecisive (for example, if 6 persons reside in the area with lethal effects, and 150 persons in the area with irreversible effects), the highest severity class is used (in this case ‘catastrophic’).
As can be seen from Table 3, the indirect effect is not relevant for the severity classification of a potential accident. It is therefore not relevant for the granting of the permit to operate. The indirect effect is only used for land-use planning in accordance with the PPRT.
Table 3 French scale for the classification of the severity of a potential accident
Number of people potentially exposed Resulting severity class
Significant lethal effect
Lethal effect Irreversible effect
> 10 > 100 > 1000 Disastrous
1 to 10 10 to 100 100 to 1000 Catastrophic
1 1 to 10 10 to 100 Significant
0 1 1 to 10 Serious
2.1.3.3 Permit to operate
For Seveso establishments, the permit to operate is granted if the facility is considered to be ‘compatible with its environment’. The environment means here the area where people may be injured in case of the occurrence of a major accident.
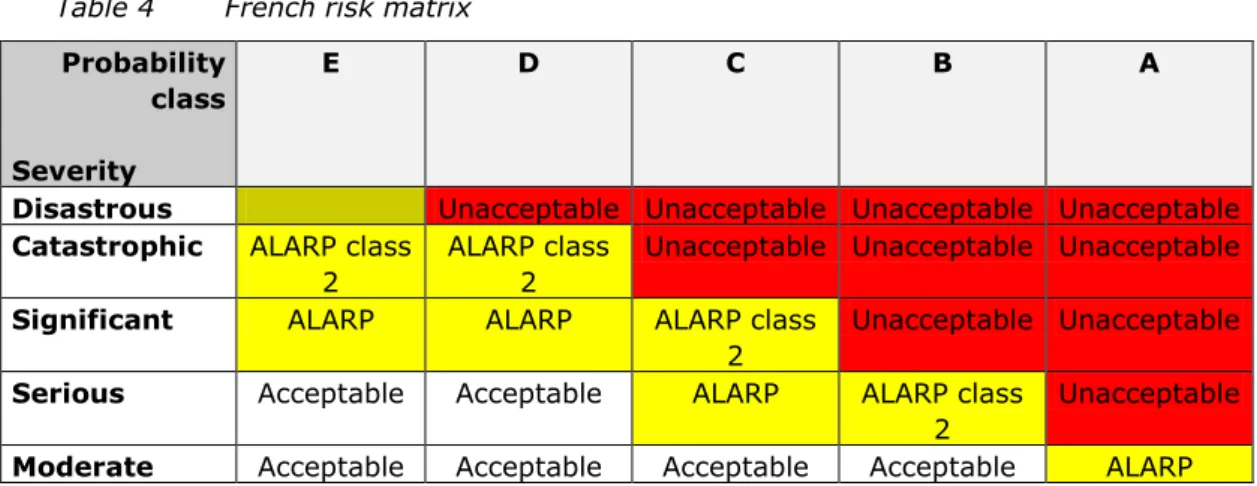
Table 4 is the decision tool used by the French authorities for the assessment of this compatibility.
Each major accident identified in the safety report is assigned a probability range (Table 2) and a severity class (Table 3) and therefore relates to one of the cells in Table 4. Once all identified accidents are characterised with regard to this matrix, the overall acceptability of the matrix, and thereby the overall acceptability of the permit of the facility, is assessed.
Table 4 French risk matrix
Probability class Severity
E D C B A
Disastrous Unacceptable Unacceptable Unacceptable Unacceptable
Catastrophic ALARP class 2
ALARP class 2
Unacceptable Unacceptable Unacceptable
Significant ALARP ALARP ALARP class
2
Unacceptable Unacceptable
Serious Acceptable Acceptable ALARP ALARP class
2
Unacceptable
Moderate Acceptable Acceptable Acceptable Acceptable ALARP
This risk matrix consists of three areas:
an acceptable area (in white): if all identified scenarios are in the acceptable area, the permit to operate is granted (for a new situation) or continued (for an existing situation);
an unacceptable area (in red): if one or more scenarios are in the unacceptable area, the permit to operate is not granted (for a new situation) or withdrawn (for an existing situation);
an ‘ALARP’ (As Low As Reasonably Practicable) area (in yellow): for each accident scenario in this area, continuous improvement of the safety is asked to operators. There are two specific cases among the ALARP areas:
the area disastrous/E (upper left box): If an accident scenario is in this area, a distinction is made between new and existing facilities. For a new facility the situation is acceptable if and only if this scenario has at least one barrier, and if this barrier was not considered, the remaining frequency would still be E. For an existing facility, ALARP class 2 conditions apply for the scenarios in this box;
ALARP class 2: The total number of accidents in the ALARP 2 boxes of the diagram must be five or lower. If there are more than five accident scenarios, additional technical barriers must be installed in such a way that the amount of ALARP class 2 accident scenarios reduces to five (or
less). More than five ALARP class 2 accidents scenarios are acceptable if and only if:
all these ALARP class 2 accident scenarios have probability class E; all these ALARP class 2 accident scenarios have at least one barrier; if this barrier was not considered, the remaining frequency would still be E (for each of these ALARP class 2 accident scenarios).
All other situations with more than five ALARP class 2 accident scenarios are unacceptable.
If a facility generates a risk that is considered as unacceptable, the operator has the responsibility, on its own funds, to improve the safety in the establishment and to install additional safety measures. The safety must be improved until the situation becomes acceptable or ALARP.
If the situation is ALARP, the operator must prove in the safety report that all risk reducing measures at an acceptable cost have been implemented.
2.1.3.4 Plan de Prévention des Risques Technologique (PPRT) (Technological Risk Prevention Plan)
The Technological Risk Prevention Plan (PPRT) is relevant for upper tier Seveso facilities (‘AS class’). The PPRT is a process which enables the authorities to:
Use regulation tools for reducing the residual risk. Indeed, even after the reduction of risk at the source through the ALARP process, in some cases, some population can still be exposed to a significant risk. The PPRT gives the
authorities a tool for modifying the actual land-use in order to reduce this residual risk.
Define a land-use plan for the vicinity of a facility which takes into account the risk generated by the facility.
In order to reach these objectives, seven areas with different regimes of risk (aléa levels) are displayed on a map. The regime of risk (aléa level) of a location is determined by the intensity of the phenomena that may occur at the location and the cumulative probability of occurrence. The procedure is as follows:
define the dangerous phenomena that may occur and their probability classes; select the fast kinetic dangerous phenomena, and define the areas with significant lethal effects, lethal effects, irreversible effects and indirect effects related to these fast kinetic phenomena;
count for each location how many (fast kinetic) dangerous phenomena with significant lethal effects may occur at the considered location, how many phenomena with lethal effects, and so on;
determine the aléa level for the location using Table 5;
make an aléa map that shows the aléa level at all relevant locations.
For example, if three different (fast kinetic) dangerous phenomena with probability class E have a significant lethal effect at a certain location, the cumulative
frequency for significant lethal effect at this location is 3E. The corresponding aléa level is ‘high plus’ (H+, see Table 5). If there had been six dangerous phenomena with probability class E and a potential significant effect at this location, the aléa level would have been ‘very high’ (VH).
If the table is indecisive, the maximum aléa level is used. For example, if a dangerous phenomenon with probability range D has an irreversible effect at a certain location (aléa level ‘medium’), and two dangerous phenomena with probability E have a significant lethal effect at the same location (aléa level ‘high plus’), the overall aléa level at that location is the maximum of the two, that is ‘high plus’ (H+).
Table 5 Definition of aléa levels
Maximum intensity of the effect of a
phenomenon at a given location
Significant lethal Lethal Irreversible
In-direct
Cumulative probability of phenomena at a given location
>D 5E to D <5E >D 5E to D <5E >D 5E to D <5E All
higher < > lower higher < > lower higher < > lower
Aléa level VH+ VH H+ H M+ M Low
Slow kinetic dangerous phenomena are also considered. However, only the areas impacted by ‘irreversible’ effects are taken into account. These areas are
represented using a specific map.
As soon as the seven aléa areas are laid on the map, together with the surrounding houses, buildings, and infrastructures, a strategy for the land-use and the
reduction of the risk has to be planned. This strategy is designed through a governance protocol involving the inhabitants, the industry, local communities, local associations, local employees, the state, et cetera.
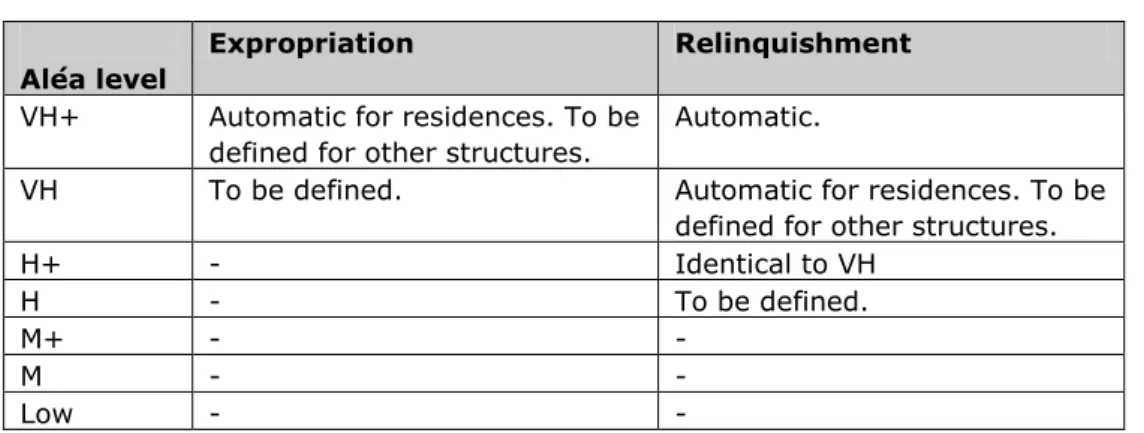
A guidance is given in the ‘Guide méthodologique – Le Plan de Prévention des Risques Technologiques (PPRT)’ [5] for piloting the definition of the strategy. A part of this guidance is presented in Table 6. Existing constructions can be expropriated or relinquished. In the latter case, people who currently inhabit a house may continue to do so. However, once they move, the house will be pulled down.
Table 6 Guidance for the definition of real estate measures for existing
constructions
Aléa level
Expropriation Relinquishment
VH+ Automatic for residences. To be defined for other structures.
Automatic.
VH To be defined. Automatic for residences. To be
defined for other structures.
H+ - Identical to VH
H - To be defined.
M+ - -
M - -
To summarise, the PPRT introduces the following possibilities for reducing the individual risk:
expropriation or relinquishment in the higher risk areas;
additional risk reduction measures in the facility can be investigated if their cost balances the real estate measure cost that is avoided;
improvements of the population protection through consolidation of buildings and infrastructures.
The cost of these measures is supported by the local communities, the industrialists and the state (for real estate measure and additional risk reduction measures in the facility) or by building and infrastructure owners (if the costs for the works in the building or infrastructure is below 10% of the value of the
building/infrastructure).
The PPRT strategy aims to modify actual land-use in the vicinity of a dangerous facility, and also aims to define a land-use plan for new buildings and
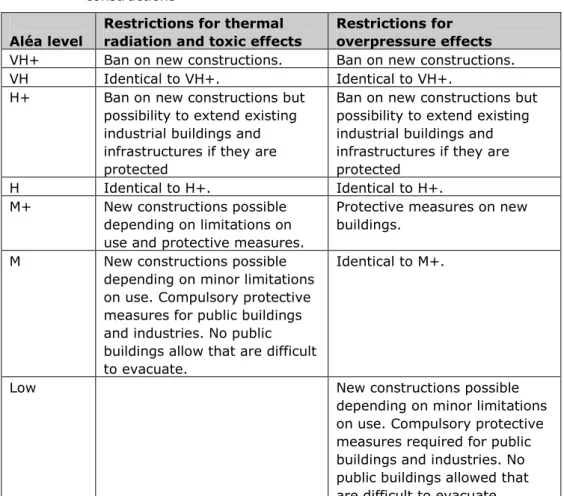
infrastructures (such as highways and railways). The ‘Guide méthodologique’ ([5]) also provides guidance for land-use planning issues. A part of this guidance is reproduced in Table 7.
Once approved by the local state representative (Préfet), the PPRT becomes a local land-use planning regulation.
Table 7 Guidance for land-use planning and real estate measures for future
constructions
Aléa level
Restrictions for thermal radiation and toxic effects
Restrictions for overpressure effects VH+ Ban on new constructions. Ban on new constructions.
VH Identical to VH+. Identical to VH+.
H+ Ban on new constructions but possibility to extend existing industrial buildings and infrastructures if they are protected
Ban on new constructions but possibility to extend existing industrial buildings and infrastructures if they are protected
H Identical to H+. Identical to H+.
M+ New constructions possible depending on limitations on use and protective measures.
Protective measures on new buildings.
M New constructions possible depending on minor limitations on use. Compulsory protective measures for public buildings and industries. No public buildings allow that are difficult to evacuate.
Identical to M+.
Low New constructions possible
depending on minor limitations on use. Compulsory protective measures required for public buildings and industries. No public buildings allowed that are difficult to evacuate.
2.1.4 Methodology to be used
As laid out above, the French regulation asks industrialists to carry out a risk analysis. The safety report presented to the administration must summarise this risk analysis and present the probability, the effect distances, the severity and the kinetic of all known possible major accident scenarios, together with their
prevention and protection barriers.
Industrialists are free to choose the methodology to be used for the selection of scenarios, the probability assessment and the distance effects calculation, but it is underlined that the safety report must exhaustively take into account all major accident scenarios. Moreover, the relevance of the methodology used has to be justified in the safety report.
Although the choice of the methodologies used in the safety report is passed on to industrialists, guidance is available for some specific issues. For example the following guidance is available:
The ‘circulaire du 10 Mai 2010’ (see [6]) gives guidance for writing a safety report (severity calculations, atmospheric dispersion calculations, treatment of specific initial events and dangerous phenomena such as rupture of
atmospheric tanks, et cetera).
Some national working groups have been created. These working groups consist of members from the French ministry, industrialists and experts. These groups deliver guidance on specific issues or on safety reports of one type of facility (events frequencies, effect distance calculation methodologies, et cetera).
The use of these guidelines is not compulsory. However, if these methods are used, their relevance does not need to be justified in the safety report.
2.2 Technical methodology used by INERIS for the current study
This section deals with the methodology used by INERIS in order to perform the risk assessment. The following issues will be presented:
the methodology used in order to define scenarios and frequencies; the ignition probabilities used;
the consequence and damage criteria.
2.2.1 Scenarios and frequencies
2.2.1.1 Scenarios identification
In the methodology used by INERIS, the identification of accident scenarios (from root causes to the accident) which could occur on the studied establishment is usually realised through a risk analysis (according to a methodology such as HAZOP, FMECA, preliminary risk analysis, et cetera).
For this aim, a working group will be created. It could, for example, consist of the plant safety manager, several operators and risk experts. This working group will identify the following elements of the accident scenario:
The central events to be considered.
The root causes lying underneath the central events. Typical root causes are seal failure, operator errors, falling objects, et cetera.
The consequence events of the central events.
The barriers which may prevent the occurrence of the accident. Prevention and protection barriers are considered if they meet the following requirements:
independence regarding the occurrence of the event they prevent; effectiveness;
response time adapted to the kinetic of the accident they prevent; maintainable;
testable.
When a mitigation barrier is identified in an accident scenario, both the scenario describing the consequences following the function and the malfunction of the safety barrier need to be taken into account.
Please note that the ‘qualitative’ identification and evaluation process of scenarios and safety barriers is considered by INERIS as an important element of the safety report. In terms of safety, a significant part of the safety report’s added value is realised at this stage.
Once the identification process is realised, the scenarios’ frequency ranges can be calculated.
2.2.1.2 Scenario frequencies
In the methodology used in this study by INERIS, the frequency of central events is derived from the frequencies of root causes and the reliability of preventive
barriers.
Each root cause frequency is determined by the working group. They are expressed using frequency classes (frequency ranges) (see Table 8).
Table 8 Frequency class table (INERIS)
Frequency class
2.2.1.3 Failure frequency
F-1 Between 1 and 10 per year F0 Between 0.1 and 1 per year F1 Between 0.01 and 0.1 per year F2 Between 10-3 and 10-2 per year Fx Between 10-(x+1) and 10-x per year
Some initial events are not included in scenario frequency calculations such as events related to malevolence, meteorite falls et cetera. Indeed, the French
regulation considers that these events can be excluded from frequency calculations if some specific requirements and conditions are fulfilled (see [6]).
In this study, it is assumed that these conditions and requirements are fulfilled. This is represented in bow-tie diagrams as red crosses preventing the sequence of the scenario to continue.
The confidence level of each barrier is also assessed as a probability (reduction) range (see Table 9).
The methodology followed for this assessment is described in the and guidelines see [7] and [8] and is inspired by EN 61508 and EN 61511.
Table 9 Failure probability table for barriers (INERIS) Confidence level Failure probability
NC1 Between 0.01 and 0.1 per demand
NC2 Between 10-3 and 10-2 per demand NC3 Between 10-4 and 10-3 per demand
Root causes that lead to a common intermediate event, such as seal leak and flange leak, are combined using AND and OR operators:
If any of the root causes can cause the intermediate event, an OR operator is used. In that case, the frequency class of the intermediate event is equal to the minimum frequency class of the root causes.
If multiple root causes are required for the occurrence of the intermediate event, an AND operator is used. In this case, the frequency class of the
intermediate event is equal to the sum of the frequency classes of the required root causes.
If a prevention barrier exists, the confidence level of the barrier is added to the frequency class of the cause, which gives the frequency class of the
intermediate event.
Intermediate events are further combined into release scenarios, such as leak from the tank or leak from accessories of the tank. Release scenarios are then further combined into central events, such as a pool in the bund or a pool on the roof of a tank. For this grouping the same calculation rules apply as for the grouping of root causes into intermediate events.
With this methodology, the dangerous phenomenon scenarios to be considered, the assessment of the frequency of roots causes and the probability of failure of prevention barriers are specific for each establishment.
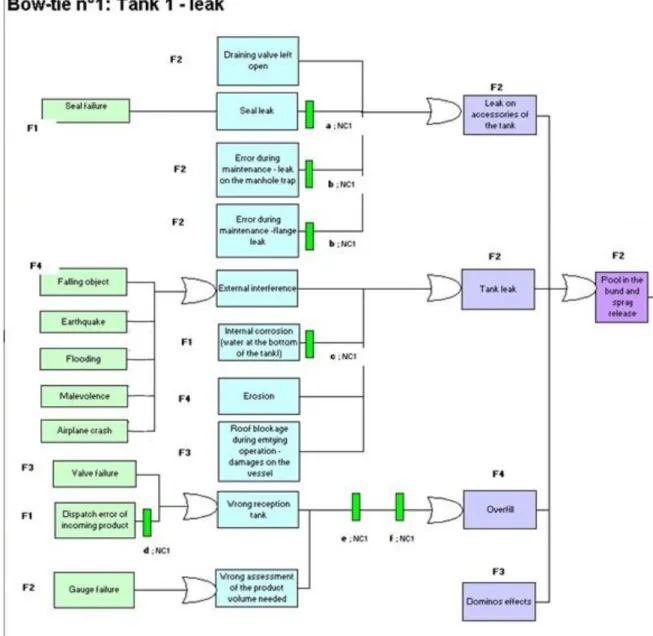
An example of a diagram connecting root causes with the central event ‘pool in the bund and spray release’ is given in Figure 4. In this example, the frequency class for the central event (pool in the bund and spray release) is equal to F2.
2.2.2 Ignition probabilities
In the framework of this study, INERIS uses the ignition probability given in [9] and presented in the table below:
Table 10 Ignition probabilities used by INERIS in the current study
Product Location of the cloud
Class B Class C
Hazardous location (ATEX) area with occasional
presence of operators (example: bund) 1×10
-2 1×10⁻³ Hazardous location (ATEX) area with regular
presence of operators (example: loading area) 1×10⁻¹ 1×10⁻²
Figure 4 Diagram showing causes and central events for scenario ‘Tank leak’ according to the methodology used by INERIS
2.2.3 Consequence and damage criteria
In the French regulatory context, the potential number of fatalities following the occurrence of a major accident is not a criterion for delivering a permit to operate or for defining the land-use planning. Instead, the decision tools for public
authorities are based on the number of persons exposed to three (for thermal radiation effects) or four (for overpressure effects) pre-defined levels of intensity. These levels were discussed in section 2.1.3.1.
Therefore the use of probit functions is not necessary in French safety reports. For each central event the extent of the hazardous area is determined from the release scenarios lying underneath the central event. For example, for tank 1 the area with a significant lethal effect (see Table 1) for the central event ‘pool in the
bund’ is the envelop of the areas with 8 kW/m2 heat radiation or 200 mbar overpressure of the release scenarios ‘leak from accessories on the tank’, ‘leak from the tank’, ‘overfill’ and ‘domino effects’ (see Figure 4).
If the consequence areas of the release scenarios differ significantly in size (for example if the overfill scenario has a larger consequence distance than the leak from the tank scenario), the grouping of these release scenarios into one single central event will give inaccurate results. For these cases, the methodology allows more detailed diagrams (ungrouping of release scenarios).
2.3 Dutch regulatory context
The Dutch regulatory context is described in Module A of the ‘Reference Manual BEVI Risk Assessments’ ([10]). A solid framework was established in 2004 when the Decree External Safety for Establishments (‘BEVI’, [11]) became effective. This decree lays out how third party risk is incorporated in legislation. As third party risk is closely related to industrial activities and land-use, the Decree External Safety for Establishments is linked to the more general Environmental Management Act and Spatial Planning Act. The Decree lists for which groups of industries third party risk needs to be addressed by the competent authority. An official assessment of third party risk by the competent authority is required for the following occasions:
upon the first effectuation of the Decree for a specific group of industries; upon a request for a change in the environmental permit by an industry; upon a request for a change in the zoning plan;
upon a five-year periodic update of the safety report (upper tier Seveso companies only);
upon a ten-year periodic update of the zoning plan;
The assessment of third party risk by the competent authority comprises two parameters:
individual risk; societal risk.
More details are supplied in section 2.3.2.1 (individual risk) and section 2.3.2.2 (societal risk).
The European Seveso II Directive was implemented in the Netherlands as the Decree on Risks of Major Accidents (‘BRZO’, [12]) in 1999. In accordance with Seveso II, lower tier companies have to implement a prevention policy for major accidents. Upper tier companies additionally have to write a safety report.
As in France, the safety report must be updated every five years. The safety report has several objectives, such as:
identification of all major accident scenarios, including causes and possible preventive barriers;
demonstration that enough effort is made to keep the risks at an acceptable low level;
overview of the most relevant scenarios for internal emergency plans, external emergency plans and for land-use planning (third party risk assessment). The safety report needs to be approved by the competent authority (either the local municipality or the regional province). Without a valid and approved safety
report, the industry is not allowed to operate. One element of the safety report is the third party risk assessment. For upper tier Seveso companies, it is obligatory to assess the acceptability of third party risk using the outcomes of a Quantitative Risk Analysis (QRA). A new QRA is made every five years when the safety report is updated. The relation between the QRA and the land-use around the facility is set down in the Decree External Safety for Establishments (‘BEVI’, see above).
2.3.1 Scope of regulations (which types of industries?)
The types of industries for which third party risk needs to be addressed are listed in the ‘Decree External Safety for Establishments’ (‘BEVI’, [11]). The current list comprises the following types of industries:
a. Seveso companies (upper tier and lower tier).
b. Train marshalling yards (marshalling of hazardous goods). c. LPG filling stations.
d. Storage facilities for hazardous goods (10,000 kg or more).
e. Industries with one or more ammonia freezing units (1500 kg or more). f. Specific groups of industries, i.e. industries with installations containing
1500 kg or more of ammonia (with the exemption of freezing units), industries with 150 m3 or more (highly) flammable liquids in an aboveground storage vessel, industries with equipment containing 13 m3 or more of propane or acetylene, industries using a cyanide solution of 100 l or more for
electroplating, industries with equipment containing 1000 l or more of (very) toxic substances, industries with gas cylinders containing (in sum) 1500 l or more of (very) toxic substances, and establishments where gas from the national grid is reduced in pressure.
g. Other industries that require an environmental permit and produce an individual risk higher than 10-6 per year on any location outside the site boundary.
Generic distances for third party risk are defined for most of the above categories. Calculations are carried out for upper tier Seveso companies and some specific cases.
2.3.2 Objectives of the risk assessment (including acceptance levels)
The primary objective of a risk assessment is to see if the risk posed by an industry is acceptable for the society. In the Dutch legislative context, the acceptability is assessed using two parameters: individual risk and societal risk. These indicators are calculated by the operators with a Quantitative Risk Analysis (QRA). For Seveso companies, it further needs to be identified which major accident scenarios may occur and if the company has taken sufficient measures to reduce the risk corresponding to these accident scenarios. This objective is met by inspection of the safety management system, which is described in the prevention plan (lower tier Seveso facilities) or the safety report (upper tier Seveso facilities).
2.3.2.1 Individual risk
The first parameter that is used to determine the acceptability of the presence of a company in relation to its surroundings, is the Individual Risk contour of 10-6 per year (hereafter IR 10-6 contour). A distinction is made between ‘vulnerable objects’ and ‘objects of limited vulnerability’. Vulnerable objects include among others
houses in non-rural areas, schools, elderly homes, child day-care facilities, camping sites and recreational facilities with accommodation for fifty or more visitors, and large office buildings, hotels and shopping centres. Objects of limited vulnerability include among others houses in rural areas (no more than two houses per hectare) and office buildings, shopping centres and recreational facilities with limited
numbers of people present. A further distinction is made between existing
situations and new situations. Existing situations refer to industries with a permit in force and current and future land-use that is in accordance with an approved zoning plan of the competent authorities. New situations refer to modifications of the environmental permit or modifications of the zoning plan.
For existing situations, no vulnerable objects are accepted in the area where the individual risk exceeds 10-6 per year. Problematic cases have to be resolved within terms defined in the Decree. This may either involve actions at the source (additional safety measures) or actions in the surroundings (removal of vulnerable objects). State funding is available for resolving urgent situations. Objects of limited vulnerability are undesirable in the area where the individual risk exceeds 10-6 per year. If objects of limited vulnerability are present within the IR 10-6 contour, significant effort should be made to improve the situation. As there is no formal obligation to resolve the situation, this process will
typically involve a debate between the operator and the competent authority on which additional safety provisions are reasonable and who will pay for it. If no agreement can be reached on additional safety measures at the source, safety measures at the target (people in the surroundings) sometimes provide a solution. An example of the latter is improved accessibility of the area for emergency response units and improvement of the means for people to reach a safe situation (early warning, shelter facilities, frequent training, et cetera). New situations cannot be approved if vulnerable objects are present in the area where the individual risk exceeds 10-6 per year (or if the zoning scheme allows vulnerable objects in this area). New situations where objects of limited vulnerability are present within the IR 10-6 contour, are highly undesirable and need to be accounted for and approved by the council of the competent authority.
2.3.2.2 Societal risk
The second parameter that is used to determine the acceptability of the presence of a company in relation to its surroundings is societal risk. Societal risk is assessed when industries desire a change in the environmental permit or when authorities desire a change in the zoning scheme for land-use. This assessment is referred to as ‘the duty to account for the societal risk’ ([13]) and involves a process in which stakeholders discuss the benefits of the development, the consequences for the society and options for risk reduction.
The stakeholders include: the permit-holder;
the competent authority, including the city council, the fire brigade, the land-use office and the environment office;
nearby industries which also handle, store or transport hazardous substances; representatives from the public (people that work or live near the facility); if relevant, real estate developers.