Disease burden of food-related pathogens
in the Netherlands, 2014
RIVM Letter report 2017-0061 M. Bouwknegt et al.
Colophon
© RIVM 2017
Parts of this publication may be reproduced, provided acknowledgement is given to: National Institute for Public Health and the Environment, along with the title and year of publication.
DOI 10.21945/RIVM-2017-0061
M. Bouwknegt (auteur), RIVM M.J. Mangen (auteur), RIVM I.H.M. Friesema (auteur), RIVM W. van Pelt (auteur), RIVM
Contact:
Martijn Bouwknegt
Centre for Zoonoses and Environmental Microbiology, Centre for Infectious Disease Control Netherlands, RIVM
martijn.bouwknegt@rivm.nl
This investigation has been performed by order and for the account of the Ministry of Public Health, welfare and Sports, within the framework of Programme 5
This is a publication of:
National Institute for Public Health and the Environment
P.O. Box 1 | 3720 BA Bilthoven The Netherlands
Synopsis
Disease burden of food-related pathogens in the Netherlands, 2014
The Ministry of VWS has requested RIVM to present an annual update on the number of illnesses caused by 14 enteric pathogens. These
pathogens can be transmitted by food, the environment, animals and humans. The number of persons who are ill and who die from the infections is expressed in DALYs (Disability Adjusted Life Years), a measure of the disease burden in the population. Furthermore, the cost-of-illness (COI) related to the 14 food-related pathogens were estimated and expressed in euros. The total disease burden caused by the 14 pathogens decreased from around 13,000 DALY in 2013 to 12,600 DALY in 2014. The share of foodborne transmission in this estimated burden was comparable to 2013, mounting to 5,900 DALY in 2014. Therewith, the burden estimates for 2013 and 214 ranked as lowest estimates since 2009, the first year of the burden estimates. The food-related COI decreased by 7 M€ compared to 2013, reaching a total of 165 M€ for 2014. The increase in burden, yet decrease in costs in the estimates is possibly related to the significant decrease in incidence of rotavirus infections, which display a relatively high cost-per case due to productivity losses.
The research presented in this report results in more insight in the true incidence of foodborne diseases and the associated disease burden and costs-of-illnesses and enables to monitor trend in time for these public health indicators.
Publiekssamenvatting
Ziektelast van via voedsel overdraagbare ziekteverwekkers in Nederland in 2014
Het RIVM onderzoekt jaarlijks hoeveel mensen ziek worden van 14 ziekteverwekkers die via voedsel in het menselijk lichaam terechtkomen (darmpathogenen). Deze ziektelast wordt uitgedrukt in DALY’s
(Disability Adjusted Life Year), een internationaal gehanteerde maat voor het aantal gezonde levensjaren die verloren gaan aan ziekte of overlijden. Het aantal verloren DALY’s als gevolg van de 14
ziekteverwekkers is in 2014 geschat op 5900, en is daarmee vergelijkbaar met de schatting voor 2013 (5.800 DALY’s).
Daarnaast wordt geschat welke kosten hieraan verbonden zijn (cost of illness). Deze omvatten directe medische kosten, maar ook de kosten van patient en/of zijn familie, zoals reiskosten, en de kosten binnen andere sectoren, bijvoorbeeld door werkverzuim. De gerelateerde kosten van de 14 ziekteverwekkers die mensen via voedsel opliepen daalde met 4% van 172 miljoen euro in 2013 naar 165 miljoen euro in 2014.
De onderzochte ziekteverwekkers kunnen niet alleen via voedsel aan de mens worden overgedragen (circa 40 procent), maar ook via het milieu (bijvoorbeeld via oppervlaktewater), dieren, en van mens op mens. De verhouding verschilt per ziekteverwekker. De totale ziektelast van alle ‘routes’ daalde van ongeveer 13.000 DALY in 2013 naar 12.600 DALY in 2014. De totale kosten werden geschat op 379 miljoen euro en waren daarmee lager dan voorgaande jaren. Een belangrijke oorzaak hiervan is een halvering van aantal rotainfecties ten opzichte van 2013.
VWS is opdrachtgever van dit onderzoek. De resultaten bieden handvatten om meer zicht te krijgen op het daadwerkelijke aantal voedselinfecties dat mensen jaarlijks oplopen en de bijbehorende ziektelast.
Kernwoorden: voedsel-gerelateerde ziekte, ziektelast, DALY, kosten, trend
Contents
1 Introduction — 9 2 Methods — 11 2.1 Trend information — 11 2.2 Model updates — 12 2.3 Disease burden — 12 2.4 Cost of illness — 12 3 Results — 13 3.1 Trend information — 13 3.2 Disease incidence — 143.3 Disease burden by pathogen — 14 3.4 Cost of illness by pathogen — 14 3.5 Attribution — 14
4 Discussion — 17
1
Introduction
Since 2008, RIVM regularly publishes estimates of the incidence, disease burden and costs-of-illnesses of food-related disease on its web pages in publicly available reports [1-5]. Furthermore the website
https://www.volksgezondheidenzorg.info/ launched in 2014, combines multiple information sources in a single website. The estimates from 2013 onwards will be integrated in this website as of 2016.
The epidemiological estimates of the disease burden are expressed in Disability Adjusted Life Years (DALY). The methodology for these estimates is described in detail in a peer-reviewed paper [1]. The economic burden estimates, the cost-of-illness (COI) expressed in euros, were finalized for all 14 food-related pathogens for the year 2011 [6]. In the current report, trend information from surveillance,
demographic information and consumer price index (a measure for changes in price levels of consumer goods and services) was used to update the information to the year 2014.
2
Methods
2.1 Trend information
Data on the size and age distribution of the Dutch population, as well as mortality risks and the number of live births and stillbirths were
obtained from Statistics Netherlands1.
Trend information on the incidence of gastro-enteritis (GE) by pathogen in the general population and consulting the general practitioner was obtained from the following sources:
• Thermophilic Campylobacter spp.: RIVM laboratory surveillance • Non-typhoidal Salmonella spp.: RIVM laboratory surveillance • Norovirus: hospitalisation for viral gastro-enteritis (ICD code 86) • Rotavirus: RIVM laboratory surveillance,
• Hepatitis A, and perinatal and acquired listeriosis: RIVM-OSIRIS, mandatory notification and active surveillance.
• Cryptosporidium spp.: a stable incidence since 2003 was assumed, based on laboratory surveillance data from 2001 to 2007.
• Giardia spp.: a continuing decrease with the rate of -1.03% per year observed between 2001 and 2007 was assumed
• No trend information was available for the GE toxin-producing bacteria (Bacillus cereus, Clostridium perfringens and
Staphylococcus aureus), hepatitis-E, toxoplasmosis and gastroenteritis due to Shiga-toxin producing Escherichia coli O157 (STEC O157)). For the latter, trends in reported fatalities are included.
Trends in hospitalizations for gastro-enteritis as primary cause (ICD codes 20-93; 558.9) were obtained from the National Medical Register up until 2010. From 2011 onwards these data were obtained from Dutch Hospital Data (DHD). Estimates for the number of hospitalized patients were obtained by extrapolation, using the 10-year relationship of the number of hospitalized patients and time series from the laboratory surveillance (primarily tested faeces, but in part (<18 years) rotavirus). Using this method on data for earlier years showed similar estimates for the number and age-distribution of hospitalized GE-patients.
Data on norovirus surveillance was based on ICD9 codes until 2012, and based on ICD10 codes from 2012 onwards. This lead to an increased incidence rate per 100,000 of 27.1 compared to 19.7 for 2012 and 37.6 compared to 18.6 for 2013. The baseline incidence rate (i.e., for 1999) was based on ICD9-codes, so straightforward inclusion of the new incidence rates in the update would likely lead to a trend break in methodology used. However, with ICD10 codes, GE cases are expected to be better distinguished and reported, and thus to lead to a more accurate incidence estimate. Yet, for comparison of trends in annual foodborne DALY estimates with earlier years a comparable methodology is needed. Therefore, we used the ICD9 and ICD10 estimates for 2012
and 2013 to estimate the proportional increase due to the new reporting system. Based on ICD9 3293 (2012) and 3132 (2013) cases were reported, based on ICD10 4534 (2012) and 6328 (2013). The proportional increase thus mounted to
(3293+3132)/(4534+6328)=1.69. The incidence rate for 2014 was subsequently divided by this number.
Excess mortality risks from campylobacteriosis and salmonellosis were assumed constant across the years. Fatalities due to listeriosis and STEC O157 were obtained from active surveillance. Age-specific case fatality ratios for norovirus and rotavirus, originally obtained from German surveillance data, and for protozoan pathogens, originally obtained from the international literature, were assumed constant throughout the years (changes in years of life lost therefore reflect changes in incidence on which mortality is based).
2.2 Model updates
The model was not changed since the 2013-update. 2.3 Disease burden
The method for DALY calculations was not changed compared to previous years.
2.4 Cost of illness
Cost-of-illness calculations were not changed compared to previous years (i.e. 2012 and 2011), only the cost prices used for the different resources had to be updated to 2014 euros using consumer price indexes as provided by Statistics Netherlands2. In order to allow
comparison with earlier results we also updated the earlier cost-of-illness estimates (i.e., 2011, 2012 and 2013) to 2014 euros; hence all differences in the results for the year 2014 compared to earlier years will reflect the impact of trends in the underlying information on demographics and pathogen incidence.
2
http://statline.cbs.nl/Statweb/publication/?DM=SLNL&PA=71311NED&D1=0&D2=0&D3=142,155,168,181,194, 219,232,245,258&HDR=T&STB=G1,G2&VW=T, accessed January 26th, 2016
3
Results
3.1 Trend information
Trend information for specific pathogens is presented in Table 3. A summary of trends (in comparison with 2013) is discussed below:
• The incidence of campylobacteriosis (laboratory confirmed cases) decreased from 48.0 to 47.5 cases per 100,000
inhabitants, showing a continuously decreasing trend since 2011 (with an incidence of 51.3 per 100,000 population in 2011) • The incidence of salmonellosis (laboratory confirmed cases)
remained similar to 2013 with 9.2 per 100,000 inhabitants. The reported incidence rate for 2013 and 2014 were the lowest since 1999 (21.1 per 100,000; the former lowest reported incidence rate was 11.6 per 100,000 in 2009).
• The incidence of gastroenteritis by rotavirus (laboratory confirmed cases) decreased markedly by nearly 60% from 23.3 to 9.6 cases per 100,000 inhabitants, reaching the lowest level in the period 1999-2014. The former lowest incidence estimate stemmed from 2004, with 15.4 per 100,000.
• The incidence of hospitalizations for viral gastroenteritis (a proxy for the incidence of gastroenteritis by norovirus) decreased from 37.6 to 31.1 cases per 100,000 inhabitants. Note that the estimated incidence based on hospitalizations for viral
gastroenteritis increased markedly from 19.7 and 18.6 in 2012 and 2013, respectively, to 27.1 (2012) and 37.6 (2013), due to the altered registration system (using ICD10-codes instead of ICD9).
• The incidence of acquired listeriosis (active surveillance) increased from 76 cases in 2013 to 92 cases in 2014. There were 9 recorded fatalities, similar to the 8 and 7 fatalities in 2012 and 2013, respectively. The statistical life expectancy of fatal cases was 13.6 years; in the DALY model half of this life expectancy is used for calculating years of life lost to correct for comorbidity. Including new data from 2013, the probability of developing meningitis as a consequence of acquired listeriosis was updated from 25% to 24% (95% confidence interval 20-28%).
• The incidence of perinatal listeriosis (active surveillance) was 4 cases with 2 fatalities. The number of perinatal cases and
mortality were similar to previous years.
• The incidence of diseases caused by STEC O157 (active surveillance) was 79 with 31 hospitalizations (of 71 cases for which this information is known). The number of STEC O157 cases, including the number of hospitalized cases, was similar to the previous two years, but higher than the years before. There were no fatal cases recorded. The incidence of HUS cases was 3 in 2014, being lower than the 7 cases in 2013, but
comparable to the years before that.
• The incidence of hepatitis A (notified cases) decreased compared to the previous three years; the incidence was the lowest among the recorded incidences for the years 2006-2014.
The number of hospitalizations, likewise decreased, with the proportion of hospitalized patients being 22% (compared to 27.5% in 2013).
• The number of recorded hospitalizations for gastroenteritis decreased by about 2,000 to 21,345 in 2014.
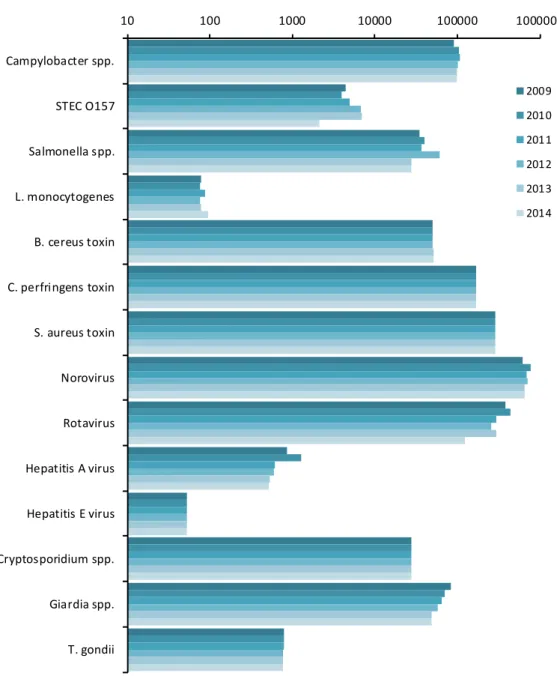
3.2 Disease incidence
The incidence of gastroenteritis by pathogen, of disease by non-gastrointestinal pathogens and of sequelae by pathogen in 2014 is presented in Tables 4-7, and Figure 1. Overall there were no marked increases in incidence compared to 2013, with relatively slight decreases in incidence for Salmonella spp. and Campylobacter spp. and stable similar incidences for the other pathogens except for the increase in acquired listeriosis. The estimated total number of foodborne cases due to the 14 pathogens decreased by approximately 180,000 to 1,500,000 in 2014 compared to 2013. The total number of deaths due to foodborne diseases was estimated at 215 (in 2013 this was 236). The incidence of sequelae was similar between 2013 and 2014 (Table 6).
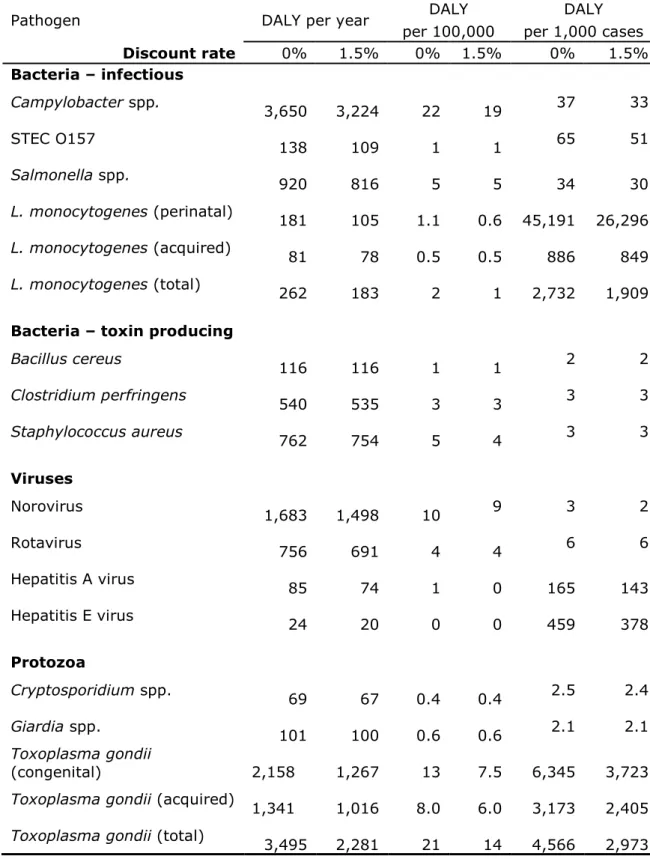
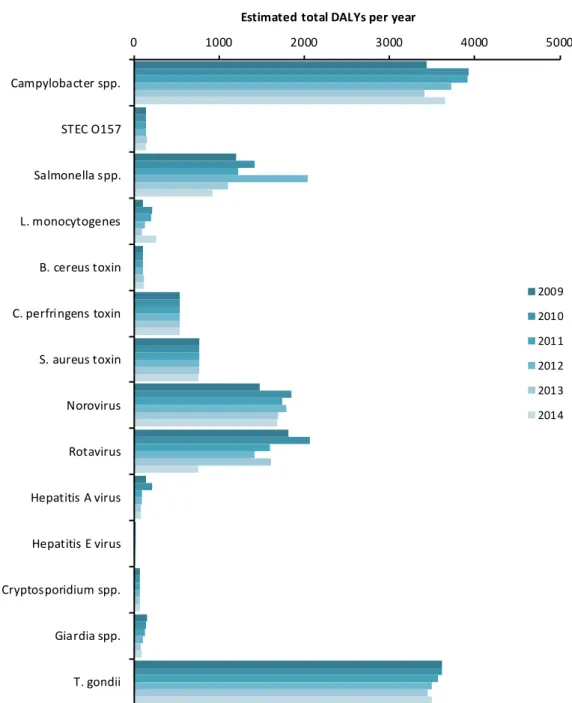
3.3 Disease burden by pathogen
The burden by pathogen is presented in Table 7 and Figure 2. The total burden of the 14 pathogens decreased by 600 DALY from 13,200 DALY in 2013 to 12,600 DALY in 2014. Predominant changes compared to 2013 were for Campylobacter (+240 DALY), L. monocytogenes (+170 DALY), Salmonella (-180 DALY) and rotavirus (-850 DALY). The largest burden at population level was caused by Toxoplasma gondii and Campylobacter (both ~3,500 DALY), followed by norovirus (~1,700 DALY). Perinatal listeriosis was the disease outcome with the highest individual burden among all pathogens (45 DALY per case), followed by congenital toxoplasmosis (6.3 DALY per case).
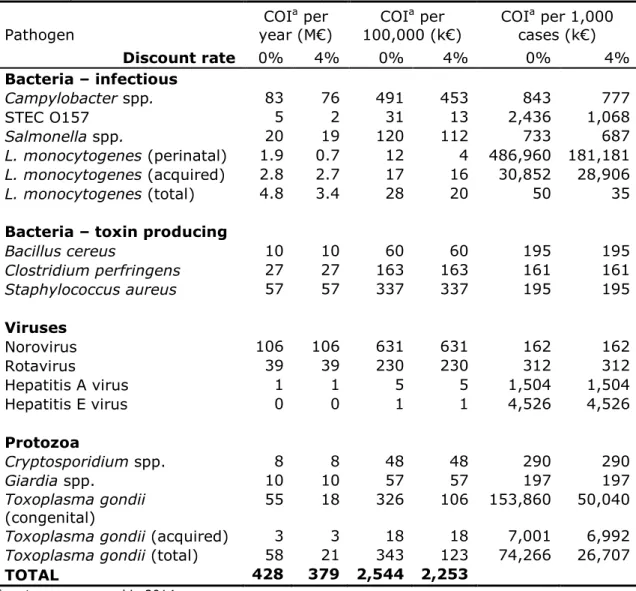
3.4 Cost of illness by pathogen
The total COI was 45 M€ lower in 2014 compared to 2013 and was estimated at 379 M€ (discounted at 4%) (Table 8). The three pathogens causing the largest discounted COI are norovirus (106 M€),
Campylobacter spp. (76 M€) and S. aureus (58 M€). The lowest
contribution to the COI was by hepatitis E-virus (0.2 M€). The average cost per case were largest for perinatal Listeria (0.2 M€, discounted), followed by congenital Toxoplasma gondii infections (0.05 M€,
discounted). The trends in COI compared to 2013 followed the trends in DALYs.
3.5 Attribution
The attribution results for DALYs and COI are presented in Tables 9 and 10. The foodborne disease burden increased by 100 DALY from 5,800 DALY in 2013 to approximately 5,900 DALY in 2014. Fifty-five percent of the foodborne burden was associated with meat (pork 21%, poultry 18% and beef & lamb 16%). These foods caused 30% of all food-related cases, indicating that the pathogens associated with these foods tend to cause more severe infections than pathogens associated with other foods.
The total food-related COI decreased by 4% from 172 M€ to 165 M€. Approximately 45% of the COI was associated with meat and 50% with foods of animal origin.
4
Discussion
The estimated disease burden of 14 enteric pathogens in 2014 is lower by about 600 DALYs to 12,600 compared to 2013, continuing the
decrease since 2012. The share of foodborne transmission in this burden increased by 100 DALY from 5,800 to 5,900 DALY. These estimates are the lowest since 2009, the first year in which the burden for all 14 pathogens was estimated. The overall COI estimates decreased by 45 M€ to 379 (discounted at 4%), and the foodborne COI decreased by approximately 7 M€ to ~165 M€ compared to 2013. The decrease in costs was a result of lower incidences for predominantly rotavirus in 2014 compared to 2013. A range of hypotheses has been proposed to explain this unprecedented low rotavirus year, amongst them the very mild winter of 2014 and vaccination in neighbouring countries (12). 2015, however, reached normal levels of rotavirus infections as before, while the very mild winter of 2016 shows even lower levels of rotavirus infection than in 2014. These data will be shown in the next update of the burden estimates.
For several pathogens, no trend information is currently used, and changes in trend then reflect changes in the population structure that are however small from year to year. This statement holds for STEC O157, the toxin producers, hepatitis E virus and Toxoplasma gondii. Furthermore, trends for Cryptosporidium spp. and Giardia spp. are extrapolated from trends until 2007, when systematic surveillance was discontinued. Furthermore, attribution data used in this report are based on an expert elicitation study, conducted in 2006 [8]. No time-trends in the expert estimates are available. As a consequence, the changes in incidence and burden as presented in this report for these pathogens need to be interpreted with appropriate restrictions and care.
In the past years several surveillance and registration systems have been started, have been changed or were available but not used, including for STEC O157, hepatitis E virus, norovirus and
Cryptosporidium. In 2016, approaches to include trend updates for these pathogens will be examined and applied if deemed feasible. Estimates for previous years will be recalculated where possible given the available data, to enable proper trend assessments.
References
1. Havelaar AH, Haagsma JA, Mangen MJJ, Kemmeren JM, Verhoef LP, Vijgen SM, et al. Disease burden of foodborne pathogens in the Netherlands, 2009. Int J Food Microbiol. 2012;156(3):231-8. 2. Havelaar AH, Friesema IHM, Van Pelt W. Disease burden of
food-related pathogens in the Netherlands, 2010. Bilthoven, the Netherlands: National Institute for Public Health and the Environment, 2012 Contract No.: 330331004/2012.
3. Bouwknegt M, Friesema IHM, Van Pelt W, Havelaar AH. Disease burden of food-related pathogens in the Netherlands, 2011.
Bilthoven, the Netherlands: National Institute for Public Health and the Environment, 2013 Contract No.: 330331006/2013.
4. Bouwknegt M, Mangen MJJ, Friesema IHM, Van Pelt W, Havelaar AH. Disease burden of food-related pathogens in the Netherlands, 2012. Bilthoven, the Netherlands: National Institute for Public Health and the Environment, 2014 Contract No.: 2014-0069.
5. Bouwknegt M, Mangen MJJ, Friesema IHM, Van Pelt W, Havelaar AH. Disease burden of food-related pathogens in the Netherlands, 2013. Bilthoven, the Netherlands: National Institute for Public Health and the Environment, In press Contract No.: 2015-0115.
6. Mangen MJJ, Bouwknegt M, Friesema IHM, Kortbeek LM, Van Pelt W, Havelaar AH. Disease burden and cost-of-illness of food-related pathogens in the Netherlands. Bilthoven: National Institute for Public Health and the Environment, 2013 330331007 Contract No.: 330331007/2013.
7. Hald T, Aspinall W, Devleesschauwer B, Cooke R, Corrigan T, Havelaar AH, et al. World Health Organization 1 estimates of the relative contributions of food to the burden of disease due to selected foodborne hazards: a structured expert elicitation. PLoS One. In press.
8. Havelaar AH, Van Duynhoven YT, Nauta MJ, Bouwknegt M,
Heuvelink AE, De Wit GA, et al. Disease burden in The Netherlands due to infections with Shiga toxin-producing Escherichia coli O157. Epidemiology and infection. 2004;132(3):467-84.
9. Tariq L, Haagsma J, Havelaar A. Cost of illness and disease burden in The Netherlands due to infections with Shiga toxin-producing Escherichia coli O157. Journal of food protection. 2011;74(4):545-52.
10. Fournet N, Deege MP, Urbanus AT, Nichols G, Rosner BM, Chalmers RM, et al. Simultaneous increase of Cryptosporidium infections in the Netherlands, the United Kingdom and Germany in late summer season, 2012. Euro surveillance : bulletin Europeen sur les maladies transmissibles = European communicable disease bulletin.
2013;18(2).
11. Havelaar AH, Galindo AV, Kurowicka D, Cooke RM. Attribution of foodborne pathogens using structured expert elicitation. Foodborne pathogens and disease. 2008;5(5):649-59.
12. Hahné S, Hooiveld M, Vennema H, Van Ginkel A, De Melker H, Wallinga J, Van Pelt W, Bruijning-Verhagen P. Exceptionally low rotavirus incidence in the Netherlands in 2013/14 in the absence of rotavirus vaccination. Eurosurveillance 19(43); pii=20945.
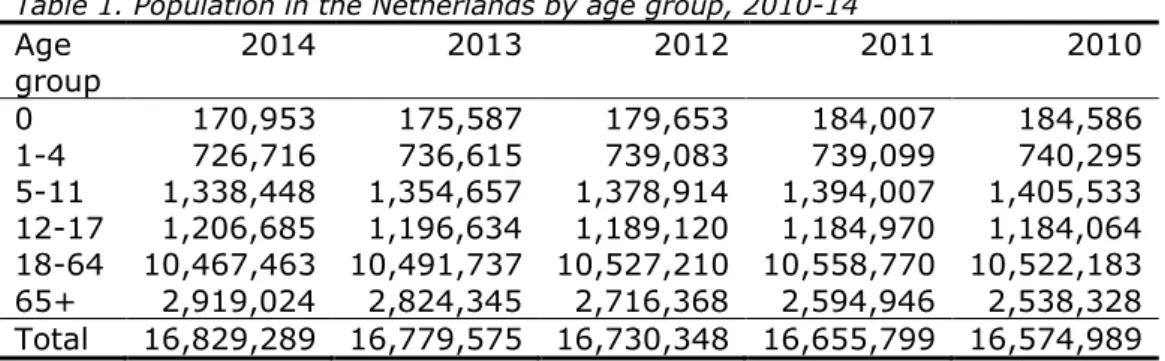
Table 1. Population in the Netherlands by age group, 2010-14 Age group 2014 2013 2012 2011 2010 0 170,953 175,587 179,653 184,007 184,586 1-4 726,716 736,615 739,083 739,099 740,295 5-11 1,338,448 1,354,657 1,378,914 1,394,007 1,405,533 12-17 1,206,685 1,196,634 1,189,120 1,184,970 1,184,064 18-64 10,467,463 10,491,737 10,527,210 10,558,770 10,522,183 65+ 2,919,024 2,824,345 2,716,368 2,594,946 2,538,328 Total 16,829,289 16,779,575 16,730,348 16,655,799 16,574,989
Table 2. Live births by age of mothers in the Netherlands, 2009-14
Age of mother 2014 2013 2012 2011 2010 2009 -19 1,276 1,750 1,592 1,717 1,884 1,953 20-24 14,213 15,190 15,206 15,782 16,417 16,499 25-29 50,307 46,616 50,371 50,295 51,570 51,459 30-34 68,120 65,651 67,489 69,174 69,420 68,828 35-39 33,797 35,489 33,725 35,340 37,213 38,637 40-44 7,046 6,378 7,212 7,393 7,565 7,252 45+ 422 267 364 359 328 287 Total 175,181 171,341 175,959 180,060 184,397 184,915
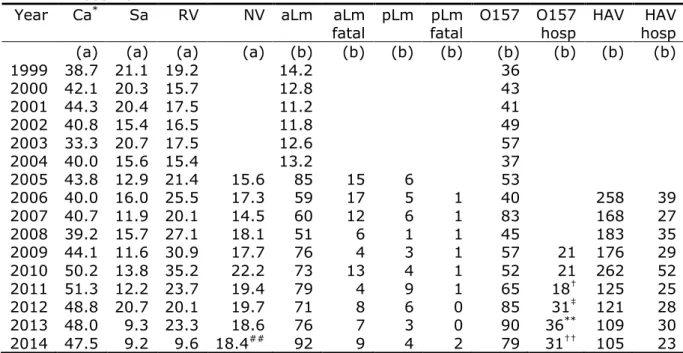
Table 3. Trends in incidence per 100,000 population of food-related pathogens, 1999-2014
Year Ca* Sa RV NV aLm aLm
fatal pLm pLm fatal O157 O157 hosp HAV HAV hosp (a) (a) (a) (a) (b) (b) (b) (b) (b) (b) (b) (b)
1999 38.7 21.1 19.2 14.2 36 2000 42.1 20.3 15.7 12.8 43 2001 44.3 20.4 17.5 11.2 41 2002 40.8 15.4 16.5 11.8 49 2003 33.3 20.7 17.5 12.6 57 2004 40.0 15.6 15.4 13.2 37 2005 43.8 12.9 21.4 15.6 85 15 6 53 2006 40.0 16.0 25.5 17.3 59 17 5 1 40 258 39 2007 40.7 11.9 20.1 14.5 60 12 6 1 83 168 27 2008 39.2 15.7 27.1 18.1 51 6 1 1 45 183 35 2009 44.1 11.6 30.9 17.7 76 4 3 1 57 21 176 29 2010 50.2 13.8 35.2 22.2 73 13 4 1 52 21 262 52 2011 51.3 12.2 23.7 19.4 79 4 9 1 65 18† 125 25 2012 48.8 20.7 20.1 19.7 71 8 6 0 85 31‡ 121 28 2013 48.0 9.3 23.3 18.6 76 7 3 0 90 36** 109 30 2014 47.5 9.2 9.6 18.4## 92 9 4 2 79 31†† 105 23
Data sources: see text; * Ca: Campylobacter spp.; Sa: Salmonella spp.; RV: rotavirus;
NV: norovirus; aLm: acquired listeriosis; pLm: perinatal listeriosis; O157: STEC O157; HAV: hepatitis A-virus; hosp: hospitalized; † known for 57 of the 65 cases; ‡ known for 77
of the 85 cases; ** known for 84 of the 90 cases;†† known for 71 of the 79 cases; (a) per
100,000 inhabitants; (b) reported cases; ‡‡ based on ICD10 codes instead of ICD9 and not directly comparable to numbers from before 2012
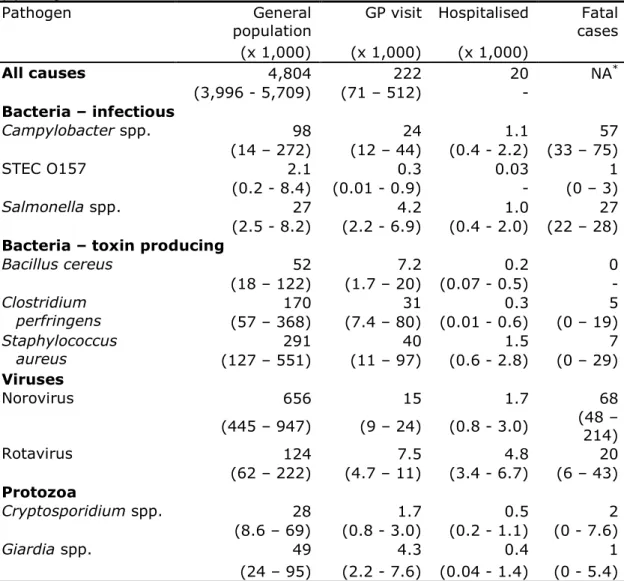
Table 4. Mean incidence and 95% interval (between brackets) of gastroenteritis by pathogen in the Netherlands, 2014
Pathogen General
population GP visit Hospitalised cases Fatal (x 1,000) (x 1,000) (x 1,000) All causes 4,804 222 20 NA* (3,996 - 5,709) (71 – 512) - Bacteria – infectious Campylobacter spp. 98 24 1.1 57 (14 – 272) (12 – 44) (0.4 - 2.2) (33 – 75) STEC O157 2.1 0.3 0.03 1 (0.2 - 8.4) (0.01 - 0.9) - (0 – 3) Salmonella spp. 27 4.2 1.0 27 (2.5 - 8.2) (2.2 - 6.9) (0.4 - 2.0) (22 – 28) Bacteria – toxin producing
Bacillus cereus 52 7.2 0.2 0 (18 – 122) (1.7 – 20) (0.07 - 0.5) - Clostridium perfringens (57 – 368) 170 (7.4 – 80) (0.01 - 0.6) 31 0.3 (0 – 19) 5 Staphylococcus aureus (127 – 551) 291 (11 – 97) 40 (0.6 - 2.8) 1.5 (0 – 29) 7 Viruses Norovirus 656 15 1.7 68 (445 – 947) (9 – 24) (0.8 - 3.0) (48 – 214) Rotavirus 124 7.5 4.8 20 (62 – 222) (4.7 – 11) (3.4 - 6.7) (6 – 43) Protozoa Cryptosporidium spp. 28 1.7 0.5 2 (8.6 – 69) (0.8 - 3.0) (0.2 - 1.1) (0 - 7.6) Giardia spp. 49 4.3 0.4 1 (24 – 95) (2.2 - 7.6) (0.04 - 1.4) (0 - 5.4) * not available
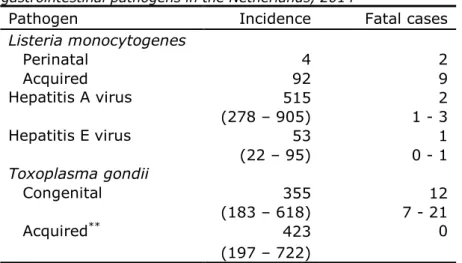
Table 5. Mean incidence and 95% interval (between brackets) of non-gastrointestinal pathogens in the Netherlands, 2014
Pathogen Incidence Fatal cases
Listeria monocytogenes Perinatal 4 2 Acquired 92 9 Hepatitis A virus 515 2 (278 – 905) 1 - 3 Hepatitis E virus 53 1 (22 – 95) 0 - 1 Toxoplasma gondii Congenital 355 12 (183 – 618) 7 - 21 Acquired** 423 0 (197 – 722)
* No uncertainty because Listeria cases were acquired through active surveillance; ** chorioretinitis only
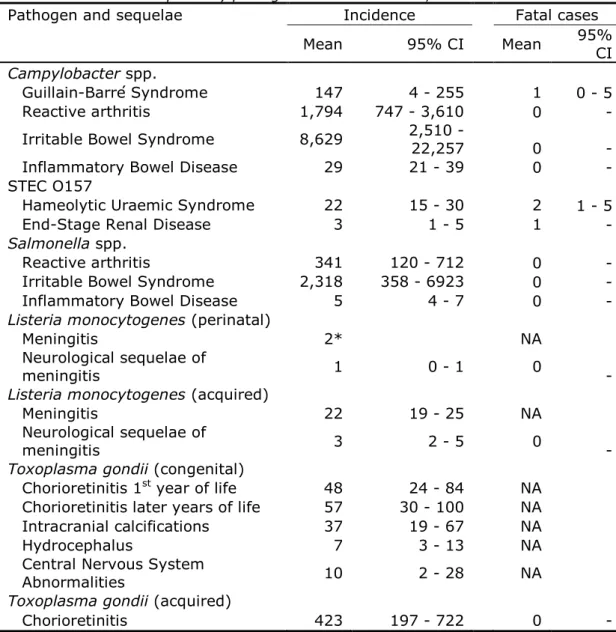
Table 6. Incidence of sequelae by pathogen in the Netherlands, 2014
Pathogen and sequelae Incidence Fatal cases
Mean 95% CI Mean 95% CI
Campylobacter spp.
Guillain-Barré Syndrome 147 4 - 255 1 0 - 5
Reactive arthritis 1,794 747 - 3,610 0 -
Irritable Bowel Syndrome 8,629 2,510 - 22,257 0 -
Inflammatory Bowel Disease 29 21 - 39 0 -
STEC O157
Hameolytic Uraemic Syndrome 22 15 - 30 2 1 - 5
End-Stage Renal Disease 3 1 - 5 1 -
Salmonella spp.
Reactive arthritis 341 120 - 712 0 -
Irritable Bowel Syndrome 2,318 358 - 6923 0 -
Inflammatory Bowel Disease 5 4 - 7 0 -
Listeria monocytogenes (perinatal)
Meningitis 2* NA
Neurological sequelae of
meningitis 1 0 - 1 0 -
Listeria monocytogenes (acquired)
Meningitis 22 19 - 25 NA
Neurological sequelae of
meningitis 3 2 - 5 0 -
Toxoplasma gondii (congenital)
Chorioretinitis 1st year of life 48
24 - 84 NA Chorioretinitis later years of life 57 30 - 100 NA Intracranial calcifications 37 19 - 67 NA
Hydrocephalus 7 3 - 13 NA
Central Nervous System
Abnormalities 10 2 - 28 NA
Toxoplasma gondii (acquired)
Chorioretinitis 423 197 - 722 0 -
† mean; ‡ 2.5-97.5 percentile; * no uncertainty because cases were acquired through active
Table 7. Estimated total DALY, DALY per 100,000 inhabitants and mean DALY per case of illness in the Netherlands, 2014
Pathogen DALY per year DALY DALY
per 100,000 per 1,000 cases Discount rate 0% 1.5% 0% 1.5% 0% 1.5% Bacteria – infectious Campylobacter spp. 3,650 3,224 22 19 37 33 STEC O157 138 109 1 1 65 51 Salmonella spp. 920 816 5 5 34 30 L. monocytogenes (perinatal) 181 105 1.1 0.6 45,191 26,296 L. monocytogenes (acquired) 81 78 0.5 0.5 886 849 L. monocytogenes (total) 262 183 2 1 2,732 1,909 Bacteria – toxin producing Bacillus cereus 116 116 1 1 2 2 Clostridium perfringens 540 535 3 3 3 3 Staphylococcus aureus 762 754 5 4 3 3 Viruses Norovirus 1,683 1,498 10 9 3 2 Rotavirus 756 691 4 4 6 6 Hepatitis A virus 85 74 1 0 165 143 Hepatitis E virus 24 20 0 0 459 378 Protozoa Cryptosporidium spp. 69 67 0.4 0.4 2.5 2.4 Giardia spp. 101 100 0.6 0.6 2.1 2.1 Toxoplasma gondii (congenital) 2,158 1,267 13 7.5 6,345 3,723 Toxoplasma gondii (acquired) 1,341 1,016 8.0 6.0 3,173 2,405 Toxoplasma gondii (total) 3,495 2,281 21 14 4,566 2,973
Table 8. Estimated total costs of illness (COI), COI per 100,000 inhabitants and mean COI per case of illness in the Netherlands, 2014
Pathogen COI a per year (M€) COI a per 100,000 (k€) COI a per 1,000 cases (k€) Discount rate 0% 4% 0% 4% 0% 4% Bacteria – infectious Campylobacter spp. 83 76 491 453 843 777 STEC O157 5 2 31 13 2,436 1,068 Salmonella spp. 20 19 120 112 733 687 L. monocytogenes (perinatal) 1.9 0.7 12 4 486,960 181,181 L. monocytogenes (acquired) 2.8 2.7 17 16 30,852 28,906 L. monocytogenes (total) 4.8 3.4 28 20 50 35 Bacteria – toxin producing
Bacillus cereus 10 10 60 60 195 195 Clostridium perfringens 27 27 163 163 161 161 Staphylococcus aureus 57 57 337 337 195 195 Viruses Norovirus 106 106 631 631 162 162 Rotavirus 39 39 230 230 312 312 Hepatitis A virus 1 1 5 5 1,504 1,504 Hepatitis E virus 0 0 1 1 4,526 4,526 Protozoa Cryptosporidium spp. 8 8 48 48 290 290 Giardia spp. 10 10 57 57 197 197 Toxoplasma gondii (congenital) 55 18 326 106 153,860 50,040
Toxoplasma gondii (acquired) 3 3 18 18 7,001 6,992 Toxoplasma gondii (total) 58 21 343 123 74,266 26,707
TOTAL 428 379 2,544 2,253
Netherlands, 2014
Main pathway Food Environment Human Animal Travel Total
Incidence (per year) 646,364 172,657 482,160 77,655 118,597 1,497,433
Deaths (per year) 80 36 58 20 23 215
Disease burden (DALY) 5,892 2,644 1,855 1,071 1,140 12,602
Disease burden (DALY,
discounted) 4,860 2,052 1,656 927 973 10,468
Cost of illness (M€,
undiscounted)a 192 71 98 31 37 428
Cost of illness (M€, discounted at
4%)a 165 55 97 28 34 379
* due to the 14 pathogens included in this study a costs are expressed in 2014 euros
Netherlands, 2014
Food group Beef & Lamb Pork Poultry Eggs Dairy shellfish Produce Beverages Grains Fish & Other foods
Humans &
animals Total Incidence (per year) 105,585 43,901 59,384 21,127 54,264 50,817 34,429 14,799 39,332 120,279 102,447 646,364
Deaths (per year) 8.9 8.9 17 4.8 6.8 6.9 5.3 1.8 3.0 5.2 11 80
Disease burden (DALY) 922 1,263 1,105 212 441 374 344 89 172 447 525 5,892
Disease burden (DALY,
discounted) 737 897 962 190 374 316 282 80 159 414 448 4,860
Cost of illness (M€,
undiscounted)a 29 27 29 6.7 16 13 11 3.6 8.7 25 23 192
Cost of illness (M€, discounted
at 4%) a 23 16 26 6.4 14 12 9 3.5 8.5 25 21 165
* due to the 14 pathogens included in this study a costs are expressed in 2014 euros
Figure 1. Comparison of incidence of food-related pathogens in 2009 through 2014. 10 100 1000 10000 100000 1000000 Campylobacter spp. STEC O157 Salmonella spp. L. monocytogenes B. cereus toxin C. perfringens toxin S. aureus toxin Norovirus Rotavirus Hepatitis A virus Hepatitis E virus Cryptosporidium spp. Giardia spp. T. gondii
Estimated total number of cases per year
2009 2010 2011 2012 2013 2014
Figure 2. Comparison of disease burden of food-related pathogens in 2009 through 2014. 0 1000 2000 3000 4000 5000 Campylobacter spp. STEC O157 Salmonella spp. L. monocytogenes B. cereus toxin C. perfringens toxin S. aureus toxin Norovirus Rotavirus Hepatitis A virus Hepatitis E virus Cryptosporidium spp. Giardia spp. T. gondii
Estimated total DALYs per year
2009 2010 2011 2012 2013 2014
Annex. Detailed results
Summary of results
Pathogen Incidence (per year) Deaths (per year) Disease burden (DALY) Costs (M€ per jaar) Disc. 0% Disc. 4% Campylobacter 98,091 57 3,650 83 76 STEC O157 2,123 4 138 5 2 L. monocytogenes 96 11 262 5 3 Salmonella 27,475 27 920 20 19 B. cereus toxine 51,604 0 116 10 10 C. perfringens toxine 170,286 5 540 27 27 S. aureus toxine 290,782 7 762 57 57 Hepatitis-A virus 514 2 85 1 1 Hepatitis-E virus 53 1 24 0.2 0.2 Norovirus 655,580 68 1,683 106 106 Rotavirus 123,945 20 756 39 39 C. parvum 27,583 2 69 8 8 G. lamblia 48,524 1 101 10 10 T. gondii 777 12 3,495 58 21 Totaal 1,497,433 215 12,602 428 379
Pathogen Food Environment Human Animal Travel Total Campylobacter 41.198 20.207 6.180 18.735 11.771 98.091 STEC O157 858 365 217 435 248 2.123 L. monocytogenes 66 6 5 5 13 96 Salmonella 14.974 3.544 2.555 2.528 3.874 27.475 B. cereus toxine 46.082 568 619 568 3.767 51.604 C. perfringens toxine 153.938 3.746 3.576 3.576 5.449 170.286 S. aureus toxine 253.562 10.468 9.305 6.397 11.050 290.782 Hepatitis-A virus 59 57 94 0 305 514 Hepatitis-E virus 7 13 4 6 23 53 Norovirus 109.482 93.092 363.191 32.779 57.035 655.580 Rotavirus 16.113 21.071 72.012 3.718 11.031 123.945 C. parvum 3.282 7.641 7.558 3.696 5.406 27.583 G. lamblia 6.308 11.597 16.838 5.192 8.589 48.524 T. gondii 434 281 7 19 36 777 Total 646.364 172.657 482.160 77.655 118.597 1.497.433
Pathogen Food Environment Human Animal Travel Totaal Campylobacter 24,0 11,8 3,6 10,9 6,9 57,2 STEC O157 1,6 0,7 0,4 0,8 0,5 4,0 L. monocytogenes 7,6 0,7 0,6 0,6 1,5 11,0 Salmonella 14,5 3,4 2,5 2,4 3,7 26,6 B. cereus toxine 0,0 0,0 0,0 0,0 0,0 0,0 C. perfringens toxine 4,1 0,1 0,1 0,1 0,1 4,6 S. aureus toxine 6,3 0,3 0,2 0,2 0,3 7,2 Hepatitis-A virus 0,2 0,2 0,3 0,0 1,0 1,6 Hepatitis-E virus 0,1 0,2 0,0 0,1 0,3 0,6 Norovirus 11,3 9,6 37,4 3,4 5,9 67,5 Rotavirus 2,6 3,3 11,4 0,6 1,8 19,7 C. parvum 0,2 0,5 0,5 0,2 0,3 1,7 G. lamblia 0,2 0,3 0,5 0,1 0,2 1,4 T. gondii 6,9 4,5 0,1 0,3 0,6 12,4 Total 79,5 35,6 57,6 19,8 23,0 215,5
Pathogen Food Environment Human Animal Travel Total Campylobacter 1.533 752 230 697 438 3.650 STEC O157 56 24 14 28 16 138 L. monocytogenes 181 18 14 14 35 262 Salmonella 502 119 86 85 130 920 B. cereus toxine 104 1 1 1 8 116 C. perfringens toxine 488 12 11 11 17 540 S. aureus toxine 665 27 24 17 29 762 Hepatitis-A virus 10 9 15 0 50 85 Hepatitis-E virus 3 6 2 3 10 24 Norovirus 281 239 933 84 146 1.683 Rotavirus 98 129 439 23 67 756 C. parvum 8 19 19 9 13 69 G. lamblia 13 24 35 11 18 101 T. gondii 1.950 1.265 31 87 161 3.495 Total 5.892 2.644 1.855 1.071 1.140 12.602
Pathogen Food Environment Human Animal Travel Total Campylobacter 32.007 15.699 4.801 14.556 9.145 76.207 STEC O157 916 390 231 465 265 2.268 L. monocytogenes 2.340 227 179 183 453 3.382 Salmonella 10.289 2.435 1.756 1.737 2.662 18.878 B. cereus toxine 8.976 111 121 111 734 10.052 C. perfringens toxine 24.732 602 575 575 875 27.358 S. aureus toxine 49.490 2.043 1.816 1.249 2.157 56.754 Hepatitis-A virus 88 86 141 0 459 773 Hepatitis-E virus 33 60 18 26 103 239 Norovirus 17.731 15.076 58.819 5.309 9.237 106.172 Rotavirus 5.033 6.581 22.493 1.161 3.446 38.714 C. parvum 952 2.217 2.193 1.072 1.568 8.002 G. lamblia 1.245 2.289 3.323 1.025 1.695 9.577 T. gondii 11.586 7.516 187 519 955 20.764 Total 165.418 55.331 96.652 27.985 33.753 379.139
Pathogen Beef & Lamb Pork Poultry Eggs Dairy shellfish Produce Beverages Grains Fish & Other foods Humans & animals Total Campylobacter 1.689 2.101 22.206 1.277 3.667 2.884 2.184 700 948 1.360 2.184 41.198 STEC O157 378 55 27 18 63 25 61 31 25 30 145 858 L. monocytogenes 7 6 4 3 16 12 5 2 4 4 3 66 Salmonella 1.887 2.141 2.216 3.324 988 614 943 464 644 898 853 14.974 B. cereus toxine 3.318 1.613 737 1.659 2.673 922 922 783 7.788 24.562 1.106 46.082 C. perfringens toxine 73.583 12.931 10.930 4.310 6.311 10.006 10.622 3.848 4.002 11.853 5.542 153.938 S. aureus toxine 19.017 20.539 19.778 8.368 37.274 14.707 5.071 4.564 19.017 75.054 30.174 253.562 Hepatitis-A virus 0 0 0 0 0 7 7 3 3 2 37 59 Hepatitis-E virus 0 5 0 0 0 0 1 0 0 0 1 7 Norovirus 3.503 3.394 3.175 2.080 2.190 16.970 7.992 3.394 5.693 5.474 55.617 109.482 Rotavirus 0 451 0 0 274 3.126 3.835 709 1.208 725 5.785 16.113 C. parvum 860 144 95 89 302 716 679 98 0 98 200 3.282 G. lamblia 1.243 303 196 0 486 814 2.082 202 0 208 776 6.308 T. gondii 99 218 21 0 20 16 25 0 0 10 25 434 Total 105.585 43.901 59.384 21.127 54.264 50.817 34.429 14.799 39.332 120.279 102.447 646.364
Pathogen Beef & Lamb Pork Poultry Eggs Dairy shellfish Produce Beverages Grains Fish & Other foods Humans & animals Total Campylobacter 1,0 1,2 13,0 0,7 2,1 1,7 1,3 0,4 0,6 0,8 1,3 24,0 STEC O157 0,7 0,1 0,1 0,0 0,1 0,0 0,1 0,1 0,0 0,1 0,3 1,6 L. monocytogenes 0,9 0,7 0,5 0,3 1,9 1,4 0,6 0,2 0,4 0,4 0,4 7,6 Salmonella 1,8 2,1 2,1 3,2 1,0 0,6 0,9 0,4 0,6 0,9 0,8 14,5 B. cereus toxine 0,0 0,0 0,0 0,0 0,0 0,0 0,0 0,0 0,0 0,0 0,0 0,0 C. perfringens toxine 2,0 0,3 0,3 0,1 0,2 0,3 0,3 0,1 0,1 0,3 0,1 4,1 S. aureus toxine 0,5 0,5 0,5 0,2 0,9 0,4 0,1 0,1 0,5 1,9 0,7 6,3 Hepatitis-A virus 0,0 0,0 0,0 0,0 0,0 0,0 0,0 0,0 0,0 0,0 0,1 0,2 Hepatitis-E virus 0,0 0,1 0,0 0,0 0,0 0,0 0,0 0,0 0,0 0,0 0,0 0,1 Norovirus 0,4 0,3 0,3 0,2 0,2 1,7 0,8 0,3 0,6 0,6 5,7 11,3 Rotavirus 0,0 0,1 0,0 0,0 0,0 0,5 0,6 0,1 0,2 0,1 0,9 2,6 C. parvum 0,1 0,0 0,0 0,0 0,0 0,0 0,0 0,0 0,0 0,0 0,0 0,2 G. lamblia 0,0 0,0 0,0 0,0 0,0 0,0 0,1 0,0 0,0 0,0 0,0 0,2 T. gondii 1,6 3,5 0,3 0,0 0,3 0,3 0,4 0,0 0,0 0,2 0,4 6,9 Total 8,9 8,9 17,1 4,8 6,8 6,9 5,3 1,8 3,0 5,2 10,8 79,5
Pathogen Beef & Lamb Pork Poultry Eggs Dairy shellfish Produce Beverages Grains Fish & Other foods Humans & animals Total Campylobacter 63 78 826 48 136 107 81 26 35 51 81 1.533 STEC O157 25 4 2 1 4 2 4 2 2 2 9 56 L. monocytogenes 20 17 12 7 45 32 14 5 11 10 9 181 Salmonella 63 72 74 111 33 21 32 16 22 30 29 502 B. cereus toxine 7 4 2 4 6 2 2 2 18 55 2 104 C. perfringens toxine 233 41 35 14 20 32 34 12 13 38 18 488 S. aureus toxine 50 54 52 22 98 39 13 12 50 197 79 665 Hepatitis-A virus 0 0 0 0 0 1 1 0 0 0 6 10 Hepatitis-E virus 0 2 0 0 0 0 0 0 0 0 0 3 Norovirus 9 9 8 5 6 44 21 9 15 14 143 281 Rotavirus 0 3 0 0 2 19 23 4 7 4 35 98 C. parvum 2 0 0 0 1 2 2 0 0 0 0 8 G. lamblia 3 1 0 0 1 2 4 0 0 0 2 13 T. gondii 447 979 94 0 90 72 113 0 0 45 111 1.950 Total 922 1.263 1.105 212 441 374 344 89 172 447 525 5.892
Pathogen Beef & Lamb Pork Poultry Eggs Dairy shellfish Produce Beverages Grains Fish & Other foods Humans & animals Total Campylobacter 1.312 1.632 17.252 992 2.849 2.240 1.696 544 736 1.056 1.696 32.007 STEC O157 404 59 28 19 68 27 65 33 27 32 155 916 L. monocytogenes 262 218 154 89 578 417 178 61 138 131 115 2.340 Salmonella 1.296 1.471 1.523 2.284 679 422 648 319 442 617 586 10.289 B. cereus toxine 646 314 144 323 521 180 180 153 1.517 4.784 215 8.976 C. perfringens toxine 11.822 2.077 1.756 692 1.014 1.608 1.706 618 643 1.904 890 24.732 S. aureus toxine 3.712 4.009 3.860 1.633 7.275 2.870 990 891 3.712 14.649 5.889 49.490 Hepatitis-A virus 0 0 0 0 0 11 11 3,9 3,9 2,7 55 88 Hepatitis-E virus 0 24 0 0 0 1,6 2,4 1,2 0,0 0,0 3,4 33 Norovirus 567 550 514 337 355 2.748 1.294 550 922 887 9.007 17.731 Rotavirus 0 141 0 0 86 976 1.198 221 377 226 1.807 5.033 C. parvum 249 42 28 26 88 208 197 29 0 29 58 952 G. lamblia 245 60 39 0 96 161 411 40 0 41 153 1.245 T. gondii 2.653 5.816 556 0 533 429 672 0 0 266 660 11.586 Total 23.170 16.413 25.854 6.396 14.140 12.297 9.249 3.463 8.518 24.626 21.292 165.418