RIVM
National Institute for Public Health and the Environment P.O. Box 1
3720 BA Bilthoven The Netherlands www.rivm.nl
Revision of Dutch dietary risk assessment
models for pesticide authorisation
purposes
Report 320005006/2010RIVM Report 320005006/2010
Revision of Dutch dietary risk assessment models for
pesticide authorisation purposes
T. van der Velde-Koerts G. van Donkersgoed N. Koopman B.C. Ossendorp
Contact:
Bernadette Ossendorp
Centre for Substances and Integrated Risk Assessment (SIR) of the RIVM Bernadette.Ossendorp@RIVM.NL
This investigation has been performed by order and for the account of VWS, within the framework of 'Advisering Biociden en Bestrijdingsmiddelen'
© RIVM 2010
Parts of this publication may be reproduced, provided acknowledgement is given to the 'National Institute for Public Health and the Environment', along with the title and year of publication.
Abstract
Revision of Dutch dietary risk assessment models for pesticide authorisation purposes
RIVM revised the models for the calculation of consumer risk for pesticide residues at the maximum allowed levels in food; the actual levels are generally lower. The reason for the revision were more recent food consumption data for young children. For a risk assessment, the amount of a food product consumed is combined with the pesticide concentration in or on that product. The resulting pesticide intake is compared to a toxicological reference value. This risk assessment is a default part of the pesticide authorisation procedure.
Using the revised models, the theoretical estimation of the pesticide residue intake of the Dutch population was generally higher than before. Therefore it is possible that some European standards for the maximum allowable amount of pesticide residues (MRLs) will need to be adjusted to lower levels. This should be investigated by incorporating the Dutch data in the European EFSA calculation model, which estimates European consumer risks (PRIMO). The first steps to accomplish this have already been taken.
The revised calculation models now contain consumption data for three target groups: babies/toddlers, young children and the general population. In the previous models no data were available for the first target group. Furthermore, the calculation models contain for the first time consumption data for raw products as well as processed products made thereof (e.g. apple juice from apples and bread from cereals). So far only the consumption data for raw products were available in the models. Key words:
pesticide residues, dietary risk assessment, food consumption database, NEDI, NESTI, IEDI, IESTI, TMDI, CPAP
Rapport in het kort
Revisie van de Nederlandse dieetrisicobeoordelingsmodellen voor gewasbeschermingsmiddelauthorisatiedoeleinden
Het RIVM heeft de modellen gereviseerd waarmee eventuele risico’s voor consumenten worden berekend van restanten van gewasbeschermingsmiddelen die maximaal op voeding worden toegestaan; de reële hoeveelheden zijn doorgaans lager. Aanleiding voor de revisie waren recentere gegevens over het voedingspatroon van jonge kinderen. Om een risico te schatten wordt de geconsumeerde
hoeveelheid van een product gecombineerd met de concentratie van het gewasbeschermingsmiddel in of op het product. Hierna wordt deze inname vergeleken met een toxicologische grenswaarde. Deze risicoschatting is een standaard onderdeel van de procedure waarmee gewasbeschermingsmiddelen worden toegelaten, het gewasbeschermingsmiddelautorisatieproces.
Met de gereviseerde rekenmodellen bleken de schattingen van de hoeveelheid
gewasbeschermingsmiddelen die Nederlanders via voeding in theorie binnen zouden kunnen krijgen over het algemeen hoger te zijn dan voorheen. Hierdoor kan het mogelijk zijn dat Europese normen voor maximaal toelaatbare hoeveelheden gewasbeschermingmiddelen (MRLs) naar beneden moeten worden bijgesteld. Dit moet nader worden uitgezocht, door de Nederlandse gegevens op te nemen in het Europese EFSA-rekenmodel waarmee Europese risicoschattingen worden gemaakt (PRIMO). Hiervoor zijn inmiddels de eerste stappen gezet.
De gereviseerde rekenmodellen bevatten nu consumptiegegevens van drie doelgroepen: baby’s/peuters, jonge kinderen en de bevolking in zijn geheel. Voorheen waren er geen gegevens voor de eerste doelgroep. Daarnaast bevatten de rekenmodellen voor het eerst consumptiegegevens van zowel rauwe producten als van de producten die daarvan worden gemaakt (zoals appelsap van appels en brood van graan). Tot nu toe werd alleen gerekend met de gegevens van het rauwe product.
Trefwoorden:
Contents
Summary 11
1 Introduction 13
2 Dutch food consumption databases 17
2.1 Overview of Dutch food consumption surveys 17 2.1.1 VCP-1, general population, 1987-1988 18 2.1.2 VCP-2, general population, 1992 18 2.1.3 VCP-3, general population, 1997-1998 19 2.1.4 RIKILT-babies, 2000-2001 19 2.1.5 VIO-toddlers, 2002 19 2.1.6 VCP-young adults, 2003 20 2.1.7 VCP-kids, 2005-2006 21
2.2 Dutch food consumption database construction 21
2.2.1 General methodology 21
2.2.2 General conversion rules 22
3 Commodity conversion 25
3.1 The need for commodity conversion 25
3.2 Commodity conversion model (CPAP) 25
3.2.1 General methodology in the CPAP model 26 3.2.2 Conversion procedures in the CPAP model 27
3.2.3 Revision of the 1995 CPAP model 28
3.3 Additional adaptations to the CPAP model 29
3.3.1 Modification of the RAC list 29
3.3.2 Change of conversion factors 30
3.3.3 Conversion to raw edible portions (EP) 32 3.3.4 Conversion to primary processed commodities (PP) 34
4 Commodity consumption value calculation 39
4.1 Choice of food consumption databases 39 4.1.1 Choice of food consumption database for general population 40 4.1.2 Choice of food consumption database for children 41 4.1.3 Choice of food consumption database for babies/toddlers 41
4.2 Food-RAC-processing definition list 43
4.2.1 Definition list for chronic dietary risk assessment 43 4.2.2 Definition list for acute dietary risk assessment 43 4.3 Commodity consumption value calculation 45 4.3.1 Consumption values for chronic dietary risk assessment 45 4.3.2 Consumption values for acute dietary risk assessment 46 4.4 Choice of commodity consumption value units 50
5 Chronic dietary risk assessment models 53
5.1 Chronic dietary risk assessment 53
5.1.1 Current TMDI or IEDI/NEDI equations 53 5.1.2 History of TMDI and IEDI/NEDI estimations 55 5.2 Dutch chronic dietary risk assessment models 56 5.2.1 Pesticide residue concentrations (MRL, STMR) 57
5.2.2 Commodity consumption values (Fi) and bodyweights (bw) 57
5.2.3 Chronic dietary exposure calculation for primary processed
commodities (PP) 58
6 Acute dietary risk assessment models 61
6.1 Acute dietary exposure estimation 61
6.1.1 Current IESTI/NESTI equations 62
6.1.2 History of IESTI/NESTI equations 65
6.1.3 Variability factor 65
6.2 Dutch acute dietary risk assessment model 68 6.2.1 Pesticide residue concentrations (HR, STMR) 68 6.2.2 Commodity consumption values (LP) and bodyweights 69
6.2.3 Variability factors (ν) 69
6.2.4 Unit weights (URAC and Ue) 70
6.2.5 Acute dietary exposure calculation for primary processed
commodities (PP) 77
7 Impact of model revision on dietary risk assessment 85
7.1 Overview of changes introduced 85
7.1.1 Change in food consumption database 85
7.1.2 Changes in commodity conversion 85
7.1.3 Change from total to individual commodity consumption values 86 7.1.4 Change of g/person/day to g/kg bw/day as starting point 86
7.1.5 Change in average bodyweight 86
7.1.6 Adaptation of calculated large portions 86
7.1.7 Change in unit weight 87
7.2 Impact of the changes introduced 87
7.2.1 TMDI and NESTI calculation using default residue values 87 7.2.2 TMDI and NESTI calculation using existing pesticide MRLs 90
7.2.3 Conclusions 93
8 Discussion 95
8.1 TMDI and IEDI/NEDI-calculations 95
8.2 IESTI/NESTI calculations 96
8.2.1 Default variability factor 96
8.2.2 Unit weights for vegetables 97
8.2.3 Residue levels in small or large sized commodities 97
8.2.4 Population groups 98
8.3 Uncertainty in dietary risk assessment 98 8.4 Use of the dietary risk assessment models for other purposes 101
8.4.1 Enforcement purposes 101
9 Recommendations for future work 105
References 107
Acknowledgement 115
List of abbreviations 117
Summary
As part of the pesticide authorisation process, it is required to check whether pesticide residues in food at the level of the Maximum Residue Limit (MRL) could present a health risk to the consumer. For pesticide authorisation purposes, the risk assessment of chronic and acute exposure of the Dutch population to pesticide residues in food is performed with Excel based dietary risk assessment models based on internationally accepted equations (NEDI, NESTI, IEDI, IESTI, TMDI). These dietary risk assessment models needed revision for various reasons, among others new food consumption surveys became available. The revised Dutch dietary risk assessment models contain consumption data for three population groups: babies/toddlers, young children and the general population. The present report describes the process and the choices made to convert foods as recorded during the Dutch food
consumption surveys (e.g. pizza) into their raw agricultural commodity ingredients (e.g. wheat, tomato) as used in the revised calculation models.
Five Dutch food consumption databases were available for babies/toddlers, two for young children, and four for adults/general population. The choice of the final food consumption database used in the revised Dutch dietary risk assessment models was determined by the number of consumption days in a particular food consumption database, the ability of the food consumption database to represent the whole Dutch population group, and the age of the data.
Further, whereas the old models only allowed risk assessment for the raw agricultural commodity, the revised Dutch dietary risk assessment models contain consumption data for both raw and processed commodities to accommodate refined dietary risk assessment.
The CPAP model is used to convert foods as listed in the food consumption database into raw or processed agricultural commodities. The consumption value per commodity can be given as g/person/day or as g/kg bw/day. For acute dietary risk assessment, the high end of the commodity consumption distribution as g/person/day is in many cases related to consumers with a higher bodyweight (adults group), while the high end of the commodity consumption distribution as g/kg bw/day is in many cases related to consumers with a lower bodyweight (babies/toddlers group). The g/kg bw/day value was considered to be the most protective and this value was used in the revised Dutch dietary risk assessment models.
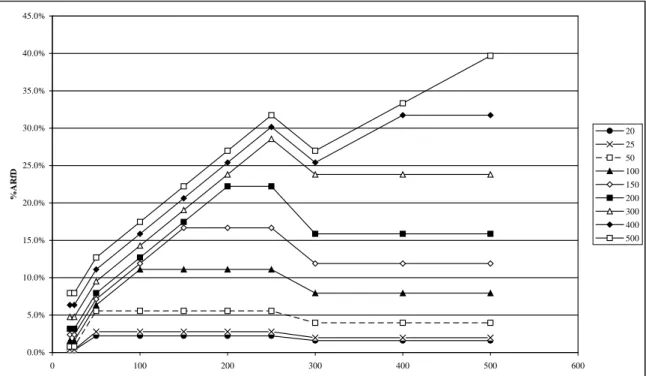
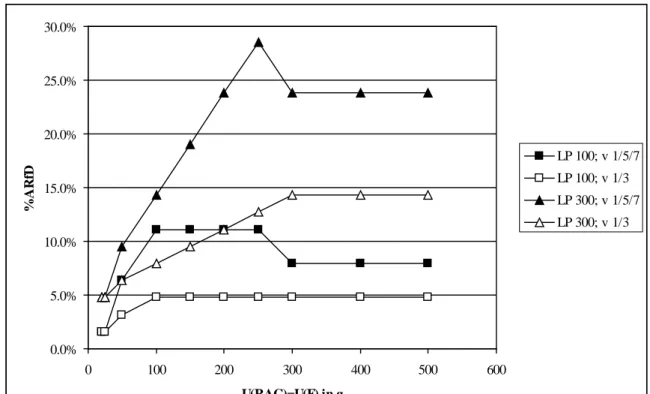
Acute dietary exposure assessment was shown to be very sensitive for the unit weight chosen for the raw agricultural commodity. In general, a higher unit weight will lead to higher exposure, but only up to a unit weight of 250 g. A unit weight of 250 g will generally give worst case exposure. To describe a realistic worst case situation, the median unit weight of a commodity was chosen for the revised Dutch acute dietary risk assessment model.
The impact of the changes made in the revised Dutch dietary risk assessment models was investigated for a selected number of pesticides by comparing first tier assessments performed with the old and the revised Dutch dietary risk assessment models. The dietary exposure estimated from the revised Dutch dietary risk assessment models is generally higher than the dietary exposure estimated from the old Dutch dietary risk assessment models. This is caused by one or more of the following reasons: by a change of Dutch food consumption databases, by modifications in the CPAP conversion model, by a change from total commodity consumption to individual commodity consumption, by the use of g/kg bw/day commodity consumption values as starting point instead of g/person/day commodity
change in the unit weights. As a consequence, exposure estimates for some existing EU MRLs may now exceed the toxicological reference values (ADI, ARfD), indicating a potential health risk. It is recommended to start a follow-up investigation for which pesticides, crops and population groups this is the case. In order to investigate this, steps have been taken to include the revised data from the Dutch dietary risk assessment models in the European Food Safety Authority (EFSA) dietary risk assessment model PRIMO.
1
Introduction
From about the mid-1950s, countries began to legislate for pesticide residues in food and feed by the use of maximum residue levels (MRLs). At that time, the residue levels in the raw agricultural commodities (RACs) were enforced and monitored without dietary risk assessment. From 1961 onwards, chronic dietary risk assessment was included based on expert judgement.
From 1989 onwards the methodology for estimating the chronic dietary exposure to pesticide residues was developed by several international meetings (WHO, 1989; WHO, 1995 a/b; WHO, 1997; WHO, 2008a/b). Chronic dietary risk assessment for pesticide authorisation purposes within the EU conforms to international methodology and follows a three step tiered deterministic approach. The first tier is based on a worst case exposure estimation based on maximum residue levels and has been termed Theoretical Maximum Daily Intake (TMDI). If this first tier estimate for dietary exposure is below the toxicological reference value for chronic exposure (ADI, acceptable daily intake), further refinement steps are not necessary, and the pesticide is unlikely to be of safety concern. However, when the first tier results in an estimate of the dietary exposure close to or above the toxicological reference value, a more accurate (refined) risk assessment will usually be necessary. The refined chronic dietary exposure estimation has been termed International Estimated Daily Intake (IEDI) or National Estimated Daily Intake (NEDI). The refined chronic dietary exposure estimate consists of a second tier where the maximum residue level is replaced by a more realistic median residue level and if necessary a third tier where processing is taken into account. If this third tier estimate for dietary exposure still results in exceeding of the toxicological reference value, the MRLs as proposed for pesticide authorisation cannot be set and other measures are required to reduce the chronic dietary risk (e.g. adaptation of the intended use by changing the treated commodities or changing the dose rate).
In the early 1990s, it became apparent that in some cases, pesticide residues could pose risks resulting from a single exposure or at most a few days of exposure (= acute exposure). In recognition of this, the methodology for estimating this acute dietary exposure to pesticide residues was developed during several subsequent international meetings (WHO, 1997; JMPR, 1999a; PSD, 1999). The 1997 Geneva consultation (WHO, 1997) recommended the development of a food consumption database for two population groups: the entire population (general population) and children (ages 6 years and under). Subsequently, the methodology was refined by the FAO/WHO Joint Meeting on Pesticide Residues (JMPR) (JMPR 1999b; JMPR 2000; JMPR 2002; JMPR 2003; JMPR 2005; JMPR 2006b; JMPR 2007b) and updated in a FAO/WHO workshop (WHO, 2008a/b). The EU adopted this approach in 1999. For pesticide authorisation purposes acute exposure to pesticides is estimated using a
deterministic approach (point estimate). The point estimate is a worst case scenario and is also referred to as the international or national estimate of short-term intake (IESTI or NESTI). In this approach it is assumed that a person consumes a large portion (LP) within a meal or 24 hours, which contains a very high residue level. In this methodology, the acute exposure estimates are performed for each
commodity individually (raw or processed), since the probability of two eating events within 24 hours relating to the consumption of a large portion of two different foods both containing a very high residue of the same pesticide is considered to be very low. To assess whether the application of a pesticide has no adverse consequences for public health, the toxicological reference value for acute exposure (ARfD, acute reference dose) is compared to the estimated acute dietary exposure. Although refinement is possible by way of a probabilistic approach, this refinement is not yet performed for pesticide authorisation purposes.
The general equation for both acute and chronic dietary exposure is:
dietary exposure = food chemical concentration x consumption / bodyweight
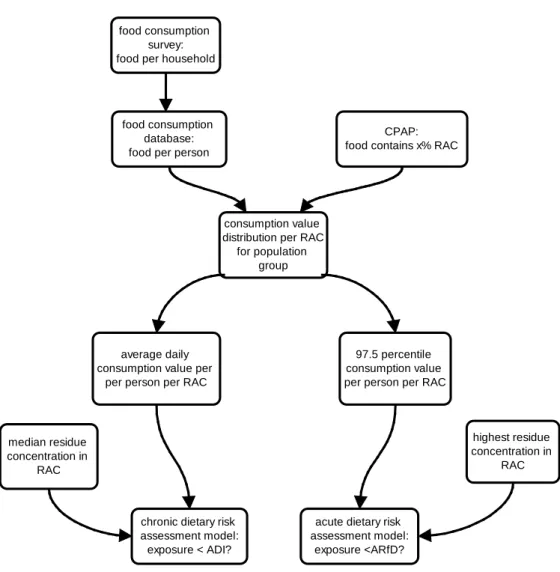
In the Dutch pesticide authorisation process, commodity consumption data derived from the Dutch food consumption surveys are used to estimate the chronic and acute dietary risk when (a selection of) the Dutch population would consume foods containing pesticide residues at the MRL. The data from the Dutch food consumption surveys as such cannot be used directly since the data listed are processed products like pizza, while MRLs are established for RACs like wheat, tomatoes, olives, mushrooms, oilseeds and milk (in case of a pizza). To use pesticide residues analysed in RACs for estimation of dietary exposure, the RIKILT Institute of Food Safety developed the ‘Conversion to Primary Agricultural Product’ (CPAP) model in 1995. This model converts foods into their respective RAC ingredients.Subsequently a commodity consumption distribution is generated for each RAC ingredient by combining the food consumption data and the CPAP model. For chronic dietary risk assessment, average daily commodity consumption values are calculated which are derived from the consumption distribution of individual RAC ingredients for the total population group (consumers and non-consumers). For acute dietary risk assessment models, the 97.5th percentile commodity consumption values are calculated which are derived from the consumption distribution for individual RAC ingredients for consumers-only (i.e. a part of the total population group).
The average daily commodity consumption values are used in the Dutch chronic dietary risk assessment, while the 97.5th percentile commodity consumption values are used in the Dutch acute dietary risk assessment. The Dutch chronic and acute dietary risk assessment was automated in 2000 by using Excel based calculation models developed at the RIVM. These calculation models (i.e. Dutch chronic and acute dietary risk assessment models) contain the equations for dietary exposure as well as consumption values for each individual RAC ingredient for both general population (1-97 years) and children (1-6 yrs). After entering the residue concentrations for relevant RACs, the calculation models compare the dietary exposure to the appropriate toxicological reference value (ADI for chronic risk, ARfD for acute risk) and provide an overview table of commodities for each of the population groups. In 2006 the Dutch chronic and acute dietary risk assessment models have been updated to incorporate also consumption data for babies (8-12 months). However, these data were never implemented in the Dutch pesticide authorisation process, i.e have not been used in the MRL setting process.
In 2006 a need was identified to update the Dutch chronic and acute dietary risk assessment models for several reasons:
− more recent Dutch food consumption surveys were available for babies/toddlers and for young children;
− the European Union (EU) published a new list of RACs for MRL establishment;
− the European Food Safety Authority (EFSA) formulated the need to convert foods to raw edible portion (EP) in stead of RAC and to use g/kg bw/day commodity consumption values as starting point;
− no consumption values for processed RAC commodities were available. Possible dilution of the pesticide residue levels as a result of processing is especially important for refinement of chronic dietary risk assessment. Possible concentration of the pesticide residue levels as a result of processing is especially important for acute dietary risk assessment.
In 2007, the Dutch Ministry of Health, Welfare and Sport commissioned the RIVM to revise the Excel based calculation models for acute and chronic dietary risk assessment. The project was conducted in cooperation with the RIKILT Institute of Food Safety (the RIKILT group involved in this project moved to RIVM per 1 January 2010). The aimed end products of this project were the revised Dutch chronic and acute risk assessment models and a full documentation of these models. The latter was considered to be necessary to facilitate discussions with other interested parties, since it is known that the general guidance provided by WHO can be interpreted in different ways by different stakeholders. The full documentation consists of the present report in combination with Excel appendices (available upon request). The present report describes the processes involved to come from the raw data as present in the consumption surveys to the final Excel based Dutch chronic and acute dietary risk assessment models. This process is shown schematically in Figure 1.
− The second chapter describes the available food consumption surveys and the data processing used to translate the food consumption survey into a food consumption database. This chapter describes the choices and assumptions made for the translation.
− The third chapter describes the CPAP model for conversion of foods into RAC ingredients. This chapter describes also the modifications required to adapt the CPAP model to
accommodate the required changes. This chapter describes the choices and assumptions made for the conversion.
− The fourth chapter describes the calculation of the commodity consumption values. This chapter describes the choices and assumptions made for the calculation.
− The fifth and sixth chapters describe the Dutch chronic and acute dietary risk assessment models. The equations, commodity consumption values and other parameters required for the exposure estimations are described as well as the choices and assumptions made here. − The seventh chapter compares the outcomes of the old and revised Dutch chronic and acute
dietary risk assessment models.
− In the final chapters a discussion is presented on various items concerning dietary risk assessment.
food consumption survey: food per household
food consumption database: food per person
CPAP: food contains x% RAC
consumption value distribution per RAC
for population group
average daily consumption value per
per person per RAC
97.5 percentile consumption value per person per RAC
chronic dietary risk assessment model: exposure < ADI?
acute dietary risk assessment model: exposure <ARfD? highest residue concentration in RAC median residue concentration in RAC
2
Dutch food consumption databases
Commodity consumption data derived from the Dutch food consumption surveys are used to estimate the chronic and acute dietary risk when (a selection of) the Dutch population would consume foods containing pesticide residues at the MRL. This chapter describes the available food consumption surveys and the data processing used to translate the food consumption survey into a food consumption database. This chapter describes the choices and assumptions made for the translation.
2.1
Overview of Dutch food consumption surveys
In 1986 the former Dutch Nutrition Council (Voedingsraad) recommended to perform a food consumption survey and to repeat it on a regular basis to monitor trends in food consumption habits. The first nationwide food consumption survey of the Netherlands was held in 1987-1988 (VCP-1), the second in 1992 (VCP-2) and the third in 1997-1998 (VCP-3).
Subsequent food consumption surveys, initiated by government and industry, focussed on young children (ages below six years): RIKILT-babies (2000-2001), VIO-toddlers (2002) and VCP-kids (2005-2006), particularly because data for children below one year were not available at that time. Exposures to pesticides and contaminants in children are higher than in adults due to higher food consumption levels per kilogram bodyweight. The European Commission estimated a worst case scenario for children aged twelve months (European Commission, 1998).
Because of changes in food policy needs, socio-demographic currents, trends in consumption habits and developments in methodology, the Dutch Ministry of Health, Welfare and Sport (VWS) decided in 2003 that a new approach in national dietary monitoring was needed. The collection method was changed from household food recording during 2 consecutive days to individual sampling by 24-hour dietary recalls on 2 non-consecutive days in combination with a self-administered questionnaire. The decision was in line with the European recommendations of the EFCOSUM-group (Brussaard et al., 2002a/b; De Henauw et al., 2002). A pilot study was held in 2003 among young adults (19-30 years) to test the new way of collecting data. In addition, it was decided to have (semi-)continuous food
consumption surveys for age groups 7-69 years and separate surveys for special groups (elderly people, pregnant and lactating women, ethnic groups, young children) and special products (important products consumed by few people). Differences in design and methods do not allow direct comparison of results before and after 2003 (Ocké et al., 2005a).
The databases of the VCP food consumption surveys are owned by VWS and are managed from 2007 onwards by the Dutch National Institute of Public Health and the Environment (RIVM). Information can be found at www.rivm.nl/vcp or www.voedselconsumptiepeiling.nl. The VIO-toddlers 2002 consumption survey is owned by TNO and Numicon and is also managed by the RIVM. These data may only be used to answer questions from public bodies. The RIKILT-babies 2000-2001 consumption survey is owned by the RIKILT Institute of Food Safety in Wageningen and will be transferred to the RIVM from 2010 onwards.
2.1.1
VCP-1, general population, 1987-1988
The first Dutch National Food Consumption Survey (VCP-1) was held in 1987-1988 by assignment of the then Ministry of Welfare, Public Health and Cultural Affairs (WVC) and the then Ministry of Agriculture, Nature Management and Fisheries (LNV), and was conducted by a marketing research institute (AGB Attwood) experienced in nationwide surveys (VCP, 1988; Hulshof and Van Staveren, 1991).
The household was chosen as the unit of observation. A household was defined as a group of one or more persons living in one house and having a meal prepared at home for at least four days a week. Institutionalised individuals (e.g. students, military, persons in hospitals, persons living in homes for the elderly), persons without a permanent address and persons who did not have a thorough command of the Dutch language were excluded from the survey. Households were chosen for which the main housekeeper was younger than 75 years. In a household diary, the food supplied to the members of the household by the main housekeeper were recorded, as well as leftovers and food given to guests and pets. Precise descriptions of methods of cooking, recipes and ingredients were requested as well as amounts of food consumed and moments when the food was taken and by whom. Where possible, product names, product variety (taste, type), brand name, form bought (fresh, canned, frozen) and form of consumption (fresh, peeled, fried, cooked) were recorded. Common household measures (e.g. spoons, cups) and foods regularly used were weighed. In addition to the household diary, a diary was kept by each individual person to record the amount of food consumed outside the house and at what moments. The diaries of children below the age of 13 were completed by one of their parents. Besides consumption data, also personal data (gender, age, bodyweight, length, education level), household data (number of persons in the household, address data) and personal habits (use of a special diet, mode of life (e.g. vegetarian), use of nutritional supplements, smoking habits, hours of nights rest, meal patterns) were recorded.
Consumption data were collected for two consecutive days from household members of one year and older. The survey was distributed equally over the week and over the year from April 1987 to
March 1988, to account for weekly and seasonal effects. Consumption data were collected for a total of 2204 households, comprising 5898 persons aged 1-85 years. Persons of 1-4 years old were
overrepresented and persons of 19-22 years old were underrepresented as compared to the Dutch population.
2.1.2
VCP-2, general population, 1992
The second Dutch National Food Consumption Survey (VCP-2) was held in 1992 by assignment of WVC and LNV and was conducted by a marketing research institute (AGB Freshfoods) (VCP, 1993; Kistemaker et al., 1993; Hulshof et al., 1994; Löwik et al., 1998).
Consumption data were collected on two consecutive days from household members of one year and older as described for VCP-1. The survey was distributed equally over the seven days of the week and over a whole year from January up to and including December 1992, to account for weekly and seasonal effects. Consumption data were collected for a total of 2475 households, comprising 6218 persons aged 1-92 years. Persons of 1-7 years old were overrepresented and persons of 19-22 years old were underrepresented as compared to the Dutch population.
2.1.3
VCP-3, general population, 1997-1998
The third Dutch National Food Consumption Survey (VCP-3) was held in 1997-1998 by assignment of the VWS and LNV and was conducted by a marketing research institute (GfK Nederland) (VCP, 1998; GfK, 1998; Kistemaker et al., 1998).
Consumption data were collected on two consecutive days from household members of one year and older as described for VCP-1. In addition, a food frequency questionnaire on fruit and vegetables (VEG) and on milk, meat and fish (ANI) was sent along with the diaries. The survey was distributed equally over the seven days of the week and over a whole year from April 1997 to March 1998, to account for weekly and seasonal effects. Consumption data were collected for a total 2354 households, comprising 5958 persons. In an additional survey, households were chosen for which the main
housekeeper was older than 75 years. This resulted in an additional 210 households comprising 292 persons.
In total, consumption data were collected for 2564 households, comprising 6250 persons aged 1-97 years. Persons of 13-22 years old and females of 7-13 and 22-50 years old were overrepresented, while adult males and older women were underrepresented as compared to the Dutch population.
2.1.4
RIKILT-babies, 2000-2001
In 2000-2001, the RIKILT Institute of Food Safety conducted a duplicate diet study among Dutch babies in the age group of 8-12 months to measure the actual intake of pesticides in an age group not covered by the Dutch National Food Consumption Surveys (Boon et al., 2003, 2004).
The sampling strategy was designed to include babies that were fed home-made meals of fruits and vegetables as opposed to industrially prepared baby food. Babies still breast-feeding were excluded from the study. The babies were recruited from three Dutch child health centres in the middle of the Netherlands. Participants were asked to record food consumption during one day and to weigh and record the quantities consumed. In addition, participants were requested to prepare a duplicate portion of all meals consumed by the baby during the study day and to collect this in one vessel for laboratory analysis. Bodyweight was recorded as the weight measured during the last visit at the child health centre prior to the collection day and was corrected for the days between the visit and the measurement. Consumption data were collected for 373 babies aged 8-12 months (186 girls and 187 boys) with an average bodyweight of 9.3 kg (standard deviation 0.95 kg). Of these, 250 babies consumed only home-made meals (prepared from fresh fruits and vegetables) on the study day, while 123 babies consumed a combination of home-made meals and industrially prepared baby food. Consumption data were collected the whole year round to account for the consumption of seasonal fruits and vegetables. Regional differences may not be accounted for. The study represents Dutch babies given fresh fruits and vegetables and the consumption data will therefore very likely overestimate raw fruit and vegetable consumption when compared to a representative sample of Dutch babies. Although not representative for the whole Dutch baby population, the RIKILT-babies database could have special value for acute dietary risk assessment to estimate LPs for raw fruit and cooked vegetables.
2.1.5
VIO-toddlers, 2002
In 2002 a food survey was conducted among Dutch toddlers aged 8-10, 11-14, and 17-20 months. The survey was initiated by Nutricia Nederland BV and was conducted by TNO (Voedingscentrum, 2002; De Boer et al., 2006).
Toddlers were recruited from 33 Dutch child health centres distributed over the Netherlands. Selected toddlers were healthy at face value, had a birth weight of at least 2500 g and had no congenital defects, no food allergies, no diets prescribed by a physician or a dietician, no vegetarian or veganistic lifestyle, and no (partial) breast feed. Children from persons who did not have a thorough command of the Dutch language were excluded from the survey.
Consumption data were collected on two non-consecutive days. Parents were asked to record food consumption of the child in question in a diary and to record the quantities consumed using standardized spoons and measuring jugs. Precise descriptions of methods of food preparation were requested as well as moments when the food was taken.
Besides consumption data, also personal data (gender, age, bodyweight, length, sleeping times of the child) and family data (address data, number of persons in the family, age of the parents, education of the parents, job situation of the parents, country of birth of the parents, number of years living in the Netherlands for the parents, special diets or lifestyles taken by the parents) were collected.
Consumption data were collected for a total of 941 Dutch toddlers: 333 toddlers aged 9 (8-10) months, 306 toddlers aged 12 (11-14) months and 302 toddlers aged 18 (17-20) months. Food was recorded on one week day and one weekend day by 85 % of the parents and 13 % of the parents recorded food consumption on two week days. Correction for the overrepresentation of weekend days was not required because no difference in nutrient intake was observed. The survey was distributed over a period of five months from January up to and including June 2002, which may not account for all seasonal variations.
2.1.6
VCP-young adults, 2003
In 2003 it was decided to change the data collection method for the Dutch National Food Consumption Surveys from household food recording during 2 consecutive days to individual sampling by 24-hour dietary recalls on 2 non-consecutive days. A pilot study was held in 2003 among young adults (19-30 years) to test the new way of collecting data. The 2003 Dutch National Food Consumption Survey (VCP-young adults) was conducted by TNO and the RIVM in collaboration with GfK Panelservices Benelux for data collection (Ocké et al., 2004 and 2005a/b, Hulshof et al., 2004).
As a pre-selection, postal invitations and questionnaires were sent with questions on gender, age, socio-demographic characteristics (address data, education, degree of urbanisation, household composition), smoking, alcohol consumption, physical activity, a concise food frequency questionnaire with
questions on ever or never consumption of 28 selective foods and a standardized food frequency question on vegetable and fruit consumption, pregnancy and lactation. Persons who did not have a thorough command of the Dutch language, pregnant or lactating women and persons that were institutionalized were excluded from the survey.
For each selected participant the dietary survey consisted of 2 independent 24-hour dietary recalls, with 7-14 days in between on different days of the week. The 24-hour recalls were conducted as a computer assisted interview using the EPIC-SOFT computer program. The 24-hour recalls consisted of questions on time/occasion and detailed description of all food and drinks consumed during the past 24 hours. Details included the form in which the foods were consumed (raw or as prepared/processed product) and whether food supplements were used. No information was included on where the food was purchased and where the food was consumed.
Consumption data were collected for 750 Dutch young adults aged 19-30 years. The survey was distributed over a 3-month period from October 2003 up to and including December 2003 and therefore seasonal variations were not accounted for. Although the survey was aimed at equal representation of all days of the week, the Friday was underrepresented for women.
2.1.7
VCP-kids, 2005-2006
In 2005-2006 a food survey was conducted among Dutch infants aged 2-6 years. The survey was conducted by assignment of VWS and was co-ordinated by the RIVM; data were collected by a marketing research institute (GfK Panel Services) (Ocké et al., 2008).
Children whose carers did not have a thorough command of the Dutch language and institutionalized children were excluded from the survey. Children under the age of two were excluded from the survey, because recent food consumption data were available through the VIO-toddlers 2002 database. Per family, only one child was included.
Since a 24-hour recall method is not feasible for young children, a dietary record method was used. Consumption data were reported on two non-consecutive days, separated by 8-13 days, by child carers in pre-structured diaries. The diaries had information on amounts of food and time and place of consumption. In addition to the diaries, home visits were made to collect a self-administered
questionnaire and to measure height and weight of the child. The questionnaire addressed background of the child and family, the child's daily rhythm and activities, general characteristics of the child's diet, consumption frequency of certain specific foods, use of dietary supplements, purchase of organic foods, and the volume of cups and glasses used habitually by the child. In addition, information was collected on the household (address, education of the head of the household, urbanisation level). Consumption data were collected for a total of 1279 infants aged 2-6 years. The survey was distributed equally over the seven days of the week and over a whole year from October 2005 to November 2006, to account for weekly or seasonal effects. The sampling was considered representative with respect to educational level of the head of the household and region of the Netherlands. Children from densely populated areas were slightly underrepresented, as was dietary information for spring and summer.
2.2
Dutch food consumption database construction
The food consumption pattern from the VCP-1, VCP-2, VCP-3, RIKILT-babies and VIO-toddlers Food Consumption Surveys was recorded in diaries and then converted into an electronic database. The data from VCP-young adults and VCP-kids were entered directly into a computer program developed for 24-hour recalls. No changes have been made in these conversions or in these databases for the revised Dutch chronic and acute dietary risk assessment models, but recommendations for improvement are given for future food consumption databases (see sections 3.2 and 4.2.2 and chapter 9).
2.2.1
General methodology
The information in the diaries from VCP-1, -2, and -3 was coded in a standard way and entered in an electronic database by trained dieticians (Hautvast, 1975; GfK, 1998). Individual persons were given a person number consisting of a code for the food survey, a code for the household and an unique number. Foods recorded in the diaries were given a code in accordance with the codes used in the Dutch Food Composition Database (NEVO, NEderlands VOedingsstoffenbestand). NEVO codes have
six numbers like 0001/04 and 1812/28. The Dutch Food Composition Database was updated for each Food Consumption Survey by addition of new foods, addition of nutrients considered relevant or modification of composition of foods (NEVO 1987, 1990, 1993, 1996, 2001, 2006). The 2006 Dutch Food Composition Database contains 1650 foods. Foods were categorized in 24 different food groups based on their nutrient composition.
Amounts of food consumed were recalculated to gram or millilitre per person. For this recalculation conversions were required for net weights of packed food, percentage waste of fresh fruits and vegetables, weights of prepared meat and poultry. Individual portion sizes needed to be assigned for meals consumed collectively within the household using correction factors for leftovers, food given to pets, food given to guests, and food prepared for several days.
For food coding and conversion of portion size to gram or millilitre per person, use has been made of the MGC reference table (‘Maten, Gewichten, Codenummers’) listing foods with their NEVO code, net weights of packaged foods, percentage waste of fruit and vegetables, and conversion from household measures (spoons, cups) to weights. The MGC reference table was updated up to 2003 (MGC, 1987, 1992, 1997, 2003). Conversion for VCP-1, VCP-2 and VCP-3 is described in more detail in 2.2.2. The databases for the RIKILT-babies 2000-2001 and VIO-toddlers 2002 consumption surveys were constructed in a similar way. For the RIKILT-babies 2000-2001 consumption survey, temporary food codes have been assigned to special baby foods, which at a later stage were brought in line with the food coding used in the VIO-toddlers 2002 consumption survey.
The data from VCP-young adults, 2003 and VCP-kids, 2005-2006 were entered into an EPIC-SOFT program, specially developed for 24-hour recalls. This system differs from the previously used database structures. Data-entry is done interactively during the interview and checks, food coding and conversion to g/person or ml/person are performed automatically. Individual foods were coded using the NEVO food system, but were classified into 17 different main food groups and 84 subgroups according to the EPIC-SOFT program (Ocké et al., 2008; De Henauw et al., 2002). In future, the MGC reference table will be updated to reflect the data used in the EPIC-SOFT program.
The Dutch Food Composition Database (NEVO) is owned by the ‘Stichting NEVO’ and is managed by the Netherlands Nutrition Centre in The Hague. The database is available electronically through a licence via www.voedingscentrum.nl. The MGC reference table is owned by Wageningen University and TNO in Zeist and is managed by Wageningen University. The MGC reference table is publicly available.
2.2.2
General conversion rules
The food consumption pattern from the VCP-1, -2, and -3 food consumption surveys was recorded in diaries and then converted into an electronic database using the NEVO coding system and the MGC reference tables. Conversion of the information in the diaries to an electronic database, results in loss of information.
General rules for food coding
1. All foods including water were incorporated in the food consumption database (i.e. got a NEVO code). Only self added herbs (fresh or dry), spices, salt, vinegar, chilli paste (‘sambal’) and mustard were not included because the contribution of these foods was very difficult to measure within a household.
2. NEVO codes do not make a distinction between brand names and varieties of the same food (e.g. taste). Such foods get one NEVO code.
3. NEVO codes differ when the form of the food is different, e.g. NEVO codes for raw, cooked and canned vegetables are different. When vegetables were heated at any stage during preparation they were coded and recalculated as cooked vegetables.
Example 1 when scarole (endive) was bought raw and consumed raw, scarole gets the NEVO
code for raw scarole (0007/28).
Example 2: when scarole (endive) was bought raw and consumed cooked, scarole gets the
NEVO code for cooked scarole (0008/32).
4. NEVO codes do not make a distinction between different types of mixtures. Such aggregated foods get one NEVO code but with a list of all possible fruit/vegetables found in the different mixtures.
Example 1: raw mixed vegetables (consumed in a restaurant or sold as such) were not listed
separately for each mixture available, but with one NEVO code (e.g. NEVO code 0077/49)
Example 2: fruit juices consisting of more than one fruit, were listed under one NEVO code
(e.g. NEVO code 1463/99).
Example 3: fruit jams were listed as jam without indication of the fruit type used to make the
jam (e.g. NEVO code 0445/40).
5. When composite meals (e.g. fried rice, pizza, hotchpotch) were prepared by the housekeeper, NEVO codes and amounts of individual ingredients were entered in the database. When composite meals were bought as a ready-to-eat meal a special NEVO code was entered. An exception was made for self-prepared soup, which was entered in the database as such. 6. Food ingredients taken during a hot meal were generally coded and recalculated as cooked
food: soup, potatoes, rice, pasta, vegetables, dry pulses, eggs (except for raw consumed eggs). Exceptions were made for meat, poultry, fish and game. Meat and poultry were coded as and recalculated to raw food when used with gravy and coded as prepared food when consumed without gravy. Fish was coded as and recalculated to raw food, except for fried fish where the fat used in the preparation was unknown. Game was coded as and recalculated to raw food. 7. Coffee and tea were entered in the food consumption database as liquids (e.g. prepared coffee). 8. When foods recorded in the diaries were not in the NEVO coding system, an alternative was
chosen. This alternative might be entering the product as individual ingredients or use a code for a related product.
Example 1: because for cooked wholemeal pasta no NEVO code existed, cooked wholemeal
pasta was recorded as raw wholemeal pasta (for which a NEVO code was available), although pasta was never consumed raw.
Example 2: pine nuts and pumpkin seeds were coded as sunflower seeds (NEVO code
0872/45), because no NEVO codes are available for these foods.
General rules for conversion to amounts consumed
1. Vegetables and fruits indicated as consumed raw in the diary were only corrected for the percentage waste.
Example: when 600 g scarole (endive) was bought raw within a household, this was corrected
for 15 % waste to 600 x (1-0.15) = 510 g raw edible portion (EP) of scarole per household. This value was divided by the number of persons within that household and the corresponding value was entered in the food consumption database as amount consumed per person.
2. For cooked vegetables, the waste fraction and boil down fraction were taken into account. When vegetables were heated at any stage during preparation, they were coded and recalculated as cooked vegetables. Vegetables recorded as bought fresh in the diaries, but
consumed cooked, were first corrected for the percentage waste and then for the percentage boil down.
Example: When 600 g scarole (endive) was bought raw but consumed cooked per household,
this was first corrected for 15 % waste to 600 x (1-0.15) = 510 g EP and then for 33 % boil down to 510 x (1-0.33) = 342 g cooked scarole per household. This value was divided by the number of persons within that household and the corresponding value was entered in the food consumption database as amount consumed per person.
3. For canned vegetables and pulses (in cans or jars), the net weight was entered in the database, i.e. without the liquid, while for canned fruits (in cans or jars) the weight of the fruits plus the weight of the liquid was entered.
4. For aggregated foods like cooked mixed vegetables, one general correction factor for boil down was used (i.e. individual waste and boil down fractions of individual vegetables in the mixture were not taken into account).
Example : for summer vegetables (NEVO code 0077/89, 0l341/22) one general correction
factor of 15 % for waste and 18 % for boil down was used.
Example 2: for winter vegetables (NEVO code 0034/25, 0965/56) one general correction
factor of 20 % for waste and 18 % for boil down was used.
Recognition codes
As indicated at point 8 of the NEVO coding rules, some foods were coded as a related product. This might have as result that the consumption information of the original food product is lost during translation of the survey to the electronic food consumption database. In the VCP-1 and VCP-2 databases this is indeed the case, the original food cannot be found anymore. In later Dutch food consumption databases this problem was circumvented by the introduction of recognition codes (‘item code’). Recognition codes have numbers between 6000-9000. The combination of NEVO code and recognition code gives the consumption value for that particular food. When using only the NEVO code, the total consumption values are obtained from the underlying foods. Two examples:
− Pine nuts and pumpkin seeds were coded as sunflower seeds (NEVO code 0872/45) without a recognition code. Therefore the consumption of pine nuts and pumpkin seeds cannot be extracted from the Dutch food consumption databases, and the consumption of sunflower seeds is probably an overestimation.
− Cherry tomato and beef tomato were coded as tomato (NEVO code 0060/18) but with a recognition code: 7246 for cherry tomato and 6736 for beef tomato. When using only the NEVO code, the total tomato is obtained, while it is possible to have more detailed results for cherry tomato and beef tomato.
The choice of the related product in NEVO coding very often does not coincide with the EC 178/2006 commodity list which is used for assessment, monitoring and enforcement of pesticide residues in food. For example watercress was coded as cress (NEVO code 0126/32) while watercress and cress are different commodities in the EC 178/2006 commodity list. Another example is lollo biondo
(recognition code 7267) which was coded as scarole (endive) in the Dutch food consumption database (NEVO code 0007/28), while lollo biondo is a lettuce in the EC 178/2006 list and the NEVO code for lettuce (0046/36) would be more appropriate. An overview of the commodities for which the NEVO coding is different from EC 178/2006 commodity grouping is indicated in Appendix I.
For some of the commodities listed in the EC 178/2006 commodity list, no NEVO code or recognition code exists (Appendix I). These commodities were not consumed in the random sample taken from the Dutch population. For commodities consumed by the random sample from the Dutch population either a NEVO code exists or an alternative NEVO code or recognition code is used.
3
Commodity conversion
3.1
The need for commodity conversion
Monitoring and control of food safety as well as the dietary risk assessment of pesticide intake are based on raw agricultural commodities (RAC). A RAC is the end product of agricultural production methods that has not undergone any form of processing; it is the raw agricultural part (or parts) of the crops/animal as moving in trade. For pesticide residues, maximum residue levels (MRLs) are
established for RACs like fruits, vegetables, cereals, oilseeds, meat, milk and eggs. For example, MRLs for oranges are based on the pesticide residue levels in the whole orange i.e. including the peel. But the RAC is in many cases not the commodity that is actually consumed. Therefore, for chronic dietary risk assessment for pesticide authorisation, a tiered approach is taken:
− As a first step the dietary risk is estimated for intake of pesticide residues in/on the RAC, e.g. orange including peel. To this end, pesticide residue concentrations in the RAC are combined with food consumption data which can either be expressed as RAC or as raw edible portion (EP). Up to now food consumption data have been expressed as RAC. As an example, all orange containing commodities (e.g. raw, juice, marmalade) need to be calculated back to their RAC counterpart and are summed to get the food consumption of orange as RAC (i.e. grams of orange with peel per person).
− As a second step, dietary risk is estimated for intake of pesticide residues in the EP, e.g. orange excluding peel. To this end pesticide residue concentrations in the EP are combined with food consumption data expressed as EP. As an example, all orange containing commodities (e.g. raw, juice, marmalade) need to be calculated back to their EP counterpart and are summed to get the food consumption of orange as EP (i.e. grams of orange without peel per person). − As a third step, dietary risk is estimated for intake of pesticide residues in the primary
processed commodities (PP) or the EP, each individually, e.g. orange consumed raw excluding peel, orange juice, marmalade and others. The PP is the product intended for sale to the consumer, intended for direct use as an ingredient in the manufacture of multi-component foods or intended for further processing. A PP is derived from mechanical or chemical processing of the RAC and is not a multi-component product (OECD, 2008a). To this end, pesticide residue concentrations in the raw or primary processed commodities are combined with food consumption data expressed as EP in case the commodity is consumed raw or expressed as PP in case the commodity is consumed in processed form. As an example the consumption of raw orange is expressed as EP, while the consumption of orange juice is expressed as juice (i.e. grams of juice per person).
None of these steps make use of the foods as listed in the food consumption databases (e.g. pizza, fruit yoghurt, apple pie). In order to use the food consumption databases for chronic and acute dietary risk assessment of pesticides, the foods need to be converted into their RAC ingredients, EP and PP.
3.2
Commodity conversion model (CPAP)
In 1995, the RIKILT Institute for Food Safety developed a computer based CPAP model (Conversion Primary Agricultural Product) to convert foods as recorded in the VCP-1 and VCP-2 food consumption databases into their respective RAC ingredients (Van Dooren et al., 1995, 1996). In total, 1677 foods were converted into their RAC ingredients, resulting in 245 RACs. The list of RACs used for this
conversion was based on legislation then in force for pesticides (Bestrijdingsmiddelenwet 1995, EC 90/642), animal products (Vleeskeuringswet), veterinary drugs (Diergeneesmiddelenwet, EC
2377/90/EC), nuclear energy (Kernenergiewet) and food (Warenwet 1995). Clinical preparations (drip feed, elementary food), aroma's, salt and sweeteners were not converted, since the RAC ingredients were not listed in any of the Dutch and European legislations. The CPAP model is owned by the RIKILT Institute of Food Safety in Wageningen. In the course of 2010 the CPAP model will be transferred to RIVM.
3.2.1
General methodology in the CPAP model
The conversion of foods as recorded in the food consumption databases consists of two steps. − As a first step, foods are converted into their individual ingredients. For example, pizza
consists of flour, tomato puree, olives, vegetables, and cheese.
− As a second step, the individual ingredients are converted into their RAC counterpart. For example, flour is converted into wheat grains; tomato puree is converted to tomatoes, olives are converted to olives including stones, vegetables are converted to raw vegetables, cheese is converted to milk.
The conversion factor listed in the CPAP model is therefore the combined factor for % ingredient (step 1) and conversion to the RAC counterpart (step 2). For example, the CPAP model contains the following conversion factors for fruit and vegetables:
− clean fruit/vegetable fraction (% ingredient plus possible concentration factors); − peel fraction of fruit (for conversion to fruit with peel);
− core/stone fraction of fruit (for conversion to fruit with core/stone); − waste fraction of vegetables (for conversion to vegetables with waste);
− boil down fractions for cooked vegetables (for conversion of cooked to raw vegetables). By using the commodity conversion factors, foods can be converted to their RAC ingredients. In the 1995 CPAP model, a trained dietician divided each food (NEVO code) into its individual RAC ingredients. Information on conversion factors in the 1995 CPAP model was derived from cookery books, ingredient information in the MGC reference table (version 1992), ingredient information in the Dutch Food Composition Database (NEVO, version 1987, 1989, 1990), literature, labels from foods, information from the manufacturer (Van Dooren et al, 1995). For later versions of the CPAP model also internet was an important source. Both the source and the conversion factor are stored within the CPAP model.
The conversion from foods to RAC in the 1995 CPAP model is based on NEVO codes only; the recognition codes (see section 2.2.2), which are available in the VCP-1, VCP-2 and VCP-3 Dutch food consumption database to give additional information on related foods, are not used. For example if the Dutch food consumption database gives information on tomatoes, this can be divided into consumption for regular tomatoes, cherry tomatoes and beef tomatoes by using their respective recognition codes. In the CPAP model this information is not used: only the total tomato consumption is listed. In the later Dutch food consumption databases (VCP-young adults, VCP-kids) the recognition codes are replaced by the codes used in the EPIC software and for future CPAP models it is intended to use the EPIC coding system (Boon and Ocké, 2008).
The clean fruit/vegetable fraction of the CPAP model is a combination of % ingredient (commodity as such, either raw or processed) and possible concentration factors (e.g. drying). For example, grape-currants in bread (NEVO 0233/25) have a clean fruit fraction of 104.7 %. This factor is the
only a remark is available within the CPAP model as to how the clean fruit/vegetable fraction was obtained. For future use, it is recommended to have a separate entry for the % ingredient and a separate entry for additional conversion factors (e.g. fruit drying, drying of potato and cassava flour, preparation of wine, beer and whisky, oil production, sugar preparation) to be able to verify which conversion factors were used. Further, it is recommended to give an overview of the CPAP conversion factors in a publicly available document. The % ingredient per food can remain confidential in this way.
3.2.2
Conversion procedures in the CPAP model
The conversion factors used to transform the commodities listed in the diaries (VCP-1, VCP-2, VCP-3) to commodities as recorded in the Dutch food consumption database are not always the same as the conversion factors used to transform the commodity in the CPAP model to RAC. Examples are given below. This means that the back calculation to RAC by the CPAP model, may result in a different value than originally recorded in the diaries. When the value is lower than originally recorded, the estimated dietary exposure will be too low; when the value is higher than originally recorded, the estimated dietary exposure will be too high. For future updates it is recommended to harmonize the factors used in the NEVO coding system with the factors used in the CPAP model. A project has already been initiated to match the NEVO coding system with the CPAP model and harmonisation of conversion factors was already listed as a possible point of improvement (Boon and Ocké, 2008).
Aggregated foods
For aggregated foods such as raw or cooked mixed vegetables (NEVO code 0077/49, 0341/22, 0034/25, 0965/56) the NEVO coding system gives information on which vegetables are present in these hypothetical mixtures. In the CPAP model an equal proportion is assumed for each vegetable present in the mixture. Each vegetable present in the mixture is subsequently converted to its RAC counterpart using its own waste and boil down fractions. This is different from the way the food is entered in the Dutch food consumption databases (VCP-1, VCP-2, VCP-3), where a default waste and boil down fraction is used for each vegetable present in the mixture. For future updates it is
recommended to harmonize the conversion factors used in the NEVO coding system and the CPAP model.
Cooked and frozen vegetables
Cooked and frozen vegetables are converted to their RAC counterpart using the sum of the boil down fraction and the waste fractions. For example, fried potatoes are converted to raw potatoes by using a multiplication factor of 125 %, consisting of 100 % clean vegetable fraction + 25 % peel fraction + 0 % boil down fraction (Van Dooren et al., 1995). This means that 100 g fried potatoes originate from 125 g raw unpeeled potatoes. This way of calculation is different from the way the foods are entered in the Dutch food consumption databases (VCP-1, VCP-2, VCP-3), where a subsequent correction is made: first from RAC to EP using multiplication by (1-waste fraction) and than from EP to cooked product using multiplication by (1-boil down fraction). Another example is scarole (endive). The CPAP model uses a multiplication factor of 175 %, consisting of 99 % clean vegetable fraction + 26 % waste fraction + 49 % boil down fraction. In the CPAP model, 100 g cooked scarole originates from 175 g raw scarole as marketed. The NEVO coding system uses a 33 % boil down fraction and a 15 % waste fraction, which are subsequently applied. In the NEVO coding system 100 g cooked scarole also originates from 175 g raw scarole as marketed, although different factors were applied. For future updates it is recommended to harmonize the conversion factors used in the NEVO coding system and the CPAP model.
Canned fruits, canned vegetables, canned pulses
For canned fruits (in cans or jars), the weight as recorded in the Dutch food consumption database is the weight of the canned fruits plus the liquid. This means that in the CPAP model, the % ingredient for canned fruits is lower than 100 %. For example, canned strawberries are converted to raw strawberries in the CPAP model by using a multiplication factor of 58 % consisting of 55 % clean fruit fraction + 3 % waste fraction, i.e. 100 g canned strawberries consist of 58 g raw strawberries as marketed. The 55 % clean fruit fraction is the % ingredient fraction of the strawberries in the liquid, no conversion for boil down has been incorporated for canned fruits.
For canned vegetables and canned pulses (in cans or jars), the amount consumed as recorded in the Dutch food consumption database is the net weight, i.e. without the weight of the liquid. This means that in the CPAP model, the % ingredient for canned vegetables is 100 %. In the CPAP model canned vegetables and canned pulses are treated as cooked vegetables and cooked pulses.
Rice, pulses and soybeans
Rice, pulses and soybeans are coded in the Dutch food consumption database from 2003 onwards as cooked commodities. The CPAP models converts cooked rice, cooked pulses, cooked soybeans into dry rice, dry pulses and dry soybeans, because this is the definition of the RAC in the legislation. The CPAP model uses a multiplication factor of 40 % based on the general equation: cooked weight = 2.5 x dry weight as listed in MGC reference table 1992 (MGC, 1992). In the older Dutch food
consumption databases (VCP-1, VCP-2, VCP-3) also consumption data for dry rice, dry pulses and dry soybeans may exist. These entries are not converted in the CPAP model.
Coffee, tea, cocoa milk, beer, wine
Coffee, tea, cocoa milk, beer and wine are entered in the Dutch food consumption database as liquids (e.g. prepared coffee and tea). In the CPAP model prepared coffee and tea (as liquid), cocoa milk, beer and wine are converted into their RAC counterparts, because this is the definition of the RAC in the legislation.
− Prepared coffee corresponds to 4.1 % or 4.6 % w/w coffee beans in the CPAP model, similar to the EFSA conversion factor of 25 to convert coffee to coffee beans (6 g coffee powder in 150 ml water) (EFSA, 2007a).
− Prepared tea corresponds to 0.83 % w/w tea leaves in the CPAP model, similar to the EFSA conversion factor of 100 to convert tea infusion to dry tea leaves (2.5 g tea leaves in 250 ml water) (EFSA, 2007a).
− Cocoa milk corresponds to 3.5 % w/w cocoa beans, while cocoa milk from instant powder corresponds to 1.3 %, 2.8 % or 5.0 % w/w cocoa beans.
− Beer corresponds to 13.5 % w/w barley (alcohol free), 19 % w/w barley (0.1-4 % alcohol) or 26.5 % w/w barley (> 7 % alcohol).
− Wine corresponds to 140 % w/w wine grapes in the CPAP model, similar to the EFSA conversion factor of 1.4 to convert wine into wine-grapes (EFSA, 2007a).
Milk products
Milk products like cheese are converted into raw milk, based on the level of one of its constituents: milk-fat part, casein-protein part, whey-protein part, lactose part or water part. The basis for the calculation is documented within the CPAP model (Van Dooren et al., 1995).
3.2.3
Revision of the 1995 CPAP model
When new versions of the Dutch Food Composition Database became available (NEVO 1996, 2001, 2006) corresponding to Dutch food consumption databases VCP-3, VCP-young adults 2003 and
addition, new foods recorded in the RIKILT-babies 2000-2001 database and VIO-toddlers 2002 database were also included in the CPAP model. Since the food consumption surveys of RIKILT-babies and VIO-toddlers were not conducted by the regular Food Consumption Survey team, temporary NEVO codes have been given to these foods.
The changes made within the CPAP model have not been documented publicly and no version indication is given for the CPAP model (e.g. CPAP version 1.0). Modifications as introduced in the MGC reference tables have not been incorporated, the MGC 1992 version is still used. For future use, it is recommended that the CPAP model is updated to reflect the data from the latest MGC reference tables and the data in the EPIC-SOFT program and to use version numbers. In addition, the foods corresponding to the temporary NEVO codes should be incorporated in the MGC reference table and NEVO database as well.
3.3
Additional adaptations to the CPAP model
To accommodate the three step tiered approach required for risk assessment (as indicated in section 3.1), foods also need to be converted to their EP counterpart and their PP counterpart in addition to their RAC counterpart as is done in the CPAP model. For this purpose and because of modifications in the authorisation procedures, additional adaptations to the CPAP model were required. These adaptations were not included in the CPAP model itself, but were added using so-called scripts (programming in Pro*Fortran or SQL+).
3.3.1
Modification of the RAC list
The CPAP model uses a list of RACs corresponding to the 1995 Pesticide Regulation: EC 90/642 (European Commission, 1990). Within the EU a new list has been in use since September 2008: EC 178/2006 (European Commission, 2006). For the revised Dutch chronic and acute dietary risk assessment models, the old list of RACs in the CPAP model was replaced by the new list of RACs (by use of scripts).
The differences between the old (EC 90/642) and new list (EC 178/2006) involve changes in the sequence of the commodity groups, introduction of new commodities (additional miscellaneous fruits and herbs) and new commodity groups (herbal infusions), deletion of commodity groups (potatoes are now part of the group root and tuber vegetables) and aggregation of commodities (meat of chicken, duck, turkey and other poultry have been aggregated to poultry, pomelo is included in grapefruit, early and ware potatoes have been aggregated to potatoes, turnip tops were included in spinach). Fish is not yet included in the new list.
Only the RACs from the EC 178/2006 list were included in the revised Dutch chronic and acute dietary risk assessment models. The following ingredients were therefore not included: gelatine, yeast, water, fish varieties, alcoholic drinks (no wine/beer/whisky), human (breast) milk, wild animals (wild rabbit, hare, partridge, pheasant), lemonade water, mineral water, tap water and vitamin preparations. The Dutch Food and Consumer Product Safety Authority (VWA) has enforcement/monitoring results for pesticide residue levels in commodities not listed in EC 178/2006 (such as tropical fruits, tropical vegetables, herbs and spices). An exceeding of the MRL is found frequently for some of these
commodities (Hittenhausen-Gelderblom, 2004). Because no consumption values are available for these commodities, it is not possible to estimate the dietary risk. VWA therefore expressed the wish to have food consumption data for fresh chilli peppers (Capsicum annuum), longan (Euphoria longana),
sapodilla (Achras zapota), bottle gourd (Lagenaria siceraria), balsam pear (Momordica charantia), fresh yard-long beans (Vigna unguiculata), fresh curry leaves (Murraya koenigii), fresh coriander leaves (Coriandrum sativum) and fresh mint leaves used for herbal infusions. Most of these
commodities are not recorded in any of the available Dutch food consumption databases. Therefore, these commodities are not consumed by the Dutch population sampled in the Dutch food consumption databases. Consumption values for fresh yard-long beans can be equated with the consumption value of fresh beans with pods and that of fresh coriander leaves with that of fresh celery leaves, both in
accordance with EC 178/2006. Balsam pear is recorded in the Dutch food consumption databases, and is listed as ‘other fruiting vegetables with inedible peel’ in the revised Dutch chronic and acute dietary risk assessment models, because there is no separate entry in the EC 178/2006 list. To have
consumption values for chilli peppers, the commodity peppers as listed in EC 178/2006 is divided in sweet peppers and chilli peppers (fresh) and for commodity conversion foods are assigned to either sweet peppers or chilli peppers.
3.3.2
Change of conversion factors
The conversion factors as available in the 1995 CPAP model were never revised or re-evaluated. However, some conversion factors were erroneous and others were not available. These changes were added by use of so-called scripts.
Erroneous conversion factors
For the revised Dutch chronic and acute dietary risk assessment models, the conversion factors were changed for dried fruit, dried vegetables and dried herbs because conversion factors for the PP (dried fruit, dried vegetables, dried herbs as such) were erroneous. To calculate the RAC counterpart for dried commodities, a drying factor and a waste factor are taken into account. The drying factor is calculated from % moisture levels in dry and raw commodities as indicated in the CPAP model. When both the waste factor and the % moisture levels, as listed in the 1995 CPAP model, were omitted to get the consumption value for the PP (dried fruit, dried vegetables and dried herbs as such), the resulting conversion factor was larger than the expected 100 %. Therefore the drying factors as listed in the 1995 CPAP model were adapted (by use of scripts) to get a 100 % value for the PP (Table 1).