TRENDS IN GLOBAL
CO
2
EMISSIONS
2012 report
ISBN: 978-92-79-25381-2 ISSN: 1831-9424 DOI: 10.2788/33777This background study is a publication by
PBL Netherlands Environmental Assessment Agency Mailing address PO Box 30314 2500 GH The Hague The Netherlands Visiting address Oranjebuitensingel 6 2511VE The Hague T +31 (0)70 3288700 www.pbl.nl/en European Commission Joint Research Centre
Institute for Environment and Sustainability Mailing address via Fermi, 2749, TP290 21027 Ispra (VA) Italy T +39 0332 78 5831 www.edgar.jrc.ec.europa.eu www.jrc.ec.europa.eu July 2012
Background Studies
Trends in global co2 emissions
2012 Report
This publication can be downloaded from: www.pbl.nl/en or edgar.jrc.ec.europa.eu. A hard copy may be ordered from: reports@pbl. nl, citing the PBL publication number or ISBN.
Parts of this publication may be reproduced, providing the source is stated, in the form: Oliver JGJ, Janssens-Maenhout G and Peters JAHW (2012), Trends in global CO2 emissions; 2012 Report, The Hague: PBL Netherlands Environmental Assessment Agency; Ispra: Joint Research Centre.
PBL Netherlands Environmental Assessment Agency is the national institute for strategic policy analyses in the fields of the environment, nature and spatial planning. We contribute to improving the quality of political and administrative decision-making, by conducting outlook studies, analyses and evaluations in which an integrated approach is considered paramount. Policy relevance is the prime concern in all our studies. We conduct solicited and unsolicited research that is both independent and always scientifi-cally sound.
As the Commission’s in-house science service, the Joint Research Centre’s mission is to provide EU policies with independent, evidence-based scientific and technical support throughout the whole policy cycle. Working in close cooperation with policy Directorates-General, the JRC addresses key societal challenges while stimulating innovation through developing new methods, tools and standards, and sharing its know-how with the Member States, the scientific community and international partners. Key policy areas include: environment and climate change; energy and transport; agriculture and food security; health and consumer protection; information society and digital agenda; safety and security, including nuclear; all supported through a cross-cutting and multidisciplinary approach.
Trends in global CO2 emissions; 2012 Report
© PBL Netherlands Environmental Assessment Agency The Hague/Bilthoven, 2012 PBL publication number: 500114022 EUR: 25388 ISBN: 978-92-79-25381-2 ISSN: 1831-9424 DOI: 10.2788/33777 Corresponding author Jos Olivier, jos.olivier@pbl.nl Author(s) Jos G.J. Olivier (PBL)
Greet Janssens-Maenhout (IES-JRC) Jeroen A.H.W. Peters (PBL)
Responsibility
PBL Netherlands Environmental Assessment Agency Institute for Environment and Sustainability (IES) of the European Commission’s Joint Research Centre (JRC) Graphics
Marian Abels (PBL) Production coordination PBL Publishers
Layout
Contents
Summary 6
1 Introduction 8
2 Results 10
2.1 Long-term trend in global CO2 emissions continued in 2011 10
2.2 Large regional differences: emissions soar in China and India and decrease in OECD countries 11 2.3 Comparison between emissions in the various countries 13
2.4 Gas flaring emissions and hydraulic fracturing technology 15 2.5 Cement production and other non-combustion sources 16
2.6 Cumulative CO2 emissions and climate mitigation targets in the 21st century 17
3 Trends in energy consumption 20
3.1 Trends in fossil fuel consumption 20
3.2 Trends in renewable and nuclear energy sources 21
Annex 1 24
Methodology and data sources for the period 2008-2011 24
Annex 2 30
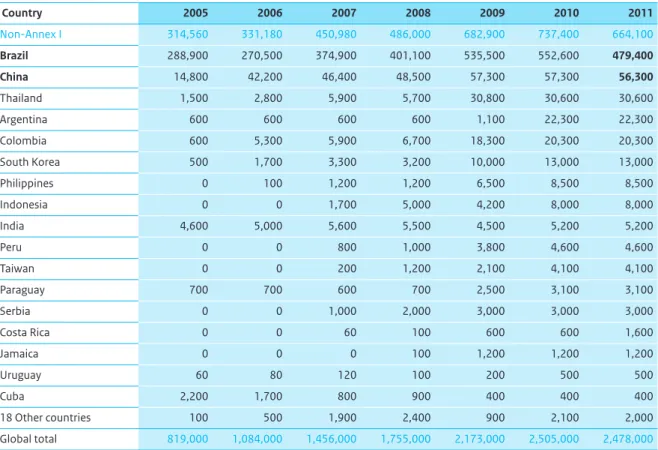
Data set on biofuel consumption in road transport per country, 2005–2011 30
Annex 3 33
Regional temperature anomalies in the winters of 2010 and 2011 33
List of abbreviations 35 References 36
Summary
Global emissions of carbon dioxide (CO2) – the main cause of global warming – increased by 3% in 2011, reaching an all-time high of 34 billion tonnes in 2011. In 2011, China’s average per capita carbon dioxide (CO2) emissions increased by 9% to 7.2 tonnes CO2. Taking into account an uncertainty margin of 10%, this is similar to the per capita emissions in the European Union of 7.5 tonnes in 2011, the year in which the European Union saw a decrease in emissions of 3%. China, the world’s most populous country, is now well within the 6 to 19 tonnes/person range spanned by the major industrialised countries. In comparison, in 2011, the United States was still one of the largest emitters of CO2, with 17.3 tonnes in per capita emissions, after a steep decline mainly caused by the recession in 2008–2009, high oil prices compared to low fuel taxes and an increased share of natural gas. With a decrease in 2008 and a 5% surge in 2010, the past decade saw an average annual increase of 2.7%. The top 5 emitters are China (share 29%), the United States (16%), the European Union (EU27) (11%), India (6%) and the Russian Federation (5%), followed by Japan (4%). The fact that global emissions continued this historical growth trend in 2011 seems remarkable at first sight, considering that in many OECD countries CO2 emissions in fact decreased – in the European Union by 3%, in the United States by 2% and in Japan by 2% – mainly due to weak economic conditions in many countries, mild winter weather in several countries and high oil prices. More important, however, is that CO2 emissions from OECD countries now account for only one third of global
emissions – the same share as that of China and India, where emissions increased by 9% and 6%, respectively, in 2011. The increase in China’s CO2 emissions was mainly due to a continued high economic growth rate, with related increases in fossil fuel consumption. This increase in fuel consumption in 2011 was mainly driven by the increase in building construction and expansion of infrastructure, as indicated by the growth in cement and steel production. Domestic coal consumption grew by 9.7% and coal import increased by 10%, making China the world’s largest coal importer, overtaking Japan.
Levels of global CO2 emissions from flaring of unused gas during oil production, which have decreased by about 25% since 2003, did not significantly change in 2011. They roughly amount to the total of CO2 emissions in Spain. However, according to satellite observations, flaring emissions in the United States are on the rise, with a steep 50% increase in 2011. The main cause is the recent sharp increase in the country’s use of hydraulic fracturing, or fracking, for shale oil production and its ensuing flaring of co-produced gas. Recently, the United States also expanded shale gas fracking and has now become the largest natural gas producer in the world.
Since 2000, an estimated total of 420 billion tonnes CO2 was cumulatively emitted due to human activities (including deforestation). Scientific literature suggests that limiting average global temperature rise to 2 °C above pre-industrial levels – the target internationally adopted in UN climate negotiations – is possible if
cumulative emissions in the 2000–2050 period do not exceed 1,000 to 1,500 billion tonnes CO2. If the current global increase in CO2 emissions continues, cumulative emissions will surpass this total within the next two decades.
The share of renewable energy sources excluding hydropower, such as solar and wind energy and biofuels, although still very small, is increasing with accelerated speed; it took 12 years, from 1992 to 2004, to double from a share of 0.5% to 1%, but only 6 more years to double again to 2.1% by 2011. This could represent about 0.8 billion tonnes in potentially avoided CO2 emissions in 2011 that would have been globally emitted from fossil fuel power generation and road transport, which is similar to the current CO2 emissions in Germany. Including hydropower, total renewable energy sources presently supply 8.5% of all the energy that is used, globally. The total potentially avoided emissions in 2011 have been estimated at roughly 1.7 billion tonnes CO2 when including the hydropower capacity that was added from 1992 onwards. About one third of these potentially avoided emissions relate to China and one eighth to Brazil, both mainly due to the increased use of hydropower.
These preliminary estimates have been made by the PBL Netherlands Environmental Assessment Agency and the European Commission’s Joint Research Centre (JRC) on the basis of energy consumption data for 2009 to 2011, which were recently published by energy company BP. The estimates are also based on production data for cement, lime, ammonia and steel as well as on emissions per country, from 1970 to 2008, from version 4.2 of the Emission Database for Global Atmospheric Research (EDGAR), a joint project of JRC and PBL.
ONE
Introduction
This report discusses the results of a trend assessment of global CO2 emissions up to 2011 and updates last year’s assessment (Olivier et al., 2011). This assessment focusses on the changes in annual CO2 emissions from 2010 to 2011, and includes not only fossil fuel combustion on which the BP reports are based, but also incorporates all other relevant CO2 emissions sources including flaring of waste gas during oil production, cement clinker production and other limestone uses, feedstock and other non-energy uses of fuels, and several other small sources. After a short description of the methods used (Chapter 2), we first present a summary of recent CO2 emission trends, by region and by country, and of the underlying trend of fossil fuel use, non-fossil energy and of other CO2 sources (Chapter 3). To provide a broader context of the global trends we also assess the cumulative global CO2 emissions of the last decade, i.e. since 2000, and compare it with scientific literature that analyse global emissions in relation to the target of 2 oC maximum global warming in the 21st century, which was adopted in the UN climate negotiations (Chapter 4). Compared to last year’s report, Annex 1 includes a more detailed and updated discussion of the uncertainty in national and global CO2 emission estimates.
This assessment excludes CO2 emissions from deforestation and logging, forest and peat fires, from post-burn decay of remaining above-ground biomass, and from decomposition of organic carbon in drained peat soils. The latter mostly affects developing countries. These sources could add as much as a further 20% to
global CO2 emissions (Van der Werf et al., 2009) or perhaps as little as 10% (Harris et al., 2012). However, these percentages are highly uncertain and vary widely between years. This variation is also a reason that emissions and sinks from land use, land-use change and the forestry sector (LULUCF) are kept separate in reporting under the UN Climate Convention (UNFCCC) and the Kyoto Protocol. For the same reason, the emissions from the LULUCF sector are not included in this assessment. Information on recent emissions from forest and peat fires and post-burn emissions is being assessed by the Global Carbon Project, which will publish later this year a comprehensive assessment of the global carbon budget including all sources and sinks (GCP, 2011).
Methodology and data sources used
For global CO2 emissions from 1970 to 2008 we used the published EDGAR 4.2 data set for greenhouse gases, which resulted from a joint project of the European Commission’s Joint Research Centre (JRC) and the PBL Netherlands Environmental Assessment Agency and was released 11 November 2011. This data set provides, for the 1970–2008 period, greenhouse gas emissions per country and on a 0.1 x 0.1 degree grid for all anthropogenic sources identified by the IPCC (JRC/PBL, 2011). Although the data set distinguishes about 25 sources categories, emissions are estimated for well over 100 detailed categories as identified in the Revised 1996 IPCC guidelines for compilation of emission inventories (IPCC, 1996). The EDGAR 4.2 data set used for this assessment differs only very slightly from the preliminary EDGAR 4.2
ONE ONE
data set of July 2011 that was used in last year’s assessment.
EDGAR 4.2 includes CO2 emission factors for cement production (e.g., kg CO2/tonne cement produced), taking into account the decreasing share of clinker in cement. In addition, all sources of CO2 related to non-energy/ feedstock uses of fossil fuels were estimated using the tier 1 methods and data recommended in 2006 IPCC Guidelines on GHG Inventories (IPCC, 2006). In addition to cement production, EDGAR 4.2 includes other industrial non-combustion processes such as production of lime and soda ash (2A) and carbon used in metal production (2C). Collectively, the other carbonate sources add about 30% to global cement production emissions in 2008. In addition, more information on the data sources and methodologies used can be found in Olivier et al. (2011), which is part 3 of IEA (2011b).
Although not used in this study, the EDGAR 4.2 data set also includes annual CO2 emissions from forest fires and peat fires as well as fires in savannahs and other wooded land estimated by Van der Werf et al. (2006). EDGAR 4.2 also includes the significant, albeit highly uncertain, CO2 emissions from the decay of organic materials of plants and trees, which remain after forest burning and logging, and from drained peat soils (JRC/PBL, 2011). In addition, also the net carbon stock changes (resulting in CO2 emissions or carbon storage) for forests, based on data from the FAO’s Forest Resources Assessment (FAO, 2010) are included just for information purposes to this data set. For the trend estimate for the 2008–2011 period, all CO2 emissions have been aggregated into five main source sectors (corresponding IPCC category codes in brackets): (1) fossil fuel combustion (1A), including international transport ‘bunkers’, marine and aviation), (2) fugitive emissions from fuels (1B), (3) cement production and other carbonate uses (2A), (4) feedstock and other non-energy uses of fossil fuels
(2B+2C+2G+3+4D4), and (5) waste incineration and fuel fires (6C+7A).
For each country, the trend from 2008 onwards has been estimated using the appropriate activity data or
approximated with trends in related statistics as estimator. For the large share of fuel combustion emissions (1A) that account for about 90% of total global CO2 emissions excluding forest fires, 2008 emissions were divided per country into four main fuel types for use as trend indicators. These fuel types are coal and coal products, oil products, natural gas and other fuels (e.g., fossil-carbon containing waste oils). For each fuel type, the 2008–2009 trend was based on IEA data (IEA, 2011) and the 2009–2011 trend was based on BP data released in June 2012 (BP, 2012). A similar approach was used for
the other source sectors. More details on the
methodology and data sources are presented in Annex 1. Data quality and uncertainty in the data are also
discussed in this Annex. The uncertainty in CO2 emissions from fossil fuel combustion using international statistics is discussed in detail by Marland et al. (1999) and Andres et al. (2012) and general uncertainty characteristics in global and national emission inventories in Olivier and Peters (2002).
TWO
Results
2.1 Long-term trend in global CO
2emissions continued in 2011
After a 1% decline in 2009 and an unprecedented 5% surge in 2010, global CO2 emissions increased by 3% in 2011, compared to the previous year, reaching an all-time high of 34 billion tonnes (Figure 2.1). The five largest emitters are (shares in 2011 between brackets): China (29%), the United States (16%), the European Union (EU27) (11%), India (6%) and the Russian Federation (5%), closely followed by Japan (4%) (Figure 2.2.). Global consumption of coal (responsible for about 40% total CO2 emissions) grew in 2011 by 5%, whereas global
consumption of natural gas and oil products increased by only 2% and 1%, respectively (BP, 2012). Over the past decade, average annual emissions increased by 2.7%. So, with a 3% increase in 2011, global CO2 emissions resumed this decadal trend, after two years of being heavily affected by the global financial crisis and the rebound in 2010. This was also concluded by Peters et al. (2011) in their analysis of the impact of the 2008–2009 global financial crisis on CO2 emissions. Based on the decomposition analysis for deriving emission drivers, Jotzo et al. (2012) already expected the surge in 2010 emissions to be temporary.
The fact that global emissions have continued the historical growth rate seems remarkable, at first sight, considering that in many OECD countries CO2 emissions in fact decreased (in the EU27 by 3% and in the United States and Japan by 2%) due to weak economic
conditions in many countries, mild winter weather in several countries and high oil prices. The European Union saw a 10% decrease in natural gas consumption (BP, 2012), the largest decline on record. This is remarkable, because one third of the European gas consumption is normally used for space heating. In addition, the companies covered by the EU Emissions Trading System (EU ETS) reported 2.0% less CO2 emissions in 2011 than in 2010, for more than 11,000 installations that cover more than 40% of the EU’s CO2 emissions (EC, 2012a). High oil prices affected fuel consumption, particularly in the United States, where average petrol prices jumped 28% in 2011 (even more than in 2008 when oil prices soared) (EIA, 2012a,d). However, even more important is the fact that CO2 emissions from OECD countries currently account for only one third of global emissions. China and India account for the same share and their emissions increased by 9% and 6%, respectively, in 2011. Although all developing countries together increased their emissions on average by 6%, the increases in China and India caused by far the largest increase in global emissions of 1.0 billion tonnes in 2011.
CO2 emissions from the cement clinker production process (the largest source of non-combustion-related CO2 emissions, contributing 4% to the global total) increased globally by 6%, mainly due to an 11% increase in China. The much smaller amount of global CO2 emissions from gas flaring did not change significantly in 2011, with the largest increases occurring in the United States and Russia, and the largest decrease occurring in Libya.
TWO TWO
The uncertainty in these figures varies between countries, from 5% to 10% (95% confidence interval), with the largest uncertainties for data on countries with fast changing or emerging economies, such as the Russian Federation in the early 1990s and for China since the late 1990s, and for the most recent statistics, based on Marland et al. (1999), Tu (2011), Andres et al. (2012) and Guan et al. (2012). Moreover, newly published statistics are often subject to revisions later. Therefore, for China and the Russian Federation, we assume 10% uncertainty, whereas for the European Union, the United States, India and Japan, a 5% uncertainty is assumed. Our preliminary estimate for total global CO2 emissions in 2011 is believed to have an uncertainty of about 5% and the increase of 2.9% may be accurate to within 0.5% (see Section A1.3 in Annex 1 for more details).
2.2 Large regional differences:
emissions soar in China and India
and decrease in OECD countries
OECD and EIT countries
The strong economic recovery in 2010 in most OECD-19901 countries did not continue in 2011. In Europe, CO
2 emissions from industries regulated by the EU Emissions
Trading System (EU ETS) decreased in 2011 by 2%, after an increase of 3% in 2010 and an exceptional decline in CO2 emissions of 12% in 2009 (EC, 2012). In the United States, industrial emissions from fuel combustion increased by 0.4% in 2011, after a 5% jump in 2010 and steep declines of 3% and 7% in 2008 and 2009, which were mainly caused by the recession in 2008–2009, high oil prices compared to low fuel taxes, and an increased share of natural gas (EIA, 2012a,b). Total emissions in the European Union (EU27) decreased in 2011 by 3% to 3.8 billion tonnes, and in the United States by 2% to 5.4 billion tonnes. In 2011, CO2 emissions also decreased in Japan by 2% to 1.2 billion tonnes, whereas CO2 emissions increased in, for example, Australia (by 8%) and Canada (by 2%) as well as in Spain (by 1%). In Russia, emissions increased by 3% to 1.8 billion tonnes. In other countries with Economies In Transition (EIT), emissions also increased, such as in the Ukraine by 7%. Total CO2 emissions for all industrialised countries that have quantitative greenhouse gas mitigation targets under the Kyoto Protocol decreased in 2011 by 0.7% (including the United States, which did not ratify the Kyoto Protocol) (see Table A1.2).
China and India
Since 2002, annual economic growth in China accelerated from 4% to 11%, on average. CO2 emissions increased by 150% in China, and in India by 75%. Since the end of 2008, China has implemented a large economic stimulus package that helped also to effectively avoid a decrease in annual economic growth, as suffered by many countries during the global recession of 2008–2009. This package was aimed at mitigating the decline in economic
Figure 2.1 1990 1994 1998 2002 2006 2010 2014 0 10 20 30 40 1000 million tonnes CO2 International transport Developing countries
Other developing countries Other large developing countries China
Industrialised countries (Annex I) Other Economies In Transition (EIT) Russian Federation
Other OECD1990 countries Japan
EU12 (new Member States) EU15
United States
Global CO2 emissions per region from fossil fuel use and cement production
Source: EDGAR 4.2 (1970–2008); IEA, 2011; USGS, 2012; WSA, 2012; NOAA, 2012
1 Here, the OECD composition of 1990 is used (i.e. without
Mexico, South Korea, Czech Republic, Slovakia, Hungary and Poland).
TWO
growth and also included investment in transport infrastructure and in rebuilding Sichuan communities devastated by the 2008 earthquake. In 2011, China’s CO2 emissions jumped 9% to 9.7 billion tonnes. This increase is consistent with the increase in thermal power
generation of 14.7% (mostly in coal-fired power stations), in steel production of 7.3% (also a large coal user) and in cement production of 10.8% reported by the National Bureau of Statistics of China (NBS, 2012). A more detailed discussion on the uncertainty in Chinese fuel
consumption data as reported by different sources is presented in Annex 1, Section A1.3. This discussion, which includes conclusions from recent literature on the accuracy of China’s CO2 emissions (Tu, 2011; Andres et al., 2012; Guan et al., 2012), led to the conclusion that the
uncertainty in our estimates would be about 5% for most industrialised countries, and for China this would be in the range of 10%.
India, where domestic demand makes up three quarters of the national economy (Damadaram, 2011), is also relatively unaffected by the global financial downturn. India was hardly affected by the global recession because it stimulated the already high share of domestic
consumption in total national expenditure, instead of raising domestic investments in the infrastructure as was done in China to offset the steep decline in the exports-to-GDP ratio. Emissions continued to increase in 2011 by 6% to 2.0 billion tonnes of CO2. India is the fourth largest CO2 emitting country, following the EU27, and well ahead
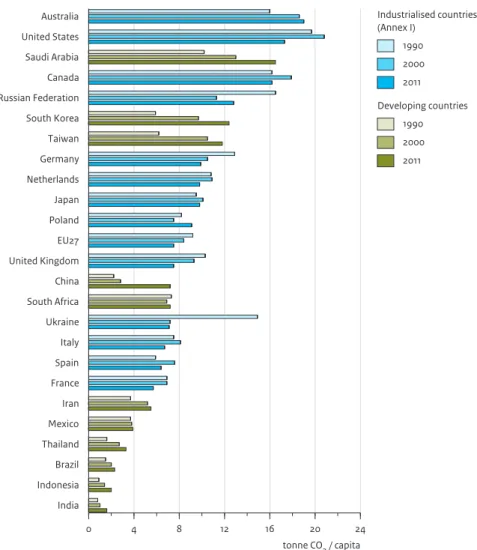
Figure 2.2 China United States EU27 India Russian Federation Japan Germany South Korea Canada Indonesia United Kingdom Saudi Arabia Brazil Mexico Australia Iran Italy South Africa France Poland Ukraine Spain Taiwan Thailand Netherlands 0 2000 4000 6000 8000 10000 million tonnes CO2 Industrialised countries (Annex I) 1990 2000 2011 Developing countries 1990 2000 2011
CO2 emissions per country from fossil fuel use and cement production
Source: EDGAR 4.2 (JRC/PBL, 2011); IEA, 2011; USGS, 2012; WSA, 2012; NOAA, 2012
TWO TWO
of Russia, which is the fifth largest (Figure 2.2). Note that most European countries listed are also part of the EU27; they are shown for comparative purposes.
Other developing countries
After the economic recovery in most other developing countries following the recession in 2009, CO2 emissions followed suit in 2010 with large increases. However, in 2011 CO2 emissions increased much less. Total CO2 emissions in the other developing countries increased by almost 2% in 2011, down from the large jump of 7% in 2010, following the economic recovery in these countries after the global recession in 2009. Of the larger countries, Saudi Arabia’s CO2 emissions in 2011 jumped 7%, and Brazil and South Korea saw increases of 3%.
2.3 Comparison between emissions
in the various countries
Although emissions in China and other developing countries have increased very rapidly, in recent years, in relative and in absolute figures, the picture is different for CO2 emissions per capita (Table 2.1 and visualised in Figure 2.3) and per unit of GDP (Figure 2.4). Since 1990, in China, CO2 emissions per capita increased from 2.2 to 7.2 tonnes, while they decreased in the EU272 from 9.2 to 7.5 tonnes per capita and in the United States from 19.7 to 17.3 tonnes per capita.
Figure 2.3 Australia United States Saudi Arabia Canada Russian Federation South Korea Taiwan Germany Netherlands Japan Poland EU27 United Kingdom China South Africa Ukraine Italy Spain France Iran Mexico Thailand Brazil Indonesia India 0 4 8 12 16 20 24 tonne CO2 / capita Industrialised countries (Annex I) 1990 2000 2011 Developing countries 1990 2000 2011
CO2 emissions per capita from fossil fuel use and cement production
Source of population data: UNPD, 2010 (WSS Rev. 2010)
CO2 emissions per capita in 1990, 2000 and 2011, in the top 25 CO2-emitting countries
TWO
The trends in CO2 emissions per inhabitant of the top 5 emitting countries are shown in Figure 2.5. These trends reflect a number of factors including the large economic development in China, structural changes in national and global economies, the impacts of major economic downturns in the Russian Federation in the early 1990s and in the United States in 2008 and 2009, and the impact of climate and energy policies. Factors that also have contributed to the emission decrease in the United States, since 2007, are high oil prices with a relatively large impact on retail prices due to low fuel taxes and an increased share of natural gas in total national fossil fuel consumption of 3 percentage points since 2007 (EIA, 2012a,b). The EU saw a smoother decrease in emissions
during the recession years, among other things, because of the high fuel taxes, which dampened the impact on retail prices of strong international variations in oil prices. The two dashed lines in Figure 2.5 represent the range of CO2 emissions per capita (minimum and maximum) spanned by the major industrialised countries (the Annex I countries listed in Figure 2.2), the highest levels being those in Australia and the United States, and the lowest those in France.
In 2011, China’s average per capita CO2 emissions increased by 9% to 7.2 tonnes CO2. Taking into account an uncertainty margin of 10%, this is similar to the European Union’s 2011 per capita emissions of 7.5 tonnes, the year
Figure 2.4 Ukraine China Russian Federation Saudi Arabia South Africa Australia Poland India Iran Indonesia Canada South Korea Thailand United States Taiwan Japan Mexico Germany EU27 Netherlands Italy Spain United Kingdom Brazil France 0 400 800 1200 1600 2000 2400
tonne CO2 / USD 2005 (PPP adjusted)
Industrialised countries (Annex I) 1990 2000 2011 Developing countries 1990 2000 2011
CO2 emissions per unit of GDP from fossil fuel use and cement production
Source of GDP data: World Bank, 2012; IMF, 2012.
TWO TWO
in which the EU saw a 3% decrease in emissions. However, the sectoral shares of, notably, the
manufacturing industry and transport are quite different (IEA, 2011b). Due to its rapid economic development, China, the world’s most populous country, is now well within the 6 to 19 tonnes/person range spanned by the largest industrialised countries (Annex I countries under the Kyoto Protocol, including the United States (which did not ratify the protocol)). In 2011, the United States was one of the largest CO2-emitting countries, with 17.3 tonnes per capita. Although per capita emissions in India have doubled since 1990, it is clear that with 1.6 tonnes in 2011 the country’s per capita emissions are still much lower than those in industrialised countries.
When comparing CO2 trends between countries over a decade or more, also trends in population numbers should be taken into account, since population growth rates differ considerably, also between Annex I countries, with the highest growth since 1990 seen in Australia (+32% between 1990 and 2011) and in the United States and Canada (both +24%). The population of the EU and Japan, however, increased much less (by 7% and 3%, respectively) and Russia saw a decline of 4% (see Table A1.2).
2.4 Gas flaring emissions and
hydraulic fracturing technology
When natural gas is co-produced during conventional or unconventional oil production and cannot be marketed, this ‘associated’ gas is either vented or flared. Venting or flaring occurs in areas that are remote from market demand and from gas transport infrastructure. Both practices lead to the emissions of greenhouse gases: methane from venting and CO2 from flaring.
The global CO2 emissions of about 250 million tonnes from flaring of unused gas during oil production – comparable in magnitude with total CO2 emissions in a medium-sized country such as Spain – did not significantly change in 2011, after a steady decrease by about a quarter since 2003. The estimates on natural gas flaring were derived from DMSP-OLS and MODIS satellite measurements, analysed by the US National Oceanic and Atmospheric Administration (NOAA) and supported by the Global Gas Flaring Reduction Partnership (GGFR), a public-private partnership which is led by the World Bank. The night-time lights from gas flares observed by the satellites provide an estimate of the amounts of gas flared, when related to reported flaring volumes available from the GGFR Partnership (Elvidge et al., 2009a). Countries with the largest satellite-observed flaring emissions are Russia and Nigeria, with shares of total flaring emissions of about one quarter and one tenth, respectively. These two countries contributed also most to the global emission decrease over the last decade,
Figure 2.5 1990 1994 1998 2002 2006 2010 2014 0 5 10 15 20 25
tonnes CO2 per capita
Industrialised countries (Annex I) United States
Russian Federation European Union (EU27) Annex I range Developing countries
China India Uncertainty
CO2 emissions per capita from fossil fuel use and cement production in top 5 emitters
Source: EDGAR 4.2 (1970-2008); UNPD, 2010
Annex I range (grey dashed lines): indicates the minimum and maximum per capita values spanned by major industrialised countries as listed in Figure 2.2. Uncertainty margins: 5% for the United States, EU27 and India; 10% for the Russian Federation and China (see Section A1.3)
TWO
followed by Iran, Iraq and the United States (NOAA, 2011, 2012, pers. comm.; World Bank, 2012). In Russia and Nigeria flaring emissions did not change much in 2011. However, satellite information shows that flaring emissions in the United States are on the rise, with a steep increase of 50% in 2011, making the country now the fifth largest gas flaring country. The main cause of the increase is the country’s recent massive increase in the use of hydraulic fracturing, or fracking, for shale oil production and the ensuing flaring of co-produced gas (Nicholson, 2012); in particular, in North Dakota and Texas. In North Dakota, natural gas production has more than doubled since 2005, largely due to associated natural gas from its growing oil production, and more than one third of the total amount of gas produced is either flared or otherwise not marketed (EIA, 2012c). Recently, the governments of these countries announced policy measures aimed at reducing CO2 emissions from gas flaring. The US Environmental Protection Agency announced that drillers that use fracking to extract natural gas and oil, from January 2015 onwards, will be required to use equipment to capture the emissions, a process known as ‘green completion’ (US EPA, 2012). Until that time, they may burn off or flare the gas (Reuters, 2012a). The Russian Ministry for Natural Resources and Ecology has announced that oil companies, on average, utilise 76% of the associated gas they produce. A target of 95% use of produced gas was set for 2012, and companies will be fined if they flare more than 5%. The ministry expects that the 95% target will be met by 2014 (Reuters, 2012c; Moscow Times, 2012). In Nigeria, a newly drafted Petroleum Industry Bill requires oil companies to stop the flaring and venting of associated gas by the end of this year, except under exceptional and temporary circumstances, or they will be fined an amount that is not less than the value of the gas. However, many foresee that implementation of the bill will be difficult, let alone meeting the deadline, since Nigeria already has a law that prohibits flaring, but that was not effectively
implemented (Reuters, 2012b; Ukala, 2011).
Shale gas fracking
Recently, the United States also expanded shale gas fracking and in 2011 became the largest gas producer of the world. Although natural gas emits less CO2 than coal and oil when combusted, there are concerns from life-cycle analyses that the methane emissions from fracking could largely offset this benefit if escaping gas is not captured (Howarth et al., 2011; Tollefson, 2012), whereas other studies criticise these conclusions (e.g. Cathles et al., 2012). The uncertainties in these assessments are large, as all recent methane emission estimates for unconventional gas production are based on sparse and poorly documented data (Howarth et al., 2011, 2012), with
the exception of the emission rate reported by Petron et al. (2012), which is based on measured fluxes at one site during the course of a year. However, results from the NOAA study by Petron et al. (2012) cannot easily be extrapolated to other sites, as geological circumstances and actual operating practices may be very different from those at study’s measurement location (Sgamma, 2012). In addition, the life-cycle greenhouse gas emissions of shale gas also depend on the methane emissions from the gas transport and distribution system, for which, in the United States, the estimates also vary by a factor of two or more (Howarth et al., 2012). The new US EPA regulation mentioned above requires that the natural gas that currently escapes to the air is captured and either used or sold. The regulation also applies to methane emissions that are currently vented as a result of shale gas fracking.
In Europe, some exploratory drilling has taken place in Sweden, Poland, France and Germany. According to Philippe & Partners (2011), the Swedish Mining Inspectorate has granted one exploitation concession, but so far without any exploitation activities. In France, exploration authorisation for hydraulic fracturing was abrogated twice, on the basis of the Prohibition Act. Hydraulic fracturing is currently taking place in Poland and has been tested at one location in Germany. Concern for the environmental impact of the shale gas activities resulted in shale gas impact assessment studies, leading in France to a legal ban on hydraulic fracturing. In Sweden, the existing Minerals’ Act is under review, in terms of transparency and the participatory process of authorising shale gas projects. Poland, highly dependent on Russia for its energy resources, has granted most authorisations and has the most developed exploration activities on its territory.
In conclusion, the knowledge on current and future emissions from flaring and venting related to shale oil and shale gas fracking remains highly uncertain, but may potentially be of high importance.
2.5 Cement production and other
non-combustion sources
Globally, both cement production and steel production are indicators of national construction activity, with cement mainly used in building and road construction, and steel also in the construction of railways, other infrastructure, ships, and machinery. CO2 emissions are generated by carbonate oxidation in the cement clinker production process, the main constituent of cement and the largest of non-combustion sources of CO2 from
TWO TWO
industrial manufacturing, contributing about 4% to total global emissions. Fuel combustion emissions of CO2 related to cement production are of the approximate same level, so, in total, cement production accounts for roughly 8% of global CO2 emissions; in this section, however, we only discuss the emissions from carbonate oxidation.
Cement production
The world’s cement production is heavily dominated by China, with an estimated share of 57% in global emissions from cement production, followed by India with a more than 5% share. The following 7 countries have shares of between 1.5% and 2%: the United States, Turkey, Japan, Russia, Brazil, Iran and Vietnam. With a continuing trend in China, global cement production increased by 6% in 2011. China increased cement production by 11% and was responsible for 57% of the world’s cement produced in 2011 (NBS, 2012). Production in Germany, Brazil and Russia increased in 2011 by 10%, 6% and 3% in 2011, respectively, according to preliminary estimates by USGS (2012). Cement production is estimated to have increased in 2011 in ten countries and decreased in seven, among which Spain (-12%), Japan (-9%), Egypt (-6%) and Italy (-4%).
However, emissions are not directly proportional to cement production level, since the fraction of clinker – in this industry the main source of CO2 emissions – in cement tends to decrease over time. A study by the World Business Council on Sustainable Development (WBCSD, 2009) has shown that the share of blended cement that has been produced in recent years in most countries has considerably increased relative to that of traditional Portland cement. Consequently, average clinker fractions in global cement production have decreased to between 70% and 80%, compared to nearly 95% for Portland cement with proportional decrease in CO2 emissions per tonne of cement produced. Both non-combustion and combustion emissions from cement production occur during the clinker production process, not during the mixing of the cement clinker. This has resulted in about 20% decrease in CO2 emissions per tonne of cement produced, compared to in the 1980s. At that time, it was not common practice to blend cement clinker with much other mixing material, such as fly ash from coal-fired power plants or blast furnace slag. According to EDGAR 4.2 data, this yielded an annual decrease of 250 million tonnes in CO2 emissions, compared to the reference case of Portland cement production. Moreover, a similar amount has been reduced in fuel combustion for cement production and related CO2 emissions.
Iron and steel production
When looking at steel production, with related non-combustion CO2 emissions from blast furnaces used to produce pig iron and from conversion losses in coke manufacturing, China accounted for 44% of crude steel production in 2011, followed by Japan (8%), the United States (6%), Russia and India (each 5%), South Korea (4%), Germany (3%) and the Ukraine, Brazil and Turkey (each 2%). According to WSA (2012), global crude steel production rose 6.5% in 2011, compared to 10% in 2010. The 9% increase in China equated to almost one-third of the global increase in production in 2011. Production plummeted in Australia (-12%) and South Africa (-22%). In 2011, it strongly rose in Turkey (+18%), South Korea (+17%) and Taiwan (+15%). Other significant increases were seen in Italy (+8%), India (+8%), the United States (+7%), Brazil (+7%) and Russia (3%). In steel production, most CO2 is generated in iron- and steel-making processes that use coke ovens, blast furnaces and basic oxygen steel furnaces. However, the share of electric arc furnaces and direct reduction in secondary and primary steel making, which generate much less CO2 per tonne of crude steel produced, is increasing over time (WSA, 2012). Lime and ammonia production, other industrial sources of CO2 emissions, increased globally by 6% and 4%, respectively, in 2011 (USGS, 2012).
2.6 Cumulative CO
2emissions and
climate mitigation targets in the
21st century
Globally, CO2 emissions increased by 3% in 2011, reaching an all-time high of 34 billion tonnes, with CO2 emissions from OECD countries accounting for one third of global emissions, and China and India together for another third. In 1990, the industrialised countries with a mitigation target for total greenhouse gas emissions under the Kyoto protocol (including the United States, which did not ratify the protocol) had a share in global CO2 emissions of 68%, versus 29% for developing countries. In 2011, the shares were 55% for developing countries and 41% for mature industrialised countries. The remaining 3% is attributed to international air and sea transport. The top 6 emitting countries and regions, including the European Union (EU27), produce 70% of total global emissions, whereas the top 25 emitting countries are responsible for more than 80% of total emissions (Figure 2.2).
We observed a growth of 50% in global anthropogenic CO2 emissions in the 20 years since 1992, when the UN Earth Summit was held in Rio de Janeiro. This growth in emissions caused an increase of 10% in the CO2
TWO
concentration in the atmosphere, from 356 to 392 ppm. Since 2000, an estimated total of 420 ± 50 billion tonnes of CO2 was cumulatively emitted during human activities (including emissions from deforestation). In the scientific literature, one criterion discussed for achieving the 2 oC maximum global warming target with a reasonable probability, is that the cumulative emissions over the five decades from 2000 to 2050 should not exceed 1,000 to 1,500 billion tonnes of CO2 (Meinshausen et al., 2009). The agreements reached at the UNFCCC climate negotiations, in Copenhagen in 2009, Cancún in 2010 and Durban in 2011, all indicate that countries should take urgent action to reduce global greenhouse gas emissions, in order to limit the increase in global average temperature to less than 2 oC relative to pre-industrial levels. Our data show that the cumulative emissions in the first decade of this century are already make up a substantial share of the maximum cumulative emissions not to be exceeded to achieve the 2 oC target. If the current global CO
2 emission growth rate would continue, cumulative emissions would exceed this criterion within the next two decades. However, it is uncertain how global society will develop over time, which economic and technological trends will continue; for example, regarding the shares of nuclear power and renewable energy sources. Without the use of modern renewable energy sources (e.g. wind, solar, biofuel, hydropower), present annual global CO2 emissions could potentially have been about 5% higher (see Section 3.3 for more details).
As part of the Cancún Agreements (2010), 42 developed countries submitted quantified economy-wide emission reduction targets for 2020, and 45 developing countries, including the seven major emitting countries, pledged mitigation action plans. Den Elzen et al. (2012) analysed the emission levels that would be expected to result from these pledged actions. They concluded that the emission gap between the emission levels resulting from the pledges (51 to 55 billion tonnes CO2 equivalent) and those consistent with achieving the 2 °C target ranges from 5 to 9 billion tonnes CO2 equivalent, for a medium chance of achieving the 2 oC climate goal. These updated estimates are in line with other studies, such as by UNEP (2011). Den Elzen et al. (2012) describe a selected set of options that could result in an additional emission reduction of 4.1 billion tonnes CO2 equivalent, which would narrow the gap. Very recently, Blok et al. (2012) estimated the impact of 21 major initiatives and claim that together these could stimulate sufficient reductions by 2020 to bridge this global greenhouse gas emission gap.
THREE
Trends in energy
consumption
3.1 Trends in fossil fuel consumption
Fossil fuel combustion accounts for about 90% of total global CO2 emissions, excluding those from forest fires and the use of wood fuel (EDGAR 4.2, JRC/PBL, 2011). As the global economy continued to grow in most countries in 2011, global energy consumption saw a growth of 2.5%, which is roughly in line with the average growth over the last decade (BP, 2012). Global fossil oil consumption increased by about 2.9% in 2011 (corrected for biofuels). China’s oil consumption increased by 5.5%, below the 10-year average, and accounted for two thirds of the growth in trade in 2011, with oil imports increasing by 13%. The CO2 emission trends in OECD and non-OECD countries are diverging, with a 1.2% decline in OECD countries, the fifth decrease in the past six years versus a 2.8% increase in non-OECD countries.
Natural gas consumption increased globally by 2.2% in 2011, with below average consumption in all regions, except for North America, where low prices drove robust growth (BP, 2012). The largest growth took place in China (+22%), Saudi Arabia (+13%) and Japan (+12%). However the European Union saw the largest decline on record, with -11%, mainly due to warm weather, a weak economy, high gas prices and continued growth in renewable electricity production. See Annex 3 for the regional impact of winter temperatures in 2010 and 2011 on the trend in natural gas used for space heating.
Coal consumption increased globally by 5.4 % in 2011, which is an above average growth, and accounts for 30.3% of global energy consumption, the highest share since 1969. Coal consumption in China increased by 9.7% in 2011, accounting for 49% of global coal use and representing more than three quarters of global consumption growth in 2011. This increase in fuel consumption in 2011 was mainly driven by the increase in building construction and expansion of infrastructure, as indicated by the growth in the cement and steel
production. Coal import by China increased by 10%, making China the world’s largest coal importer,
overtaking Japan (Reuters, 2012d; Tu and Johnson-Reiser, 2012; China Import Magazine, 2012). China’s coal import volume, to a large extent, is determined by the domestic and international coal price difference. In addition, domestic use of coal produced in China faces a transportation bottleneck, due to transport capacity limitations to the road and rail infrastructure used for transporting the coal from the mines to the consumption areas (Tu, 2011). Coal imported from overseas may help to ensure a stable supply of coal, especially during the peak demand season. Please note that the accuracy of China’s coal consumption data is estimated at about 5% to 15%, with higher uncertainties expected regarding the data on the last 15 years. Annex A1.3 provides more details in a discussion on uncertainty. Coal consumption in India increased by 8%. Consumption in OECD countries decreased by 1.1%, with declines of 5% in the United States and Japan, and increases in the EU (+4%), driven by
THREE THREE
Poland (+6%), Spain (+51%, after a similar decrease in 2009), Bulgaria (+24%) and Italy (+8%).3.2 Trends in renewable and nuclear
energy sources
Of the Annex I countries, Japan made the largest change to its fuel mix for electricity production, in an attempt to ensure higher nuclear safety in the wake of the
Fukushima accident of 11 March 2011. Before the accident, Japan was the third largest consumer of nuclear fuel, following the United States and France, with a nuclear share in electricity production averaged for 2010 at about 29%. The 280 TWh in 2010 generated by the 54 nuclear reactors (WEC, 2011) have, since May 2012, been reduced to zero, and subsequently partially compensated by power cuts and boosted gas-fired power generation. This implies that in 2011 Japan imported 12.2% more liquefied natural gas than in 2010. Moreover, with the shutdown of the last active nuclear power plant, Japan leaves a capacity of 44 GWe nuclear electricity generation unused. In July 2012, the first nuclear facility was brought back into operation.
Germany also faced a considerable change to its fuel mix for electricity production in 2011, in the aftermath of Fukushima, shutting down 8 nuclear power plants in March 2011 with a combined capacity of 8.5 GWe, reducing the nuclear share in electricity production from 22% before March 2011 to 18% today (Reuters, 2011). This has since been compensated with a rising share of renewables in the energy mix from 16% in 2010 to almost 20% in 2011 (BDEW, 2012). Above all, photovoltaic capacities expanded appreciably in 2011, climbing from 17.3 GW to 25.8 GW and contributing 3% to the power generation in 2011, or 1% more than in 2010. The remaining difference in share is taken up by coal-fired power plants (Kempfert, 2011). At the moment, more than 20 new coal-fired power plants are being planned or already under construction in Germany; together, these plants would achieve a total output of 10 gigawatts and could, in terms of power supply, replace the nuclear power plants that are still operational.
Total renewable sources have grown to supply 16.7% of global final energy consumption, including traditional biofuels, such as fuel wood (UNEP, 2012). Renewables accounted for almost half of the estimated 208 gigawatts (GW) of electric capacity added globally in 2011. By the end of 2011, total renewable power capacity worldwide exceeded 1,360 GW, up 8% over 2010, and supplied an estimated 20.3% of global electricity. At least 118 countries, more than half of which are developing
countries, had renewable energy targets in place by early 2012, up from 96 one year before, although some slackening of policy support was seen in developed countries. In the United States, renewables provided 12.7% of total domestic electricity in 2011, up from 10.2% in 2010, and accounted for about 11.8% of domestic primary energy production (a similar amount as nuclear power). In Germany, renewable sources met 12.2% of total final energy consumption and accounted for 20% of electricity consumption (up from 17.2% in 2010) (UNEP, 2012).
Total global wind power capacity was 238 GW at the end of 2011, an increase of more than 20% over 2010, lower than the average of about 28% over the last 10 years (GWEC, 2012). In 2011, most wind power capacity was installed in Asia (52%), ahead of Europe (25%) and North America (20%). However, Europe still has the largest wind power capacity in the world, with 40% of the total in 2011, but since it has been attracting less than a quarter of the newly installed capacity, it could be overtaken by Asia in 2012. China is the world’s largest wind power market, but new installations levelled off for the first time in 2011. China added 17,600 MW of new wind capacity in 2011, resulting in a total of 62.4 GW installed at the end 2011. Wind represented 1.5% of the total power generated in China last year. According to GWEC (2012), the grid remains the most serious challenge to wind development in China. One of the problems in the past was that the local grid infrastructure did not expand quickly enough, causing connection delays. India added 3,000 MW of new capacity to reach a total of 16.1 GW, accounting for about 6% of electricity generation, up from 2% in 1995. During 2011, 9,600 MW of new wind power was installed in the European Union, the same amount as in 2010, resulting in a total capacity of 93.9 GW. Germany installed 2,100 MW of new capacity, the United Kingdom 1,300 MW, followed by Spain (1,000 MW), Italy (950 MW), France (830 MW), Sweden (763 MW) and Romania (520 MW). The total wind power capacity installed in the EU by the end of 2011, on average, will produce 200 TWh of electricity, which is equivalent to 6.3% of total EU electricity consumption (up from 5.3% in 2010). The United States added 6,800 MW wind capacity in 31 States in 2011, a 30% increase from 2010, bringing total wind capacity to 46.9 GW.
Total global solar photovoltaic (PV) capacity increased in 2011 by 75% to about 69.2 GW, and could produce, on average, 85 terawatt hours (TWh) of electricity every year (EPIA, 2012). PV, after hydropower and wind power, currently is the third most important renewable energy in terms of globally installed capacity. Europe accounts for three quarters of the newly installed capacity (21.9 GW), adding another 75% to the already installed PV capacity in the EU. China more than doubled its installed capacity,
THREE
adding 2.2 GW; 1.8 GW from large-scale ground installations and 0.4 GW from rooftop projects. The global total of 29.7 GW installed in 2011 is almost double the capacity installed in 2010 (16.2 GW) and was dominated by rapid growth in the EU, led by Italy (9.3 GW) and Germany (7.5 GW), followed by France (1.7 GW) and the United Kingdom (0.8 GW). By comparison, the United States and Japan installed 1.9 and 1.3 GW, respectively, and India 0.5 GW. At the beginning of 2012, Germany and Italy together represent more than 50% of the world’s installed capacity.
Hydropower output increased by 1.6% in 2011, the weakest growth since 2003. The top 5 hydropower producers in 2011 were China (20% share), Brazil (12%), Canada (11%), the United States (10%) and Russia (5%). Heavy rainfall drove strong growth in North America with a 5% increase in the United States, the strongest increase on record, and 19% increase in India. Other increases were seen in Canada and Brazil (both +7%). These were offsetting drought-related declines; in Europe of 16% and China of 4%. Of the 62% increase in hydropower output since 1992, China accounted for almost half and Brazil for almost one fifth (BP, 2012).
Global biofuel production stagnated, rising by just 0.7%, the weakest annual growth since 2000 (BP, 2012). In the United States, growth in consumption (+6%) slowed as the share of ethanol in petrol approached the ‘blend wall’, the practical limit of the fraction of ethanol in petrol that can be used in most modern regular petrol-fuelled car engines, and Brazil’s consumption had the largest decline (-13%) due to a poor sugar harvest. In the EU, biofuel consumption decreased by 3% in 2011, driven by large decreases in France (-14%), the United Kingdom (-24%) and Poland (-15%), although partly offset by increases in Italy, Romania and Slovakia. Current fuel ethanol and biodiesel use represent about 3% of global road transport fuels and could be expected to have reduced CO2
emissions of a similar percentage if all biofuel had been produced sustainably. In practice, however, net reduction in total emissions in the biofuel production and
consumption chain is between 35% and 80% (Eijkhout et al., 2008; Edwards et al., 2008). These estimates also exclude indirect emissions, such as those from additional deforestation (Ros et al., 2010). An example of the latter is biodiesel produced from palm oil from plantations on deforested and partly drained peat soils. Thus, the effective reduction will be between 1% and 2%, excluding possible indirect effects.
Renewable energy supply expanding at accelerated
speed, reducing emissions by 5%
The trends in CO2 emissions reflect the impact of policies aimed to improve energy efficiency and to increase the use of nuclear or renewable energy sources over that of fossil fuels. In this context, we can observe that some CO2 mitigation measures are increasingly applied in our society. One of the main CO2 reduction options is the use of ‘new’ renewable energy sources (excluding
hydropower), such as solar and wind energy and biofuels. Although still very small, their share is increasing with accelerating speed: it took 12 years since 1992 to double the share from 0.5% to 1%, but only 6 more years to double it again to 2.1% in 2011 (BP, 2012). These shares are based on the BP convention of 38% average thermal power conversion efficiency for converting renewable electricity production to primary energy. Using an emission factor mid-way between the IPCC’s default values for coal and natural gas (effectively a factor for diesel fuel), this represents about 800 million tonnes CO2 in potentially avoided emissions in 2011 that would have been globally emitted from fossil fuel power generation and road transport. This amount is similar to the current CO2 emissions from Germany. Including hydropower, total renewable energy sources presently supply 8.5% of all energy. Total potentially avoided emissions in 2011 are estimated at roughly 1.7 billion tonnes CO2 when including the hydropower capacity added since 1992. Thus, present global CO2 emissions, potentially, could have been about 5% higher without the use of these renewable energy sources. About one third of these potentially avoided emissions relates to China and one eighth to Brazil, both mainly due to the increased use of hydropower. If these and other main CO2 reduction measures, such as energy savings, are going to be applied on a large scale, the current rate of increasing emissions will slow down and the probability that the 2 oC target will be achieved (see Section 2.6) may increase, substantially.
Annex 1
Methodology and data sources for the
2008–2011 period
A1.1 Methodology and data sources
The recent trends were estimated by PBL using trends in most recent data on fossil fuel consumption for the 2009–2011 period from the BP Review of World Energy 2011 (BP, 2012). For cement production, preliminary data over the 2009 –2011 period were used from the US Geological Survey (USGS, 2012) except for China for which use was made of National Bureau of Statistics of China (NBS) (2009, 2010, 2011).
For the 2008–2011 trend estimate, the following procedure was used. Sources were disaggregated into five main sectors as follows (with the defining IPCC source category codes from IPCC (1996) in brackets):
(1) fuel combustion (1A+international marine and aviation bunkers);
(2) fugitive emissions from fuels (1B);
(3) cement production and other carbonate uses (2A); (4) non-energy/feedstock uses of fuels
(2B+2C+2D+2G+3+4D4);
(5) other sources: waste incineration, underground coal fires and oil and gas fires (1992, in Kuwait) (6C+7A). For these main source sectors the following data was used to estimate 2008–2011 emissions:
(1) Fuel combustion (IPCC category 1A + international bunkers):
• For energy for 2008–2009, the most recent detailed CO2 estimates compiled by the International Energy Agency (IEA) for fuel combustion by major fossil fuel type (coal, oil, gas, other) for these years (IEA, 2011) to calculate the trend per country and for international air and water transport.
• For energy for 2009–2011, the BP Review of World Energy is used to calculate the trend of fuel consumption per main fossil fuel type: coal, oil and natural gas (BP, 2012). For oil consumption, the BP figures were corrected for biofuel (fuel ethanol and biodiesel) which are included in the BP oil consumption data. See Annex 2 for more details.
• ‘Other fuels’, which are mainly fossil waste combusted for energetic purposes, were assumed to be oil
products and the trend was assumed to follow oil consumption per country.
• For the trend in international transport, which uses only oil as a fuel, we applied the trend in oil
consumption per country according to BP for the sum of 10 and 12 countries which contributed most to global total marine and aviation fuel sales in 2008 according to IEA statistics (covering about three-quarter and half of total bunker fuel consumption, respectively). (2) Fugitive emissions from fuels (IPCC category 1B): • Fugitive emissions from solid fuel (1B1), which for CO2
refers mainly to coke production: trends per country for 2008–2011 are assumed to be similar to the trend in crude steel production for 2008–2009 from USGS (2011) and for 2009–2011 from the Word Steel Association (WSA, 2012).
• Fugitive emissions from oil and gas (1B2), which refers to leakage, flaring and venting: trends per country for 2008–2010 were estimated using the same method and data sets as used for EDGAR 4.2 for the years up to 2008, since the NOAA data set that was used provides flaring data from satellite observation for the most important 58 countries up to 2010 (NOAA/NCDC, 2011; Elvidge et al., 2009a,b), which are prepared for the World Bank’s Global Gas Flaring Reduction Partnership (GGFR, 2012). Combined with other data, the satellite data give robust information on the annual change in emissions. For 2011, the updated NOAA data set was used (NOAA, 2012, pers. comm.)
(3) Cement production and other carbonate uses (2A): • cement production (2A1)
• other carbonate uses, such as lime production and limestone use
• soda ash production and use.
CO2 emissions from cement production, which amount to more than 90% of 2A category, were calculated using preliminary cement production data for 2009–2011 published by the US Geological Survey (USGS), except for China where use was made of the National Bureau of Statistics of China (NBS) (2010, 2011, 2012). In addition, we extrapolated the trend in the emission factor due to trends in the fraction of clinker in the cement produced based on data reported by WBCSD (2009). Thus, for the 2009–2011 period, the same methodology was used as in EDGAR 4.2. For all other sources in the minerals
production category (2A), we used the trend in lime production data for 2008–2011 (USGS, 2012) as proxy to estimate the trend in the other 2A emissions. All 2011 data are preliminary estimates.
(4) Non-energy/feedstock uses of fuels (2B+2C+2D+2G+3+4D4):
• ammonia production (2B1): net emissions, i.e. accounting for temporary storage in domestic urea production (for urea application see below);
• other chemicals production, such as ethylene, carbon black, carbides (2B other);
• blast furnace (2C1): net losses in blast furnaces in the steel industry, i.e. subtracting the carbon stored in the blast furnace gas produced from the gross emissions related to the carbon inputs (e.g., coke and coal) in the blast furnace as a reducing agent, since the CO2 emissions from blast furnace gas combustion are accounted for in the fuel combustion sector (1A); • another source in metal production is anode
consumption (e.g., in electric arc furnaces for secondary steel production, primary aluminium and magnesium production) (2C);
• consumption of lubricants and paraffin waxes (2G), and indirect CO2 emissions related to NMVOC emissions from solvent use (3);
• urea applied as fertiliser (4D4), in which the carbon stored is emitted as CO2 (including emissions from limestone/dolomite used for liming of soils). For the feedstock use for chemicals production (2B), ammonia production from USGS (2012) was used (2011 data are preliminary estimates). Since CO2 emissions from blast furnaces are by far the largest subcategory within the metal production category 2C, for the trend in crude steel production for 2008–2009 USGS (2011) and for 2009–2011 World Steel Association (WSA, 2012) was used to estimate the recent trend in the total emissions. For the very small emissions in categories 2G and 3, the 2005–2008 trend was extrapolated to 2011. For simplicity, it was assumed that the small soil liming (4D4) emissions follow the gross ammonia production trend.
(5) Other sources (6C+7A):
• waste incineration (fossil part) (6C) • fossil fuel fires (7A).
The 2005–2008 trend was extrapolated to 2011 for the relatively very small emissions of waste incineration (6C) and underground coal fires (mainly in China and India) and oil and gas fires (1992, in Kuwait) (7A).
CO2 emissions from underground coal fires in China and elsewhere have been included in EDGAR 4.2, although the magnitude of these sources is very uncertain. Van Dijk et
al. (2009) concluded that CO2 emissions from coal fires in China are at around 30 Tg CO2 per year. This is equivalent to about 0.3% of China’s CO2 emissions in 2011.
A1.2 Other sources of CO
2emissions: forest and
peat fires and post-burn decay
The trend estimates of CO2 emissions do not include CO2 emissions from forest fires related to deforestation/ logging and peat fires and subsequent post-burn emissions from decay of remaining above ground biomass and from drained peat soils. Although they are also significant but highly uncertain, CO2 emissions from the decay of organic materials of plants and trees that remain after forest burning and logging are also not included. Annual CO2 emissions from peat fires in Indonesia estimated by Van der Werf et al. (2008) indicate that emissions from peat fires vary most around 0.1-0.2 billion tonnes per year, except for peak years due to an El Niňo. For the very exceptional 1997 El Niňo, they estimated peat fire emissions at 2.5 billion tonnes CO2. Joosten (2009) estimated global CO2 emissions from drained peatlands in 2008 to amount 1.3 billion tonnes CO2, of which 0.5 billion tonnes from Indonesia.
A1.3 Data quality and uncertainties
For industrialised countries, total CO2 emissions per country, according to EDGAR 4.2, for the 1990–2008 period, are generally within 3% of officially reported emissions, except for a few economies in transition (EIT) (see examples provided in Table A1.1). Also most industrialised countries (Annex I) estimate the uncertainty in their reported CO2 emissions (excluding land use, IPCC sector 5) in the range of 2% to 5% (95% confidence interval, equivalent to 2 standard deviations). The uncertainty in EDGAR’s total national CO2 emissions from fossil fuel use and other, non-combustion sources is estimated at about 5% for OECD-1990 countries and around 10% for most EIT countries, such as Russia and the Ukraine. For developing countries, the EDGAR uncertainty estimates of national CO2 emissions vary between 5% for countries with a well-developed statistical systems, such as India, and around 10% or more for countries with less-developed statistical systems. This is based on the uncertainty in the fuel data discussed in the 2006 IPCC Guidelines for greenhouse gas emission inventories (IPCC, 2006) and in the variation in the carbon content per fuel type, compared with IPCC default values (Olivier et al., 2010). Moreover, energy statistics for fast changing economies, such as China since the late 1990s, and for the countries of the former Soviet Union in the early 1990s, are less accurate than those for the mature industrialised countries within the OECD (Marland et al., 1999; Olivier
and Peters (2002). For China, we assume an uncertainty of 10%, based on considerations discussed below.
CO2 emission trends over recent years, estimated using energy data published annually by BP, appear to be reasonably accurate for estimating global CO2 trends. For example, based on older BP energy data, the increase in 2005 in global CO2 emissions from fuel combustion was estimated at 3.3%, globally. With more detailed statistics by the International Energy Agency (IEA) for 2005, which became available two years later, the increase is estimated at 3.2%. At country level, differences can be larger, particularly for small countries and countries with a large share in international marine fuel consumption (bunkers) and with a large share in non-combustion fuel use.
The uncertainty in CO2 emissions from fossil fuel combustion using international statistics is discussed in detail in Marland et al. (1999) and Andres et al. (2012), and general uncertainty characteristics in global and national emission inventories are discussed in Olivier and Peters (2002). Andres et al. (2012) evaluate several studies on the uncertainty of CO2 emissions from fossil fuel use and cement production and conclude that they range from between about 3% and 5% for the United States, to between 15% and 20% for China, based on a comparison of CO2 estimates based on national coal statistics and on the sum of provincial coal statistics (Gregg et al., 2008), to estimates of 50% or more for countries with poorly maintained statistical infrastructure (Marland et al., 1999).
In recent years, the uncertainty in the CO2 estimates for China was the subject of several studies. The uncertainty
estimate by Gregg et al. (2008) was based on revisions of energy data for the transition period of the late 1990s, which may not be fully applicable to more recent energy statistics, since the revisions made by the National Bureau of Statistics of China in 2006 and 2010 (Tu, 2011). Interestingly, a recent study by Guan et al. (2012), continuing the comparison made by Gregg et al. (2008), points out the large difference between total provincial coal consumption statistics and national total statistics, whereas Tu (2011) attributes the discrepancy for a large part to the unreported coal production by small private coal mines in Shanxi in Inner Mongolia that continued producing although officially they had to shut down, together with staffing shortage at the National Bureau of Statistics of China. Tu claims that, therefore, China’s coal statistics have been seriously underreported since 1998. He also mentions that in 2006 the NBS of China made statistical revisions for the 1999–2004, which were particularly large in the years between 1999 and 2001, and once more in 2010, with smaller revisions for the 1998– 2007 period (see Figure 5.2 in Tu (2011)). The question remains whether these revisions capture all
discrepancies. Guan et al. (2012) conclude that this is not the case, stating a 1.4 billion tonnes CO2 gap for 2010, between estimates based on national coal statistics and on provincial data. Guan et al. (2012) also compare with other reported estimates for China’s CO2 emissions over the 2007–2010 period, including EDGAR 4.1 data. They show that for 2008, EDGAR CO2 emissions are one of the highest being compared and are actually almost equal to the higher estimate by Guan, based on the provincial coal statistics and for 2007 the EDGAR estimate is also closer to the higher ‘provincial’ CO2 estimate than to the estimated ‘national total’. Thus, it could be tentatively concluded that the uncertainty range of the EDGAR 4.2
Table A1.1
Differences between EDGAR national total CO2 emissions and official NIR/CRF submissions (excluding LULUCF
emissions, IPCC sector 5) (in % of NIR/CRF data) (reported uncertainty estimate cf. IPCC definition: 95% confidence interval)
Country 1990 1995 2000 2005 2008 2010 Average Reported
uncertainty
Note on uncertainty
USA -2% -3% -2% -3% -3% -3% -2% 4% for minimum: -2%
Canada -2% -2% -2% -1% -2% -0.3% -2% 2.4% for energy sector
EU27 -2% -2% -1% -2% -0.4% 0.4% -1% 2% for EU15
Russia -2% 11% 13% 13% 12% 12% 10% 4%
Ukraine 7% 25% 20% 4% 4% 5% 13% 3.7%
Japan 2% 2% 2% 3% 3% 6% 2% 1%
Australia -2% -3% 2% 8% 8% -1% 2% 4 to 5%
In total -1.4% 0.4% 0.8% 0.3% 0.6% 0.8% 0.4%