MASTER OF SCIENCE IN GEOGRAPHY
A GAMIFICATION BASED APPROACH ON INDOOR
WAYFINDING RESEARCH
Word count: 20,110
Dries De Leeuw
Student number: 01506576
Supervisor: Prof. dr. Philippe De Maeyer Assistant: Laure De Cock
A dissertation submitted to Ghent University in partial fulfilment of the requirements for the degree of Master in Geography
2
PREFACE
In this master dissertation I had the opportunity to combine some of my passions and use them in a very interesting and innovative research. Instead of playing games, I learned to design one myself and managed to link it to the acquisition of spatial information. The latter was quite a challenge, as there was no working example to start from. A lot of time was invested in getting the game running and distributing it to a significant amount of people in order to play and test the game. Seeing the number of participants and the competitive spirit between the different participants was a fun and satisfying experience.
Since last summer, I’ve been working hard to immerse myself in the world of game development and indoor wayfinding. As it can't be all work and no play, I would like to thank my friends and the members of Geografica for the fun breaks in between. Nevertheless, it was not always easy to combine being president of the student organization with the writing of a master dissertation, I enjoyed all moments of friendship that gave me inspiration and courage to successfully complete this study.
Special thanks also goes to Laure De Cock for always being present to help me and provide me with input for the research. She also played an important role in helping me with the statistical analysis, the interpretation of the results and proofreading my dissertation. The aim is to publish this research and to take my first steps in the academic world, for which I would also like to thank professor De Maeyer for his trust and support.
Finally, I would like to thank my family and Marian, who often had to listen to updates about my research and who often missed me while I was writing. A special thanks goes to my parents, who have given me the opportunity to study Geography. For the past five years, they have supported me and given me confidence in every decision I have made. Many Thanks!
3
ABSTRACT
Indoor wayfinding is perceived more complex than wayfinding in large outdoor areas that differ significantly from indoor environments. Buildings are typically characterized by a much smaller scale level and a higher degree of detail. additionally, the field of vision is much more limited and indoor environments can vary a lot more in size and shape. Due to the challenges in these environments, in combination with the absence of mobile wayfinding aids, there is a great need for innovative research on indoor wayfinding. A considerable amount of studies have tried to gain better insight in cognitive route planning and communication for indoor wayfinding. The use of gamification for indoor wayfinding however is still in its initial phase, requiring more research about its opportunities and added value in scientific studies. In this explorative study, a game is developed in Unity to investigate if the concept of gamification can be used in studies on indoor wayfinding to provide useful information regarding the link between wayfinding performance, personal characteristics and building layout. By use of a statistical analysis, the influence of user and decision point characteristics on spatial cognition is investigated. The results show a significant difference between the gamers and non-gamers and thus a link between wayfinding performance and personal characteristics. Further analysis shows that complexity of player movement has an important impact on navigation velocity at different decision points in the building. Nevertheless, player movement complexity has no influence on wrong turns, of which the expected and observed distributions are significantly different in this study. Correlation analysis finally indicates a link between wayfinding performance and building layout. In this building, wayfinding at deeper decision points in convex spaces is slower and there seems to be more doubt about making a turn than at more integrated decision points in convex spaces. This explorative study provides a first approach for the use of gamification in indoor wayfinding research and the results can be used by researchers that are considering games as a research medium.
4
SAMENVATTING
Indoor navigatie wordt ervaren als meer complex dan het navigeren in grote outdoor omgevingen die aanzienlijk verschillen van indoor omgevingen. Gebouwen worden doorgaans gekenmerkt door een veel kleiner schaalniveau en een hogere mate van detail. Bovendien is het gezichtsveld veel beperkter en kunnen indoor omgevingen veel meer variëren in grootte en vorm. Door de uitdagingen in deze indoor omgevingen, in combinatie met het ontbreken van mobiele hulpmiddelen voor navigatie, is er grote behoefte aan innovatief onderzoek. Een aanzienlijk aantal studies hebben getracht beter inzicht te krijgen in cognitieve routeplanning en communicatie voor indoor navigatie. Het gebruik van gamification voor indoor navigatie bevindt zich daarentegen nog in de beginfase en vereist meer onderzoek naar de mogelijkheden en toegevoegde waarde in wetenschappelijke studies. In dit onderzoek wordt een spel ontwikkeld in Unity om te onderzoeken of het concept van gamification kan worden gebruikt in studies naar indoor navigatie om nuttige informatie te verschaffen over het verband tussen navigatie, persoonlijke kenmerken en architectuur. Door middel van een statistische analyse wordt de invloed van gebruikers- en beslissingspuntkenmerken op ruimtelijke cognitie onderzocht. De resultaten tonen een significant verschil tussen de gamers en niet-gamers en daarmee een verband tussen prestaties en persoonlijke kenmerken. Nadere analyse leert dat de complexiteit van besturing van de avatar een belangrijke invloed heeft op de navigatiesnelheid op verschillende beslissingspunten in het gebouw. Desondanks heeft deze complexiteit geen invloed op foutieve keuzes tijdens navigatie, waarvan de verwachte en waargenomen verdelingen in deze studie significant verschillen. Correlatieanalyse geeft finaal een verband aan tussen navigatie en architectuur. In het fictief gebouw van deze studie wordt er langzamer genavigeerd op diepere beslissingspunten in convexe ruimtes en lijkt er meer twijfel te bestaan over het maken van een bocht dan op meer geïntegreerde beslissingspunten in convexe ruimtes. Deze verkennende studie biedt een eerste benadering voor het gebruik van gamification in onderzoek naar indoor navigatie en de resultaten kunnen worden gebruikt door onderzoekers die games beschouwen als onderzoeksmedium.
5
POPULARIZING CONTENT
In wayfinding research a potential new technology for data acquisition has emerged, called gamification. This technique includes a relatively new concept where video games are used to improve user experience and user engagement in applications and non-game services. In this study a game is developed in Unity and used for data acquisition related to the navigational capabilities of different individuals in a fictional indoor environment. Several statistical analyses were performed and it was investigated whether a link could be found between wayfinding performance, personal characteristics and building layout. Compared to real-life experiments, the game factor attracts more participants, even willing to play multiple times, and participants are more emerged in the environment compared to pictures or passive building exploration. This explorative study provides a first approach for the use of gamification in indoor wayfinding research and the results can be used by researchers that are considering games as a research medium.
6 TABLE OF CONTENTS PREFACE... 2 ABSTRACT ... 3 SAMENVATTING ... 4 POPULARIZING CONTENT ... 5 LIST OF FIGURES ...9 LIST OF TABLES ...10 LIST OF ATTACHMENTS ... 11 1 INTRODUCTION ... 12 1.1 Gamification ... 13 1.2 Serious games ... 13
1.3 Location Based games ... 14
1.4 Healthcare ... 16
1.5 Cartography ... 17
1.6 Indoor environments and spatial cognition... 18
1.7 Issues ... 20 1.8 Goals ... 20 1.9 Research question ... 21 2 METHODOLOGY ... 22 2.1 Game concept ... 23 2.2 Virtual environment ... 23
2.3 Unity game development ... 25
2.3.1 Avatar implementation and player movement ... 25
2.3.2 Level development... 28
2.3.2.1 Landmarks ...30
7
2.3.2.3 Space syntax ... 32
2.3.2.4 Instruction videos ... 34
2.3.3 Database implementation and data acquisition ... 34
2.3.4 Registration and survey ... 37
2.3.5 Ranking and game competition ... 38
2.3.6 Game structure... 39
2.3.7 Beta-testing and distribution ... 40
2.3.8 Timeline ... 41 2.4 Data processing ... 43 2.4.1 Pre-processing... 43 2.4.2 Descriptive statistics ... 45 2.4.3 Statistical analysis ... 45 2.4.3.1 User characteristics ... 46
2.4.3.2 Decision point characteristics ... 47
2.4.3.3 Landmark effectiveness ... 48
2.4.3.4 Building layout and architecture ... 50
2.4.3.5 Learning effect ... 51
3 RESULTS ... 52
3.1 Descriptive statistics ... 52
3.2 User characteristics ... 55
3.3 Decision point characteristics... 57
3.4 Landmark effectiveness ... 58
3.5 Building layout and architecture ... 60
3.6 Learning effect ... 61
4 DISCUSSION ... 63
8
4.2 Decision point characteristics... 63
4.3 Landmark effectiveness ... 65
4.4 Building layout and architecture ... 69
4.5 Learning effect ... 72 4.6 Limitations ... 72 4.7 Future research ... 73 5 CONCLUSION ... 74 6 REFERENCES ... 75 7 ATTACHMENTS ... 79
9
LIST OF FIGURES
Figure 1: Ten most popular categories on weekdays and weekends with decreasing popularity from bottom to
top... 15
Figure 2: Virtual environment created in Unity consisting of meandering road, circular part and building ... 17
Figure 3: Floorplan of the indoor environment ... 24
Figure 4: Three-dimensional model of the building floor ... 25
Figure 5: Avatar implementation and orientation of the local coordinate reference system ... 27
Figure 6: Camera implementation and used offsets ... 28
Figure 7: Illustration of indoor route design from origin (O) to destination (D) for all three levels ... 29
Figure 8: Invisible trigger (marked in green) as box collider triggering the corresponding script ... 32
Figure 9: Space syntax computation based on mean visual depth values ... 33
Figure 10: Enhanced entity-relation diagram of the ‘Indoor navigation Simulator’ database ... 36
Figure 11: Registration scene ... 38
Figure 12: Ranking example of a random participant ... 39
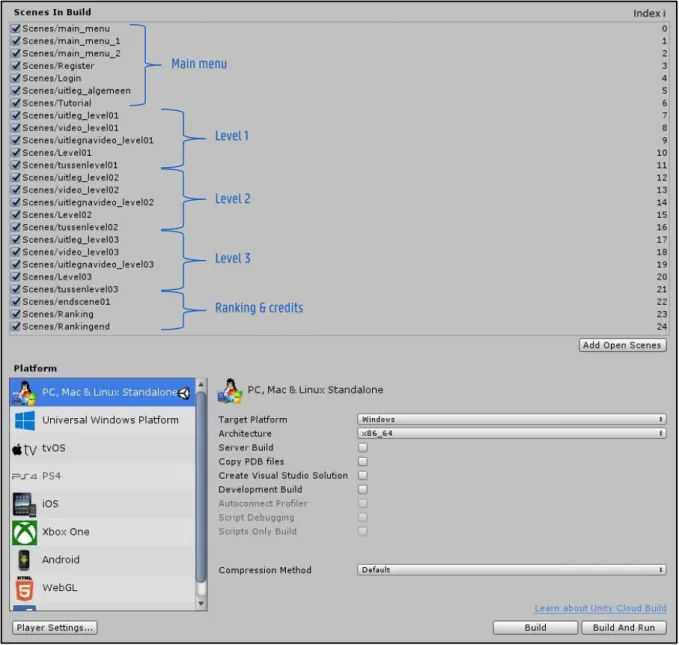
Figure 13: Build settings including scenes and corresponding indices ... 40
Figure 14: Game development process including alpha testing (grey), beta testing (orange) and the master phase (yellow) ... 42
Figure 15: Transformation of coordinates from Unity CRS to a Cartesian grid ... 44
Figure 16: Flowchart of the statistical analysis ... 46
Figure 17: Landmark categorization ... 50
Figure 18: Subsample of space-temporal trajectories for level 1 ... 52
Figure 19: Heat flow of movement from origin (O) to destination (D) in level 1 with grid resolution of 5 m ... 53
Figure 20: Spatial clustering on point locations of level 1 by use of the DBSCAN algorithm including main route (blue) and outliers (red)... 54
Figure 21: Total navigation velocity in try 1 and 2 for all three levels ... 61
Figure 22: Decision points and corresponding landmarks from the objects category ... 66
Figure 23: Heat flow of movement from origin (O) to destination (D) in level 2 with resolution of 5 m and red squares emphasizing the higher densities in cells containing a pictogram ... 68
Figure 24: Visualisation of decision points in deep and shallow spaces ... 69
10
LIST OF TABLES
Table 1: Landmark overview ... 31
Table 2: ‘Indoor Navigation Simulator’ database entities... 35
Table 3: Categorization of decision points based on topology ... 47
Table 4: Categorization of decision points based on required navigation action ... 48
Table 5: Landmark categories and corresponding decision points ... 49
Table 6: Output example of python script including information on distance, time, navigation velocity and space syntax measures ... 51
Table 7: User characteristics ... 55
Table 8: Significance of differences between groups of participants, based on their navigation velocity over the three different levels ... 56
Table 9: Significance of differences between groups of participants, based on the proportion of wrong turns over the amount of participants in the group... 56
Table 10: Significance of differences between categories of decision points, based on the navigation velocity of participants at each decision point ... 57
Table 11: Chi-square goodness-of-fit test between observed and expected amounts of wrong turns at decision point groups categorized on required navigation action ... 58
Table 12: Significant differences between categories of landmarks, based on the navigation velocity of participants at each decision point ... 59
Table 13: Chi-square goodness-of-fit test between observed and expected amounts of wrong turns at landmark type based categories... 60
Table 14: Spearman rank correlation coefficient of mean visual depth (MVD) and navigation velocity ... 60
Table 15: Amount of wrong turns made by participants in try 1 and 2 ... 62
Table 16: Overview of wrong turns at decision points with corresponding landmark type and topology based categorization ... 65
Table 17: Quantitative overview of the categorization based on different types of landmarks ... 66
11
LIST OF ATTACHMENTS
Attachment 1: Building floorplan with corresponding raster (5m resolution) ... 79
Attachment 2: Landmark overview ... 79
Attachment 3: Decision points in level 1 ... 84
Attachment 4: Decision points in level 2 ... 85
Attachment 5: Decision points in level 3 ... 85
Attachment 6: Start menu scene ... 86
Attachment 7: Main menu scene ... 86
Attachment 8: Registration scene ... 87
Attachment 9: Login scene ... 87
Attachment 10: General explanation scene ... 88
Attachment 11: Level instructions before video ... 88
Attachment 12: Video display ... 89
Attachment 13: Level instructions after video ... 89
Attachment 14: Level 1 ... 90
Attachment 15: End of level ... 90
Attachment 16: Game credits ... 91
Attachment 17: Ranking ... 91
Attachment 18: Game Manual ... 92
Attachment 19: Distribution email ... 98
Attachment 20: Pseudo code for navigation velocity calculation ... 99
Attachment 21: Space-temporal trajectories of level 1 ... 100
Attachment 22: Space-temporal trajectories of level 2 ... 100
Attachment 23: Space-temporal trajectories of level 3 ... 101
Attachment 24: Heat flow of movement from origin (O) to destination (D) in level 2 with resolution of 5 m .... 102
Attachment 25: Heat flow of movement from origin (O) to destination (D) in level 3 with resolution of 5 m .... 102
Attachment 26: Pseudo code for spatial clustering ... 103
Attachment 27: Spatial clustering for level 2 including main route (blue) and outliers (red) ... 103
Attachment 28: Spatial clustering for level 3 including main route (blue) and outliers (red) ... 104
12
1 INTRODUCTION
Data acquisition or the collection of data can be described as the process by which a physical phenomenon on the earth's surface is measured and recorded resulting in information or data. Over time the definition of acquisition has remained unchanged while the techniques of data collection have been constantly renewed under the influence of technological progress. The process of data acquisition has an important role within research in Geography and Geomatics. Managing, analyzing, processing, visualizing and distributing data with a link to a specific location or geographical area has gained importance since the emergence of geographical information systems (De Maeyer & Van de Weghe, 2007). Due to the exponentially increasing amount of data, collected with all kinds of techniques such as remote sensing and surveying, the concept of big data has recently become very important. The term refers to both the amount of available data and the speed with which it can be collected. Big data creates both opportunities and challenges for data analysis with the aim of acquiring useful information in various research domains. One of these domains is indoor wayfinding, where recently a potentially new technology for data acquisition has emerged, called gamification. This technique includes a relatively new concept where video games are used to improve user experience and user engagement in applications and non-game services (Deterding et al., 2011). This can be used in large outdoor areas, smaller inside structures or even a combination of both. Indoor environments however differ significantly from the outdoor environments. Buildings are typically characterized by a much smaller scale level and a higher degree of detail. Additionally, the field of vision is much more limited and indoor environments can vary a lot more in size and shape. As a result, the building complexity can possibly lead to a loss of orientation. Due to the challenges in these environments, in combination with the absence of mobile wayfinding aids, there is a great need for innovative research on indoor wayfinding. A considerable amount of studies have tried to gain better insight in cognitive route planning and communication for indoor wayfinding. The use of gamification for indoor wayfinding however is still in its initial phase, requiring more research on its opportunities and added value in scientific studies.
This master dissertation focusses on a gamified approach based on a theoretical background of the concept and the creation of a serious game in a virtual indoor environment. The game is developed from scratch and this study aims to use it for data acquisition related to the navigational capabilities of different individuals.
13
1.1 Gamification
In literature gamification is defined as an informal umbrella term for the use of video game elements in non-gaming systems to improve the user experience and user engagement in non-game services and applications (Deterding et al., 2011). Although the concept is relatively new, the practice of gamification has been used for a long time. Before 2003 the concept of gamification was barely known but recently it has been recognized as a powerful tool and almost a standard for software design. During the past decade applications such as Foursquare and Pokémon Go went viral with millions of downloads and gamification became a popular technique to support user engagement. Recently it is also becoming a more popular subject for academic inquiry, which is reflected in the growing amount of research during the past ten years (Hamari et al., 2014). Many of these studies are related to geographical subjects, including the case of indoor wayfinding.
1.2 Serious games
To understand the use of gamification in scientific research, it is import that a distinction is made between a game and a serious game. In essence, a game can be defined as an activity in which one or more players make decisions with the aim of achieving their objective. In the context of such a game, boundaries are developed by the producer of the particular game. These boundaries are specific rules that determine in advance which activities the players of the game can participate in and in which situations they may end up. Different types of games can be distinguished (e.g. card game, board game or video game) which, according to the literature, are all characterized by six different characteristics related to playing of the game:
1. A game is played on a voluntary basis.
2. In most cases the game sketches an unreal situation. 3. Players reach their goal within a certain time and space. 4. A game is based on rules that create the boundaries. 5. Playing a game is a social activity.
6. A full concentration on the game is required.
whereas most games are presented to potential players as entertainment, serious games contain an additional function of having a specific goal other than entertainment or fun. This does not mean that these factors are not part of it, the focus of the game simply lays elsewhere such as with scientific research in all kinds of domains (Michael & Chen, 2005).
14
1.3 Location Based games
The term location-based-services (LBS) is a recent concept that denotes applications integrating geographic locations with the general notion of services such as emergency services or car navigation systems. With the development of mobile communication most of these applications became part of everyday life as they run on computers and mobile phones (Schiller & Voisard, 2004). With the emergence of smartphones a number of location-based services have recently started using the concept of gamification. By the use of mobile applications, serious games were combined with some of the fundamental concepts of communication to create a new form of social networking. Remarkable are the findings that are made regarding the increase in the number of people who use this type of applications. It is clear that as a result of the entertaining aspects of a game, more and more people are being attracted to share personal data on social media and thereby make their geographic location voluntarily available. One of the best examples of such an application is Swarm, a follow-up of Foursquare. The application gives the user the option to virtually check in at a specific location by use of built-in GPS on his or her mobile device. With every check-built-in the user earns a number of cobuilt-ins, which built-in fact creates a competitive virtual game to reach the highest number of check-ins and therefore the most coins compared to other players (McKenzie, 2011).
For a serious game, the creation of a competitive aspect can be of high importance. Researchers have identified that the creation of competition combined with a reward system (e.g. receiving coins in the Swarm game) is a promising method for motivating and retaining volunteers (Newman et al., 2012). Also in terms of data acquisition for specific scientific research gamification applications make use of such a reward system. For example the Biotracker app, a gamification based application created during the research off Bowser et al. (2013) in terms of the Budburst citizen science project. In this app citizens can check in plants or trees to receive badges and a high score in the ranking. These successful examples prove that users of gamified applications are motivated by the opportunity to discover new things, to be part of a meaningful story, to compete with others and to achieve one’s personal best.
From a scientific point of view, the use of gamification in the context of mobile applications provides a large data-source and therefore a number of opportunities for scientific research. Scientist within social psychology, marketing and computer sciences for example investigate why people choose to share their location on a voluntary basis. Researchers within these fields of expertise assume that there must always be a specific reason that encourages people to participate in social media and thereby share their geographical location publicly (Liu et al., 2011). Within social psychology, earlier research has already shown that a combination of social and
15
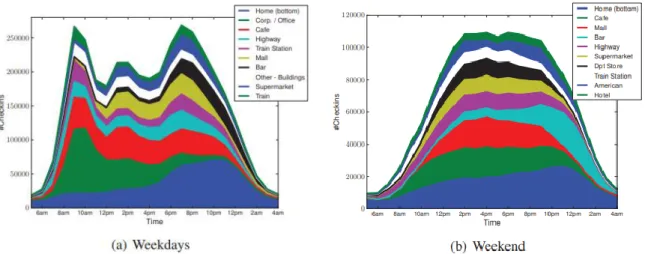
economic factors must be present before people participate in such game-based applications (Deci & Ryan, 1985). Companies such as Starbucks quickly noticed gamification as a market opportunity and linked check-ins in their stores to certain promotions to lure customers through gamification in an economic context (McKenzie, 2011). For scientific research within Geography, the use of gamification and game-based applications provides interesting opportunities for research on movement behaviour of individuals in a population. Existing studies already used volunteered geographic information (VGI), in particular Foursquare data, to conduct research into mobility and travel behaviour. For example the study of Noulas et al. (2011) where so-called timestamped location check-ins that relate to human activities in time and space were extracted out of the Foursquare dataset. Data mining was applied on twelve million check-ins over a period of 111 days. A strong distinction was made between travel patterns on weekend and weekdays as shown in Figure 1. Further in the study, time-spatial transitions from one activity to another were also examined based on probabilities and check-in frequencies. The findings provided strong indications for a promising way of research for on the one hand trip advisors and on the other hand more generally the social sciences and the implementation of urban planning by policy makers (Noulas et al., 2011).
Figure 1: Ten most popular categories on weekdays and weekends with decreasing popularity from bottom to top (Noulas et al., 2011).
Finally, the literature on LBS also states that the data collected by game-based applications can also play an important role in wayfinding (McKenzie, 2011). Research on wayfinding focusses on the process that takes place when individuals try to orientate themselves and navigate through the space around them. The human movement behaviour in such research is often described as deliberate, focused and going from an origin to a destination. For the wayfinding purpose a distinction is made in the literature between three categories of displacement. On the one hand, individuals can move with the aim of reaching a destination they know, and on
16
the other hand they can explore with the aim of reaching their initial starting point again. Additionally, individuals may be looking for a location in their environment that they have never seen before, which is often based on the use of symbolic information such as landmarks (Allen, 1999). These are described in the literature as objects or structures that are clearly recognizable and serve as a point of reference for individuals trying to navigate through space (Roubal & Winter, 2002). The study of McKenzie (2011) shows that Foursquare data can be used to identify frequently visited and therefore in other words popular locations. Specific landscape elements at these locations can serve as landmarks that can be used by individuals for wayfinding through the environment since they are most likely very salient for the user.
1.4 Healthcare
In the past decade gamification has already been applied in all kinds of scientific studies related to different research domains ranging from education to healthcare. An important theme within the healthcare domain is spatial cognition, which in psychology is described as the way in which individuals gather and use knowledge about their environment to determine where they are. In psychology, in particular in the neuropsychology domain, there has recently been an introduction of the use of serious games to support rehabilitation. The purpose of rehabilitation is to help patients with brain damage, for example caused by a brain tumor or a concussion, in such a way that they can resume their daily life activities independently of the help of others. Whereas earlier research mainly focused on improving cognitive brain functions through the use of mental exercises, a recent study by van der Kuil et al. (2018) focuses more on the rehabilitation of spatial wayfinding after brain damage. To realize this rehabilitation it is stated that the focus must be on developing an alternative strategy for wayfinding through space. Depending on the diagnosis and the profile of the patient, therapy based on virtual sessions can be used. During such sessions, various wayfinding exercises in the form of a serious game in combination with psychological support are offered to patients by a domain specialist. The game aims to change the wayfinding strategy of the patient in a positive way and tries to improve his or her navigation capabilities in daily life. The training component of such a game takes place in a 3D-environment in which patients interact.
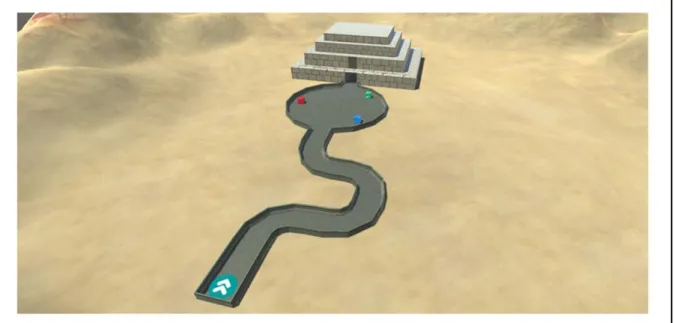
In order to stimulate participation and maximize the learning effect of the game it is important, according to the study by van der Kuil et al. (2018), that the movements within the virtual world are as realistic as possible. It is stated that there are two possible ways, namely control with the arrows of the keyboard or via an optical sensor of the computer mouse. The effectiveness of these two operating systems has been tested by use of a game. To do so a 3D-environment was created by use of the Unity 3D-software development kit (Figure 2). The
17
aim of the game is to reach the endpoint in the building by navigating from the starting point of the meander and this with as few collisions to the edge and as little time as possible. To compare the use of the different operating systems data on time and on the number of collisions, which were collected by the Unity 3D-software itself, were taken into account. A Kolmogorov-Smirnov test showed significant differences in time and collisions when using a computer mouse or a keyboard. Furthermore, the Wilcoxon signed-rank elaborated on this and made it clear that the time when using a computer mouse is significantly shorter compared to using a keyboard (van der Kuil et al., 2018).
Figure 2: Virtual environment created in Unity consisting of meandering road, circular part and building (van der Kuil et al., 2018).
1.5 Cartography
Another domain where gamification has been used as a method for data acquisition is cartography. In the study by Lapon et al. (2019) research is done on cognitive maps and in particular to how specific projection systems influence our view of the world map. Initially, the influence of education was investigated, followed by a study on the influence of web maps by making observations about a potential Mercator effect. This effect implies that individuals misjudge the total area of land since the Mercator projection, which was until recently used by Google Maps, is not surface-true. During several years all sorts of data were collected, including personal data, and patterns were found through data mining which led to the development of a follow-up study. This study (www.maps.ugent.be) allows participants to take an online test which gives them a score that relates to how well they made the estimation of land area. This study went viral with more than 100,000 participants and
18
because a final score is used in terms of competition to others, this test is also an application of the gamification concept.
Furthermore, it is important to emphasize the use of mixed methods in cartographic research. To verify findings, cartographic researches have to make use of different methods of data analysis and data acquisition, as mentioned in the research by Ooms (2016). According to Roth et al. (2016) both real-life experiments and laboratory experiments must be conducted. In cartography it is mainly the interactive and mobile maps that are difficult to test in a real-world environment since certain parameters such as congestion, noise or the weather cannot be controlled. However, by making use of gamification in the context of laboratory experiments these parameters can be controlled which offers interesting possibilities for evaluating web maps in their natural environment. A disadvantage is that there is a lack of control over the equipment used, for example screen size and resolution. Moreover, there are no real interactions with the environment and there is also a lack of control over the behaviour of the participants during the test (Roth et al., 2016).
1.6 Indoor environments and spatial cognition
Looking at research on wayfinding, the term legibility is often used in the literature. It is mainly used in studies on indoor wayfinding and, according to Weisman (1981), legibility is defined as how easily individuals find their way in an indoor environment. In the study of Weisman (1981) three different factors are named that determine the legibility. These factors are differentiation of appearance, visual access and layout complexity. The last factor is closely related to the concept of gamification as the layout of a virtual indoor environment in a game can easily be adjusted in complexity to conduct research. As mentioned before, indoor environments differ significantly from outdoor environments since buildings are typically characterized by a much smaller scale level and a higher degree of detail. The study of Viaene (2018) emphasizes that a building imposes specific wayfinding challenges and that the process of planning movement in a goal-oriented and efficient way is often troublesome in an indoor environment. In order to overcome these difficulties people rely on landmarks which are salient, informative and easily recognizable environmental features (Viaene, 2018).
The process of planning movement in a goal-oriented and efficient way is often called wayfinding. In the study of Passini (1981), wayfinding is also described as a dynamic affair that relates to complex human behaviour and various cognitive skills. Planning and executing a route indoors can be challenging. It involves decision making processes whereby possible routes and/or route segments are appraised and selected in order to reach a certain destination (Farr et al., 2012). To illustrate this process, Downs and Stea (1973) described a four-step framework
19
consisting of orientation, route selection, route control and recognition of destination. Orientation means locating oneself with respect to nearby orientation points (i.e. landmarks) and the chosen destination. Secondly, the most optimal route is selected to reach a destination as effortless and efficient as possible (Farr et al., 2012). Thirdly, route control is the constant verification that an individual is following the selected route by linking the environmental representation with reality by the presence of corresponding features in the environment (e.g. landmarks). Fourthly, a person must be aware that he/she has reached the chosen destination in order to conclude this wayfinding process (Downs & Stea, 1973; Farr et al., 2012). Important to note is that landmarks are the key to this process of comprehending the spatial structure of a building, constructing a mental map, recognising locations and orientation. They structure the human cognitive map of the environment and are used to reason about spatial information in a simplified way. Therefore they are irrefutably important during indoor wayfinding (Viaene, 2018).
To better understand wayfinding behaviour, a method called space syntax can be used. It covers three elementary aspects of wayfinding: access graphs, axial maps and isovist (or visibility) fields (Lorenz et al., 2006). In general, space syntax provides formal descriptions through quantitative methods and indicates the spatial intelligibility of a space, also described as the property of the space that allows an observer to understand it in such a way as to be able to find his or her way around (Bafna, 2003). To meet specific needs different methods of space syntax have been introduced. The ones mostly used include Inter Connectivity Density (ICD), Visibility Graph Analysis (VGA) and isovists (Li & Klippel, 2010). The latter has been used in different studies, for example the research of Wiener and Franz (2004) correlating environmental characteristics with wayfinders’ spatial preferences. During this study isovists were used to predict the best overview or hiding place in an indoor environment as the preference is directly related to visibility.
Because of the mentioned complexity and challenges of indoor wayfinding a recent study of Vanhaeren et al. (2018) tried to gain better insights in cognitive route planning by use of an online survey. Where most algorithms in indoor wayfinding systems are limited to the currently known shortest path algorithms, this study focussed on the identification of cognitive load in the indoor environment. Different indoor routes were shown to participants followed by two questions of which the answers were linked to personal information to gain better insights in human indoor wayfinding. As for personal information the study of De Cock et al. (2020) investigates how personal factors have an effect on the way people experience space. In this study user characteristics and decision point characteristics were linked to perceived complexity of indoor wayfinding. This way research was conducted on reducing the risk to get lost in a building by adapting wayfinding information to perceived complexity.
20
As a result of the flexibility in game development indoor environments can be created with a different level of complexity and, since they are irrefutably important, different kinds of landmarks. These environments can be fictional or realistic depending on the aim of research and the availability of high quality indoor 3D-models. As mentioned in the study by van der Kuil et al. (2018) the movements within the virtual world should be as realistic as possible in order to stimulate participation and maximize a learning effect. Next to the use of high quality indoor 3D-models the use of Virtual Reality (VR) also creates many opportunities related to virtual indoor environments. According to Vilar et al. (2014) VR has recently become very useful in all kinds of scientific studies, partly due to further technological development and cost reduction. A big advantage of this method is the flexibility as researchers have the possibility to create different virtual worlds for different purposes (e.g. indoor wayfinding). This can be done at a low cost compared to a real-world environment and gives the possibility to look at the virtual environment from different points of perspective. Here too there is a connection with gamification since a serious game can easily be expanded to make use of VR in terms of research and participation stimulation.
1.7 Issues
Indoor environments such as buildings have a lot more complexity and challenges compared to outdoor areas. Where outdoor environments are mostly large-scaled and give the opportunity for a considerably large field of view, indoor environments are typically characterized by a much smaller scale and a higher degree of detail. The efficient planning of goal-oriented movement in such an environment is often troublesome and requires certain abilities and various cognitive skills depending on the layout complexity of the building. This complexity depends on variations in size, shape and the availability of easily recognizable environmental features (e.g. landmarks). High complexity indoor environments can lead to loss of orientation, route control and disturbances in comprehending the spatial structure of a building. Since wayfinding through indoor environments is difficult it is of high importance to investigate the relationship between architecture and landmarks on the one hand and wayfinding performance on the other. To gain more insight into the problems with indoor wayfinding and to be able to tackle them effectively in the future, further research has to be conducted and new techniques (e.g. gamification) have to be used.
1.8 Goals
Gamification is a relatively new concept where video games are used for purposes other than recreation, for example scientific research. The domain of wayfinding is perfect for the application of this innovative technique.
21
Where a recent study of Yesiltepe et al. (2019) makes use of gamification for research on wayfinding in large outdoor areas, this study will focus on the more challenging indoor wayfinding. Therefore the goal of this research is to develop a serious indoor wayfinding game in the Unity 3D-software development kit. In a first step wayfinding data will be collected of several participants who played the game. Next this study will investigate if analyses on the acquired data can result in useful information regarding the link between wayfinding performance, personal characteristics and building layout. Doing so, this study can be a first step in the direction of further research and the use of serious games in terms of scientific research on indoor wayfinding.
1.9 Research question
The research question to be treated in this study is as follows:
“ Can the concept of gamification be used in studies on indoor wayfinding to provide useful information regarding the link between wayfinding performance, personal characteristics and building layout ” The chapter Methodology gives a chronological overview of the different steps in the development process of a game, going from the design of the indoor environment to the setup of a database and the programming of game-based data acquisition in the Unity 3D-software development kit. The collected data of the participants will be used for further research which focusses on a statistical analysis of the acquired dataset. Pre-processing will be conducted and different tests will be executed to investigate the influence of user and decision point characteristics on spatial cognition. Furthermore, different visualisations will be created and the effectiveness of landmarks in an indoor environment will be studied. Finally, a discussion and conclusion related to the initial research question and the use of gamification on indoor wayfinding research will be conducted. In these final chapters insights on the potential of this technique will be reviewed with focus on future research in the domain of Geography.
22
2 METHODOLOGY
For this master dissertation the use of the Unity 3D-software development kit was chosen to create a serious game. This software is based on the programming language C-Sharp (C#), developed by Microsoft and running parallel to Unity in Virtual Studio. The first step in the methodology was the creation of a game concept. Secondly, Autodesk AutoCAD was used to design a virtual environment, both in 2D and 3D. Next, the 3D-model was implemented in Unity where different parts of the game such as implementation of an avatar, player movement, camera movement, level development, game structure, textures, … were programmed. To gather information about player movement in the environment a general purpose scripting language called PHP was used as a link between the game and a database. The database used in this study is a Postgres database created by use of pgAdmin, an open source administration and development platform for PostgreSQL. Before distribution of the game a beta version was exported and played by eight test persons. Finally, after taking into account potential improvements and occurring bugs, a master version was created and distributed by use of a programmed installation setup and a corresponding manual for the game and its installation.
In this chapter the different steps in the creation process will chronologically be explained in more detail. Furthermore, the strategy for the analysis of the acquired data will be illustrated with attention for pre-processing, descriptive statistics and statistical analysis. Statistical tests will be used for the detection of useful patterns in the dataset, specifically aiming to learn more about the influence of user and decision point characteristics on spatial cognition and their effectiveness on indoor wayfinding performance.
23
2.1 Game concept
To play the game, called ‘Indoor Navigation Simulator’, participants first need to create an account by following a registration process. During this process several questions need to be answered that will be used further in the study to divide participants into different groups. The next step is logging in to the game, whereafter the goal of the game is explained and a tutorial can be played to get familiar with the control system of the avatar. Participants, being students and personnel of the Geography Department, have to go through three different levels. The order in which participants get to play the levels is randomised and each level has a corresponding instruction video which is shown before being able to play. In these videos participants can see the avatar wayfinding through the indoor environment and following a planned movement in a goal-oriented way from origin to destination. Participants can only watch this video one time and before watching they are hinted to look at recognizable environmental features since they can help them make correct decisions and reach the destination within acceptable time. The game demands various cognitive skills and the ability to memorize different instructions over time. Related to the characteristics of a game, the voluntary basis, an unreal situation, a goal and boundaries are present. To create the social component competition is imbedded by use of a ranking where the ten best cumulative times of participants for the three levels are shown. This competitive aspect was introduced to create a fun and social component but also to stimulate participation.
Regarding the research component in this concept, participants are tracked during their indoor wayfinding in the three different levels. Planimetric coordinates, in a local system with three orthogonal axes (x, y, z), and time data were logged. This space-temporal data together with the answers to the general questions and wrong turns during the wayfinding are transferred to a Postgres database. Since knowing when and where a participant makes a wrong turn is sufficient, the game automatically asks to turn around when mistaken. Important to note is that participants can play the game multiple times. Data of different tries will all be registered as this allows to gather information on the learning effect in the indoor environment.
2.2 Virtual environment
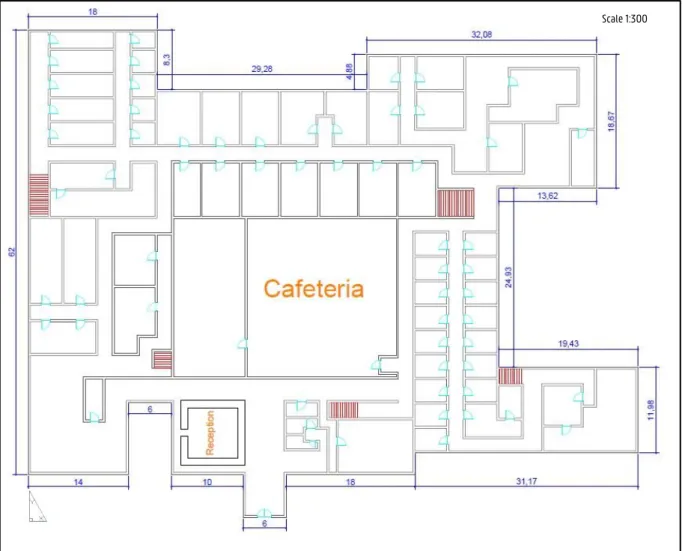
To design a virtual environment in two and three dimensions Autodesk AutoCAD was used. A floorplan of a fictional building was developed, taking into account a realistic scale to create a fictional environment with a visually realistic layout. The building consist of a single floor containing a reception, cafeteria and a various amount of rooms based on a hospital floor. Doors and stairs were included to create a more realistic appearance. The building is designed so that there are various locations, called decision points (DP), where individuals can navigate in different directions and have to make a choice while moving in a goal-oriented way. The dimensions
24
were designed in a way that a normally scaled avatar can easily pass and navigate through the building within acceptable time. Figure 3 represents the designed floorplan of the indoor environment, including the used dimensions in meters (scale 1:300).
Figure 3: Floorplan of the indoor environment.
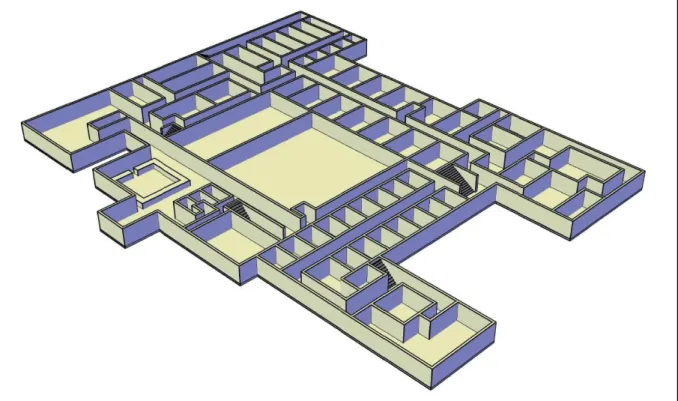
The floorplan was further developed to a 3D-indoor environment with use of the extrude and subtract function in AutoCAD. To ensure the model was in proportion, the height of the walls was set at 2,5 m. The stairs were also designed and a reception desk was created, resulting in the setup illustrated in Figure 4. Finally a roof was created for the model including different domes intended for natural incidence of light. The model was exported from AutoCAD as a binary stereolithography file (.stl) and further converted to an OBJ file, a standard 3D-image format that can be opened by various image editing programs. To do so the Online Mesh Converter software was used with as result a Unity compatible model. Since Unity can only add a single material to a model, the export, conversion and implementation process was repeatedly conducted for the walls, the stairs, the roof and the domes separately.
25
Figure 4: Three-dimensional model of the building floor.
All of these 3D-models were imported in Unity and used to create and program three different levels based on different wayfinding routes. To make wayfinding possible an avatar and its movement were programmed. The latter included the setup of camera movement and the creation of automatic links between different scenes1 in the game. These scenes consist of a specific structure in order to chronologically go through the levels and finally finish the game and settle a score.
2.3 Unity game development
2.3.1 Avatar implementation and player movement
To give participants the opportunity of wayfinding through the building, implementation of an avatar and its movement is necessary. In game-development, the term avatar is of multidimensional use since it can be of any shape in two or three dimensions. For example a simple point or 3D-cube can suit as avatar or a more complex animation figure can be used. Such an avatar can be created very realistically or rather be a representation of a human-like animation figure. Software that is suitable and most used for these creations is Blender or Autodesk Maya. Since designing these avatars demands advanced skills and modelling abilities, Unity gives the possibility to use free or paying assets from the asset store including avatars, objects or even pre-made environments.
26
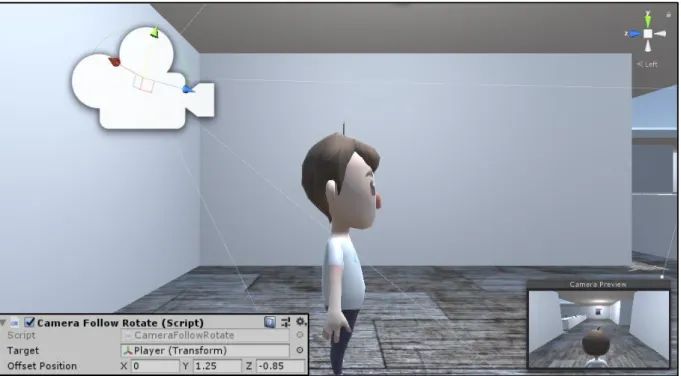
For this study a human-like animation figure imported from the Unity asset store was used as avatar for the participants. The avatar was given realistic characteristics such as the influence of gravity as a result of a so called rigidbody. Adding this component to an object will put its motion under the control of Unity's physics engine. Even without adding any code, a rigidbody object will be pulled downward by gravity and will react to collisions with objects if the right collider component is present. To make sure the avatar is not pulled through the surface or can’t walk through walls, a mesh collider was applied to both the avatar and the 3D-model of the building. Doing so, one of the boundaries of the game was created that makes movement through walls impossible. Furthermore, the rigidbody has a scripting API that creates the possibility to add forces to an avatar and control it in a physically realistic way. These forces are fundamental for the implementation of the player movement in the game. Forward and backward forces, linked to input of the forward and backward arrow respectively, were scripted and added to the avatar. These forces were finally combined with rotation of the avatar, linked to input of the left or right arrow, and used to implement the player movement in game. In contrast to the findings in the literature and in particular the study of van der Kuil et al. (2018), the use of keyboard is chosen for the player movement. Since participants need full control over the avatar, the use of keyboard arrows was the most obvious choice. Optical sensors can only be used to adjust the rotation of the avatar and still require movement in a specific direction, the latter being automatically (e.g. avatar is continuously moving forward) or by use of keyboard controls.
One of the most important properties of the rigidbody in terms of data acquisition is the use of its position. This position component creates the possibility to get and set the position of a rigidbody using the Unity physics engine. Since all virtual environments in Unity are related to a local coordinate reference system, planimetric x and y coordinates can be extracted in the scripting API. This coordinate reference system is similar to the one used in AutoCAD (see Figure 3), but consists of a different orientation. As a result, transformation of the extracted coordinates has to be taken into account in the processing phase of the acquired data. Since this data acquisition is intended for space-temporally coordinates, the awake function was also scripted in Visual Studio. This function includes a time component counting from zero to a various number of seconds at the end of each level. It will furthermore reset after the end of a scene so planimetric coordinates of the avatar can be extracted accompanied with correct time information resulting in x, y, z and t positions. Figure 5 illustrates the used avatar, including the orientation of the x and y axis of the local coordinate reference system used in Unity.
27
Figure 5: Avatar implementation and orientation of the local coordinate reference system.
With participants being able to move through the building, the next important step in the development is the scripting of the cameras. These are devices that capture and display the world to the player of the game. By customizing and manipulating cameras, the presentation of the game can be created in different unique ways. For this game, the camera had to be programmed to follow the avatar so participants are able to orientate in the building at all times. Important is the distinction that can be made between a first-person and third-person approach of the game. First-person allows the player to perceive the game through the eyes of the avatar, observing the world around them up close and giving a clear view of the scenery in front of them. Third-person games allow the player of the game to observe the avatar in action without giving the player the sense that they actually are the avatar (Denisova & Cairns, 2015). In this case, a combination of both approaches was used since participants have to feel like they are the avatar but still need a camera giving an overview of the avatar’s movement as initially showed in the instruction videos. There is no overview of the building, only the view through the eyes of the avatar and the feeling that the participant is the one moving around and finding his or her way. To create this perspective the refresh class was used in a script for the camera movement which updates the position of the camera with each frame. In this script the position of the camera is determined by extracting the position of a target, being the avatar, and adding fixed offsets in the x, y and z direction. Furthermore, the rotation of the camera was set equal to the rotation of the avatar to capture and display the world as seen by the avatar itself.
28
As a result of the chosen camera settings, a problem called wall-clipping occurred. This happens when players collide with a wall and rotate. Doing so, the camera goes through the wall and clips showing a display that cannot be seen by the player. Colliders were added to the camera, unfortunately without result. Possible solutions were switching to first-person or reprogramming the player movement and more specific the rotation. Since even professional games face this clipping problem, it was decided to make this problem less conspicuous by adjusting the camera offsets and adding an angle of 15 degrees to the camera view. If players follow the optimal path, as will be suggested by the instruction videos, this bug should never bother the participants. Figure 6 illustrates the implementation of the camera in Unity, including the target and the used offsets to avoid potential wall-clipping.
Figure 6: Camera implementation and used offsets. 2.3.2 Level development
As explained in the game concept, participants have to navigate through three different levels to succeed in the game and settle a high score. Based on the floorplan of the building (Figure 3), three different routes were created that completely cover the building. Some parts of the routes overlap, so players approach certain decision points from another direction, depending on the level. The route for level 1 is approximately 143 m long and contains fourteen decision points, in contrast to routes 2 and 3, which are respectively 185 m long with nineteen decision points and 176 m long with seventeen decision points.
29
To study a learning effect of participants wayfinding multiple times at these three routes, randomisation of the level-order had to be achieved. It is important that participants cannot predict what level comes first, second and last. To do so a script was programmed that randomises the level order at the start of each play. As a result, multiple participants have to play the levels in a different order during each try. Figure 7 illustrates the three indoor routes used for the game and related to the building floor plan.
Figure 7: Illustration of indoor route design from origin (O) to destination (D) for all three levels.
To create a realistic environment, different game-objects were added in Unity. Doors and stairs as shown on the floorplan (Figure 3) were implemented, based on a design from the asset store. The floor was given a material with a wooden texture and different artificial lights were created. Furthermore, the stairs got a metallic texture and the roof was attached including various domes, this to give participants a realistic indoor feeling during wayfinding. These domes consist of a glass material with high transparency, resulting in natural incidence of light and shadows in the building.
30
2.3.2.1 Landmarks
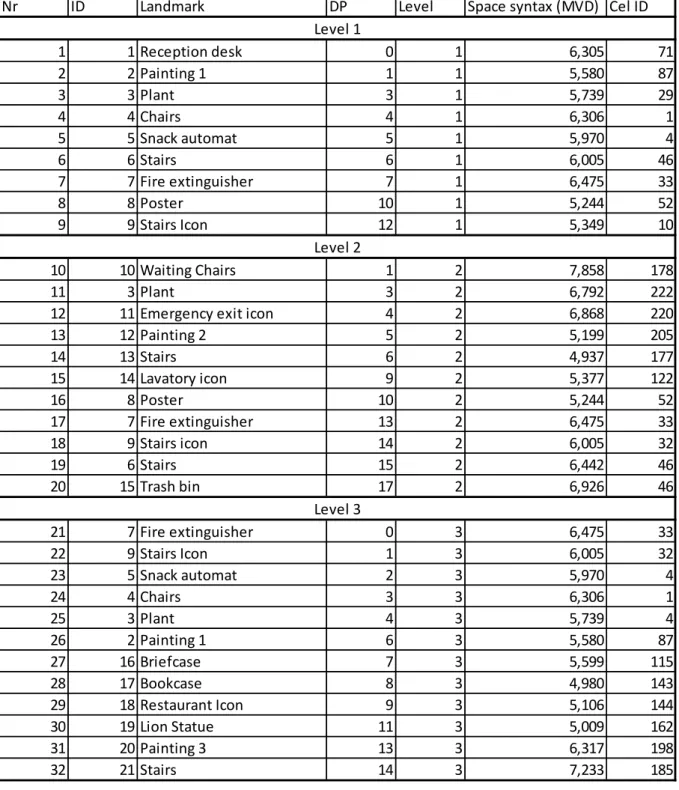
As discussed in the theoretical background, the game demands various cognitive skills and the ability to memorize different instructions over time. One of these skills is the recognition of remarkable environmental features or landmarks. In this study, these are various game-objects in the building that structure the human cognitive map of the environment and are used for orientation and formation of the mental map. Since they are irrefutably important during indoor wayfinding, 32 landmarks were used in the building, 21 of which were different. These landmarks (e.g. icons, posters, staircases) were modelled in the game and linked to certain decision points. For research purposes not all decision points were given a landmark. Decision points with multiple choices were always given a landmark, in contrast to decision points with only one possibility. Regarding to further analysis on space-temporal visualisations and potential correlations between decision points and landmarks, a grid was created above the floorplan. The grid has a resolution of 5 m and links landmarks and decision points to different raster cells with unique ID’s, represented in Table 1. Furthermore, it gives the opportunity to generate heat maps and visualise flows of participants through the building. In Attachment 1, the grid used for generating heat maps and locating landmarks and decision points in the building is represented. Finally, an expansion of Table 1 can be found in Attachment 2 including images and a general description for each landmark.
31
Table 1: Landmark overview.
2.3.2.2 Decision points
As illustrated in Table 1, each landmark is related to a corresponding decision point in a level. The game contains 50 decision points in total, represented by unique combinations of a level and an integer (DP in Table 1). As explained, space-temporal data is extracted during the tracking of each participant, resulting in x, y, z and t positions related to the design of the building. To be able to link this space-temporal data to the route and
Nr ID Landmark DP Level Space syntax (MVD) Cel ID
1 1 Reception desk 0 1 6,305 71 2 2 Painting 1 1 1 5,580 87 3 3 Plant 3 1 5,739 29 4 4 Chairs 4 1 6,306 1 5 5 Snack automat 5 1 5,970 4 6 6 Stairs 6 1 6,005 46 7 7 Fire extinguisher 7 1 6,475 33 8 8 Poster 10 1 5,244 52 9 9 Stairs Icon 12 1 5,349 10 10 10 Waiting Chairs 1 2 7,858 178 11 3 Plant 3 2 6,792 222
12 11 Emergency exit icon 4 2 6,868 220
13 12 Painting 2 5 2 5,199 205 14 13 Stairs 6 2 4,937 177 15 14 Lavatory icon 9 2 5,377 122 16 8 Poster 10 2 5,244 52 17 7 Fire extinguisher 13 2 6,475 33 18 9 Stairs icon 14 2 6,005 32 19 6 Stairs 15 2 6,442 46 20 15 Trash bin 17 2 6,926 46 21 7 Fire extinguisher 0 3 6,475 33 22 9 Stairs Icon 1 3 6,005 32 23 5 Snack automat 2 3 5,970 4 24 4 Chairs 3 3 6,306 1 25 3 Plant 4 3 5,739 4 26 2 Painting 1 6 3 5,580 87 27 16 Briefcase 7 3 5,599 115 28 17 Bookcase 8 3 4,980 143 29 18 Restaurant Icon 9 3 5,106 144 30 19 Lion Statue 11 3 5,009 162 31 20 Painting 3 13 3 6,317 198 32 21 Stairs 14 3 7,233 185 Level 1 Level 2 Level 3
32
decision point, invisible triggers were placed after each decision point in the building. These triggers are set as box colliders enabling the use of the ‘OnTriggerEnter’ function. A script was created that automatically increases the DP integer by one if a collision between the avatar and a trigger occurs. Starting from zero, the decision point value will keep increasing till the last trigger in a level is reached. The latter is called the end trigger, which will automatically reset the DP integer to zero, store time information to the database and starts the next scene in the game. Because this DP integer has to occur and be reset at the end of each level, so called static variables are used. In C-Sharp, static variables can be shared by all instances of the class and used in different scripts of a game. Furthermore, their use is very important for storing data related to a unique player ID. These values are also necessary during each level of the game, as will be further explained in section 2.3.3. Figure 8 illustrates the use of an invisible trigger and the activation of a corresponding script updating the static DP integer from 5 to 6 in level 1. Attachments 3, 4 and 5 give an overview of the location of each decision point in a level.
Figure 8: Invisible trigger (marked in green) as box collider triggering the corresponding script.
2.3.2.3 Space syntax
Another aspect of Table 1 is the space syntax column with mean visual depth (MVD) values for each corresponding decision point. As mentioned in the literature, space syntax is a term for a set of theories and techniques for the analysis of spatial configurations. It covers three elementary aspects of wayfinding: access graphs, axial maps and isovist (or visibility) fields (Lorenz et al., 2006). For this study, space syntax values were computed by use of the mean visual depth parameter as main syntactic parameter. It is convenient to utilise as it measures the
33
mean global number of visual turns to reach one specific point from every other point in the building. Doing so, it determines how deep a space lies in the global building structure. Furthermore, it gives more information about the centrality of locations in the building and how easy they are to reach for visitors.
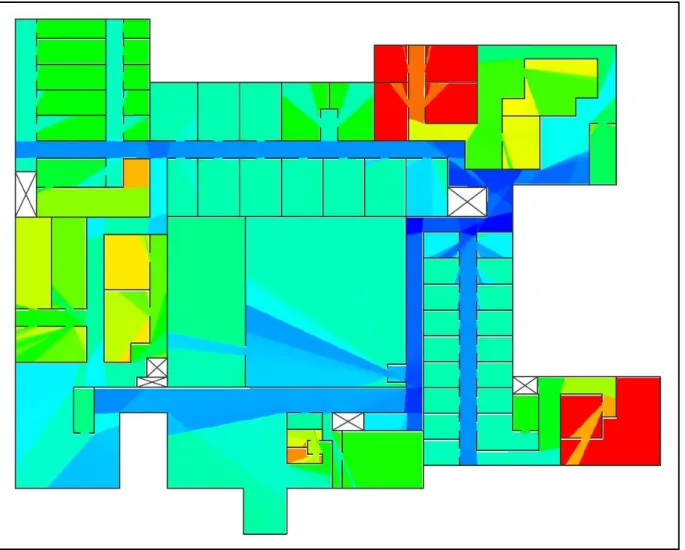
To compute values in the building used for the game, the open source ‘Isovist.org’ software was used. The result is a gridded floorplan containing values based on the MVD parameter. These values are initially scaled between a minimum and maximum MVD of respectively 4 (shallow or well-integrated) and 10 (deep or badly integrated). Based on this values, a color scale is present to visually provide more information about centrality of locations in the building. Figure 9 illustrates the processed floorplan including a blue to red color scale for the corresponding values. Blue areas are more central because they can be reached by a low number of visual steps from all the other places in the building. Red areas are more distant locations since more visual steps from all other places are needed to reach them. The values in Table 1 are absolute values computed by the software and are related to the initial MVD score between 4 and 10.
34
2.3.2.4 Instruction videos
Instruction videos of the avatar wayfinding through the building on the designed routes were finally recorded by use of the ‘ScreenRec’ application. These instruction videos were attached to the Unity Video Player and programmed to be shown in three different scenes, each of them before being able to play the corresponding level. To ensure participants can only watch the video one time, a new scene opens automatically at the end of each video and the ‘watch instructions’ button is disabled. Furthermore, the ‘play game’ button becomes clickable so players can start the corresponding level, which is randomly chosen by the game itself. In summary, five scenes are used for each level. Firstly, a menu scene before watching the video where the ’play game’ button is disabled but the ‘watch instructions’ button can be clicked. Secondly, the scene displaying the video containing the instructions for the corresponding level. Thirdly, again a menu scene after the video with information about the controls and the possibility to click the ‘play game’ button. Finally, scene four and five are respectively the level itself, giving participants the ability to find their way through the environment, and a scene containing the participant’s time and a transition button to the next level. To give participants an idea of their timing, a timer is shown whilst playing the level. Tis timer makes use of a digital representation of the awake time, for example ‘01:23’, which is scripted by use of the awake function as mentioned before. At the end of each level, this time will be stored in the database and subsequently reset by the script.
2.3.3 Database implementation and data acquisition
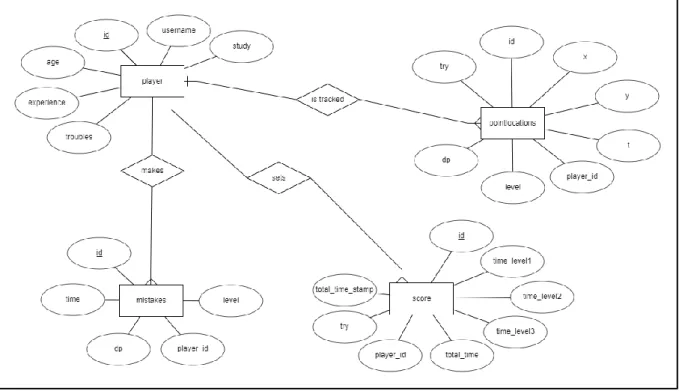
When creating a game intended for scientific research, one of the most important steps in the development is the creation of a database and its relation to the game. In this case, a relational Postgres database was created by use of pgAdmin, an open source administration and development platform for PostgreSQL. To illustrate the conceptual database design, an enhanced entity-relationship (EER) diagram is used. They are advanced database diagrams based on a diagrammatic technique for displaying entities, relations, attributes, sub-classes, super-classes, etc. Table 2 gives an overview of the used entities in the database, including a corresponding description of their content.
35
Table 2: ‘Indoor Navigation Simulator’ database entities.
Entity Description
player Database relation related to the registration and survey scene of the game. This entity was created with attributes related to the login and the survey answers. Each participant is assigned a unique ID when registering, which is important for the storage and retrieval of planimetric positions and time related information whilst playing.
pointlocations During the game, participants are tracked in the three different levels resulting in x, y, z and t positions. This database relation is used for the storage of these positions by use of different attributes, including ‘player_id’ as foreign key and link to the registered participant. Important is the storage per decision point, related to research on player based decisions and the use of landmarks in the environment. Since participants are able to play multiple times, an attribute ‘try’ was furthermore created. As a result data from the same participants during multiple playing times can be acquired and further used for research on a learning effect.
score For storage of information about the time of each participant, a relation called ‘score’ was created. This entity contains a time attribute for each level related to a ‘player_id’, again as foreign key, and a specific try. The three time attributes related to the corresponding levels are extracted and further used to compute a total time and timestamp, which are both attributes of this entity.
mistakes This database relation is created to gain insights in potential wrong turns during the indoor wayfinding. Since wrong turns are made by registered participants, this entity also has an attribute ‘player_id’ linking both tables. Wrong turns are stored for each participant, at a specific decision point in a level, in a specific try and after a various number of seconds.
Regarding the relationships between the different entities, only one-to-many connections were used. Registered participants are tracked resulting in multiple point locations, related to only one registered participant. The same goes for rows in the ‘mistakes’ and ‘score’ entities. Participants can go the wrong way multiple times, but wrong turns are all related to a single participant. They play three levels and doing so store three time scores, again all related to one participant per try. Figure 10 finally represents the EER-diagram of the relational database intended for data acquisition with the ‘Indoor Navigation Simulator’ game.
36
Figure 10: Enhanced entity-relation diagram of the ‘Indoor navigation Simulator’ database.
An important aspect of this EER-diagram is the correct representation of the relationship cardinalities2 and the use of unique primary keys for each entity, together being the two fundamentals for a correct conceptual database design (De Tré, 2017). Furthermore the use of a functional description, adding more information about certain relations or attributes, is of high importance. For this relational database, the following information is included in the description:
• After every successful play of three levels, the try corresponding to a specific ‘player_id’ will be increased by one.
• At the end of the third level, a total time and timestamp will be automatically calculated and assigned to the corresponding attributes in the ‘score’ entity.
• The decision point (dp) attribute in the ‘pointlocations’ entity will change whilst playing the game, depending on the position of the player in the building and the used trigger mechanism.
The next step in the game development is creating the data acquisition component by use of scripting in Visual Studio (C#), PHP and structured query language (SQL). In game development it is of high importance, mainly for security reasons, that SQL database commands are used at the server side with for example PHP. From Unity, the ‘UnityWebRequest’ class can then be used, scripted in Visual Studio, to communicate with a PHP-script for