Department of Cardiovascular Sciences
Centre for Molecular and Vascular Biology
_____________________________________________________________________________________
HEART FAILURE WITH PRESERVED EJECTION
FRACTION – A COMPARISON OF ANIMAL
MODELS AND THE ROLE OF ENDOTHELIAL
PITX2 LOSS
Jana Raman
Student number: 01508173
Supervisor(s): Prof. Dr. Elizabeth Jones (KU Leuven) Prof. Dr. Bart P. Braeckman
Scientific tutor: Dr. Steven Simmonds (KU Leuven)
Master’s dissertation submitted to obtain the degree of Master of Science in Biology Academic year: 2019 - 2020
2 © Faculty of Medicine – Center for Molecular and Vascular Biology
All rights reserved. This thesis contains confidential information and confidential research results that are property to the KU Leuven. The contents of this master thesis may under no circumstances be made public, nor complete or partial, without the explicit and preceding permission of the KU Leuven representative, i.e. the supervisor. The thesis may under no circumstances be copied or duplicated in any form, unless
permission granted in written form. Any violation of the confidential nature of this thesis may impose irreparable damage to the KU Leuven. In case of a dispute that may arise within the context of this declaration, the Judicial Court of KU Leuven only is competent to be notified.
3
Table of Contents
1 LIST OF ABBREVIATIONS ... 5
2 ABSTRACT ... 7
3 INTRODUCTION ... 7
3.1 Heart Failure with preserved Ejection Fraction ... 8
Measuring changes in cardiac function through echocardiography ... 9
Cardiac tissue stiffness is at the heart of HFpEF ... 12
3.2 Modelling HFpEF in the lab ... 14
Zucker fatty and spontaneously hypertensive heart failure F1 hybrid (ZSF1) rat ... 15
db/db leptin receptor deficient mouse ... 15
High Fat Diet and L-NAME fed mouse ... 16
Spontaneous senescence prone (SAMP) mouse ... 16
3.3 Microvascular regression as the driving mechanism for rarefaction ... 17
Loss of endothelial Pitx2 expression coincides microvascular regression in the ZSF1 rat ... 18
4 HYPOTHESIS, AIM & OBJECTIVES ... 20
5 MATERIALS & METHODS ... 21
6 RESULTS ... 27
6.1 CHAPTER I: characterisation of HFpEF in 3 murine comorbidity models ... 27
Of all models tested, only 1% salt treatment in db/db mice induces obesity ... 27
All three models induced different stages of diastolic dysfunction ... 28
HFD + L-NAME treatment causes elevated cardiac leukocyte infiltration ... 31
Aging and HFD + L-NAME treatment cause cardiac fibrosis ... 32
1% salt treatment in obese db/db mice induces cardiomyocyte hypertrophy ... 33
1% salt treatment in obese db/db mice causes coronary microvascular rarefaction ... 34
6.2 CHAPTER II: characterisation of the Pitx2ECKO mouse ... 37
Endothelial loss of Pitx2 at 1 week of age causes systolic dysfunction ... 37
Endothelial loss of Pitx2 at 1 week of age causes coronary microvascular rarefaction ... 38
7 DISCUSSION ... 40
7.1 CHAPTER I: db/db salt treated mice most accurately recapitulate human HFpEF ... 40
None of the models present with pulmonary congestion ... 40
Only salt treated db/db mice exhibit obesity ... 41
All models present with different stages of diastolic dysfunction ... 42
4
Cardiomyocyte hypertrophy and enlarged heart are not consistently present in the models ... 43
Only salt treated db/db mice exhibit coronary capillary rarefaction and active regression ... 44
Db/db salt treated mice most accurately recapitulate HFpEF ... 45
7.2 CHAPTER II: endothelial Pitx2 loss induces systolic dysfunction and coronary microvascular rarefaction uncoupled of cardiomyocyte enlargement ... 46
Endothelial Pitx2 loss at 1 week of age causes systolic dysfunction ... 46
Endothelial Pitx2 loss at 1 week of age induces coronary microvascular rarefaction uncoupled from cardiomyocyte enlargement ... 46
7.3 CHAPTER III: proposed mechanism and future perspectives ... 47
Aging as proposed backbone process for comorbidity-induced HFpEF pathogenesis ... 47
Future improvements of the current model ... 49
8 SAMENVATTING ... 50
9 ACKNOWLEDGEMENTS ... 53
10 REFERENCES ... 54
5
1 LIST OF ABBREVIATIONS
A Late mitral inflow blood peak velocity A’ Late diastolic mitral annulus peak velocity
BNP Brain natriuretic peptide
Col Collagen
DAB 3,3'-diaminobenzidine
DAPI 4',6-diamidino-2-fenylindool DPX Distrene plasticizer xylene
DT Deceleration time
E Early mitral inflow blood peak velocity E’ Early diastolic mitral annulus peak velocity
ECM Extracellular matrix
EF Ejection fraction
HA Hyaluronan
HF Heart Failure
HFD High Fat Diet
HFpEF Heart Failure with preserved Ejection Fraction HFrEF Heart Failure with reduces Ejection Fraction
HRP Horse Radish Peroxidase
IB4 Isolectin B4
IGF-1 Insulin-like Growth Factor 1
IHC Immunohistochemistry
IL-6 Interleukin 6
IVRT Isovolumetric relaxation time
L-NAME Nω-nitro-l-arginine methyl ester hydrochloride
LOX Lysyl oxidase
LV Left ventricle
LVIDd Left ventricular internal dimension at end-diastole
MeOH Methanol
NADPH Nicotinamide adenine dinucleotide phosphate oxidase
NO Nitric oxide
NOS Nitric oxide synthase
PBS Phosphate-buffered Saline
PBT Phosphate-buffered saline with triton PDGF Platelet derived growth factor (PDGF)
PFA Paraformaldehyde
Pitx2 Paired-like homeodomain transcription factor 2
PKG Protein kinase G
PW Pulsed wave
ROS Reactive oxygen species
RT Room temperature
T2DM Type 2 diabetes mellitus
6
TBS Tris-buffered saline
TGF-β Transforming growth factor β1
TNB Tris-NaCl-blocking
TNF-α Tumour necrosis factor α
TNT Tris-NaCl-tween buffer
TSG-6 Tumour necrosis factor-inducible gene 6 VEGF Vascular endothelial growth factor
7
2 ABSTRACT
More than half of heart failure patients are diagnosed with Heart Failure with a preserved Ejection Fraction (HFpEF), a clinical syndrome characterized by cardiomyocyte stiffening, cardiac fibrosis,
hypertrophy, and inflammation, which promote the development of diastolic dysfunction. HFpEF patients suffer from exercise intolerance, pulmonary congestion, peripheral oedema, and encounter high mortality rates. Increasingly, HFpEF is being characterised as a systemic progressive syndrome, that starts from peripheral risk factors and culminates in heart failure. Typical associated comorbidities, such as increased age, obesity, type 2 diabetes, hypertension, and kidney disease, are hypothesised to drive HFpEF
development by exposing endothelial cells to systemic inflammation and oxidative stress.
The exact pathogenesis of HFpEF remains unelucidated, and our understanding of disease is further impeded by the absence of appropriate animal models that accurately mimic the complex heterogeneity in disease presentation by different patient cohorts. The first objective of this thesis project is to compare two existing mouse models (aged mice and db/db salt treated mice) and one recently published HFpEF model (high fat diet and L-NAME treated mice; HFD + L-NAME) upon different HFpEF features.
Additionally, our preliminary data indicate that endothelial-specific loss of paired-like homeodomain transcription factor 2 (Pitx2) expression may drive vessel regression and HFpEF progression. Therefore, the second aim is to investigate the occurrence of coronary microvascular rarefaction, in a conditional inducible Pitx2ECKO mouse. To achieve this all, animals were examined for changes in morphometry,
cardiac function using echocardiography, and cardiac remodelling via histological techniques.
We demonstrate that db/db mice given a salt treatment most accurately recapitulate the human HFpEF phenotype. These mice were the only model with obesity and the advanced, restrictive stage of diastolic dysfunction, coupled to coronary capillary rarefaction and cardiomyocyte enlargement. The salt diet thus accelerated diastolic dysfunction development, compared to untreated db/db mice. HFD + L-NAME treated mice exhibited a pre-restrictive stage of diastolic dysfunction and the mild form of cardiac remodelling, which corresponded less to the HFpEF phenotype than expected. Of all models tested, the aged mice demonstrated the mildest stage of diastolic dysfunction, accompanied by increased fibrosis. However, the observed pseudonormal phase of diastolic dysfunction was still more severe compared to aging models specifically selected for their age-related abnormalities. We propose a concept in which the aging process functions as the backbone of HFpEF pathogenesis. In healthy conditions, the lifespan is too short, and the aging process cannot act long enough on the heart. However, when triggered by metabolic or mechanical stress in the form of comorbidities, cardiac aging gets stimulated and results in more advanced cardiac remodelling and diastolic dysfunction.
Endothelial Pitx2 deficiency resulted in systolic dysfunction rather than diastolic dysfunction and a reduction in coronary microvascular density, uncoupled of cardiomyocyte enlargement. A second experiment where Pitx2 is only conditionally deleted upon adulthood in Pitx2ECKO mice, is ongoing.
The variation between our different comorbidity models, and the heterogeneity found in HFpEF patients highlight the need for multiple appropriate animal models to further understand this complex disease.
8
3 INTRODUCTION
3.1 Heart Failure with preserved Ejection Fraction
The healthy heart is a strong muscular organ that pumps blood continuously through the circulatory system, providing the body with oxygen and nutrients. The cardiac cycle is divided into diastole and systole. Diastole represents ventricular filling, while systole represents ventricular contraction and subsequent blood ejection into the aorta. Diastole begins at the closing of the aortic valve, between the left ventricle (LV) and the aorta. The LV relaxes, fills with blood, and the closing of the mitral valve, between the left atrium and the LV, terminates diastole. Systole starts when the mitral valve closes. The pressure within the ventricles becomes greater than adjacent aorta and blood will be directed outwards. Systole ends with the closure of the aortic valve [1].
Heart failure (HF) is a clinical syndrome in which the capacity of the heart is unable to meet the required cardiac output, defined as the amount of blood ejected per minute, to meet the body’s metabolic needs [2]. As the heart attempts to maintain adequate cardiac output levels, several compensatory mechanisms are initiated. In early stages, these measures are beneficial, as they superficially promote physiological functioning, however, on the long term, they gradually worsen the vicious circle of heart failure. Patients develop several clinical symptoms, including tachycardia, dyspnea from pulmonary congestion, peripheral oedema, nausea, exercise intolerance, and fatigue [2]. HF is responsible for 1-3% of the total healthcare costs in the USA, Europe, and Latin America and causes the largest proportion of hospitalisations in Europe [3]. While HFpEF emerges rapidly as a clinical problem and no effective treatments are available [4].
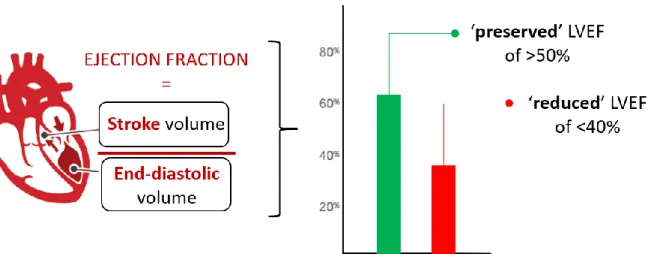
More than half of the HF patients are diagnosed with Heart Failure with a preserved Ejection Fraction (HFpEF). HFpEF is a pathological condition characterized by cardiac stiffening, fibrosis, hypertrophy and inflammation [5]. Consequentially, the heart encounters reduced compliance and impaired blood filling of the LV during diastole and thus develops ‘diastolic dysfunction’. This results in a decreased LV blood volume at end-diastole, so that less blood is ejected into the aorta at systole. This volume of ejected blood is referred to as the stroke volume. The ratio of stroke volume over end-diastolic volume in the LV defines the Ejection Fraction (EF) (Figure 1). HFpEF patients display a ‘preserved’ EF as both volumes are
diminished [6].
Besides HFpEF, HF patients can also suffer from Heart Failure with reduced Ejection Fraction (HFrEF). In the heart of HFrEF patients, only the stroke volume reduces, resulting in a reduced EF (Figure 1) [2]. Either ischemia, infection, toxicity, or a combination of these induces a substantial cellular oxidative stress upon cardiomyocytes. These cardiomyocytes undergo necrosis, apoptosis, and autophagy, which results in the typical eccentric hypertrophy in HFrEF patients. Dead cardiomyocytes are replaced by collagen, thereby creating patchy areas of fibrosis [7]. Together, this LV remodelling causes the systolic dysfunction that characterises the HFrEF disease. Thus, HFrEF initiates from the heart as cardiac-centred pathology causing peripheral changes.
9
Figure 1: Defining ‘preserved’ and ‘reduced’ left ventricular ejection fraction (LVEF). The EF is defined by the ratio between stroke volume ejected into the aorta at systole, and the end-diastolic volume of the filled left ventricle. An EF lower than 40% is generally acknowledged to be ‘reduced’. In HFpEF both the end-diastolic and therefore also the stroke volume diminish, resulting in a preserved EF above 50%. EF = ejection fraction. Adapted from Wilcox et al. 2012 [8].
In contrast to the cardiac-centred HFrEF, HFpEF is increasingly being defined as a systemic progressive syndrome that starts with peripheral changes driven by comorbidities that progresses in heart failure [9], [10]. Initially, HFpEF was thought to be the result of an increased afterload on the LV due to arterial hypertension [10]. However, HFpEF is more and more seen as a systemic disease, originating from a systemic inflammatory state [10]. HFpEF is typically associated with multiple risk factors and
comorbidities that severely affect disease outcome. These include increased age (64-80 years), obesity (41-62%), Type 2 diabetes mellitus (T2DM; 26-45%), hypertension (55-86%), kidney disease (9-48%), and chronic obstructive pulmonary disease (COPD; 7-31%) [11][12]. Moreover, HFpEF is represented by an almost two-fold higher prevalence in women than in men [13]. This cluster of HFpEF comorbidities induce systemic inflammation and result in increased plasma levels of interleukin 6 (IL-6) and tumour necrosis factor α (TNF-α), and cause coronary endothelial dysfunction and ultimately to diastolic dysfunction [10]. As a consequence of the aging population and improved survival of patients with comorbidities, the incidence of HFpEF is increasing at an alarming rate and is expected to rise even further [14]. Importantly, the presence and severity of these comorbidities have great impact on clinical outcome of HFpEF patients [15]. Almost all comorbidities, expect hypertension, independently elevate patient mortality, with COPD being the best predictor [16]–[18]. Overall, short-term mortality (30-90 days) in the peri-hospitalisation period typically ranges between 5 and 9.5%, while long term (5 years) mortality rates are consistently high and varying from 55 to 74% [12]. The adverse link between HFpEF prognosis and its comorbidities
increasingly advocates to perceive the comorbidities as drivers of HFpEF development, and to target them in HFpEF treatment [16].
Measuring changes in cardiac function through echocardiography
HFpEF is a condition that requires the combination of several echocardiography techniques for its diagnosis. Using echocardiography, typical functional parameters can be observed, such as EF and stroke volume. EF and stroke volume are informative haemodynamic parameters for systolic function, which can be assessed using M-mode imaging of the myocardial movement [4]. While HF is classified based on the EF, this value alone lacks efficacy in the diagnosis HFpEF, as patients exhibit a preserved EF [4]. Despite
10 this shortcoming, historical studies often only investigated this parameter, complicating the available literature.
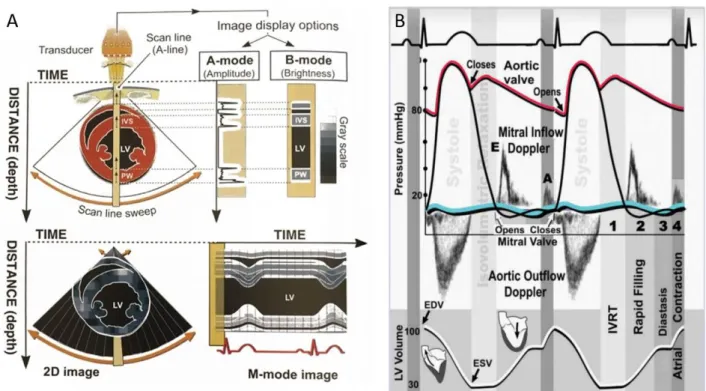
In echocardiography, the M-mode imaging allows for accurate and real-time measurements of wall dimensions (thickness and diameters at systole and diastole) and heart rate. From these parameters many systolic and hypertrophy parameters can be derived (Figure 2A). At end-diastole, the LV Internal Diameter (LVIDd) and the LV Posterior Wall Thickness (LVPWd) can be measured using M-Mode imaging and together with the Relative Wall thickness (RWT) allow for the evaluation of LV hypertrophy and dilatation [19]. Increased RWT then indicates a hypertrophy of the wall in the LV.
To diagnose diastolic dysfunction, pulsed waved (PW) and tissue Doppler are used for assessing blood flow and myocardial velocity respectively (Figure 2B). PW and tissue Doppler use the Doppler principle, where moving objects change the characteristic of sound waves. By sending short and quick pulses of sound, it allows the accurate measurement of the blood (PW Doppler) or myocardial wall (tissue Doppler) velocity at a precise location and in real time. Estimates of blood and myocardial wall flow velocity are subsequently calculated by comparing the frequency change between the transmitted and reflected sound waves, whereby an increase in Doppler shift indicates an increased blood flow velocity and vice versa.
Figure 2: Different echocardiographic imaging modalities (A) M-mode imaging. (B) Cardiac cycle with pulsed wave Doppler imaging and electrocardiogram. The first phase of diastole, the isovolumic ventricular relaxation time (IVRT), comprises the left ventricular filling from the closure of the aortic valve until the opening of the mitral valve. Blood flows then passively from the left atrium in the ventricle (rapid passive filling) with an early mitral inflow peak velocity (E). During diastasis, active left ventricular relaxation is completed. During arterial systole, the left atrium contracts to accelerate the blood flow from the left atrium to the ventricle. The peak velocity of blood during this period is called the arterial or “late” mitral inflow peak velocity (A). EDV, end-diastolic volume; ESV, end-systolic volume. Left: from Braunwald’s Heart disease. 2018 [20]. Right: from Ho C.Y. 2007 [21].
11 The four distinct phases of diastole can be assessed by Doppler imaging (Figure 2B). In the healthy heart, the isovolumic relaxation time (IVRT) starts at the closure of the aortic valve (end-systole) and ends at the opening of the mitral valve (start of diastole), representing an interval where the LV is a closed relaxed chamber. The IVRT can be measured by PW doppler. When the pressure in the LV falls below the pressure in the left atrium, leading to the opening of the mitral valve. Blood flows passively from the left atrium to the left ventricle (rapid passive filling). Both the peak velocities of blood flow during early filling (E) and the time from the E peak to the reach baseline velocity, called deceleration time (DT), can be measured by PW Doppler. The velocity of the cardiac muscle during this early filling phase, early diastolic mitral annulus peak velocity (E’), can be measured by tissue Doppler. During the third phase, diastasis, active left
ventricular relaxation is completed, and the left ventricle slowly fills. This phase can be assessed both by PW and tissue Doppler. During the last phase of diastole, the atrial kick, the left atrium contracts, accelerating blood flow from the left atrium to the ventricle. The A peak velocity of blood (late mitral inflow velocity) and A’ peak of cardiac movement (late diastolic mitral annulus peak velocity) can be assessed by PW and tissue Doppler respectively. Alterations of any of these diastolic phases leads to diastolic dysfunction [1].
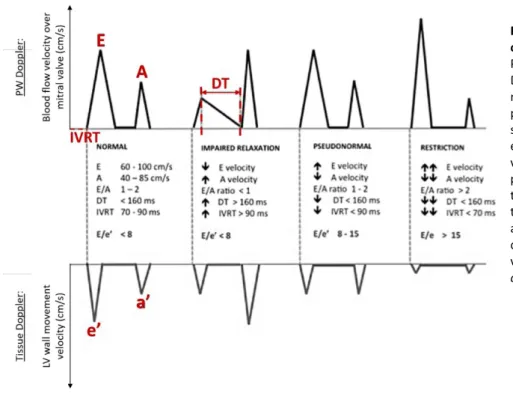
Aforementioned diastolic measurements are the best echocardiographic markers to categorise the grade of diastolic dysfunction (Figure 3) [22]. In the healthy human heart, the E and E’ peaks are higher than the A and A’ peak respectively, inducing an E/A ratio between 1 and 2. Short DT and IVRT together with the unchanged E/E’ ratio indicate preserved blood flow and relaxation of the LV during passive filling (Figure 3). Based on the parameters in this normal situation, diastolic dysfunction can be subdivided into 3 phases.
During the first, ‘impaired relaxation stage’, the LV shows reduced diastolic relaxation capacity in terms of compliance and elastic recoil, resulting in a slower LV pressure decline. Subsequently, it takes more time before the LV pressure equals the left atrial pressure, prolonging the IVRT. Due to the decreased
relaxation, the LV passive filling occurs at lower velocities (E peak decreases), the filling-time extends (DT increases) and the A velocity is increased. As such, the atrial contraction compensates for the decrease in early filling, resulting in an E/A <1. As both early peak blood flow and muscle velocity are reduced, E/E’ remains unchanged (Figure 3). Secondly, at the ‘pseudonormal stage’, progressive diastolic dysfunction causes the left atrial pressure to rise, driving the force to fill the LV at early diastole, leading to increased E velocities. However, while E increases, A decreases due to stiffening of the wall, resulting in a
pseudonormal E/A. However, the E/E’ ratio is severely increased due to reduced muscle relaxation (E’) (Figure 3). Finally, during the ‘restriction stage’, the E/E’ ratio rises further due the reduced E’ and increased filling at early diastole (E) (Figure 3) [23].
12
Figure 3. Theoretical filling patterns of 4 stage of diastolic dysfunction. Pulsed Wave Doppler and Tissue Doppler Imaging during the (1) normal, (2) impaired relaxation, (3) pseudonormal and (4) restriction stage of diastolic dysfunction. E = early mitral inflow blood peak velocity. A = Late mitral inflow blood peak velocity. DT = Deceleration time. IVRT = Isovolumetric relaxation time. e’ = early diastolic mitral annulus peak velocity. a’ = late diastolic mitral annulus peak velocity. Adapted from Vermeiren, et
al., 2015 [23].
Based upon PW Doppler examination alone, not all diastolic dysfunction grades of HFpEF are clearly distinguishable from the healthy heart. A comprehensive assessment of diastolic dysfunction through echocardiography should therefore integrate PW and tissue Doppler imaging [24]. However, the absence of elevated filling pressures during assessment at rest does not preclude patients from having profound haemodynamic impairments during exercise. HFpEF patients, especially at an early stage of the disease, are therefore easily missed. It has been proposed to introduce invasive stress testing for better
identification means. Right heart catheterisation and cardiac magnetic resonance imaging are not standard procedure to date, but could improve diagnostic sensitivity and staging in HFpEF patients [25].
Cardiac tissue stiffness is at the heart of HFpEF
The heart of HFpEF patients demonstrates diastolic dysfunctional since the myocardial tissue becomes gradually stiffer, attenuating the relaxation of the LV during diastole [26]. Myocardial stiffness in HFpEF results of (1) qualitative and quantitative extracellular matrix (ECM) changes, such as increased deposition of interstitial collagen and more collagen crosslinking [27], and (2) stiffness of the cardiomyocytes
themselves [28].
In the healthy heart, fibroblasts are responsible for the formation of the ECM by producing and secreting collagen. The cardiac ECM is mainly composed of thicker collagen type I fibres (~85%), which confer tensile strength, and thin collagen type III fibres (~11%), that maintain the elasticity of the matrix network [29]. In addition to collagens, the cardiac ECM also contains glycosaminoglycans (e.g., hyaluronan), glycoproteins (e.g., fibrillin), and proteoglycans (e.g., syndecan). Under pathophysiological stresses, such as aging, hypertension, T2DM, myocardial injury, toxic insults, and pressure overload, augmented cardiac fibrosis develops as a result of elevated levels of circulating transforming Growth Factor β (TGF-β). TGF-β
13 is a pro-fibrotic cytokine, present as a latent complex in the ECM of healthy hearts [30]. However, in HFpEF patients, circulating levels of TGF-β are elevated [31]. TGF-β mediates differentiation of fibroblasts into contractive and secretory myofibroblasts that contribute to cardiac fibrosis by promoting collagen deposition over degradation [32-33]. Collagenous septa detach and insulate cardiomyocytes, hampering myocyte-myocyte interactions ultimately contributing to cardiac dysfunction [32]. In addition to increased collagen depositions, collagen crosslinking raises through upregulation of the collagen crosslinker lysyl oxidase (LOX). Furthermore, increased LOX levels are associated with an impaired E/E’ ratio in HFpEF patients [27].
Myocardial stiffness can be aggravated by intracellular cardiomyocyte alterations that stiffen the cardiomyocytes themselves. These changes occur due to modifications of the giant protein titin and reduced calcium (Ca2+) signalling. Titin is a bidirectional spring in the cytoskeleton responsible for the
distensibility of cardiomyocytes, which is defined as the end-diastolic pressure required to distend the LV to the end-diastolic volume [10]. HFpEF patients suffer from reduced distensibility indicated by an increased end-diastolic pressure [34]. Alternative splicing results in two titin isoforms: the longer, more flexible N2BA and shorter, but stiffer N2B isoform. Isoform switching from the more flexible N2BA to the stiff N2B increases cardiomyocyte stiffness and is observed in animal models of HFpEF and the associated comorbidities [35]. Besides isoform switching, the post-translational modification influences the
cardiomyocyte stiffness. For example, hypophosphorylation of N2B at the protein kinase G (PKG) site also causes titin to become stiffer [36]. Secondly, cardiomyocyte relaxation depends on a drop of the cytosolic Ca2+ levels. Ca2+ is sequestered in the sarcoplasmic reticulum and extruded into the extracellular space
upon activation of the cardiomyocyte [28]. Myocardial cytoplasmatic Ca2+ levels of HFpEF patients are
elevated indicating impaired Ca2+ removal and thus impaired cardiomyocyte relaxation [37].
Excessive myocardial fibrosis, cardiomyocyte stiffness and attenuated active relaxation contribute to elevated LV diastolic stiffness, resulting in diastolic dysfunction in HFpEF patients [38-39]. During the early stages of the disease course, the relative importance of cardiomyocyte-based alterations of stiffness takes precedence over ECM-based changes, that become more prominent in the advanced stages [40].
Additionally, cardiomyocyte changes, such as elevated myofibrillar density and cardiomyocyte stiffness, induce cell growth in a transverse direction, while cell length is maintained constant. Consequently, cardiomyocyte concentric hypertrophy develops, as reflected by LV wall thickening and an increased wall-to-chamber radius ratio [41]. Furthermore, cardiomyocyte hypertrophy correlates with declined Protein Kinase G (PKG) activity in the HFpEF biopsies, which has been associated with decreased cardiomyocyte relaxation [42].
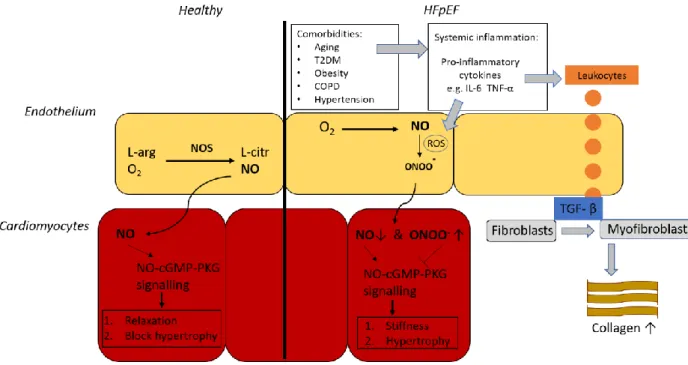
Cardiomyocyte relaxation is at least partly driven by the nitric oxide (NO) bioavailability in cardiomyocytes [43]. Paulus et al. proposed that a systemic inflammatory state was proposed to lowers NO bioavailability, which in the healthy heart is responsible for cardiomyocyte relaxation and inhibition of hypertrophic stimuli triggered by afterload excess (Figure 4). Cardiac nitrosative stress would thereby causes
dysregulated NO-cGMP-PKG signalling, which induces three effects. Firstly, nitrosative stress inhibits the phosphorylation of phospholamban, which impairs active cardiomyocyte relaxation by reducing the phospholamban-mediated uptake of Ca2+ uptake in the sarcoplasmic reticulum. Secondly,
hypophosphorylation of the N2B titin segment is hyperphosphorylated by low PKG activity, that elevates cardiomyocyte stiffness. Both the increased diastolic cytoplasmatic Ca2+ levels and cardiomyocyte
14 stiffness cause cardiac stiffening, resulting in attenuated LV filling [44]. Lastly, the decline in PKG activity allows for the development of cardiac hypertrophy as it cannot inhibit the hypertrophic pathways
triggered by pressure overload anymore. Thus, the inhibition of PKG results in cardiomyocyte hypertrophy [45]. In HFpEF, LV hypertrophy occurs concentric which minimises cardiac wall stress as reflected by the normal circulating BNP concentration [9]. Additionally, systemic and microvascular inflammation would activate small numbers of invading inflammatory cells, expressing the pan-leukocyte marker CD45 [46– 48]. Moreover, infiltrated leukocytes mediate TGF-β secretion, thereby promoting the differentiation of collagen-secreting myofibroblasts, which contribute to cardiac fibrosis [32], [33] (Figure 4).
Figure 4. Nitrosative stress as a novel driver for HFpEF pathogenesis. Left. in the healthy heart L-arginine (L-arg) and oxygen are converted to L-citrulline and NO by NO Synthase. NO diffuses towards adjacent cardiomyocytes, where it activates cGMP-PKG signalling. PKG activity is responsible for cardiomyocyte relaxation and blocks different hypertrophic pathways. Right. The novel paradigm of Paulus et al. postulates that HFpEF-associated comorbidities such as aging, T2DM, Obesity, COPD, and hypertension induce a systemic inflammatory state. This state is reflected by a circulating profile of pro-inflammatory cytokines, like IL-6 and TNF-α. Resultant excessive ROS production on the one hand lowers NO bioavailability by converting NO to ONOO-. On the other
hand, promoted leukocyte infiltration causes increased levels of TGF-β, which stimulates the differentiation of fibroblasts into myofibroblasts leading to an excess deposition of collagen in the heart. The balance shift from NO to ONOO- in adjacent
cardiomyocytes attenuates NO-cGMP-PKG signalling, which leads to cardiomyocyte stiffness and hypertrophy. O2 = oxygen. NOS
= Nitric oxide synthase. cGMP = cyclic guanosine monophosphate. PKG = Protein Kinase G. T2DM = Type 2 Diabetes Mellitus. COPD = Chronic Obstructive Pulmonary Disease. IL-6 = Interleukin-6. TNF-α = Tumour Necrosis Factor α. Peroxynitrite = ONOO-.
Reactive Oxygen Species = ROS. TGF-β = Transforming Growth Factor β. Adapted from Paulus, et al. 2013 [10].
3.2 Modelling HFpEF in the lab
A critical obstacle in the therapeutic innovation in HFpEF is the absence of animal models that accurately mimic the heterogenic complexity of human pathology. While the current evolving paradigm states that HFpEF development cannot be uncoupled from its comorbidities [10], the incomplete pathological understanding of HFPEF has hampered the development of novel therapeutics. Moreover, HFpEF patients are often oligo- or asymptomatic until late in the disease process, impeding standardised diagnosis upon
15 clinical signs and symptoms. HFpEF aetiology and pathophysiology are variable among patients [49], making HFpEF heterogeneous, encompassing a large spectrum of disease presentation and increasing the difficulty of clear diagnosis [50]. To improve the pathological understanding, the development of animal models mimicking human pathology is crucial. However, given the heterogeneity in exhibited
comorbidities by patients, it is likely that any animal model only resembles a certain proportion of HFpEF cases. Relevant preclinical HFpEF models will be important to unravel the contribution of different comorbidities to the disease development and will provide mechanistic information. Moreover, existing animal models often result from complex breeding, which impairs genetic modification, further impeding the understanding of the underlying mechanisms in disease development [9].
An ideal preclinical model of HFpEF should meet three criteria. First, the induction of HFpEF in the animal model should reflect the known triggers in patients as closely as possible. As such, mild but chronic stimuli must be used, rather than stimuli with an acute onset. Second, the animals must mimic the human disease characteristics and symptoms as accurately as possible. This includes, measurable signs, such as an EF above 50% combined with diastolic dysfunction, exercise intolerance, pulmonary congestion, and myocardial remodelling [9]. Given the diseases heterogeneity, it is important that the set of comorbidities in the model are carefully selected for each research purpose. Lastly, the animal model should offer easy access to genetic manipulations in order to facilitate interventions as to elucidate key molecules and pathways in the disease progression. The more comorbidities involved, the more the animal model represents a complete HFpEF model, but this also complicates its genetic background countering easy genetic manipulation.
Zucker fatty and spontaneously hypertensive heart failure F1 hybrid (ZSF1) rat
The ZSF1 rat is developed by crossing rat strains with two different leptin receptor mutations (fa and facp).
A lean female Zucker diabetic fatty rat (+/fa) is crossed with a lean male Spontaneously Hypertensive HF rat (+/facp) to generate both the obese and lean ZSF1 (fa/facp) offspring. The obese ZSF1 rats are
hypertensive and have unfunctional leptin receptors, leading to a disrupted energy balance. As a result, obese ZSF1 rats exhibit obesity, T2DM, and hypertension, resulting eventually in the development of HFpEF, while the lean heterozygous controls are only hypertensive [51]. The disease is presented by concentric cardiac LV hypertrophy, diastolic dysfunction with preserved EF, cardiomyocyte enlargement, cardiac fibrosis, and increased myocardial stiffness [52]. Furthermore, pulmonary congestion, impaired exercise tolerance, and chronic kidney disease are described [53-54]. The ZSF1 model is an acknowledged model for HFpEF, combining several comorbidities to mimic the human phenotype of different patient cohorts, however as it is a rat based model, genetic interventions to explore disease onset are largely unavailable [9].
db/db leptin receptor deficient mouse
The db/db mouse has a point mutation in the leptin receptor causing to hyperphagia, an extreme, unsatisfied drive to consume food, and spontaneous obesity accompanied by T2DM. The initial insulin resistance progresses towards deficient insulin secretion, similar to T2DM pathogenesis in humans [55]. Moreover, mice exhibit features of human T2DM, such as hyperglycaemia and increased circulating
16 glucagon levels, that are not present in weight-matched C57BL/6J mice fed a western diet [55]. Although
db/db mice display diastolic dysfunction with preserved EF compared to db/+ controls, they initially do
not show cardiac hypertrophy and only develop it at older ages [56]. The animals show a systemic pro-inflammatory state in early disease (8 weeks), which dampens over time [57]. At the cellular level, elevated cardiac fibrosis, cardiomyocyte stiffness and capillary rarefaction are evidenced [58]. Pulmonary congestion paralleled by exercise intolerance and the reduced circulating BNP levels complete the
required HFpEF phenotype [58-61]. Genetic interventions are possible in this model but are made difficult because they require time-consuming backcrossing of mouse colonies onto the db/db mutation.
Additionally, both this model and the ZSF1 rats develop HFpEF due to a receptor mutation not common in human HFpEF development.
High Fat Diet and L-NAME fed mouse
Recently, Schiattarella et al. published a novel HFpEF model driven by concomitant metabolic and mechanical stress elicited by High Fat Diet (HFD) induces obesity and Nω-nitro-l-arginine methyl ester hydrochloride (L-NAME) induced hypertension, respectively [62]. In this model, C57BL/6N mice are subjected to a 5-weeks-long HFD and L-NAME treatment. L-NAME is a potent nitric oxide synthase (NOS) inhibitor that limits the NO bioavailability in endothelial cells (ECs) [63]. Since arteries normally dilate in response to acetylcholine through NO-cGMP-PKG signalling in relaxing smooth muscle cells, L-NAME administration functions as an endothelial dysfunction-based driver of hypertension [64-65]. Even, an inverse, contractile response to acetylcholine has been apparent when NOS was inhibited by L-NAME [66]. This ‘two-hit’ model displays worsened diastolic dysfunction with preserved EF, coupled to pulmonary congestion and exercise intolerance. At histological level, HFD + L-NAME treatment renders cardiomyocyte hypertrophy, cardiac fibrosis, and microvascular rarefaction [62]. The model used C57BL/6N mice, however, the vast majority of genetic models uses the C57BL/6J background, impairing their genetic modification. Both mice strains present with different physiological features. For example, the C57BL/6J has a higher systolic blood pressure, lower heart rate, and larger heart weight to tibia length compared to the C57BL/6N [67]. Furthermore, significant differences exist in immune response between both models [67]. Mating genetic models onto the 6J background is not feasible, since this requires 11 generations of backcrossing which would take approximately 2,5 years to achieve.
Spontaneous senescence prone (SAMP) mouse
The SAMP mouse is a model of accelerated senescence with a 40% shorter lifespan and rapid progression of age-related pathological phenotypes after maturation, such as neurodegeneration and carcinogenesis [68]. The most commonly used models in cardiovascular disease and cardiac aging are the SAMP8 mice [69]. SAMP8 mice develop diastolic dysfunction with preserved EF, which occurs independently of hypertension [68]. Cardiac remodelling is evidenced by increased LV stiffness, cardiomyocyte hypertrophy, elevated fibrosis, and moderate indications for cardiac hypertrophy in SAMP8 mice, compared to the senescence-resistant (SAMPR1) control mice [68]. Although this suggests the SAMP8 animals are suited to model diastolic dysfunction, the progress towards a full-fledged HFpEF disease state has not yet been described.
17
3.3 Microvascular regression as the driving mechanism for rarefaction
Next to functional cardiac aberrations and tissue remodelling, Mohammed et al. described an overall decline (~27%) in cardiac microvascular density (capillaries and arterioles) is described in HFpEF patients compared to age-matched controls [70]. Interestingly, this reduce in cardiac microvascular density positively correlated with cardiac remodelling in HFpEF patients [70]. A reduced density of the microvascular network in the vascular bed is referred to as microvascular rarefaction and signifies the imbalance between angiogenesis, the formation of new vessel from pre-existing vessels, and vessel regression, the ablation of selected branches [71]. However, the mechanism underpinning the reduced vessel density in HFpEF remains undefined.
Microvascular rarefaction was first described in the conjunctiva of hypertensive patients [72] but was also later shown to be the result of non-perfused vessels [73-74]. Microvascular rarefaction also occurs in other HFpEF-associated comorbidities, such as T2DM and hypertension. Decreased microvascular density impedes insulin and/or glucose delivery to muscles and adipose tissue, therefore driving the body
towards systemic insulin resistance [75-76]. Therefore, the interest in capillary rarefaction in HFpEF patients is increasing. Moreover, according to preliminary data, a diabetic and hypertensive rat model for HFpEF exhibits coronary microvascular rarefaction at 21 weeks of age correlated with diastolic
dysfunction (unpublished results, Cuijpers, et al.). In summary, coronary microvascular rarefaction occurs in comorbidities that precede established HFpEF and is therefore hypothesised to contribute to disease progression. The correlation between coronary microvascular rarefaction with cardiac remodelling in HFpEF further supports this concept [70].
The currents hypothesis for HFpEF disease progression lacks an explanation for coronary capillary rarefaction as observed in patients and the ZSF1 model [43]. New vascular beds in general are formed by producing an excess of blood vessels under pro-angiogenic conditions, while at later stages vascular remodelling will prune the vascular beds by capillary regression [71]. However, at the moment it is unclear whether cardiac rarefaction in patients’ samples results from insufficient angiogenesis or
excessive microvascular pruning [70]. Interestingly, preliminary results from our research group show that male ZSF1 rats display elevated vessel regression at 14 weeks, before the onset of HFpEF, and cardiac
rarefaction at 21 weeks, with cardiac endothelial proliferation preserved at both time points of age
(unpublished results Cuijpers, et al.). This suggests an active mechanism of vessel regression preceding HFpEF development. Moreover, endothelial dysfunction is linked with microvascular regression [71], effects of comorbidities, such as glycocalyx damage [77], disruption of interaction between endothelial cells in capillaries and their stabilizers, called pericytes, (unpublished data, Cuijpers, et al.) [71], and reduced blood flow and shear stress [78]. Taken together, microvascular rarefaction could alter the balance between molecular regulators of vessel maintenance and regression at the onset of HFpEF. Regression can be assessed by the number of empty basement membrane sleeves per cardiac area normalised by the number of intact vessels. As the vascular endothelium matures, endothelial cells synthesize ECM proteins (e.g. collagen IV) to form a basement membrane supporting and enveloping endothelial cells and pericytes [79-80]. When the vessel regresses, endothelial cell apoptosis leaves an ‘empty collagen sleeve’ detectable for a short period, that serves as a historical record of pre-existing
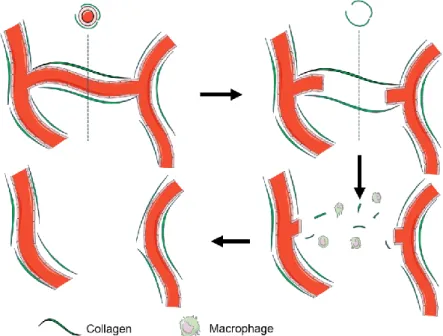
18 vessels [81]. Afterwards, macrophages will degrade the collagen sleeve, leaving the regressed vessel undetectable (Figure 5). By co-staining endothelial cells and collagen (Col) IV, intact vessels can be distinguished by double staining for endothelial markers and col IV, while regressed vessels are only positive for Coll IV.
Figure 5. Sequential events in microvascular regression. Capillaries are surrounded and supported by a collagen IV. When the vessel is regressed an ‘empty collagen sleeve’ remains visible for a short period. Afterwards, macrophages degrade the collagen sleeve leaving the regressed vessel undetectable (unpublished data, Simmonds et. al).
Diminished microvascular density is associated with age-dependent decline of several pro-angiogenic factors, such as (endothelial) growth factors and enzymes of endothelial cell metabolism. For example, reduced levels of plasma insulin-like growth factor 1 (IGF-1) in elderly may induce vascular rarefaction in the brain, particularly since IGF-1 influences many aspects of blood vessel formation and repair [82]. Similarly, blocking signalling of all Vascular Endothelial Growth Factor (VEGF) isoforms in mice subjected to pressure overload promotes the progression towards heart failure. However, a diminished blood flow has been shown to induce capillary regression even in the presence of high levels of VEGF [83]. Another pro-angiogenic factor, called neuregulin 1 (NRG-1) attenuates endothelial senescence in the aorta and cardiac dysfunction in several HF animal models [84]. Sirtuin 3 (SIRT3), an NAD+-dependent histone
deacetylase, is known for its critical role in the regulation of endothelial glycolytic metabolism. Moreover, its expression reduces with age, suggesting a role in HFpEF disease progression. Disruption of SIRT3-mediated endothelial cell metabolism and impairment of endothelial cell-pericyte-cardiomyocyte communications may lead to coronary microvascular rarefaction and promote cardiac hypoxia, fibrosis and titin-modified stiffness, leading to HFpEF development [85-86].
Loss of endothelial Pitx2 expression coincides microvascular regression in the ZSF1 rat
Paired-like homeodomain transcription factor 2 (Pitx2) is mainly known for its role in left-right symmetry breaking of the developing embryo, which determines the further development of several organs, including the heart, lung and gut [87-88] (Figure 6). The Pitx2 gene is discovered through its mutations
19 associated with the Axenfeld-Rieger syndrome [89-91], a syndromatic condition coursing with
cardiovascular outflow tract malformations, eye dysmorphogenesis, craniofacial, and pituitary
abnormalities [87]. Pitx2 loss-of-function mice display early embryonic lethality associated with severe cardiac malformations [92], demonstrating the importance of Pitx2 during cardiogenesis. During midgut rotation, Pitx2, expressed exclusively on the left side of the embryo, is required for asymmetrical vessel development [93]. Additionally, maintenance of proper left Pitx2 functioning requires the presence of hyaluronan, a major component of the ECM that is stabilised upon heavy chain modification by tumour necrosis factor α-stimulated gene 6 (TSG-6). Whereas hyaluronan is bilaterally synthesised in the dorsal mesentery, only the right side is stabilised by TSG-6. Both correct expression of Pitx2 and TSG-6 are indispensable for the asymmetric vascular development in the gut [93] (Figure 6).
Pitx2 is increasingly being linked to programmed vessel regression. Downregulation of Pitx2 induced programmed microvascular regression in the primordial gut [94] and the developing aortic arch [95-96]. In ZSF1 rats this Pitx2 expression was reduced at 21 weeks as assessed by an RNAseq analysis (unpublished results of Heymans et al.). Furthermore, obese ZSF1 rats showed reduced Pitx2 expression in the
endothelial cells at 14 weeks of age, which coincided with vessel regression in this model and preceded rarefaction (unpublished results, Cuijpers, et al.). This highlights the potential involvement of Pitx2 in vessel regression and suggests that rarefaction in HFpEF is being actively driven by an endothelial-specific loss of Pitx2 before disease onset.
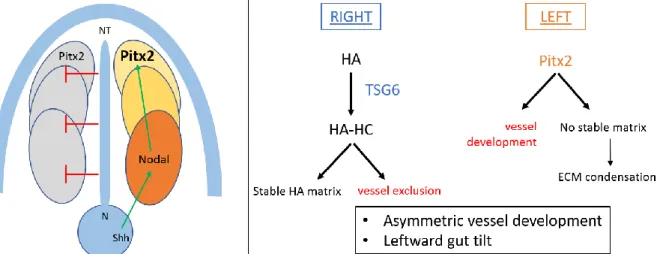
Figure 6. Left. The role of Pitx2 expression in left-right symmetry breaking during embryogenesis in mice. Left. From the node, Sonic hedgehog and Nodal induce Pitx2 expression uniquely at the left side of lateral plate mesoderm, while it is inhibited at the right side from the neural tube. Right. Pitx2 expression on the left side of the lateral plate mesoderm promotes vessel
development at that side, while inhibiting the condensation of the extracellular matrix. Hyaluronan is uniquely modified with heavy chains by the TSG-6 enzyme at the right side, where it stabilises the ECM and contributes to vessel exclusion. Together, Pitx2 and HA regulate asymmetric vessel development and leftward gut tilt during embryogenesis. HA = hyaluronan. N = node. Shh = Sonic hedgehog. NT = neural tube. ECM = extracellular matrix. HC = heavy chains. Adapted from Sivakumar, et al. 2013 [93] and Franco, et al. 2017 [87].
20
4 HYPOTHESIS, AIM & OBJECTIVES
We propose that the development of HFpEF involves coronary capillary rarefaction, which occurs by an active regression process, rather than a passive loss of microvascular density, and which is driven by endothelial specific loss of Pitx2 expression.
In order to answer this question, this project aims to develop pre-clinical mouse models of HFpEF, with the potential to genetically ablate endothelial Pitx2. The current widely accepted HFpEF model is the ZSF1 rat model, in which cells-specific genetic ablations are not feasible.
Therefore, the objectives of this thesis are:
1. To identify the most appropriate HFpEF mouse model by comparing one recently published model (HFD + L-NAME treated mice) and two novel models (aged and db/db salt treated mice) that have differing comorbidity profiles.
2. To demonstrate that the loss of endothelial Pitx2 expression causes coronary microvascular regression and rarefaction in vivo, using an endothelial-specific Pitx2ECKO mouse.
21
5 MATERIALS & METHODS
5.1 Animal models
Experiments were performed according to the Belgian law on the care and use of experimental animals (283/2014) and approved by the Animal Care and Use Committee of the University of Leuven (Project 217/2017). The animals were kept in ventilated cages housed in a breeding room under conventional conditions in 12-hour day and night cycle environment at 22°C. Chow diet (Ssnif® R/M-H, Ssniff
Spezialdiäten GmbH, Soest, Germany; 9 kJ% fat, 24 kJ% protein, 67kJ% carbohydrates; 3,225 kcal/kg) and fresh water were provided ad libitum.
Aged C57BL/6J model
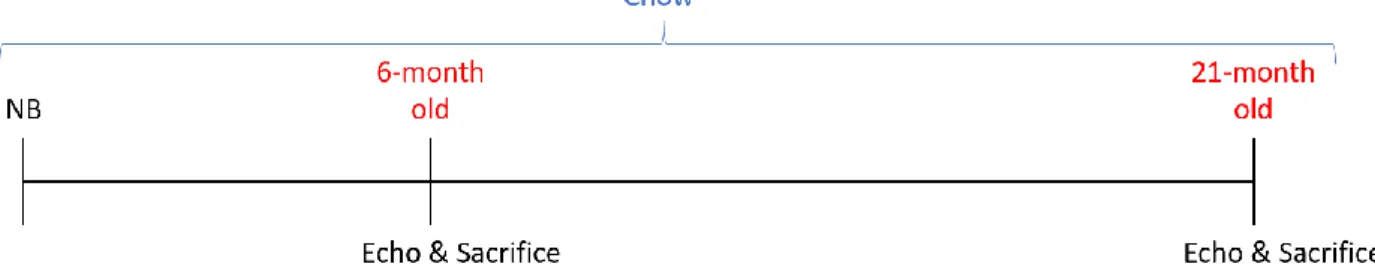
Aged male and female 6-month old control and 21-month old mice on a C57BL/6J background received a standard chow diet until echocardiography was performed, on the day of sacrifice (Figure 7).
Figure 7. Aged C57BL/6J model experimental design. Newborn (NB) mice were raised on a chow diet and underwent echocardiography (Echo) just before sacrifice either at 6 months of age or at 21 months of age.
Salt treated db/db model
Male 6-weeks-old db/+ or db/db animals for an OB-R leptin receptor mutation with a C57BLKS/J
background were obtained from Jax (#000642). Db/+ or db/db animals either received or did not receive an 8-week-long salt treatment in the water (10g/L), resulting in 4 experimental groups: (1) db/+ without salt treatment (db/+), (2) db/+ on NaCl treatment (db/+ + S), (3) db/db without salt treatment (db/db), (4)
db/db on salt treatment (db/db + S). Echocardiography (Echo) was performed at 14 weeks of age, 5 days
before sacrifice (Figure 8).
Figure 8. db/db salt treated model experimental design. Newborn (NB) heterozygous db/+ and homozygous db/dbmice were raised on a chow diet until 6 weeks of age, followed by either an 8-weeks-long salt treatment of 1% salt diluted in the drinking water (+ S) or control water without salt (- S), and echocardiography (Echo) at 14 weeks of age at 5 days before sacrifice.
22
High Fat Diet with L-NAME treated model
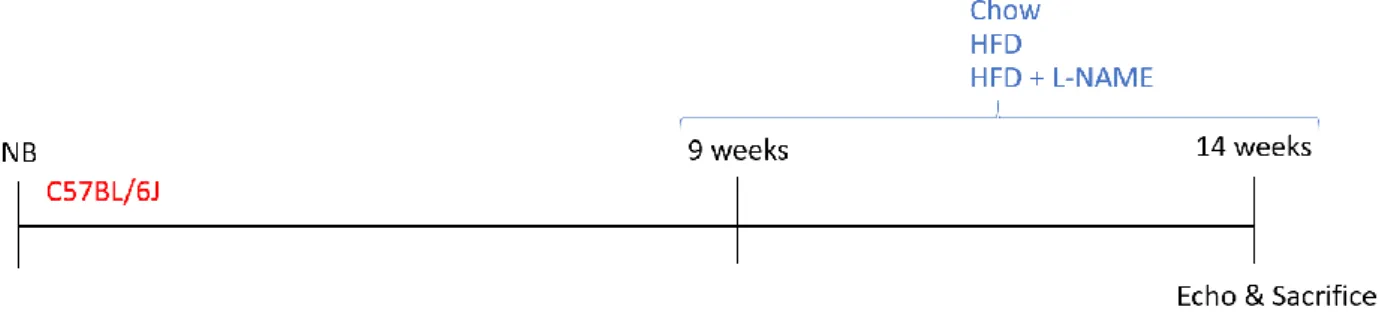
Male 9-weeks-old C57BL/6J wild-type animals received either (1) a chow diet, (2) a High Fat Diet (HFD; 60% fat, 20% proteins, 20% carbohydrates; D12492, Research Diet Inc., New Brunswich, NJ, USA) or (3) a two-hit combination of HFD with Nω-nitro-l-arginine methyl ester hydrochloride (L-NAME, 0.5 g/L; Cat. N. N5751, Sigma Aldrich, Overijse, Belgium) dissolved in the drinking water. Echocardiography was
performed at 14 weeks of age, 5 days before sacrifice (Figure 9).
Figure 9. High Fat Diet + L-NAME model experimental design. Newborn (NB) C57BL/6J mice were raised on chow diet until 9 weeks of age, followed by a 5-weeks-long diet treatment of either control chow, High Fat Diet (HFD) or a combination of HFD and L-NAME dissolved in the drinking water, and echocardiography (Echo) at 14 weeks of age at 5 days before sacrifice.
Endothelial specific conditional Pitx2 knockout model (Pitx2
ECKO)
To conditionally inactivate Pitx2 in the endothelial cells of C57BL/6J animals (Pitx2ECKO), males possessing
the tamoxifen-inducible Cre(ER)T2 recombinase gene controlled by an endothelial specific platelet derived growth factor (PDGF) promoter (PDGF.iCre(ER)T2Tg/WT) and possessing a Pitx2 gene where exon 4 is
flanked by LoxP sites (Pitx2fl/fl), were crossbred with females having only the Pitx2fl/fl. The control group
contained Pitx2fl/fl littermates that were negative for Cre(ER)T2 recombinase protein and the experimental
group were the littermates that were PDGF.iCre(ER)T2Tg/WT Pitx2fl/fl. Both control and experimental mice
were injected with tamoxifen (0.2mg/g body weight) for three non-consecutive days (Monday-Thursday-Monday) at one week of age. Echocardiography was performed at 12 weeks of age (Figure 10).
Figure 10. Pitx2fl/fl model experimental design. Newborn (NB) Cre recombinase negative Pitx2fl/fl control mice (Cre- Pitx2fl/fl) and Cre recombinase positive Pitx2fl/fl mice (Cre+ Pitx2fl/fl; Pitx2ECKO) were raised on chow diet and received 0.2mg/g body weight
tamoxifen (TAM) injections at one week of age. Control chow diet was continued until echocardiography at 12 weeks of age.
5.2 Sampling
Echocardiography
Echocardiography was performed to assess cardiac haemodynamics, left ventricular dimensions, and systolic and diastolic functional parameters, two days before the sacrifice. Animals were anesthetised
23 with 5% inhaled isoflurane (Cuphar, Oostkamp, Belgium) for induction and 1.5% inhaled isoflurane for maintenance. Transthoracic 2-D M-mode and tissue and PW Doppler echocardiography was performed using a MS 400 transducer (18-38 MHz) connected to a Vevo 2100 echocardiograph (Visual Sonics, Toronto, Canada). Animals were placed in a supine position on a heating pad to maintain a body temperature, measured by a rectal probe, of 37.5-37.7 °C. The relevant clinical parameters were
measured and calculated by a colleague skilled in echocardiography. Heart rate, LVIDd, and LVPWd were acquired on the parasternal short-axis transection using M-mode imaging and diastolic and end-systolic volumes were calculated according the Teichholz formula. Stroke volume and EF were calculated based on the M-mode images. LV blood filling was measured by PW Doppler trans-mitral flow tracings of E, A and DT, just above the tip of the mitral valve leaflets using an apical view. E’ and A’ were assessed with tissue Doppler imaging, at the lateral mitral annulus using an apical view. To evaluate diastolic function, E/E’, E/A, E’/A’ and A’/E’ were calculated. At least three stable cardiac cycles were averaged for all measurements.
Tissue collection
Animals were weighed and were euthanized by an intraperitoneal injection of 100 mg/kg ketamine 100mg/kg (Nimatek, Eurovet, Bladel, The Netherlands) and 10mg/kg xylazine (Xyl-M®, V.M.D. nv/sa, Arendonk, Belgium) dissolved in 0.9% NaCl. Except from the aged mice and their controls, blood was collected and after making an incision in the right atrium, the LV was perfused with phosphate-buffered saline (PBS) to remove red blood cells form the tissue. Organs (heart, lungs, kidney, spleen, liver and brain) were collected, and the tibia length was measured to normalise the weights. Hearts of aged mice where perfusion-fixed using 4% paraformaldehyde (PFA). For every organ of the other models, one sample was stored at -80°C for future immunohistochemistry (IHC) and molecular biology techniques, such as western blot or RNAseq. A second sample was fixed in PFA, washed in ethanol and treated by a tissue processor (Leica TP1020 automatic tissue processor) for paraffin embedding and histological analysis.
5.3 Histology and Immunostaining
CD45 staining
To assess general inflammation, cardiac leukocyte infiltration was measured using an IHC staining for CD45, a pan-leukocyte marker. Paraffinized sections were dewaxed by xylol and rehydrated by ethanol and water in a series of 5-minute-long washing steps (two times xylol, two times 99% ethanol, 75% ethanol, 50% ethanol, distilled water). Sections were pre-treated with boiling citrate buffer (0.1M Target Retrieval Solution; DAKO S1699, Agilent, Santa Clara, USA) for 20 minutes for antigen retrieval and washed two times for 5 minutes with tris-buffered saline (TBS; 0.1M Tris-HCl pH 7.5 + 1.5M NaCl + 0.4% [v/v] Tween 20 [Cat. N. BP337500, Thermo Fisher, Waltham, USA] in distilled water). This was followed by treatment with a dilute hydrogen peroxide solution in methanol (1/100 H2O2 30% in MeOH) for 1 hour at
room temperature (RT) to quench endogenous peroxidases and again followed by two 5-minute-long TBS washes. Slides were blocked in tris-NaCl-blocking buffer (TNB; 0.1M Tris-HCl pH 7.5 + 0.15M NaCl + 0.5% [w/v] TSA Blocking Reagent [Cat. N. FP1012; Perkin Elmer] in distilled water) for 45 minutes at RT, and washed two times for 5 minutes with TBS. Sections were then incubated overnight with rat anti-mouse
24 CD45 primary antibody (1/100 in TNB; Cat. N. 14-0451-82, Thermo Fisher, Waltham, USA) and three subsequent washes with tris-NaCl-tween buffer (TNT; 0.1M Tris-HCl pH 7.5 + 0.15M NaCl + 0,04% [v/v] Tween 20 in distilled water). Sections were stained for 1 hour long with goat anti-rat biotinylated secondary antibody (1/100 in TNB; Cat. N. 31830, Thermo Fisher, Waltham, USA) and 4',6-diamidino-2-fenylindool (DAPI; 1/1000 in TNB; Cat. N. D9542, Sigma Aldrich, Overijse, Belgium). After another series of three TNT washes, sections were incubated with a streptavidin-linked horseradish peroxidase (HRP) (1/100 in TNB; Cat. N. GERPN1231, Sigma Aldrich, Overijse, Belgium) for 30 minutes and followed by three 5-minute TNT washes. Freshly prepared tyramide working solution (Alexa Fluor 488 Tyramide
SuperBoostTM Kit, Cat. N. B40922, Invitrogen, Carlsbad, USA) was added for 10 minutes at RT. Slides were
washed three times for 5 minutes with TBS and mounted with ProLongTM Gold Antifade (Cat. N. P36930,
Thermo Fisher, Waltham, USA).
Pictures of the stained sections were taken at a 40x objective magnification on an Axiovert 200M light microscope (Zeiss, Oberkochen, Germany). For every slide, 15 non-overlapping images of the left ventricle are obtained with a scale of 6.1996 pixel/µm. Cells that co-stained for CD45 and DAPI (CD45+/DAPI+) were considered as infiltrated leukocytes and blindly counted per cardiac area (µm²) using ImageJ software.
Sirius Red staining
To assess total (both interstitial and perivascular) fibrosis in the myocardium, the amount of fibrotic collagen tissue was measured using a chemical staining for collagen type I and III by Sirius Red solution (filtered 4% [w/v] picric acid [Cat. N. 197378, Sigma Aldrich, Overijse, Belgium] in distilled water + 0.1% [w/v] old red [Cat. N. 365548, Sigma Aldrich, Overijse, Belgium]). Paraffinized sections were dewaxed by xylol and rehydrated by ethanol and water in a series of 5-minute-long washing steps (two times xylol, two times 99% ethanol, 75% ethanol, 50% ethanol, distilled water). Sections were pre-treated with phosphomolybdic acid (0.2% in distilled water) for 5 minutes at RT before the 90-minute incubation of the tissue in filtered Sirius Red. The slides are washed in HCl (0.01M), dehydrated with a graded series of ethanol and xylol (45 seconds 70% ethanol, two times 3 minutes ethanol 100%, two times 3 minutes xylol) and mounted with Distrene Plasticizer Xylene (DPX; Cat. N. 06522, Sigma Aldrich, Overijse, Belgium). Pictures of the stained sections were taken at a 40x objective magnification on an Axiovert 200M light microscope (Zeiss, Oberkochen, Germany). For every slide, 10 non-overlapping images of the LV were obtained. The percentage of collagen compared with the total amount of tissue within an image and excluding the lumen, as well as staining artefacts. Cardiac fibrosis was quantified, blinded for the origin of the samples, using ImageJ software.
Laminin staining and Collagen IV/DAPI co-staining
To determine cardiomyocyte hypertrophy, the cross-sectional area of cardiomyocytes was measured using an IHC staining for the laminin α chain as part of the basal membrane that outlines cardiomyocytes [97]. Pairs of paraffinized sections were dewaxed by as previously described. Sections were pre-treated with proteinase K epitope retrieval enzyme (1/500 in PBS; Cat. N. 21627, Sigma Aldrich, Overijse, Belgium) for 10 minutes, with a methanol (0.3% MeOH in H2O2) for 20 minutes and with 20% goat blocking serum
25 (Cat. N. ab7481, Abcam, Cambridge, UK) in TNB for 45 minutes at RT, each separated by 5-minute washes of PBS and TBS. Overnight incubation of the sections with rabbit anti-laminin αchainprimary antibody (1/400 in TNB; Cat. N. L9393, Sigma-Aldrich, Overijse, Belgium) was performed. Three TNT washes were followed by a 45-minute-long incubation with goat anti-rabbit HRP-labelled secondary antibody (1/100 in TNB; Cat. N. P044801-2, Agilent, Santa Clara, USA). Sections were washed with TNT and twice with Tris-HCl. The sections were stained by applying a 3,3'-diaminobenzidine (DAB) containing solution (12,5% [w/v] DAB [SC-209686A, SC-biotechnology, Dallas, USA] + 0.325% H2O2 in Tris) for 2 minutes, washed
three times for 3 minutes with distilled water, and counterstained with Harris Haematoxylin for 4 seconds.
In the Pitx2ECKO model, cross-sectional cardiomyocyte area was assessed using a collagen (Col) IV/DAPI
co-staining to visualise respectively the basal membrane and nucleus of the cardiomyocytes (see co-staining protocol below). Paraffinized sections were dewaxed and antigen retrieval was performed as previously described. Sections were blocked and incubated overnight with goat anti-mouse Col IV primary antibody (1/400 in TNB; Cat. N. 2150-1470, Bio-rad, Temse, Belgium) followed by 5 subsequent 10-minute-washes of TNT. A solution of donkey anti-goat AlexaFluor488-labelled secondary antibody (1/400 in TNB; Cat. N. A11055, Thermo Fisher, Waltham, USA) and DAPI (1/0000 in TNB) was applied for 1 hour.
Both laminin-stained and Col IV/DAPI-stained slides were washed under flowing tap water for 10 minutes, dehydrated with a graded series of ethanol and mounted with DPX.
Pictures of the stained sections are obtained at a 40x objective magnification on an Axiovert 200M light microscope (Zeiss, Oberkochen, Germany). For every slide 15 non-overlapping images of the left ventricle were collected. The cross-sectional area (µm²) of rounded non-elongated cardiomyocytes with a visible nucleus in the middle was quantified, blinded for the origin of the samples, using ImageJ software.
Collagen IV & Isolectin B
4co-staining
To quantify the microvascular density and degree of vessel regression in the myocardium, an IHC co-staining was performed for Isolectin B4 (IB4) to visualise endothelial cells, together with Col IV to detect
remnant empty collagen sleeves (Col IV+ IB
4-). Paraffinized sections were dewaxed and antigen retrieval
was performed with citrate buffer as previously described. Sections were blocked for 30 minutes in phosphate-buffered saline with Triton (PBT; 0.1% Triton [Cat. N. T8787 Sigma Aldrich, Overijse, Belgium] in PBS), 30 minutes in TNB and three times 20 minutes in PBLec Buffer (1M CaCl2 + 1M MgCl2 + 0.1M
MnCl2 + 50% H2O2 + 1% Triton in PBS). Slides were incubated overnight with AlexaFluor488-labelled IB4
(1/50 IB4 [Cat. N. I21411 Thermo Fisher, Waltham, USA]) diluted in incubation buffer (0.5% Bovine Serum
Albumin [w/v] [Cat. N. P6154, VWR, Oud-Heverlee, Belgium] + 0.25% Triton in PBS) and rabbit anti-mouse Col IV antibody (1/400 in TNB; Cat. N. 2150-1470, Bio-rad, Temse, Belgium), washed four times for 15 minutes with PBT, and incubated with donkey AlexaFluor568-labelled anti-rabbit antibody (1/400 in TNB; Cat. N. A10042, Life Technologies, Carlsbad, USA) for 1 hour. The sections were washed three times for five minutes in TNT and mounted with ProLongTM Gold Antifade.
Pictures of the stained sections were obtained at a 40x objective magnification on a confocal microscope. For every slide 10 non-overlapping images of the left ventricle, where the microvessels are cut
cross-26 sectionally, were collected. The number of intact vessels (Col IV+/IB
4+) and the regressed vessels (Col
IV+/IB
4-) were counted, blinded for the origin of the samples, using Image J software, and used to calculate
microvascular density and regression by the formulas below.
Microvascular density = #IB4+ / cardiac area
Microvascular regression = #Col IV+ IB
4- / #IB4+
5.4 Statistical analysis
Data are shown as mean + SEM (standard error of the mean). Statistical analysis was performed using GraphPad software 7 (GraphPad Software Inc., La Jolia, California). Variance was tested with F-test
(p<0.05) and normality was tested with Shapiro-Wilk test (p<0.5). Biological outliers were picked up based on Grubb’s test (p<0.05). Normal data were analysed by an unpaired two-tailed t-test using GraphPad Prism. Non-normal data were analysed by a Mann-Whitney U t-test using GraphPad Prism 7. The data were considered as significant at P<0.05 (* P<0.05, ** P<0.01, ***P<0.001).
27
6 RESULTS
6.1 CHAPTER I: characterisation of HFpEF in 3 murine comorbidity models
HFpEF patients suffer from one or more comorbidities such as obesity, T2DM, hypertension, and aging, which are commonly considered as the drivers of HFpEF. The human variant of HFpEF involves an increased heart weight, pulmonary congestion, diastolic dysfunction and cardiac remodelling [62]. Therefore, an animal model for HFpEF must simulate (a combination of) these comorbidities and recapitulate the human phenotype. Moreover, to investigate the mechanics underpinning HFpEF pathophysiology, the animal model should be genetically modifiable. In this project, three different comorbidity mouse models were investigated: aged C57BL/6J animals, db/db mice given a 1% salt treatment for 8 weeks, and C57BL/6J mice given HFD + L-NAME for 5 weeks. The presence of HFpEF was examined in these models by looking at morphometric parameters, and cardiac function and remodelling.
Of all models tested, only 1% salt treatment in db/db mice induces obesity
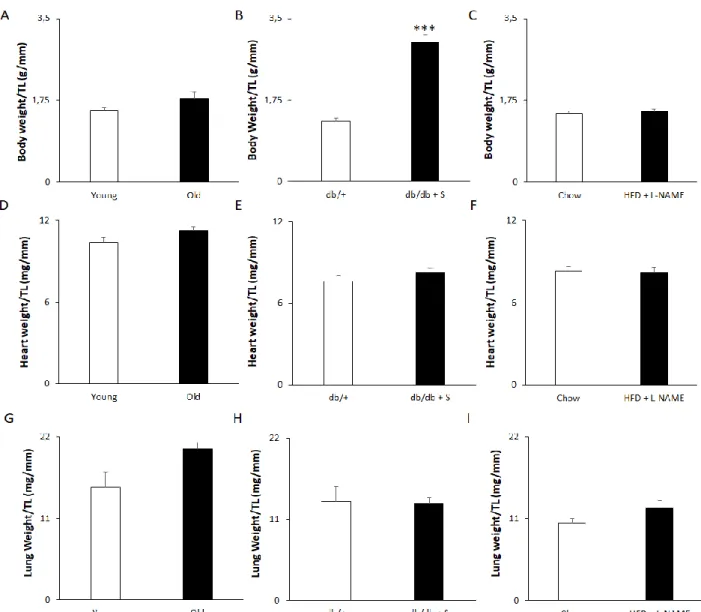
To assess the obesity phenotype, and detect changes in heart weight and pulmonary congestion, all animals were morphometrically examined for total body and organ weight, which was normalised to tibia length.
Our 21-month old mice did not exhibit an obese phenotype, changed heart weight or pulmonary
congestion. This was reflected by unaltered total body weight (Figure 11A), heart weight (Figure 11D), and lung weight (Figure 11G) normalised to tibia length compared to 6-month old controls. However,
homozygous db/db leptin deficient mice given 1% salt treatment showed an increase in total body weight normalised to tibia length, indicating an obese phenotype compared to untreated db/+ controls (Figure 11B). Despite this, the relative heart weight (Figure 11E) and lung weight (Figure 11H) remained unchanged. Surprisingly, the combinational treatment of a HFD and dissolved L-NAME did not elicit an obese
phenotype compared to mice raised on a control chow diet (Figure 11C). Also, the heart (Figure 11F) and
28
Figure 11. 1% salt treatment in db/db mice causes obesity. Aging and High Fat Diet with L-NAME treatment do not induce obesity. (A-C) Total body weight relative to tibia length in (A) Young and Old mice, (B) db/+ control mice and salt treated db/db + S and, (C) chow fed mice and HFD + L-NAME treated mice. (D-F) Heart weight relative to tibia length in (D) Young and Old mice, (E) db/+ control mice and db/db + S mice and, (F) chow fed versus HFD + L-NAME treated mice. (G-I) Lung weight relative to tibia length in (G) Young and Old mice, (H) db/+ control mice and db/db + S mice and, (I) chow fed versus HFD + L-NAME treated mice. n = 8 for Young and Old, 9 for db/+, 8 for db/db + S, 5 for Chow and HFD + L-NAME. Data represented as mean + SEM. Statistical significance tested by an unpaired two-tailed t-test (panels B-F, I) or a Mann-Whitney test (A, G, H) depending on normality. *** p<0.001. TL = Tibia Length. Young = 6-month old mice. Old = 21-month old mice. db/+ = db/+ control mice. db/db + S = 1% salt treated db/db mice.
All three models induced different stages of diastolic dysfunction
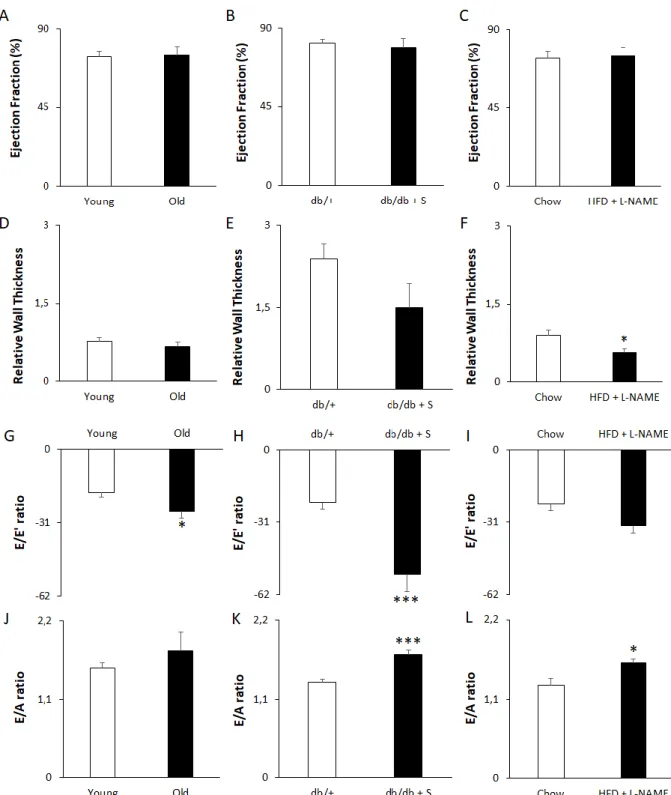
HFpEF patients exhibit diastolic function coupled to LV hypertrophy, while their systolic function is preserved. To assess the development of diastolic dysfunction in combination with a preserved systolic function in the three mouse models, M-Mode imaging and PW and tissue Doppler echocardiography were performed to assess parameters of systolic and diastolic function, as well as LV wall thickness.
29 The systolic function was unaffected in each model, as indicated by a preserved EF (Figure 12A, B, C) and stroke volume (Table 1). Aged mice showed no change in LV dimensions at diastole, including internal diameter (Table 1), posterior wall thickness (Table 1), and relative wall thickness (Figure 12D), visualised by M-mode imaging. Salt treated db/db mice however, showed an increased internal diameter (Table 1) compared to untreated db/+ controls. However, an unchanged posterior wall thickness (Table 1) and relative wall thickness (Figure 12E) do not support this observation. The internal diameter of HFD + L-NAME fed mice (Table 1) remained unaffected compared to the control mice, while the posterior (Table 1) and relative wall thickness (Figure 12F) were unexpectedly reduced.
PW Doppler echocardiography demonstrated that blood flow at the mitral valve remained unchanged between young and old animals, as shown by unaltered LV E and A peak velocity (Table 1), and DT (Table 1). Tissue Doppler imaging, revealed a reduced muscle relaxation capacity of the LV and thus stiffer cardiac tissue in old mice, as reflected by a decreased (less negative) E’ (Table 1) although the A’ peak of LV wall movement (Table 1), remained constant. This observation was supported by increased E/E’ (Figure 12G) and E’/A’ (Table 1) ratios, with no change in the E/A ratio (Figure 12J), indicating that aged mice represent with the pseudonormal stage of diastolic dysfunction.
PW Doppler in db/db + S mice indicated a more severe, restrictive stage of diastolic dysfunction. While A peak velocity (Table 1) and DT (Table 1) remained constant compared to db/+ controls, tissue Doppler imaging revealed a reduction in muscle relaxation capacity of the LV and stiffer cardiac tissue in db/db + S mice, as reflected by a lowered E’ (Table 1). However, the A’ peak of LV wall movement (Table 1), remained constant. This observation was supported by diastolic dysfunction criteria such as E/E’ (Figure 12H) and E/A (Figure 12K), that were increased and decreased E’/A’ ratio (Table 1) in salt treated db/db mice compared to control animals.
In HFD + L-NAME treated animals, the E peak of blood flow at early diastole (Table 1), the A peak velocity (Table 1) and the DT (Table 1) remained constant compared to controls. Tissue Doppler imaging
demonstrated that E’ and A’ (Table 1) was unaltered. However, a reduction in muscle relaxation capacity of the LV was revealed by a decreased E’/A’ ratio in HFD + L-NAME mice, compared to controls (Table 1). Although the E/E’ ratio did not increase (Figure 12I, p = 0.05563), the elevated E/A ratio (Figure 12L) suggests a stage in between pseudonormal and restrictive diastolic dysfunction in HFD + L-NAME treated mice, compared to control animals.
30
Figure 12. All three mouse models exhibit diastolic dysfunction with preserved EF. (A-C) Ejection Fraction measured in (A) in Young and Old mice, (B) db/+ mice and db/db + S and, (C) chow fed and HFD + L-NAME treated mice. (D-F) Relative Wall Thickness in (D) in Young and Old mice, (E) db/+ mice and db/db + S and, (F) chow fed and HFD + L-NAME treated mice. (G-I) E/E’ ratio in (G) in Young and Old mice, (H) db/+ mice and db/db + S and, (I) chow fed and HFD + L-NAME treated mice. (J-L) E/A ratio measured (J) in Young and Old mice, (K) db/+ mice and db/db + S and, (L) chow fed and HFD + L-NAME treated mice. A-F assessed using M-Mode imaging. G-I assessed using PW and tissue Doppler imaging. J-L assessed using PW Doppler imaging. n = 8 for Young and Old, 9 for db/+, 7 for db/db + S, 5 for Chow and HFD + L-NAME. Data represented as mean + SEM. Statistical
significance tested by an unpaired two-tailed t-test. * p<0.05, *** p<0.001. Young = 6-month old mice. Old = 21-month old mice. db/+ = db/+ control mice. db/db + S = salt treated db/db mice.