CUSTOMER WELLBEING IN SERVICE
DELIVERY NETWORKS
Aantal woorden: 12.670
Beau Le Compte
Stamnummer: 01604852Promotor: Prof. Dr. Katrien Verleye
Copromotor: Drs. Kaat De Pourcq
Masterproef voorgedragen tot het bekomen van de graad van:
Master in de bestuurskunde en het publiek management
Confidentiality agreement
I declare that the content of this Master’s Dissertation may be consulted and/or reproduced, provided that the source is referenced.
Abstract [ENG]
Purpose: As contemporary service delivery mostly occurs in network settings and surprisingly limited
attention has been paid to the impact of the service quality on customer wellbeing in such settings, it seemed interesting to investigate that influence. In addition, the possible moderation of some coordination-related network properties on that relationship was examined as well.
Design/Methodology/approach: Firstly, a systematic review was conducted to build the theoretical
framework in a scientific way. Secondly, both descriptive and statistical results were generated of the collected survey data (N=505) by using the statistical analysis programme SPSS. Various calculations were made: e.g. descriptives, frequencies, and hierarchical multiple regression analyses.
Findings: Surprisingly, the ServQual dimensions separately did not turn out to be good predictor and none
of the possible moderating variables were found to be a moderator. However, there were some other interesting findings. Firstly, the ServQual scale proved its value, since it was a strongly significant predictor as a whole. Secondly, the research population and the subjective severity of the disease proved to be strongly predicting variables too. The most remarkable finding, however, was that the patient’s own role satisfaction in the care process was found to be the strongest single predictor overall, by far.
Practical implications: Firstly, great attention should be paid to the psychological state of mind of the
patient. Clear and honest interpersonal communication during the treatment should consequently be seen as crucial. Secondly, the patient’s age also plays a role in evaluating their subjective wellbeing. The older patients are, the higher their customer wellbeing will be too. As a consequence, the younger patients might need more guidance and attention, in order to attain the same level of wellbeing. Lastly, patients should accept and feel comfortably in the role they fulfil during their treatment. Consequently, the identification of the role the patient wants to fulfil in the care process should get enough attention.
Research limitations/implications: A closer look should especially be taken to the coordination quality
and the patient’s own role satisfaction during the treatment, since these turned out as major findings in this study. On the other hand, it would be interesting as well to test the moderating effect of the structural network properties (Black & Gallan, 2015) on the relation service quality – customer wellbeing.
Originality/Value: This research responded to the research priority of ‘optimizing interorganizational
service network collaboration around customer experiences’ for the science of service (Ostrom et al., 2010). It also identified some surprising strong predictors of customer wellbeing, of which further research should point out whether or not these first indications are representative for e.g. the whole healthcare sector.
ABSTRACT [NL]
Doel: Aangezien hedendaagse dienstverlening meestal gebeurt in netwerken en er verrassend genoeg nog
maar weinig aandacht geschonken is aan de impact van servicekwaliteit op klantenwelzijn in zo’n setting, leek het ons interessant om die invloed te onderzoeken. Daarenboven werd de mogelijke moderatie van enkele coördinatie-gerelateerde netwerkeigenschappen op die relatie ook nagegaan.
Methodologie: Eerst werd er een systematisch literatuuronderzoek gevoerd om de wetenschappelijke
kwaliteit van deze studie te benadrukken. Ten tweede, werden er zowel beschrijvende als statistische analyses gevoerd van de verzamelde data uit de vragenlijsten (N=505) in het statistische analyse programma SPSS. Verscheidene berekeningen werden hiervoor uitgevoerd.
Resultaten: Verrassend genoeg bleken de ServQual dimensies afzonderlijk niet zulke goede voorspeller te
zijn van klantenwelzijn en ten tweede werd het duidelijk dat geen enkele coördinatie-gerelateerde structurele netwerkeigenschap een moderator was op die relatie. Toch waren er andere interessante resultaten, zoals het feit dat de ServQual schaal als geheel wel een sterke voorspeller bleek, net als de onderzoekspopulatie en subjectieve evaluatie van de ernst van de aandoening. Daarenboven bleek de patiënts tevredenheid met de eigen rol in het zorgverleningsproces veruit als de sterkste individuele voorspeller in totaliteit, wat dan ook als de belangrijkste bevinding van dit onderzoek kan gezien worden.
Relevantie voor de praktijk: Ten eerste dient er veel aandacht te zijn voor de psychologische toestand
van de patiënt; duidelijke en eerlijke interpersoonlijke communicatie is hierbij heel belangrijk. Ten tweede speelt de leeftijd van de patiënt ook een rol, aangezien bleek dat hoe ouder de cliënt is, hoe hoger zijn/haar klantenwelzijn ook is. Bijgevolg lijkt het aangewezen om jongere patiënten van naderbij en meer te begeleiden. Tot slot hoort de cliënt ook tevreden te zijn met de eigen rol in het zorgproces. Desgevallend is het aangewezen om de gewenste rol van de patiënt met aandacht te identificeren door onderling overleg.
Onderzoeksbeperkingen en -implicaties: Aan de ene kant dient de coördinatiekwaliteit en de patiënts
tevredenheid met de eigen rol van naderbij bekeken te worden, aangezien deze de meest opmerkelijke resultaten van deze master thesis waren. Aan de andere kant zou het ook interessant zijn om het modererend effect van de structurele netwerkeigenschappen (Black & Gallan, 2015) na te gaan.
Waarde van het onderzoek: Deze masterproef beantwoordde de onderzoeksprioriteit die Ostrom et al.
(2010) formuleerden: ‘optimaliseren van de inter-organisationele samenwerking in een dienstnetwerk rond de klantenervaringen.’ Daarnaast identificeerde het ook enkele verrassende voorspellers van klantenwelzijn, waarvoor verder onderzoek dient uit te wijzen hoe representatief die bevindingen zijn.
Foreword
My journey of four years as a student at the University of Ghent has almost come to an end, since the writing of this master’s dissertation can be seen as the nice ending of my school time. It was not an easy task, however, with lots of struggles. Consequently, I am so grateful for the help of various people, I all want to thank over here.
Firstly, I would like to thank Prof. Dr. Katrien Verleye for giving me the opportunity of doing my master’s thesis under her tutelage. In addition, Drs. Kaat De Pourcq might even deserve the greatest gratitude. As my personal supervisor, she both provided me with much constructive and thorough feedback, and was always highly responsive and willing to listen if I experienced problems or did not understand something clearly.
Secondly, also some words of thanks to the previous researchers, of which I could reuse and combine their survey databases in order to dispose of a large dataset. Drs. Selien Vancaillie even helped getting me started with the used dataset, she combined as well for me. As a consequence, thank you very much.
Thirdly, I would like to thank some family as well, although apologising for my prior behaviour during those stressing times might be more appropriate. Anyway, both my dad and girlfriend were my towers of strength. In addition, my stepmom and grandparents showed great interest in this work as well, which felt empowering.
Fourthly, an expression of gratitude towards some other professors and assistants helping me along this challenging journey. Thank you, prof. dr. Joris Voets, drs. Bram Van Haelter, Raf Pauly, and prof. dr. Dries Verlet. In addition, thanks Ines and Gauthier for your feedback too.
Preamble impact Corona
This master’s dissertation was written during a health crisis. COVID-19 was terrorising our personal and social lives, possibly impacting the research direction of your master’s thesis. This was not the case for mine, however, since I disposed of a previous large dataset and the statistical analyses by then could have been carried out behind my laptop at home. Nonetheless, this preamble was drawn up in consultation between the student and the supervisor and is approved by both.
Table of contents
CONFIDENTIALITY AGREEMENT ... II
ABSTRACT [ENG] ...III
ABSTRACT [NL] ... IV
FOREWORD ... V
PREAMBLE IMPACT CORONA ... V
TABLE OF CONTENTS ... VI
LIST OF USED ABBREVIATIONS ... IX
LIST OF TABLES ... IX LIST OF FIGURES ... IX 1 INTRODUCTION ... 1 2 THEORETICAL FRAMEWORK ... 2 2.1METHODOLOGY ... 2 2.1.1 DATA SOURCES ... 2 2.1.2 DATA EXTRACTION... 2 2.1.3 QUALITY APPRAISAL ... 3 2.1.4 EXTRA ARTICLES ... 3 2.2DESCRIPTION OF LITERATURE ... 5 2.2.1 CUSTOMER WELLBEING ... 5 2.2.2 SERVICE QUALITY... 6 2.2.3 STRUCTURAL PROPERTIES ... 7
2.2.3.1 Structural network properties (Black & Gallan, 2015) ... 8
2.2.3.2 Coordination-related network properties ... 9
3 METHOD... 12 3.1SURVEY ... 12 3.1.1 DESIGN ... 12 3.1.2 SAMPLE ... 12 3.1.3 ANALYSIS ... 13 3.2MEASUREMENT ... 14
3.2.1 CUSTOMER WELLBEING (FLOURISHING SCALE) ... 14
3.2.2 SERVICE QUALITY (SERVQUAL-SCALE) ... 15
3.2.3 NETWORK PROPERTIES (COORDINATION) ... 15
4 RESULTS ... 16 4.1DESCRIPTIVE RESULTS ... 16 4.1.1 CHARACTERISTICS RESPONDENTS ... 16 4.1.2 CHARACTERISTICS SDN ... 17 4.1.2.1 Composition SDN ... 17 4.1.2.2 Quality SDN ... 18 4.1.3 SERVICE QUALITY... 18
4.1.3.1 Degree to which groups of actors are associated with various ServQual dimensions ... 19
4.1.3.2 Degree to which various groups of actors are associated with good service quality ... 19
4.2STATISTICAL RESULTS ... 20
4.2.1 HOW DOES SERVICE QUALITY IMPACT THE CUSTOMER WELLBEING? ... 20
4.2.2 HOW DO COORDINATION-RELATED NETWORK PROPERTIES MODERATE THIS RELATION? ... 22
4.2.2.1 Moderating effect of the coordinator ... 22
4.2.2.2 Moderating effect of the coordination quality ... 24
4.2.2.3 Moderating effect of the satisfaction with the own role ... 26
5 DISCUSSION ... 29
5.1HOW DOES SERVICE QUALITY IMPACT THE CUSTOMER WELLBEING? ... 29
5.2.HOW DO COORDINATION-RELATED NETWORK PROPERTIES MODERATE THIS RELATION? ... 30
6 CONCLUSION ... 31
6.1.MOST IMPORTANT FINDINGS... 31
6.2PRACTICAL IMPLICATIONS ... 31
6.3FUTURE RESEARCH ... 32
7 REFERENCE LIST ... X
8 ATTACHMENTS ... XVI
8.1ATTACHMENT 1:SCORING FOR METHODOLOGICAL RIGOR ... XVI 8.2ATTACHMENT 2:QUESTIONNAIRE ... XVII 8.3ATTACHMENT 3:SERVICE QUALITY, IN DETAIL ... XXVIII 8.4ATTACHMENT 4:SPSS OUTPUT SECTION 4.2.1 ... XXIX 8.5ATTACHMENT 5:SPSS OUTPUT SECTION 4.2.2.1 ... XXXIII 8.6ATTACHMENT 6:SPSS OUTPUT SECTION 4.2.2.2 ... XXXIX 8.7ATTACHMENT 7:SPSS OUTPUT SECTION 4.2.2.3 ... XLV
List of used abbreviations
SDN = Service Delivery Network
List of tables
TABLE 1:RESEARCH QUESTIONS AND HYPOTHESES. ... 11
TABLE 2:MEASUREMENT OF CUSTOMER WELL-BEING (FLOURISHING SCALE). ... 14
TABLE 3:MEASUREMENT OF SERVICE QUALITY (SERVQUAL-SCALE). ... 15
TABLE 4:MEASUREMENT OF NETWORK PROPERTIES (FOCUS ON COORDINATION). ... 16
TABLE 5:OVERVIEW OF THE RESPONDENTS' CHARACTERISTICS (N=505). ... 17
TABLE 6:COMPOSITION SDN(N=505). ... 17
TABLE 7:QUALITY SDN(N=505). ... 18
TABLE 8:SERVICE QUALITY – DIMENSION LEVEL (N=505). ... 19
TABLE 9:SERVICE QUALITY – GROUP OF ACTORS (N=505). ... 19
TABLE 10:HIERARCHICAL MULTIPLE REGRESSION 4.2.1–MODEL EXPLANATORY VALUES (N=484). ... 21
TABLE 11:HIERARCHICAL MULTIPLE REGRESSION 4.2.1–MODEL SUMMARY (N=484). ... 21
TABLE 12:HIERARCHICAL MULTIPLE REGRESSION 4.2.2.1–MODEL EXPLANATORY VALUES (N=488). ... 23
TABLE 13:HIERARCHICAL MULTIPLE REGRESSION 4.2.2.1–MODEL SUMMARY (N=488). ... 24
TABLE 14:HIERARCHICAL MULTIPLE REGRESSION 4.2.2.2–MODEL EXPLANATORY VALUES (N=489). ... 25
TABLE 15:HIERARCHICAL MULTIPLE REGRESSION 4.2.2.2–MODEL SUMMARY (N=489). ... 26
TABLE 16:HIERARCHICAL MULTIPLE REGRESSION 4.2.2.3–OUTLIERS (N=486). ... 27
TABLE 17:HIERARCHICAL MULTIPLE REGRESSION 4.2.2.3–MODEL EXPLANATORY VALUES (N=486). ... 28
TABLE 18:HIERARCHICAL MULTIPLE REGRESSION 4.2.2.3–MODEL SUMMARY (N=486). ... 29
List of figures
FIGURE 1:SEARCH STRATEGY FLOWCHART. ... 41 Introduction
It is common knowledge that most of the contemporary service delivery starts to happen in network settings. Think about getting a hip replacement in Flanders, for instance. Firstly, you have to see the general practitioner, so that you can be redirected to a specialist, who will most likely work in a hospital. Secondly, you have to inform both your hospitalisation assurance (in terms of refunds) and family/friends (in terms of clothes, visits, etc.) that you are hospitalised. Afterwards, you have to inform your health insurance fund too. For this one unit of service delivery (getting a hip replacement in Flanders), there are thus several partners involved, clearly indicating the network aspect of service delivery these days.
Tax, McCutcheon, and Wilkinson (2013) defined such a service delivery network (SDN) as a set of organisations, which are responsible for the service delivery from the customer’s point of view. An important aspect in services, and therefore in SDNs, is the quality of the service. Surprisingly, limited attention has been paid to the impact of the service quality in SDN on customer wellbeing, while scholars call for more transformative research (e.g. Ostrom et al., 2010). It is no secret, however, that customer wellbeing is of major importance in service delivery. Additionally, customer wellbeing in a SDN is not only impacted by the service delivery itself, but by way more actors and events (Frow et al., 2014; Mars, Bronstein, & Lusch, 2013). Therefore, it is certainly worth examining it.
Consequently, this study investigates the influence of service quality on customer wellbeing in a SDN. Next to the service quality, we assume that the structure of a network also has an effect on this relationship. That is why the second aspect of this master’s thesis is to examine whether or not some coordination-related network properties will moderate that relationship.
To our knowledge, we are one of the first that combine all those aspects into one study. A notable exception is the research of of McColl-Kennedy, Vargo, Dagger, Sweeney, and Van Kasteren (2012), who designated a Customer Value Cocreation Practice Styles typology, identifying in total five types of value cocreation practice styles in a network setting. As cocreation is in a way closely related to customer wellbeing, this could be seen as an example of a study about two of our main research concepts. However, we will expand that focus by including some coordination-related network properties as well. By doing this, we want to respond to the research priority of ‘optimizing interorganizational service network collaboration around customer experiences’ for the science of service (Ostrom et al., 2010).
This master’s thesis proceeds as follows. The first section consists of a systematic review of the extant literature. Subsequently, this paper continues with analysing the results of a distributed survey in three different kinds of healthcare domains (N=505) in Flanders, Belgium. Finally, we conclude with the discussion, providing some practical recommendations and defining the research limitations.
2 Theoretical framework
The objective of this paper is thus to identify the influence of service quality on customer’s wellbeing in a SDN, with some structural coordination-related properties as possible moderators of this relationship. Consequently, those broad concepts will be profoundly discussed in this theoretical framework. In addition, hypotheses that belong to a specific topic depicted over here will be immediately formulated below the corresponding paragraph. But first, the exact used methodology for this research part will be discussed.
2.1 Methodology
This study draws upon an analysis of the literature from a systematic review perspective. By doing this, we would be able to formulate relevant hypotheses and we also followed the trend of evidence-based practice in healthcare decision-making (Hawker, Payne, Kerr, Hardey, & Powell, 2002). The search strategy flowchart can be seen in Figure 1 at the end of this subsection.
2.1.1 Data sources
So first, a search string had to be developed in order to start with the actual systematic review. Besides, the decision was made to only search in the online database of Web of Science, seen the extent of the following qualitative phase in this master’s thesis. As the very first step of this research was reading three specific articles (Kranzbühler et al., 2019; McColl-Kennedy et al., 2012; Tax et al., 2013), the final Boolean search string included on the one hand related notions to a (service delivery) network and on the other hand terms linked to customer wellbeing. At that point the choice was not yet made if customer satisfaction or customer wellbeing would be the dependent variable of this master’s thesis. That is why the search string included both concepts. Besides, no time frame was predetermined as an inclusion criterium. Finally, the searches were conducted in September 2019 (Week 37) and led to 986 results. In addition, that final search string can be seen beneath this paragraph.
Article OR Proceedings Paper OR Review (Management OR Business OR Public Administration)
TS=("service delivery network") OR TS=(network) OR TS=(partnership) OR TS=(collaboration) OR TS=(alliance) OR TS=(cooperation) OR TS=(cooperative) AND TS=("customer experience") OR TS=("customer satisfaction") OR TS=("quality of life") OR TS=("subjective well-being") OR TS=(well-being) OR TS=(happiness) OR TS=("client experience") OR TS=("client satisfaction")
2.1.2 Data extraction
Consequently, in the first phase of the literature review, every single result of the search string was analysed by reading the title and abstract. In total, we extracted 88 papers of the initial 986 ones, based on the presence of three variables in it: customer experience, service delivery network and spill-over. The goal of this phase was thus to determine whether or not a result could be relevant for this master’s dissertation.
After that, each work summarized, using the assessment form of Hawker et al. (2002). Hereafter, the 88 papers were coded to create an overview (relating to the content) of the literature in that database. The outcome of this process resulted in an extraction of 45 papers from those former 88 studies, as studies on supply chain management and business-to-business relationships were excluded, seen our research setting.
2.1.3 Quality appraisal
From those 45 papers, only 9 ones laid on the basis of the theoretical framework, which were all scored
for methodological rigor in the end as well. The other ones seemed not that relevant for this master
dissertation, after the quality appraisal as it seemed in advance. Those nine final included papers were graded according to the reliability of the results (Oxman, 1994). The outcome of this last stage can be found in Attachment 1, since this process can prove and support the quality of the used literature in this research.
2.1.4 Extra articles
Lastly, there were some extra relevant articles included. These were either found in the references of the included articles from the systematic review process itself, or advised to include by the supervisors of this master’s dissertation. To make sure the qualitative research part of this paper remained a systematic review, those articles were scored for methodological rigor as well, in a distinct section of Attachment 1.
2.2 Description of literature
Before describing the dependent (customer wellbeing), independent (service quality) and possibly moderating (structural properties) research variables, it is important to define this master’s thesis’ setting. Service delivery namely implies a mainly social process, in which the client receives the most appropriate service according to himself, the involved professionals, family, friends and other involved actors (Patrício, Fisk, Falcão e Cunha, & Constantine, 2011). The service delivery has thus to be approached from a network setting perspective, where a set of mutually linked actors are present (Borgatti & Halgin, 2011).
Consequently, the term service delivery network (SDN) will be applied in this master’s thesis. Tax et al. (2013) came up with this new notion, by combining already existing concepts of service encounter (Bitner, Booms, & Tetreault, 1990; Patrício, et al., 2011) and network (Borgatti & Halgin, 2011). As a consequence, they defined it as “two or more organisations that, in the eyes of the customer, are responsible for the provision of a connected, overall service experience” (Tax et al., 2013:455). They thus clearly recognize the necessity to include more parties in the customer’s network than just the service provider. Applied to a healthcare setting, like it is the case in this study, other professional organisations (e.g. healthcare funds), friends and family, and (online) support groups could all play a role in the patient’s life as well during the treatment process.
2.2.1 Customer wellbeing
As this paper includes the possible moderating effect of some variables related to coordination, the authors decided to use customer wellbeing over customer satisfaction as the dependent variable. Customer wellbeing in a SDN is namely not only impacted by the service delivery itself, but by way more actors and events (Frow et al., 2014; Mars, Bronstein, & Lusch, 2013). Therefore, a clear definition of customer wellbeing will be stated in this section.
In order to meet the aspirations of a customer in a SDN, a network actor should positively influence the clients’ subjective wellbeing. Schwarz & Strack (1999:61) identified that concept as “judgments that individuals form on the spot, based on information that is chronically or temporarily accessible at that point in time, resulting in pronounced context effects.” This is an important theoretical description of the notion, since they strongly highlight the fact that subjective wellbeing is a perceived report of humans about their inner state of wellbeing. In addition, seen the possibility of that state being influenced by various previous experiences, events, and so on, it can of course not be considered as stable at all (Schwarz & Strack, 1999).
Based on this preceding knowledge, we define customer wellbeing as “the subjective appraisal of a customer about his/her own social-psychological prosperity” and it will be measured by using the Flourishing Scale of Diener et al. (2010). The actual measurement of it will be discussed further on.
2.2.2 Service quality
The second main concept in this master’s thesis, and the independent variable of our research design, is the quality of a SDN. For this part, we based us on previous work of Parasuraman et al. (1985, 1988) about service quality. For a better understanding of their five distinct dimension scale, which will also be used here, the general notion of service quality will be discussed, followed by the scale itself and its implications on our research.
Unlike goods quality, service quality cannot be measured objectively. Parasuraman et al. (1985) identified it as “an abstract and elusive construct because of three features unique to services: intangibility, heterogeneity, and inseparability of production and consumption” (Parasuraman et al., 1988:13). A service is indeed intangible (since it is a performance rather than an object), heterogenous (since the performance generally depends on the producer, customer and moment), and the production and consumption of a service is often inseparable (since the service can still change after the design phase before effectively delivering it). Consequently, they considered the measurement of consumers’ perception of quality as an appropriate approach to assess the quality of a firm’s service (Parasuraman et al., 1985). In this context, they made use of the notion of perceived quality, which Zeithaml (1987) defined as “the consumer’s judgement about an entity’s overall excellence or superiority. (Parasuraman et al., 1985:15). So once again, the subjective aspect is present in one of our research concepts.
In order to put their theoretical findings into practice, Parasuraman et al. (1988) constructed the
ServQual-scale, consisting of five distinct dimensions (tangibles, reliability, responsiveness, assurance and
empathy) to measure the perceived service quality from the customer’s point of view. As all five dimensions have their own unique features, contributing to create a global overview of the service quality, they will be treated separately in the next paragraphs.
Tangibles is thus the first dimension they identified and this treats the customer’s opinion about the
physical facilities, equipment, and appearance of personnel of the actor (Parasuraman et al., 1988). Seen the healthcare setting of this study, this might not be a significant aspect determining the patient’s wellbeing. When a customer needs that kind of services, the patient will often be restricted to a limited choice. Therefore, the client will be likely to take what he/she can get, without even really ‘evaluating’ it. Still, we propose the following hypothesis, since a positive influence seems a sure thing:
H1: Tangibles positively relates to customer wellbeing.
The second dimension is reliability, which is concerned with the actor’s ability to perform the promised service dependably and accurately (Parasuraman et al., 1988). For instance, Wisniewski and Wisniewski (2005) found in their study applying ServQual in a colposcopy clinic setting that a service quality gap had
arisen concerning this topic. They assumed that the time pressures on staff were likely to be knock-on effects on service quality. Nonetheless, we state the following hypothesis:
H2: Reliability positively relates to customer wellbeing.
Thirdly, the responsiveness dimension deals with the actor’s willingness to help customers and provide prompt service (Parasuraman et al., 1988). Gruber and Frugone (2011) for instance identified that a general practitioner should be inter alia responsive for a better service recovery. As an actor may be better safe than sorry, we see this consequently as a general quality that any actor in a SDN should have. Therefore, our hypothesis reads as follows:
H3: Responsiveness positively relates to customer wellbeing.
The knowledge and courtesy of employees, and their ability to inspire trust and confidence is captured in the fourth dimension, called assurance (Parasuraman et al., 1988). As Spake and Bishop (2009) found that patients trust a general practitioner and are willing to commit to this relationship, when they perceive the GP as competent (Brown & Swartz, 1989; Hensel & Baumgarten, 1988) and when they feel psychologically comfortable (Spake, Beatty, Brockman, & Crutchfield, 2003), we propose the following hypothesis in line with these prior findings:
H4: Assurance positively relates to customer wellbeing.
Finally, empathy is the last dimension and relates to the individualized attention the firm provides its customers (Parasuraman et al., 1988). Winsted (2000) concluded in her research that clients are more satisfied with their doctor-patient relationship and with the medical encounter, when the general practitioner shows concern, civility, congeniality and understanding. By analogy with these conclusions, we generalize our hypothesis to:
H5: Empathy positively relates to customer wellbeing.
2.2.3 Structural properties
As mentioned above, Tax et al. (2013) defined a SDN as a set of organisations, which are responsible for the service delivery from the customer’s point of view. Concluding from this, a network has various actors and some specific characteristics as well. Black and Gallan (2015) for instance divided those features into two parts: structural properties and relational properties. Whereas the former characteristics are network size, density/closure, and centrality and contact status, the latter are reciprocity and symmetry, strength of
ties, transitivity, and structural balance (Black & Gallan, 2015). Seen the fact that multiple organisations are involved in a SDN though, and that for instance Camacho et al. (2010) found that clients want a more active role in their own treatment process and Laing et al. (2005) stated that the power balance in the doctor-patient relationship has shifted from only the doctor who is in control to both parties, the focus in this master’s thesis will lay on coordination-related variables and whether or not they moderate the service quality – customer wellbeing relation.
In the following paragraphs, the structural network properties (Black & Gallan, 2015) will be firstly described briefly to enlarge the theoretical knowledge on this topic in this paper. Consequently, some
coordination will be discussed, resulting in actual hypothesis which will be tested further on statistically.
2.2.3.1 Structural network properties (Black & Gallan, 2015)
Primo, the network size logically refers to the amount of connections in a social network (Uchino, 2004). On the one hand, it is not recommended to have a small sized network. Van Tilburg (1995) for instance found that very small networks constrain knowledge acquisition and resource mobilization. On the other hand, big ones are not really advised as well. The bigger the network size, the more complexities that could arise, possibly leading to a not fully focus on the patient’s health and wellbeing (Provan & Milward, 1995). In addition, as customers are mostly not fully able to manage a growing complex network of resources, very large networks may limit value co-creation as well with a declined customer wellbeing as a result (Black & Gallan, 2015)
Secundo, Uchino (2004) defined density as the interconnection among network members, while Van den Bulte and Wuyts (2007) described the closely related notion of closure as the saturation level of all ties for all entities in the network. Both concepts also are related to Coleman’s social capital theory, which states that social contacts create opportunities for personal benefit (Coleman, 1988). Furthermore, weak ties and structural holes may both lead to e.g. issues in connecting the network entities. Brass (2012) delineated such a structure hole as a missing key connection in a network. Given the healthcare service network setting in this study, a dense/closed network would be probably the most appropriate one. Gummesson (2006) for instance claimed that network density can mitigate some of the size complexities, because better relational knowledge sharing is possible then.
The last structural property in a network are the centrality and contact status (Black & Gallan, 2015). Firstly,
centrality involves the “actor’s importance, power, in the overall network” (Van den Bulte & Wuyts,
2007:20). In healthcare setting, this structural network characteristic for instance relates to information access, as patients often are dependent on the goodwill of a third party – e.g. insurance company, specialist – to get info. Consequently, the patient may feel a lack of control, probably resulting in a decreased wellbeing (Black & Gallan, 2015). Secondly, contact status captures the importance of every network
entity in terms of addressing a customer need (Lin, 1999) and is again related to the social capital theory (Coleman, 1988). In addition, Lin, Fu, and Hsung (2001) found that the quantity and quality of patient knowledge increases when his/her social network contains an experienced entity in healthcare. This creates consequently an opportunity for increased satisfaction with a core service encounter, probably resulting in an overall higher wellbeing.
2.2.3.2 Coordination-related network properties
In this paper, the authors thus focus on the coordination aspects in a SDN. In total, three different features will be included as possible moderators: the coordinating function, the coordination quality, and the satisfaction with the own role.
Firstly, it seems plausible that the coordination function may interfere the service quality – customer wellbeing relationship. If the patients themselves are the process coordinators (which is used as the reference category), it seems likely that service quality has less of an impact on customer wellbeing, since those patients feel more in control. Seen the shifting power balance in doctor-patient relationships (Laing et al., 2005), it could be claimed that being more in control increases the customer wellbeing as well, decreasing consequently the impact of service quality on it. If there is no coordinator or one/more external ones though, patients might be more likely to attribute both positive and negative previous experiences to those persons, leading to a reinforced impact of service quality on customer wellbeing, possible in both directions. Schwarz and Strack (1999) namely stated that subjective wellbeing cannot be considered as stable at all; it is influenced by various previous experiences and events. As a consequence, following hypotheses are formulated:
H6a: The impact of service quality on customer wellbeing increases when respondents do not have a coordinator, compared to patients that are the coordinator themselves.
H6b: The impact of service quality on customer wellbeing increases when respondents have one external coordinator, compared to patients that are the coordinator themselves.
H6c: The impact of service quality on customer wellbeing increases when respondents have more than one external coordinator, compared to patients that are the coordinator themselves.
Secondly, to the authors’ knowledge, there has not been given a clear scientific explanation of the possible moderating effect of coordination quality on the service quality – customer wellbeing relationship. Whereas this paper will investigate this in a quantitative way, the qualitative approach would be an interesting starting point for further research too. However, the authors assume that coordination quality decreases the impact of service quality on customer wellbeing. If the coordination quality is namely of that high of a quality, the delivered service quality will be seen less as a decisive factor in the eyes of the patients
to assess their wellbeing. If the coordination quality is badly in turn, the patients will still value the delivered service quality to a lesser extent, since the lonely and left-behind feeling those patients might get in that situation is plausible to prevail anyway. Therefore, the hypothesis reads as follows:
H7: Coordination quality reduces the impact of service quality on customer wellbeing.
Lastly, the patient’s satisfaction with the own role will most likely decrease the impact of service quality on customer wellbeing as well. It seems logical that being satisfied with your own role may imply the fact you feel like having a purposeful and meaningful life, which is as a matter of fact an item on the Flourishing Scale of Diener et al. (2010), that will be used further on this thesis to measure the customer wellbeing. As a consequence, this possible moderator will most likely dominate the provided service quality in the customer’s wellbeing assessment, leading to following hypothesis:
H8: Patient’s satisfaction with the own role reduces the impact of service quality on customer wellbeing.
2.3 Discussion
The goal of this master’s thesis is thus to examine the influence of service quality on the overall customer
wellbeing, possibly moderated by some coordination-related network properties. This research
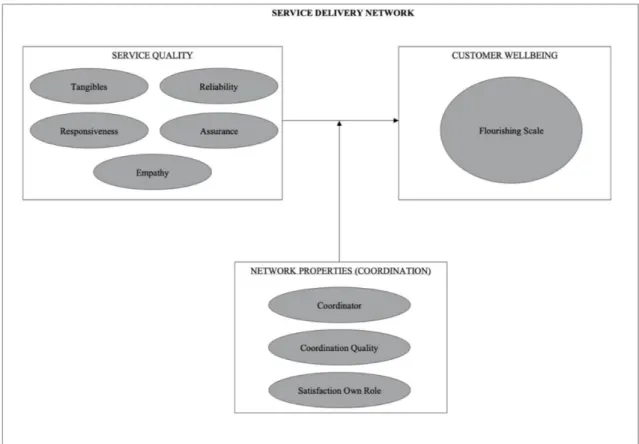
direction was chosen based of a prior reading phase of various academic works on the topics of outsourcing, SDN and value co-creation. Based on our knowledge about these topic field already, service quality in a network setting was considered as the independent variable, while customer wellbeing was seen as the dependent one. As we were convinced that there had to be a moderator in this relationship, we opted to focus us on the coordination inside the care process as a possible moderator for the relationship service quality – customer wellbeing. In addition, our research plan is schematically represented in Figure 2 below and so are the research questions and hypotheses in Table 1.
Figure 2: Research Plan.
WHAT IS THE RELATION BETWEEN SERVICE QUALITY AND CUSTOMER WELLBEING IN A NETWORK SETTING?
How does service quality impact the customer wellbeing?
How do coordination-related network properties moderate this relation?
H1: Tangibles positively relates to customer wellbeing.
H6a: The impact of service quality on customer wellbeing increases when respondents do not have a coordinator, compared to patients that are the coordinator themselves.
H2: Reliability positively relates to customer wellbeing.
H6b: The impact of service quality on customer wellbeing increases when respondents
have one external coordinator, compared to patients that are the coordinator themselves.
H3: Responsiveness positively relates to customer wellbeing.
H6c: The impact of service quality on customer wellbeing increases when respondents have
more than one external coordinator, compared to patients that are the coordinator themselves.
H4: Assurance positively relates to customer wellbeing.
H7: Coordination quality reduces the impact of service quality on customer wellbeing
H5: Empathy positively relates to customer wellbeing.
H8: Patient’s satisfaction with the own role reduces the impact of service quality on customer wellbeing.
3 Method
This master’s thesis thus started with a systematic review (Hawker et al., 2002), and will now be followed by a statistic analysis of collected survey data (N=505).
3.1 Survey
The next step was constructing, conducting and reporting the results of the survey. We made use of previous collected data by three prior master’s dissertations. Besides, Groves et al. (2004:2) defined a survey as “a systematic method for gathering information from (a sample of) entities for the purposes of constructing quantitative descriptors of the attributes of the larger population of which the entities are members.” Accordingly, the quantitative research technique is sequential to the qualitative one: the study started with collecting, identifying and explaining some models and theories, before testing them for a representative group of people. This kind of research technique was needed as well, as the goal is to construct generalizations based on (subjective) facts and that can only be truthfully done by collecting a lot of data from many research units (N=505). A good research sample and relevant, complete indicators are all crucial here and will be discussed further on, just as the reporting of the results.
3.1.1 Design
Van Thiel (2015) identified three crucial steps during the design of the survey: the most accurate variables have to be chosen, the items should be formulated carefully and placed in an understandable order with a clear lay-out too. All those requirements were met fairly well, since it was a first language, uncomplicated questionnaire, consisting of precise questions and items. It was namely divided into five clearly separated parts and drawn up by not only one grad, but also by her supervisor, promotor and four other Master students. The questions, in turn, are a healthy mix of open and closed questions, mostly using a 7-point Likert scale (Vancaillie, 2019). Despite the harder standardisation of the answers, which may lead to less possibilities for the subsequent analysis (Fowler, 2008), the choice for open questions in one specific part was justified, seen the identifying objective of those specific queries. In addition, as the authors offered their help to the respondents by helping them completing the survey, it can be seen as a supervised survey (Bryman, 2012). To promote transparency, the entire (Dutch) questionnaire can be found in Attachment 2.
3.1.2 Sample
With respect to the sample, this master’s dissertation has a wide target group, combining the data of three previous studies. Primo, Vancaillie (2019) examined the patients’ experiences in a SDN setting of people in a treatment for a mental disorder in Flanders (N=117). Secundo, Scheire and Meulenijzer (2019) studied the same for patients revalidating from a physical problem (N=185). Lastly, Boucherie and Roose (2019) had the same research design too, but with elder people in home care (N=203) as their sample. In addition, they all used five inclusion criteria (e.g. being of age and being able to read and understand the Dutch
language), based on which the responsible doctor decided whether or not his/her patients met those requirements (Vancaillie, 2019).
3.1.3 Analysis
The analysis of the data, generated by abovementioned surveys, was done using the statistical analysis programme SPSS.
Before heading over to the actual calculations, the data was explored in the so-called exploration phase. Firstly, the category of each variable (categoric or metric) was defined and the missing values were examined by requesting frequency tables. Secondly, the normality of all quantitative variables was tested by looking at the Q-Q plot and the Skewness and Kurtosis. The limit values used in this study were -1 and 1, as proposed by Blanca, Arnau, López-Montiel, Bono, and Bendayan (2013). They namely stated that a Skewness and Kurtosis score between -1 and 1 is acceptable when using real data samples, as we do. In addition, the centralisation of variables was done by distracting the variable values with the mean of the variable, if desired.
Subsequently, not all variables stayed untouched during the preparation phase. The categorical ones with more than two categories were transformed to dummy variables and some variables were combined to form an average sum score, in order to be able to use them in statistical analyses as well. Before constructing those sum scores though, the Cronbach’s alpha mostly had to be calculated to control the quality of the newly formed scale. We considered .70 as a minimum score, following Taber (2018) who stated that there is an acceptable quality from that turning point on.
Finally, the actual calculation phase was attained. Concerning the descriptive results, there was a standard method of working, depending on the nature of the variable. On the one hand, the mean, standard deviation, minimum, and maximum was calculated by SPSS for each metric variable. On the other hand, both the absolute frequency (amount of respondents) as the relative frequency (amount of percentage) was measured for each categorical one.
In addition, several more complex kind of calculations were done in the statistical results part too. Firstly, to find out the relation between service quality (independent variable) and customer wellbeing (dependent variable), a linear regression analysis was applied. The authors used this to understand the mean change in a dependent variable (customer wellbeing) given a one-unit change in each independent variable (service quality). As this type of calculations need to meet some assumptions, like there should not be multicollinearity between the independent variables, those were tested primarily (Mortelmans & Dehertogh, 2007). Besides, categorical variables were always firstly dummified and the dummy with the
highest sample size served as the reference category. In addition, the used variables were standardized and outliers were removed after further examination, if desired. To examine the effect of our possibly moderating variables, in turn, it was done by adding them firstly all together as an extra step. Afterwards, they were also each added as centralised interaction terms in the previous hierarchical multiple regression analysis, as an extra steps of course, to effectively measure the moderating effect of each variable.
3.2 Measurement
Subsequently, the exact measurement of every key concept in this master’s thesis will be defined and discussed in this section.
3.2.1 Customer wellbeing (Flourishing Scale)
In order to measure the dependent research variable properly, the Flourishing Scale (Diener et al., 2010) was used. This scale was constructed in the same work, which laid the basis for our own definition of the concept as well. In total, this scale includes eight items, covering among others social relationships (‘relationships supportive’, ‘contribute to others’ and ‘respected’). In addition, all the distinct items are schematically represented in Table 2 below. There, for each item of the scale, the exact meaning and measurement of it (Dutch statements in the survey, using a 7-point Likert scale) in this study can be noticed.
Items Meaning Measurement
FLOURISH ING SCA LE Purpose & Meaning Having a purposeful and meaningful life.
“Ik leid een doelgericht en zinvol leven.” Relationships
supportive
Having supportive and rewarding relationships.
“De sociale relaties met mijn vrienden, kennissen en/of collega’s zijn ondersteunend en belonend.” Engaged Being engaged and interested
in your daily activities.
“Ik ben geëngageerd met en geïnteresseerd in mijn dagelijkse activiteiten.” Contribute
to others
Contributing to the happiness of others.
“Ik draag actief bij aan het geluk en welzijn van anderen.” Competence Feeling competent and capable in activities
that are important to you.
“Ik ben capabel en in staat om de activiteiten uit te voeren die belangrijk voor mij zijn.” Good person Considering yourself as a good person that
is living a good life.
“Ik vind mezelf een goed persoon en leid een goed leven.” Optimistic Being optimistic
about the future.
“Ik ben optimistisch over mijn toekomst.” Respected Being respected
by others. “Mensen respecteren mij.”
3.2.2 Service quality (ServQual-scale)
The independent variable was measured by making use of the ServQual-scale (Parasuraman et al., 1988), consisting of five distinct dimensions: tangibles, reliability, responsiveness, assurance and empathy. For clarity and to draw a parallel with the previous main concept of this master’s thesis (customer wellbeing), all these dimensions are schematically represented in Table 3 below as well. There, for each dimension, the exact meaning and measurement of it in this study can be seen.
However, not every dimension may seem fully covered at first by the proposed measurement. Whereas it makes sense to measure ‘tangibles’ for instance by looking to the quality-price-ratio, the choice of including the measurement aspect of clear communication in order to test ‘responsiveness’ might need some explanation. The researchers believe that providing prompt service is only possible when there is clear communication about it. Consequently, it was correctly included as a measurement aspect for that dimension. In addition, not a single measurement aspect was used more than once to measure a dimension. This was a conscious choice, since the likely problem of multicollinearity had to be avoided preferably. Lastly, the ServQual dimensions had a Cronbach alpha value of .94 in our sample, showing excellent internal consistency (Taber, 2018).
Dimension Meaning Measurement
SERVQUA
L
DIMENSIONS
Tangibles How are the physical facilities, equipment, and
appearance of personnel of the actor? ‘Goede prijs/kwaliteit verhouding’ Reliability Is the actor able to perform the promised service
dependably and accurately? ‘Goede zorg’ Responsiveness Is the actor willing to help you
and provide prompt service?
‘Tijdige zorg’ ‘Duidelijke communicatie’ Assurance Is the actor polite, competent,
and trustworthy? ‘Vriendelijkheid’
Empathy Does the actor care about you by
giving you personal attention? ‘Met mij begaan’ Table 3: Measurement of service quality (ServQual-scale).
3.2.3 Network properties (coordination)
Lastly, the measurement of the possibly moderating variables are being described and discussed. As already mentioned, we focused us on coordination-related variables for this part. Consequently, the concept coordination was operationalised by considering three distinct variables: coordinator, satisfaction own role, and coordination quality. Those three variables are schematically represented in Table 4 below as well. There, for each variable, the exact meaning and measurement of it in this study can be seen. Important to note though is that the last abovementioned variable was measured by combining two questions (Cronbach’s alpha = .77) out of the survey, as can be seen in Table 4 below.
Variable Meaning Measurement
STRUCTURA
L
PROPERTIE
S
Coordinator Who is the coordinator in the care process?
“Duid aan wie een coördinerende rol opneemt in uw zorgverleningstraject/zorgproces.”
Coordination quality
How qualitative is the coordination in the care process, according to the
patient?
“Ik ben tevreden over de mate waarin de verschillende personen en/of organisaties in mijn dienstverleningsnetwerk elkaar kennen”
“Ik ben tevreden over de communicatie tussen de verschillende personen en/of organisaties in mijn dienstverleningsnetwerk.” Satisfaction
own role
How satisfied is the patient with his/her own role in the care process?
“Ik ben tevreden over mijn eigen rol in het dienstverleningsnetwerk.” Table 4: Measurement of network properties (focus on coordination).
4 Results
4.1 Descriptive results
4.1.1 Characteristics respondents
In total, 505 respondents have filled out the questionnaire. The sample consists of 291 women and 214 male, of which the youngest participant is 18 and the oldest 96 years. Only 21.9% did not complete secondary education or higher and 52.7% are already retired. Finally, this sample was attained by combining previous research data from various healthcare domains. Consequently, it contains 203 geriatric patients in home care (Boucherie & Roose, 2019), 185 patients physically rehabilitating (Scheire & Meulenijzer, 2019), and 117 psychiatric patients (Vancaillie, 2019).
Besides, the respondents scored the severity of their disease from one to seven with a mean score of 4.22. The higher the score, the more severe the illness. They did the same for their wellbeing. This was measured by eight distinct questions constructing a general wellbeing scale – the Flourishing Scale (Diener et al., 2010) – with a Cronbach’s alpha of .91, showing excellent internal consistency (Taber, 2018). The respondents had thus to score those questions from one to seven on a 7-point Likert scale, with value 1 representing “not at all” and value 7 “totally”. The mean score was 5.56 out of seven. Table 5 below gives a detailed overview of the respondents’ characteristics.
Characteristic Mean Std. Dev. Min Max
Age 60.82 19.66 18 96
Severity of the disease 4.22 1.80 1 7
Wellbeing 5.56 1.09 2,25 7
Frequency Percentage
Gender
Female 291 57.6
Highest degree Primary school 110 21.9 Secondary school 218 43.3 College 123 24.5 University 39 7.8 Research population
Geriatrics (home care) 203 40.2
Physical rehabilitation 185 36.6 Psychiatry 117 23.2 Work regime Sick leave 103 20.4 Unemployment 12 2.4 Full-time employment 47 9.3 Part-time employment 21 4.2 Retirement 266 52.7
Table 5: Overview of the respondents' characteristics (N=505).
4.1.2 Characteristics SDN
All the 505 respondents are of course situated in their own SDN as well. Consequently, the exact characteristics of those networks had to be examined too. In this section, the focus will first lay on the composition of it, before heading over to the first (simple) quality evaluation.
4.1.2.1 Composition SDN
Firstly, Table 6 below shows that a respondent’s SDN contains on average 7.30 actors. This number can vary a lot though, since the smallest SDN consisted of only one actor and the biggest of nineteen. In addition, almost every SDN consisted of at least one individual health professional (97.0%), and family and friends (93.3%). Professional organisations (89.5%) and coordinators (83.6%) were mostly present as well. Other actors (12.9%) and online ones (14.1%) were the least present though. Finally, peers only belonged to the respondent’s SDN in 39.0% of the cases.
Characteristic Mean Std. Dev. Min Max
Amount of actors 7.30 3.06 1 19
Presence of actor group Frequency Percentage
Family and friends 471 93.3
Peers 197 39.0
Individual health professionals 490 97.0
Professional organisations 452 89.5
Online actors 71 14.1
Coordinators 419 83.6
Others 65 12.9
4.1.2.2 Quality SDN
As could be seen in Table 6 above, 83.6% of the respondents claimed to have a coordinator. The survey included a specific question about this, of which the results can be seen below. Table 7 indeed shows amongst others who the coordinator(s) was (were) in the respondent’s care process. The coordinator was the patient himself/herself (46.3%), one person/organisation (20.8%), or more than one person/organisation (16.6%). In 16.4% of the cases, there was not a single actor that fulfils the coordinating function.
In addition, Table 7 also points out the patient’s general satisfaction with his/her SDN, the participant’s evaluation of the mutual relation between his/her SDN actor groups, the respondent’s evaluation of the communication between his/her SDN actor groups and the patient’s satisfaction with his/her own role. The respondents had to score every question from one to seven on a 7-point Likert scale, with value 1 representing “not satisfied at all” and value 7 “totally satisfied”. Seen the very good Cronbach’s alpha of .87, those last four abovementioned variables were approached in a general SDN quality scale as well. Consequently, Table 7 below demonstrates that the patients on average were rather satisfied (5) to satisfied (6) with the quality of their SDN, since the mean scores vary from 5.35 to 5.92.
Coordinating function by … Frequency Percentage
Nobody 82 16.4
Patient 232 46.3
1 person or organisation 104 20.8
More than 1 person and/or organisation 83 16.6
Patient’s satisfaction with … Mean Std. Dev. Min Max
SDN (general satisfaction) 5.92 1.05 1 7
Relation between SDN actor groups 5.43 1.38 1 7
Communication between SDN actor groups 5.35 1.35 1 7
Patient’s own role in the SDN 5.62 1.21 1 7
General SDN quality 5.57 1.06 1 7
Table 7: Quality SDN (N=505).
4.1.3 Service quality
As mentioned before, the measurement of service quality in this master’s thesis was done based on the various ServQual dimensions Parasuraman et al. (1988) identified. The respondents had to score six features, associated with service quality, on a 7-point Likert scale. Those characteristics varied from kindness to good care, and were later each distributed to the appropriate ServQual dimension, as can be seen in Table 2 in subsection ‘3.2.2 Service quality (ServQual)’. Finally, service quality was measured in two ways here. Whereas the first measurement method pointed out to which degree all actors (considered as a whole) were associated with a specific dimension, the second one showed to what extent a group of actors was associated with all dimensions (considered as a whole). In both cases it was done by taking the
average of the sum of the five separate dimensions. The most notable findings are discussed and showed in respectively Table 8 and Table 9 below. All the results, in turn, can be found in Attachment 3.
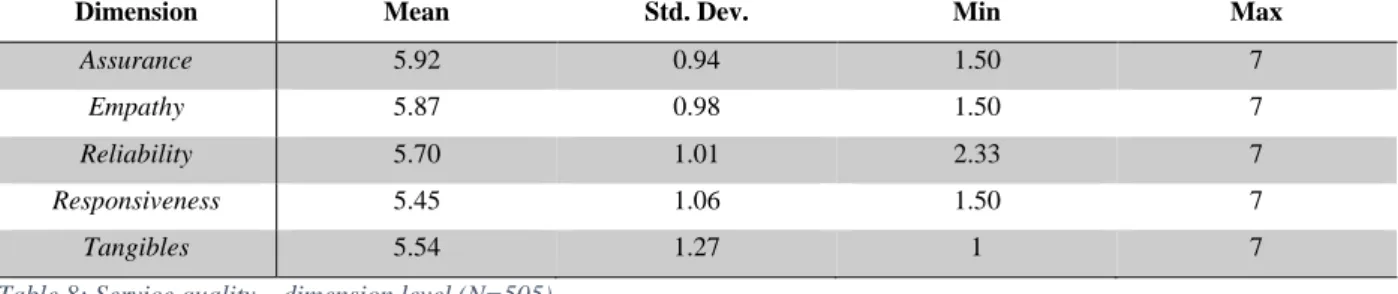
4.1.3.1 Degree to which groups of actors are associated with various ServQual dimensions
Table 8 shows that assurance and empathy can be seen as the highest scoring dimensions across all groups of actors, with respectively 5.92 and 5.87 out of seven. The other three dimensions were in line with those findings, as their scores vary from 5.45 to 5.70. As a consequence, the general perceived service quality by patients across all groups of actors in their SDN could be evaluated as rather good (5) to good (6).
In addition, the same pattern occured for each dimension. Both family and friends, as individual health professionals got on average the best score, shortly followed by the coordinators. Meanwhile, online actors always got a relatively low score. The other actor groups were situated in between, but thus more closely to the scores of those three good scoring kinds of actors than to the online actors. As mentioned earlier, the means, standard deviations, minima, and maxima of these variables can be found in Attachment 3.
Dimension Mean Std. Dev. Min Max
Assurance 5.92 0.94 1.50 7
Empathy 5.87 0.98 1.50 7
Reliability 5.70 1.01 2.33 7
Responsiveness 5.45 1.06 1.50 7
Tangibles 5.54 1.27 1 7
Table 8: Service quality – dimension level (N=505).
4.1.3.2 Degree to which various groups of actors are associated with good service quality
Once more, Table 9 points out that family and friends (6.04), the individual health professionals (6.00), and coordinators (5.84) on average deliver the highest service quality. Again, the online actors were less associated with service quality (3.19). Consequently, the abovementioned means indicated a good service quality for the former groups of actors, and only a rather poor one for the latter actor group. The other actor groups averages varied from 5.17 to 5.55. These scores illustrated a rather good to good service quality. Lastly, the Cronbach’s alpha of every sum score indicated excellent internal consistency.
Group of actors Mean Std. Dev. Min Max Cronbach’s alpha
Family and friends 6.04 1.23 1 7 .90
Peers 5.23 1.32 1 7 .87
Individual health professionals 6.00 1.02 1 7 .93
Professional organisations 5.55 1.25 1 7 .94
Online actors 3.19 1.83 1 7 .93
Coordinators 5.84 1.36 1 7 .96
Others 5.17 1.37 1 7 .91
4.2 Statistical results
4.2.1 How does service quality impact the customer wellbeing?
A hierarchical multiple regression was calculated to assess the ability of ServQual dimensions to predict the customer wellbeing, after controlling for the influence of gender, age, severity of the disease, highest degree, research population, and work regime.
ASSUMPTIONS
As this type of calculation needs to meet some assumptions, like mentioned before, those were tested primarily (Mortelmans & Dehertogh, 2007). The according figures can be found in Attachment 4. Firstly, the standardized residues indeed had a mean of zero (variance = .97), which can be determined as a constant one. Secondly, there could be stated that the standardized residual values are normally distributed, since their Skewness and Kurtosis values did not exceed the limit values of -1 and 1, as proposed by Blanca et al. (2013). Thirdly, the relation was indeed linear, as could be seen by requesting a scatter plot with the standardized predicted values on the X-axis and the standardized residual ones on the Y-axis. Fourthly, there was no autocorrelation inside the residual ones, as the dots of the scatter plot were situated randomly. Lastly, seen the scatter plot and abovementioned reasoning, there could be claimed that the residual values were homoscedastic (Mortelmans & Dehertogh, 2007).
To conclude, the authors decided to continue running a hierarchical multiple regression analysis, since all assumptions were met.
DATA PROBLEMS
Following these prior tests, a closer look had to be taken to some possible data problems as well. Here, the data was scanned for multicollinearity and outliers (Mortelmans & Dehertogh, 2007). The first possible problem did not turn out as an actual problem in this analysis, since the VIF value was always lower than the limit value of ten (Hair, Anderson, Tatham, & Black, 1995). Secondly, no outliers were identified. All cases namely fit the proposed interval of [-3,3] by literature of the studentized residual values (Mortelmans & Dehertogh, 2007). The according tables can be retrieved in Attachment 4 as well.
ACTUAL CALCULATION
Consequently, after entering the six control variables as dummies into Step 1, the model explained 11.8% of the variance in customer wellbeing, as can be seen in Table 10. After including the ServQual dimensions at Step 2, the total variance explained by the model was 18.5%. Based on the R2 Change value, the ServQual dimensions explained thus an additional 7.4% of the variance in customer wellbeing, after controlling for the influence of gender, age, severity of the disease, highest degree, research population, and work regime.
Model R R2 Adj. R2 R2 Change
1 (control variables) .374 .140 .118 .140
2 (predictors) .462 .214 .185 .074 Table 10: Hierarchical Multiple Regression 4.2.1 – Model Explanatory Values (N=484).
In addition, both overall regression models were a good fit for the data. Both only the control variables (F[12,471] = 6.396, p = .000), as well as the control variables together with the actual independent variables (F[17,466] = 7.451, p = .000), statistically significantly predicted the dependent variable. The actual SPSS output tables, both of this part as the other segments, can once again be found in Attachment 4.
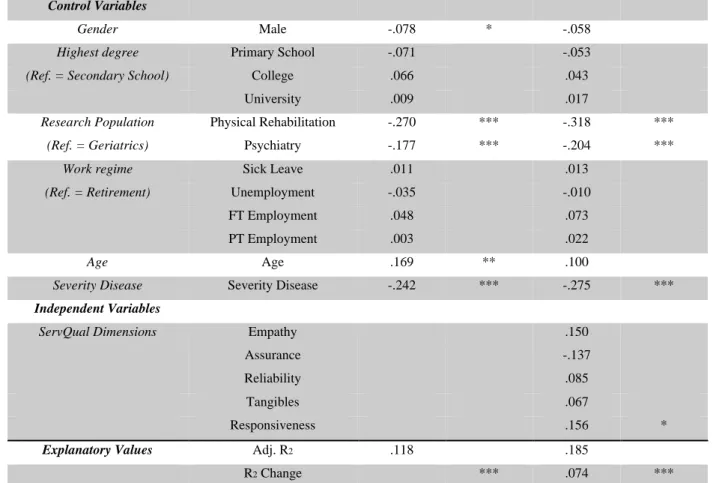
Lastly, the estimated model coefficients were analysed. In Table 11 below, the standardized coefficients (Beta-values) and significance values (* p < 0.1, ** p < 0.05, *** p < 0.01) are represented for every variable in each model, as well as a concise repetition of the explanatory values. Concerning the control variables, research population and severity of the disease stayed significant predictors throughout the two models (p = .000). Concerning the independent variables, responsiveness was the only ServQual dimension that showed a trend to significance (p = .084). We thus conclude that this model is a great starting point, but still far away from perfect. Consequently, it might be interesting to see the influence of our possibly moderating variables on it.
Model 1 Model 2
Control Variables
Gender Male -.078 * -.058
Highest degree Primary School -.071 -.053 (Ref. = Secondary School) College .066 .043
University .009 .017
Research Population Physical Rehabilitation -.270 *** -.318 *** (Ref. = Geriatrics) Psychiatry -.177 *** -.204 ***
Work regime Sick Leave .011 .013 (Ref. = Retirement) Unemployment -.035 -.010
FT Employment .048 .073
PT Employment .003 .022
Age Age .169 ** .100
Severity Disease Severity Disease -.242 *** -.275 ***
Independent Variables
ServQual Dimensions Empathy .150
Assurance -.137
Reliability .085
Tangibles .067
Responsiveness .156 *
Explanatory Values Adj. R2 .118 .185
R2 Change *** .074 ***
4.2.2 How do coordination-related network properties moderate this relation?
Once again, a hierarchical multiple regression was calculated to assess the moderating effect of some variables about coordination on the relation service quality – customer wellbeing. These were firstly added all together for an exploratory purpose as an extra ‘Step’ in the regression analysis, after the control variables (Step 1) and the independent variables (Step 2). Secondly, interaction terms were created for each possibly moderating variable, by multiplying the centralised predictor (the overall service quality) with it. These were all added separately as ‘Step 4’ to the regression model that can be seen in subsection 4.2.1.
4.2.2.1 Moderating effect of the coordinator
Firstly, the moderating effect of the variable concerning the coordinator function was examined. This was done by, on the one hand, adding it in its ‘original’ state as ‘Step 3’ in the hierarchical multiple regression of subsection 4.2.1. On the other hand, ‘Step 4’ contained the interaction term between the general ServQual score and each coordinator situation, by multiplying them once they were centred. The purpose of this analysis was to determine whether or not this was indeed a moderator on the relation service quality – customer wellbeing.
ASSUMPTIONS
As this type of calculation needs to meet some assumptions, like mentioned before, those were tested primarily (Mortelmans & Dehertogh, 2007). The according figures can be found in Attachment 5. Firstly, the standardized residues indeed had a mean of zero (variance = .98), which can be determined as a constant one. Secondly, there could be stated that the standardized residual values are normally distributed, since their Skewness and Kurtosis values did not exceed the limit values of -1 and 1, as proposed by Blanca et al. (2013). Thirdly, the relation was indeed linear, as could be seen by requesting a scatter plot with the standardized predicted values on the X-axis and the standardized residual ones on the Y-axis. Fourthly, there was no autocorrelation inside the residual ones, as the dots of the scatter plot were situated randomly. Lastly, seen the scatter plot and abovementioned reasoning, there could be claimed that the residual values were homoscedastic (Mortelmans & Dehertogh, 2007).
To conclude, the authors decided to continue running a hierarchical multiple regression analysis, since all assumptions were met.
DATA PROBLEMS
Following these prior tests, a closer look had to be taken to some possible data problems as well. Here, the data was scanned for multicollinearity and outliers (Mortelmans & Dehertogh, 2007). The first possible problem did not turn out as an actual problem in this analysis, since the VIF value was always lower than the limit value of ten (Hair et al., 1995). Secondly, 1 outlier was identified, that thus did not fit the proposed