RIVM Report 2015-0194
M. Woutersen et al.
Prioritisation tool for chemical
substances in consumer products
Colophon
© RIVM 2015
Parts of this publication may be reproduced, provided acknowledgement is given to: National Institute for Public Health and the Environment, along with the title and year of publication.
Marjolijn Woutersen (author), R.I.V.M. Korienke Smit (author), R.I.V.M. Wouter ter Burg (author), R.I.V.M. Bas Bokkers (author), R.I.V.M. Gerlienke Schuur (author), R.I.V.M. Contact:
Gerlienke Schuur VSP
gerlienke.schuur@rivm.nl
This investigation has been performed by order and for the account of NVWA, within the framework of kennisvraag 9.1.46
This is a publication of:
National Institute for Public Health and the Environment
P.O. Box 1 | 3720 BA Bilthoven The Netherlands
Publiekssamenvatting
Prioritisation tool for chemical substances in consumer products
Consumentenproducten bevatten een breed scala aan chemische stoffen. In principe zijn deze producten veilig in het gebruik. Om dit te bewaken ziet de inspectie van de Nederlandse Voedsel- en Waren Autoriteit (NVWA) erop toe dat de hoeveelheden van deze stoffen onder de wettelijke grenzen blijven. Het RIVM heeft een tool ontwikkeld op basis waarvan toezichthouders kunnen bepalen welke stoffen of productgroepen mogelijk de meeste aandacht behoeven.
Welke stoffen in cosmetica hebben bijvoorbeeld de hoogste prioriteit? Waar zitten meer potentieel gevaarlijke stoffen in: schoonmaakmiddelen of doe-het-zelf-producten? Om dit te bepalen is gebruikgemaakt van gegevens uit de Europese database waarin alle stoffen staan die onder de wetgeving voor stoffen REACH vallen. De tool richt zich op stoffen die gebruikt worden in consumentenproducten en één of meer van de volgende schadelijke effecten kunnen hebben: kankerverwekkend, DNA beschadigend, schadelijk voor de voortplanting, of potentieel allergeen bij contact met de huid of inademing.
Voor de prioritering zijn de gevaarseigenschappen van de stoffen in kaart gebracht en gecombineerd met de mate waarin consumenten aan de stoffen blootstaan. Samen vormen zij het risico. Bij de blootstelling worden punten toegekend aan onder andere het aantal producten waarin een stof zit en de mate waarin de stof eruit kan vrijkomen. Voor de gevaarseigenschappen wordt gekeken naar de ernst van de
schadelijke effecten van een stof en de hoeveelheid van een stof die het schadelijke effect veroorzaakt.
De tool maakt het mogelijk om uit de zeer grote, nog toenemende hoeveelheid informatie over chemische stoffen, stoffen en
productgroepen te selecteren die mogelijk een risico voor de consument vormen.
Kernwoorden: Prioritering, consumentenproducten, CMR, REACH, schadelijkheid, blootstelling, risico, IUCLID
Synopsis
RIVM develops prioritization tool for chemical substances in consumer products
Consumer products contain a wide range of chemical substances. In principle, such products are safe to use. The inspectors of the Netherlands Food and Consumer Product Safety Authority (NVWA) conduct monitoring to ensure that the levels of chemical substances in consumer products do not exceed the applicable statutory limits. The Dutch National Institute for Public Health and the Environment (RIVM) has developed a tool that regulatory authorities can use to determine which substances or product groups require the most attention. Which substances found in cosmetics should be prioritized? Which product group contains more potentially harmful substances: detergents or DIY products? The tool answers such questions using information obtained from the European database containing all substances that fall within the scope of the so-called REACH Regulation (Regulation (EC) No. 1907/2006 concerning the Registration, Evaluation, Authorization and Restriction of Chemicals). The tool focuses on substances that are used in consumer products and that have one or more of the following hazardous properties: carcinogenicity, mutagenicity, reproduction toxicity, skin sensitizer or respiratory sensitizer.
The priority assigned to each substance is determined based on its hazard as well as the extent to which consumers are exposed to the substance. The risk assessment is based on these two factors. Exposure scores are determined by assigning weighting factors to the number of products containing a particular substance and the extent to which that substance can be released by the product concerned. The hazard score is determined by the severity of the substance’s harmful effects and the potency of the substance.
Using the prioritization tool, chemical substances and product groups that may pose risks to consumers can be selected from the vast and ever-increasing amount of information about chemical substances. Keywords: Prioritisation, consumer products, CMR, REACH, hazard, exposure, risk, IUCLID
Contents
Summary — 9 Samenvatting — 11 1 Introduction — 15 1.1 Background — 15 1.2 Objective — 15 1.3 Approach — 162 Choice of the data source and retrieval of substance information — 17
2.1 Selection of the data source — 17
2.2 Selection and retrieval of substances from the ECHA database — 19
3 Methodology for the prioritisation of chemical substances in consumer products — 21
3.1 Assigning scores to the input parameters — 21 3.1.1 Hazard score — 21
3.1.1.1 Hazard endpoint score — 21 3.1.1.2 Hazard potency score — 23
3.1.1.3 Combining hazard endpoint and potency scores — 27 3.1.2 Exposure score — 27
3.1.2.2 Number of Product/article categories — 27 3.1.2.2 Product exposure score — 28
3.1.2.3 Expert elicitation PC and AC exposure scores — 31
3.1.2.4 Combining Product/Article Categories and product exposure scores — 32 3.2 Combining the hazard and exposure scores — 33
3.2.1 Prioritisation of substances — 33 3.2.2 Prioritisation of PC/ACs — 35
4 Results — 37
4.1 Results presented for substances — 37 4.2 Results presented for PC/ACs — 39
4.3 Comparison of the results with other prioritisations — 40
4.3.1 Comparison of the results with results from the ILT prioritisation — 40 4.3.2 Comparison of the results with the SIN list — 44
5 Disclaimer — 47
5.1 Inaccuracies in the ECHA database — 47
5.2 Disclaimer development of the methodology — 47 5.3 Confidentiality — 48
6 Discussion and evaluation — 51
6.1 The methodology — 51
6.2 Overall use and other methods — 52
7 Conclusions and recommendations — 55
8 References — 59
REACH-lists- Candidate list and authorisation list — 61
CLP-lists- Classification and Labelling inventory & Annex VI — 61 Dutch-substance lists- ZZS-list & ILT-list — 62
International list- Domestic substance list and Priority substance list — 62
NGO driven list- SIN-list — 62
Annex II Link between substance and consumer product — 65
ECHA substances database — 65
National Poison Information Centre (NVIC-database) — 65 Household Product Database — 66
Dangerous substance database — 66
Consumer Product Chemical Profile database (Goldsmith et al., 2014) — 66
SPIN-list — 67
Other specific product type databases — 67
Annex IIIPrioritisation tools — 69
Prioritisation under REACH and CLP (Schuur & Traas, 2011) — 69 Risk-inventory of User Categories — 69
Method to prioritise chemical risks in food (Mengelers & Jeurissen, 2013) — 70
Prioritisation tool within the Domestic Substance List (Health Canada) — 71
Annex IV Use categories (UC 62) for chemical substances and preparations — 72
References Annexes — 79
Substance lists, databases and prioritisation tools — 79 The results are presented in the excel files in Annex A:
Summary
The Dutch Food and Consumer Product Safety Authority (NVWA) asked the RIVM to develop a methodology that can be used to prioritise consumer products on the risk of exposure to hazardous substances. The tool can be used to make choices for the NVWA’s enforcement activities, which are limited by capacity and financial resources. In the first stage of methodology development, the ECHA registered substance database was chosen as data source. This database contains information on all substances registered under the REACH regulation, which will be compulsory for all substances produced or imported in Europe in volumes of more than one tonne/year in 2018. Currently it includes all substances with a volume ≥100 tonne/year, and CMR classified substances ≥1 tonne/year.
A selection was made from the ECHA database of substances classified as carcinogenic, mutagenic, reproduction toxic, respiratory- and skin sensitisers (CMRSrespSderm) and used in consumer products and/or articles. These consumer products/articles are divided in product/article categories (PC/ACs), for example ‘Cosmetics’ or ‘Plastic articles’.
Additionally, the Derived No Effect Levels and Derived Minimal Effect Levels (DN/MELs) were collected for these substances.
Two lists were created based on the information from the ECHA database. One list contains substances scored on their hazard and exposure, which may be used to determine which substances pose the highest risk to consumers. The second list contains the PC/ACs, and can be used to compare categories of products/articles on their contribution to consumer exposure to harmful substances.
Substances
The selected substances were scored on two hazard and two exposure parameters. The hazard score consists of a score for the severity of the endpoint (based on classification) and a score for the potency (based on DN/MEL). Both factors were scored on a scale of 1 to 10. The exposure score consists of the total number of PC/ACs in which a substance is used, and a score for the exposure from using these products. This product exposure score is scaled from 1 to 27. The scores are combined as follows:
• Hazard score = endpoint score + potency score
• Exposure score = number of PC/ACs + product exposure score • Total substance score = hazard score * 3,5 + exposure score PC/ACs
PC/ACs are ranked on the number of CMRSrespSderm substances they contain, the endpoint scores of these substances, and the product exposure score. These scores are determined as follows:
• Hazard score = sum endpoint scores
• Exposure score = product exposure score * number of substances • Total PC/AC score = hazard score * 2 + exposure score
A schematic overview of the methodology can be found in Section 3.2. The resulting lists with the ranked substances and ranked PC/ACs are provided in the Excel tables Annex A and confidential Annex B. Results from the first execution of the tool showed a total of
53 consumer PC/ACs containing a total of 773 CMRSrespSderm substances. Washing/cleaning agents had the highest total score of the PC/ACs, followed by coatings/paints and fuels.
The substance with the highest score was Aluminium oxide, which was classified as carcinogen, probably based on the presence of an impurity. Noteworthy is that three large groups of petroleum derivates were at the upper end of the ranking with similar scores. These compounds are complex cases because their dossiers in the ECHA database include multiple variants; some have CMR classifications and others are used in consumer products.
A group of methacrylates had the highest exposure scores. These compounds are classified for skin sensitisation, and are used in a wide range of products. Only four compounds, all cobalt salts, had a maximal hazard endpoint score of 10, meaning they are classified as C and/or M, R, Sresp, and Sderm.
The ranking results of the PC/ACs were compared to the prioritisation performed for the ILT (Inspectorate Environment and Transport), and the ranking results of the substances were compared with the SIN list (Substitute it Now). In both cases, the methods agreed well on the high ranking substances and PC/ACs. Most of the differences can be
explained by a difference in scope, as these other methods also include workers and the environment. For that reason, the choice of exposure parameters differed between the methods.
As a recommendation for the future: it will be very interesting to perform a more detailed examination of the dossiers and/or other background information for a selection of substances from the ranking. This may be a random selection, or substances belonging to a
product/endpoint group of specific interest. This folllowup study can be used to validate the tool as well as for enforcement purposes.
In future iterations of the methodology, other hazard endpoints may also be included, such as repeated dose toxicity. It is also recommended to repeat the retrieval of the substance data from the ECHA database after 1 June 2018, as this is the deadline for the registration of substances with lower tonnages.
To conclude, the tool enables the selection and prioritisation of substances and product/article categories from an extensive and growing amount of information on the risk to consumers of industrial chemicals in Europe.
The methodology allows the addition of other endpoints in the selection if required by the enforcement authorities. As such, it facilitates the use of information in the ECHA registered substance database for a risk-based prioritisation of enforcement activities.
Samenvatting
De Nederlandse Voedsel en Waren Autoriteit (NVWA) heeft aan het RIVM gevraagd om een methodiek te ontwikkelen om consumentenproducten te prioriteren op het risico van blootstelling aan stoffen. Deze methodiek kan worden gebruikt om keuzes te maken in de handhavingsactiviteiten van de NVWA, waarvoor de beschikbare capaciteit en middelen beperkt zijn.
In de eerste fase van de ontwikkeling van de methodologie is de ECHA geregistreerde stoffen-database gekozen als informatiebron. Deze database bevat informatie over alle stoffen die geregistreerd zijn onder REACH, wat vanaf 2018 verplicht wordt voor alle stoffen waarvan meer dan een ton per jaar in Europa geproduceerd of geïmporteerd wordt. Op het moment bevat de database in ieder geval alle stoffen met een volume van ≥100 ton/jaar en CMR geclassificeerde stoffen met een volume van ≥1 ton/jaar.
In de ECHA database is een selectie gemaakt van stoffen met een classificatie als carcinogeen, mutageen, reproductie-toxisch, inhalatie- en/of huid-sensibiliserend (CMRSrespSderm) die gebruikt worden in consumentenproducten en/of -artikelen. Deze consumentenproducten/-artikelen worden ingedeeld in product/artikel categorieën (PC/AC's), zoals ‘Cosmetica’ of ‘Plastic artikelen’. Daarnaast zijn de Derived No Effect Levels en Derived Minimal Effect Levels (DN/MEL's) van deze stoffen verzameld.
Op basis van de informatie uit de ECHA-database zijn er twee lijsten opgesteld. De eerste bevat stoffen gescoord op gevaarseigenschappen en blootstelling en kan gebruikt worden om te bepalen welke stoffen het hoogste risico voor consumenten geven. De andere lijst bevat PC/AC's en kan gebruikt worden om product-/artikelcategorieën te vergelijken op de mate waarin ze leiden tot consumentenblootstelling aan schadelijke stoffen.
Stoffen
Er zijn scores toegekend aan de geselecteerde stoffen op basis van vier parameters, twee voor de gevaarseigenschappen (hazard) en twee voor de blootstelling (exposure). De gevaarseigenschappen worden bepaald door de ernst van het effect (gebaseerd op de classificatie) en de potentie van de stof (gebaseerd op de DN/MEL). Beide factoren zijn gescoord op een schaal van 1 tot 10. De blootstellingsscore bestaat uit het totaal aantal PC/AC's waarin een stof wordt gebruikt en een
productblootstellingsscore voor de blootstelling als gevolg van het gebruik van deze producten. Deze laatste heeft een schaal van 1 tot 27. De scores zijn op de volgende manier gecombineerd:
• gevaarsscore = effect score + potentiescore;
• blootstellingsscore = aantal PC/ACs + product blootstellingsscore; • totale stof score = gevaarsscore * 3,5 + blootstellingsscore.
PC/ACs
PC/ACs zijn gerangschikt op het aantal CMRSrespSderm stoffen dat ze bevatten, de effect scores van deze stoffen en de product
blootstellingsscore. De totaalscore is als volgt afgeleid: • gevaarsscore = som effect scores;
• blootstellingsscore = product blootstellingsscore * aantal stoffen; • totale PC/AC score = gevaarsscore * 2 + blootstellingsscore. In Sectie 3.2 staat de methodologie schematisch weergegeven. De lijsten met de gerangschikte stoffen en PC/AC's staan in de Exceltabellen in Annex A en de confidentiële Annex B.
In de eerste resultaten van de methodologie staan in totaal
53 consumenten PC/AC's die samen 773 CMRSrespSderm geclassificeerde stoffen bevatten. Van de PC/AC's hebben de
was-/schoonmaak-producten de hoogste totaal score, gevolgd door coatings/verven en brandstoffen.
De stof met de hoogste score is aluminiumoxide, die geclassificeerd is als carcinogeen, waarschijnlijk op basis van een verontreiniging. Opvallend zijn drie grote groepen met petroleumderivaten in het bovenste deel van de ranglijst die allemaal dezelfde score hebben. Het risico van deze stoffen is moeilijk te beoordelen, omdat er meerdere varianten in hetzelfde dossier staan, waarvan sommige een CMR-classificatie hebben vanwege onzuiverheden en anderen gebruikt worden in consumentenproducten.
De methacrylaten hebben de hoogste blootstellingsscores. Deze stoffen zijn geclassificeerd als huid-sensibiliserend en worden in veel
verschillende producten gebruikt. Slechts vier stoffen, alle vier
kobaltzouten, hebben een maximale effect score van 10, wat betekent dat ze geclassificeerd zijn als C en/of M, R, Sresp en Sderm.
De ranglijst van de PC/AC's is vergeleken met de prioritering die is uitgevoerd voor de ILT (Inspectie Leefomgeving en Transport) en de ranglijst met stoffen met de stoffen op de SIN-lijst (Substitute it Now). In beide gevallen is er een behoorlijke mate van overeenstemming over de hoogscorende stoffen en PC/AC's. De verschillen kunnen grotendeels verklaard worden door een verschil in doelstelling, waarbij de andere methoden ook naar werknemers en het milieu gekeken hebben.
Hierdoor verschillen de methoden in de keuzes die gemaakt zijn, vooral voor de blootstellingsparameters.
Vooruitkijkend naar de toekomst zou het heel nuttig en interessant zijn om voor een aantal stoffen op de lijst meer in detail naar de dossiers en/of andere achtergrondinformatie te kijken. Dit zou kunnen op basis van een willekeurige selectie of door stoffen te nemen die in een bepaalde productgroep worden gebruikt of een bepaald effect hebben. Een dergelijke studie is zowel nuttig om deze methodiek te valideren als voor de handhaving.
In toekomstige versies van de methodologie kunnen mogelijk ook andere gevaarseigenschappen meegenomen worden, zoals toxiciteit bij herhaalde blootstelling. Het is ook aan te raden om na 1 juni 2018 de gegevens van de stoffen opnieuw uit de ECHA database te halen, omdat dit de registratie deadline is voor alle stoffen met lagere tonnages.
Concluderend wordt in dit rapport een tool gepresenteerd die het mogelijk maakt om stoffen en producten/artikelen te selecteren uit de grote hoeveelheid informatie over industriële chemicaliën in Europa en deze te prioriteren op hun risico voor consumenten.
Binnen de methodologie is ruimte om andere eindpunten toe te voegen aan de selectie als daar vraag naar is vanuit de handhavende
autoriteiten. Als zodanig faciliteert de tool het gebruik van de informatie in de ECHA-stoffendatabase voor een risico gebaseerde prioritering van handhavingsactiviteiten.
1
Introduction
1.1 Background
As a requirement of the REACH legislation (Registration, Evaluation, and Authorisation of Chemicals), information is collected on all industrial chemicals produced or imported in Europe. This includes toxicological information and information on the use of substances in product and/or article categories, such as textiles, cosmetics, plastic articles and others. ECHA (European Chemicals Agency) drafts lists of high-priority
substances that should be considered for authorisation and/or restriction (substances of very high concern, SVHC). NGOs also have substance lists such as the Substitute it Now (SIN) list with more than 800 substances.
The Dutch Food and Consumer Product Safety Authority (NVWA) does not prioritise substances for their monitoring programmes, but does prioritise consumer products that contain hazardous substances. The NVWA monitoring focusses on industries, where product samples serve mainly to check the accuracy of the product dossiers. To perform these enforcement checks efficiently, there have to be insights into which consumer products give the highest risk of exposure to potentially hazardous substances. To gain this knowledge, a translation has to be made from priority substances to consumer products, and from products to producers.
The RIVM were asked by the NVWA to develop a prioritisation
methodology that shows which categories of consumer products give the highest exposure to substances of concern.
1.2 Objective
One of the important tasks of the NVWA is to determine which consumer products are associated with the highest risks from hazardous
substances. To do this, it is necessary to prioritise hazardous substances and determine those consumer products that potentially give the highest exposure to these substances. This information enables the NVWA to focus its enforcement activities on substances and consumer products which have the highest potential for causing adverse health effects. The aim of this project is to develop a tool that will help the NVWA prioritise surveillance activities regarding consumer products. The tool is based on hazard properties of substances, combined with estimated exposure from consumer products.
The NVWA requested that the RIVM:
• choose the data source(s) most suitable for retrieving the required information on reliability, completeness and usability; • develop a method to prioritise substances in consumer products
based on their risk;
• identify which products are most likely to result in the highest consumer exposure to these substances.
1.3 Approach
First, an evaluation was made of available substance lists and
databases, which could be used as data source (see Annexes I and II). Existing prioritisation tools were then evaluated to learn from different methods and to determine the most important criteria for tools that rank substances on risk (see Annex III). The ECHA registered substance database was selected for use in this project as it is an extensive and valuable data source. The rationale behind this choice is given in Chapter 2. The selection was limited to substances having one or more of the following classifications: carcinogenic, mutagenic, reproduction toxic, and respiratory or skin sensitiser.
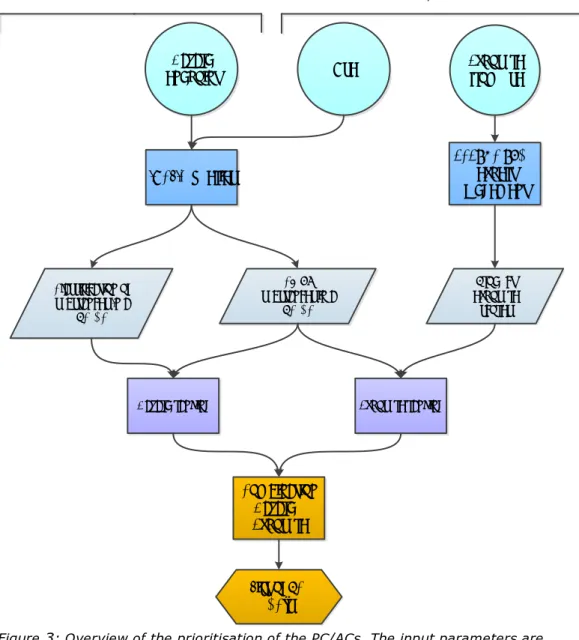
Exposure scores and hazard scores were determined in the next phase of the project. The scoring methodology is described in Chapter 3, first for hazard and exposure separately (Section 3.1) and then for the combination of both endpoints. An overview of the methodology is given in Figure 2 and Figure 3 in Section 3.2.
Substances, including the information used in the methodology, were retrieved from the ECHA database, and scores were assigned. The results are presented in Chapter 4, and the complete lists of the substances and product categories are given in the Excel files in Annex A and confidential Annex B.
The results using this methodology were then compared with two other prioritisation methods, namely the prioritisation tool developed by the Inspectorate Environment and Transport (ILT), and the Substitute it Now (SIN) list of ChemSec, to determine the similarities and differences with the rankings of other groups (Section 4.3 and 4.4).
Chapter 5 contains a disclaimer which includes important considerations for the use of the methodology and interpretation of the results. The methodology is discussed in Chapter 6, and finally, the conclusions and recommendations are presented in Chapter 7.
2
Choice of the data source and retrieval of substance
information
In this chapter, an evaluation is made of available substance databases and one is selected as data source for the methodology. In section 2.2, the collection criteria and methods used to retrieve the substances from the database are described.
2.1 Selection of the data source
The starting point for the development of the methodology was to find a suitable data source with substances used in consumer products.
Existing data sources can be divided into lists of (hazardous) substances and databases.
Lists are usually compilations of substances of concern which have been selected due to their hazard properties. Some lists have been developed within legal frameworks, others by Non-Governmental Organisations (NGOs) inside and outside Europe (see Annex I). Some of these lists were compiled using prioritisation tools, others through contributions from experts.
Databases are generally collections of substances used in specific products, locations and/or quantities. Some have to be completed by manufacturers or importers when they bring substances on the market. Others have been compiled by researchers or governmental institutes (see Annex II).
Databases are generally preferable as data source, because they contain a wider array of substances, more information on the usage of the substance, and often have more search options.
To select a suitable database which can be used as input for the tool, existing databases were evaluated on the following aspects:
• Who is the initiator?
• What is the purpose of the database?
• Which criteria are used for the inclusion of substances? • How many substances are included?
• Is the database up-to-date?
• Is the database information reliable?
• Is there an option to search or sort substances on specific criteria?
• Is the database publicly accessible?
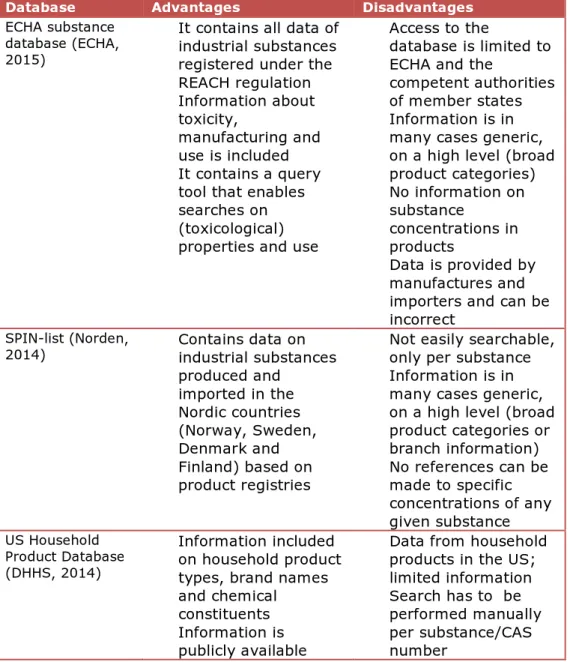
An overview of advantages and disadvantages of available databases was made based on these criteria, see Table 1.
Based on this overview, it was decided to use the substance database of the European Chemical Authority (ECHA) as the source for the new methodology. Under the REACH (Registration, Evaluation, and
Authorisation of Chemicals) legislation, all industrial chemicals produced or imported in Europe in quantities of ≥1 ton/year have to be registered in the ECHA database. In addition, information has to be provided on toxicological properties, manufacture, and use, although the information requirements are dependent on the production/import volume of the substance.
The ECHA registered substance database is available in IUCLID (International Uniform Chemical Information Database), which has a query tool that enables searches for substances on specific properties. The non-confidential substance information is also available via the ECHA website [1].
The most important disadvantage is that the complete database can only be accessed by the ECHA and competent authorities of the member states. It should also be mentioned that substances with volumes below 100 ton/year do not have to be registered until 31 May 2018.
Table 1: (Dis)advantages of databases
Database Advantages Disadvantages
ECHA substance database (ECHA, 2015)
• It contains all data of industrial substances registered under the REACH regulation • Information about toxicity, manufacturing and use is included • It contains a query
tool that enables searches on (toxicological) properties and use
• Access to the
database is limited to ECHA and the
competent authorities of member states • Information is in
many cases generic, on a high level (broad product categories) • No information on substance concentrations in products • Data is provided by manufactures and importers and can be incorrect
SPIN-list (Norden,
2014) • Contains data onindustrial substances
produced and imported in the Nordic countries (Norway, Sweden, Denmark and Finland) based on product registries
• Not easily searchable, only per substance • Information is in
many cases generic, on a high level (broad product categories or branch information) • No references can be made to specific concentrations of any given substance US Household Product Database (DHHS, 2014) • Information included on household product types, brand names and chemical
constituents • Information is
publicly available
• Data from household products in the US; limited information • Search has to be
performed manually per substance/CAS number
National Poison Information Centre (NVIC, 2015) • Contains detailed information about composition of products per product/brand and information about hazardous properties of substance • Compliance is not 100% • Information is confidential and not publicly accessible, only usable for
statistic investigations Dangerous Substances Database (Zweers P.G.P.C., de Groot G.M., & Bakker J., 2014) • Substances can be linked with User Categories (UC)
• Hazardous properties of substances are not included
• The database is not very user-friendly Consumer Product Chemical Profile study (Goldsmith database) (Goldsmith M. R. et al., 2014) • Particular substances in products (categories) can be identified
• Contains minimal and maximal
concentrations of individual substances in products
• It can be determined in how many products of a product category the substance is used
• Database is not automated, which makes it difficult to keep the database up-to-date
• Data comes from MSDSs, which are provided by manufacturers and can therefore be incorrect. • No hazard information
• Only data of products from Walmart (US)
2.2 Selection and retrieval of substances from the ECHA database
For this project, the selection of substances is based on the ECHA registered substance database which is accessed in IUCLID, as this database enables searches (‘queries’) for substances with specific properties or uses. To be able to rank the substances, information on both hazard and exposure was retrieved from the database. These parameters were also used to select substances of interest. Hazard
The substance selection used in this study was limited to substances classified as CMRSrespSderm (carcinogenic, mutagenic, reproduction toxic, and sensitising (skin/respiratory)). All CMR categories (1A, 1B, or 2) were included in the search. The registrant determines the classification in the database; this can be the harmonised classification or a self-classification. It is not possible to differentiate between harmonised and self-classifications in IUCLID, however, this can be done outside IUCLID by comparing the classification in IUCLID with the registry of
harmonised classifications (CLP, Annex IV). There is also a possibility that substances are missing, due to incomplete or incorrect IUCLID entries, and because substances produced in volumes <100 tonnes do not have to be registered in the ECHA database until June 2018. For an overview of the limitations of IUCLID, see section 5.1.
In addition, the Derived No-Effect Levels and Derived Minimal-Effect Levels (DN/MELs) are collected from the ECHA database. They are only used to rank the substances, not as a selection criterion. DN/MELs give an indication of the hazard potency of the substances. Only DN/MELs for general population/chronic/systemic effects were selected, as these are the most relevant for consumers, see also 3.2.1.2.
Use in products/article categories
Substances selected based on hazard classification can be divided in specific Product or Article Categories (PC/ACs) in which they are used, by selecting these PC/ACs in IUCLID (see Table 6 and Table 7). Only consumer PC/ACs were selected, worker PC/ACs were excluded. As with the selection on hazard properties, this has the disadvantage that relevant substances may be missed due to incomplete IUCLID entries, but has the advantage of deselection of a large number of substances that may be very hazardous, but never result in consumer exposure.
Summary substance selection Included
• Classification as CMRSrespSderm
• DN/MELs (for general population/chronic/systemic)
• Consumer PC/ACs Not included
• All other classifications (Acute tox, STOT RE e.g.)
• Hazards without classification (endocrine disruption)
• Occupational/environmental effects (Worker DNELs, OEL’s, PBT/vPvB properties)
• Worker/environmental exposure (Worker PCs, PROCs, ERCs)
3
Methodology for the prioritisation of chemical substances in
consumer products
In this chapter, the methodology for prioritisation is explained in a step-by-step approach. The substances were selected from the ECHA
database based on CMRSrespSderm properties and presence in consumer product/article categories (PC/AC), see section 2.2. Section 3.1
describes the scoring methodology, divided in hazard (3.1.1) and exposure (3.1.2). In section 3.2, the hazard and exposure scores are combined to gain the total scores for both substances and PC/ACs. At the end of the chapter, the methodology is summarised in Figure 2 and Figure 3.
3.1 Assigning scores to the input parameters
The prioritisation of substances is based on hazard and exposure, which are both determined by two parameters. The hazard consists of the hazard endpoint and the potency, exposure of the use in
products/articles, and exposure from these products/articles. 3.1.1 Hazard score
To enable ranking of the substances based on their hazardous
properties, a hazard score was determined. Two hazard indicators are generally available in the ECHA database: the hazard classification(s) and the derived no effect levels or derived minimal effect levels (DN/MELs). Thus, ranking of the hazard was based on 1) the hazard endpoint, which gives the type of effect the substance may provoke as indicated by its classification (CLP, EC1272/2008), and 2) the potency of a substance, indicated by the DN/MEL. Based on these two hazard indicators, scores were derived for each substance.
3.1.1.1 Hazard endpoint score
The following five hazardous properties were prioritised and used as selection criteria:
• carcinogenic (C) • mutagenic (M)
• toxic to reproduction (R) • respiratory sensitising (Sresp) • dermal sensitising (Sderm)
NOTE: By selecting on the basis of CMRSrespSderm characteristics,
substances with other effects, such as specific target organ toxicity after repeated exposure (STOT-RE, which includes neurotoxicity,
immunotoxicity e.g.) or endocrine disruption (when not already expressed as reprotoxic effect) were not included.
In the hazard endpoint score, the severity of the classified effect is taken into account by assigning a higher score to more severe hazard outcomes. The scores assigned to various classifications are listed in Table 2. Note that classification categories (e.g. carcinogenic 1A, 1B and 2) are not listed. This is because in most classifications, the division in
categories is based on the available evidence, rather than on the potency of the substance to cause the specific effect (except for sensitisers). When taking carcinogenicity as an example, in the ECHA database, substances are assigned to the three different carcinogenicity categories (1A, 1B, 2) based on the available underlying evidence that a substance causes cancer (in humans). If insufficient information is
available, a substance can only be put in one of two possible categories: carcinogenic or not carcinogenic. Therefore, until additional information shows with reasonable certainty that a category 1B or 2 carcinogen is actually not carcinogenic, this substance should be considered as being able to cause tumours in humans just like a category 1A carcinogen. Consequently, all categories should have the same effect score. This also applies to the mutagenic and reprotoxic categories.
It should be kept in mind that, while the division in categories is not directly linked to the potency, there is a large difference in the
regulation of CMR 1 and 2 substances. As this methodology focusses on hazard, this is not taken into account.
The explanation in the previous paragraph does not apply to subcategories of sensitisers, as these are based on potency. This subdivision was recently introduced, so in practice most substances are still classified in category 1. To avoid double counting potency (i.e. in the endpoint and potency score) the subcategories of sensitisers are also equally weighted.
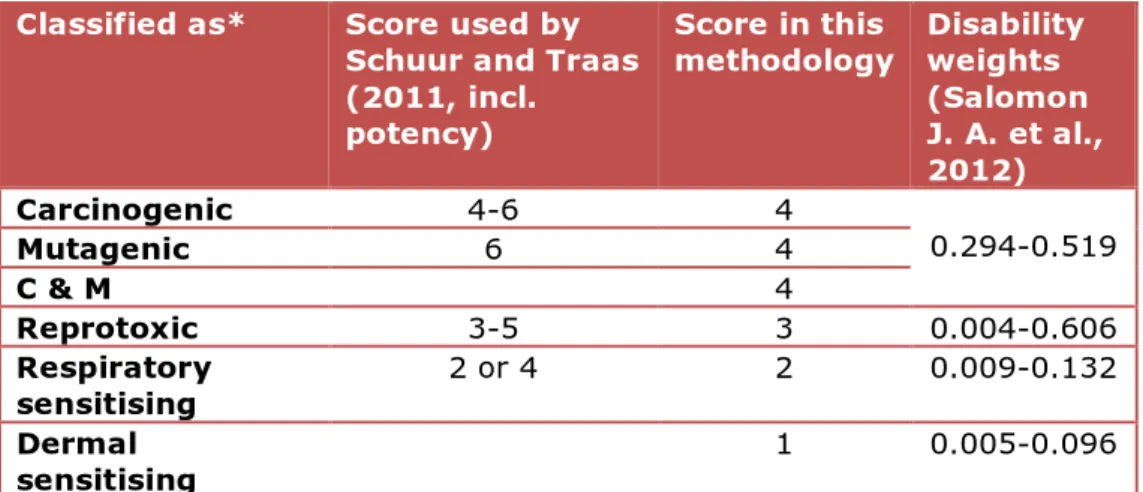
Table 2: Scores hazard endpoint, indicated by hazard classification
Classified as* Score used by Schuur and Traas (2011, incl. potency)
Score in this
methodology Disability weights (Salomon J. A. et al., 2012) Carcinogenic 4-6 4 0.294-0.519 Mutagenic 6 4 C & M 4 Reprotoxic 3-5 3 0.004-0.606 Respiratory sensitising 2 or 4 2 0.009-0.132 Dermal sensitising 1 0.005-0.096
The weight of the hazard endpoint scores is adapted from (Schuur A.G. & Traas T.P., 2011). For some classifications they report a range because the potency (i.e. value of the DN/MEL) is included in the score (Table 2, 2nd column). In the present methodology we propose scores based on classification only (Table 2, 3rd column). Where ranges are reported by Schuur & Traas, the lowest value is taken to avoid double counting the potency. Substances classified as C and/or M are given the same score because they might all result in the same clinical effect, namely cancer.
The effects caused by C and M, R, Sresp and Sderm classified substances are assumed to decrease in severity respectively. This is reflected by the corresponding scores. Sderm was not included in Schuur & Traas (2011), but as this effect is less severe than Sresp, Sderm received a score of 1.
The chosen order for the severity of the classifications is supported by disability weights (Dws) used to weigh the severity of different health effects against each other in the WHO global burden of disease analysis (Salomon J. A. et al., 2012). In the WHO analysis, cancer has a mean Dw ranging from 0.294 to 0.159. Disabilities considered as reproductive effects have Dws between 0.004 and 0.606. These include infertility, foetal alcohol syndrome, intellectual disability, hearing and vision loss, musculoskeletal problems, disfigurement, and motor and/or cognitive impairments. Allergic reactions are not listed by the WHO. However, asthma (Dw: 0.009-0.132) is considered as an equivalent effect of respiratory sensitisers and burns (<20%) and open wounds (Dw: 0.005-0.096) for effects of dermal sensitisers. The order of severity indicated by the Dws (Table 2, last column) confirms the order of the endpoint scores applied in the current report.
Substances causing only one type of effect, and thus having ‘only’ one classification, e.g. reprotoxic, are considered less hazardous when compared to substances with more types of effect, or classifications, e.g. reprotoxic and skin sensitising. Therefore, the scores of all
classifications of a substance are summed. The theoretical range of the hazard endpoint score for a selected substance has a minimum of 1 (Sderm only) and a maximum of 10 (CMRSrespSderm: 4+3+2+1).
3.1.1.2 Hazard potency score
The DN/MEL of a substance can be regarded as an indicator of its potency to cause an adverse effect. The ECHA database may contain information on DN/MELs at various levels:
• Acute and chronic
• Dermal, inhalation, and oral routes of exposure • General population and workers
• Systemic and local effects
For practical reasons, the choice was made to use one DN/MEL to set the potency score of a substance. A priori, there is no preference for the acute or chronic DN/MEL because the duration of exposure to articles and products is not defined and because both acute and chronic effects may occur. However, it is reasonable to assume that the chronic
DN/MELs of a substance are lower than the acute ones. Following a conservative approach focusing on the lowest, i.e. chronic DN/MELs, is considered reasonable.
There is no preference for DN/MELs of a particular route of exposure. Exposure via each of the routes is possible, depending on the articles and products involved. Again, following a conservative approach, focusing on the lowest DN/MEL of all routes is considered reasonable. To enable comparison and categorisation, inhalation DN/MELs are converted to mg/kg body weight/day, by multiplying with the daily (24 h) respiration volume (20 m3) of an average adult and dividing by the average human body weight (70 kg), as described by ECHA (ECHA, 2012).
The DN/MELs for the general population are used because they are relevant for consumer exposure.
Systemic DN/MELs are considered only because local DN/MELs cannot be converted to a standard unit that allows comparison with exposure.
To summarise, the DN/MELs considered are for chronic, systemic effects in the general population and the route of exposure that gives the lowest value in mg/kg bw/day.
It should be noted that this DN/MEL is independent of the classification. For example, a substance may be selected on its classification for reproductive toxicity, but have a DNEL for neurotoxicity. Unfortunately, it is not possible to automatically find the effect for which the DN/MELs were derived.
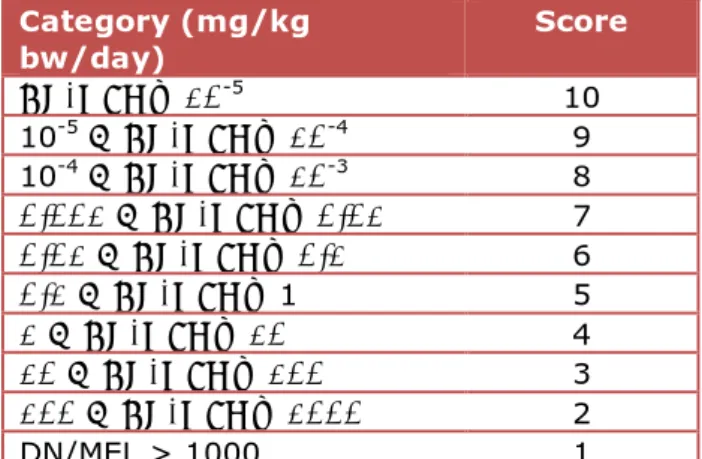
Similar to the classifications, the DN/MELs were converted to numerical scores, as indicated below (Table 3). Schuur and Traas (2011) used a DN/MEL range from <10-5 to >1 mg/kg bw/day, based on an expected DN/MEL range. Based on a preliminary analysis (Figure 1) of the DN/MELs available in the ECHA database, the potency categories were extended at the high DN/MEL end to enable a balanced (i.e. with equal group sizes) categorisation of less potent substances.
Table 3: Hazard potency scores
Category (mg/kg bw/day) Score DN/MEL ≤ 10-5 10 10-5 < DN/MEL ≤ 10-4 9 10-4 < DN/MEL ≤ 10-3 8 0.001 < DN/MEL ≤ 0.01 7 0.01 < DN/MEL ≤ 0.1 6 0.1 < DN/MEL ≤ 1 5 1 < DN/MEL ≤ 10 4 10 < DN/MEL ≤ 100 3 100 < DN/MEL ≤ 1000 2 DN/MEL > 1000 1
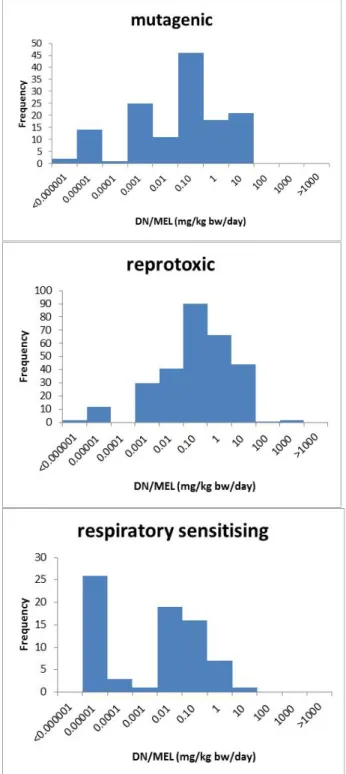
Not all substances in the ECHA database have a DN/MEL. For substances without a DN/MEL, a low (5th) non-parametric percentile of the available DN/MELs for a particular classification (see Figure 1) was used as a surrogate DN/MEL.
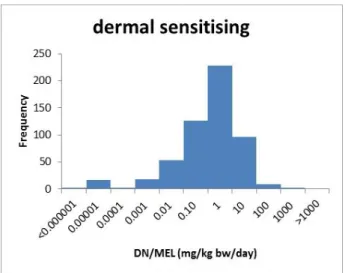
Figure 1: Histograms of the available DN/MELs (mg/kg bw/day; ECHA database, accessed March 2015) of substances classified as C, M, R, Sresp and Sderm. It should be noted that the presented DN/MELs are not necessarily based on the classified endpoints.
The 5th percentile is assumed to represent a reasonable worst-case DN/MEL for substances with a particular classification, but without a reported DN/MEL in the ECHA database. The percentiles are derived separately for substances with the classifications CMRSrespSderm
(Table 4). It should be noted that the DN/MEL of a specific substance may contribute to multiple classification-specific DN/MEL distributions when the substance has multiple classifications. For substances with multiple classifications, the potency score is based on the lowest corresponding surrogate DN/MEL.
In addition to the surrogate DN/MEL, another strategy was tested to fill in the gaps of missing DN/MELs, namely using the classification of specific thresholds of toxicological concern (TTC). However, this approach was abandoned because TTCs are not available for all classified hazards considered in this report. In addition, the TTC approach should not be used for a wide range of (categories of)
substances with particular structural alerts for high potency (e.g. (EFSA, 2012)), which makes routine assignment of TTCs to the large list of currently assessed substances not feasible.
Table 4: 5th percentiles of available DN/MELs
Classification Number of available DN/MELs 5th percentile of the available DN/MELs (mg/kg bw/day) Potency score according to Table 2 C 198 5.7 x 10⁻⁶ 10 M 138 5.7 x 10⁻⁶ 10 R 288 1.5 x 10⁻⁴ 8 Sresp 73 4.3 x 10⁻⁶ 10 Sderm 553 8.6 x 10⁻⁴ 8
3.1.1.3 Combining hazard endpoint and potency scores
We are not aware of any arguments stating that the score representing the type of effect should contribute more to the overall hazard score, compared to the score representing the potency of a substance, or vice versa. We chose comparable ranges for both scores (i.e. from 1 to 10), and obtained the overall hazard score by adding the type of effect score to the potency score. As a result, the hazard score has a range of 2-20. Subsequently, we combined the overall hazard score (of each
substance) with the exposure score (see Section 2.3).
Summary hazard score Included
• Effect score for C, M, R, Sderm, Sresp
• Potency, based on DN/MELs (for general population/chronic/systemic)
Not included
• All other classifications (Acute tox, STOT RE e.g.)
• No difference made on sub-categories of classifications (1A, 1B, 2)
• Hazards without classification (endocrine disruption)
• Occupational/environmental endpoints (Worker DNELs, OEL’s, PBT/vPvB properties)
3.1.2 Exposure score
As described for the hazard score, the exposure scores are also based on two components: the number of product and/or article categories (PC/ACs) in which a substance is used, and the relative exposure to the substance from the use of these products/articles.
3.1.2.2 Number of Product/article categories
Substances selected based on hazard classification can be divided in specific Product or Article Categories (PC/ACs)1 in which they are used by selecting these PC/ACs in IUCLID (see Table 6 and Table 7). In IUCLID it is possible to differentiate between user groups, namely workers and consumers. For this project, only the PC/ACs used by
consumers were selected. The total (exact) number of PC/ACs in which a substance is used is determined and used as a score for the relative use of the substance. This number ranged from 1-41 for the current
selection of substances.
1 Articles are objects for which the shape and size is more important than the chemical composition for their function (for example a chair, car, book)
Products are mixtures, of which the function is determined by the chemical composition (usually products are fluids, for example paint, glue, cleaning products).
3.1.2.2 Product exposure score
A product exposure score is determined for products or articles semi-quantitatively. These product exposure scores are derived using the ECETOC-TRA consumer exposure tool in a similar way to that described by Schuur and Traas (2011) and based on expert judgment to
interpolate from sub-PC to PC. This step is necessary because different sub-groups within PC/ACs, as used in ECETOC–TRA tool, cannot be found in IUCLID. The product exposure scores are determined either by multiplying three components: exposure estimation, exposure
frequency, and usage versus consumption (gebruik vs verbruik in Dutch), which are each given 1-3 points, as depicted in Table 5. Thus, the product exposure scores range from 1 to 27 (Table 6 and Table 7). Table 5: Components of the product exposure score
Parameter Low Medium High
Exposure estimation 1: <100
mg/kg bw/d 2: 100-1000 mg/kg bw/d 3: ≥1000 mg/kg bw/d
Usage/ consumption 1: usage 3:
consumption
Frequency of exposure 1: accidental/
infrequent 2: occasionally 3: continuous/ frequent The exposure estimation is based on the default values in the ECETOC-TRA tool and covers the combined exposure for all routes, calculated for a fictive substance with high vapour pressure. Implicitly, this gives relatively more weight to products for which the inhalation route of exposure is included, as the fraction released to air is set at 1. However, similar results are obtained when a low vapour pressure is assumed (results not shown).
The estimates from the ECETOC-TRA tool are event concentrations, rather than chronic concentrations, which would favour products with high quantities per event. As compensation, the usage/consumption and the frequency of exposure are taken into account. Usage/consumption reflects the difference between an article like a matrass, which releases less substance with every use (usage) and a product like paint, which is replenished with every use (consumption).
By including usage/consumption and use frequency, the scores of products with lower product amounts per event, but which are used up and are frequently used, are levelled. Cleaning products (PC35) are a good example. They have a moderate exposure estimation (score=2), but because they have a high exposure frequency and are consumed, they have a relatively high overall score.
Taking the exact outcome from the ECETOC-TRA tool was also considered, but discarded because it would provide a false sense of accuracy mismatching with the high level of abstraction of the
information obtained from IUCLID. The product exposure score should therefore be seen as a screening.
In Schuur and Traas (2011), the number of PC/ACs in which a substance is used and whether it is used in children’s products are also scored. In our methodology, the number of PC/ACs is used directly, as described in the previous section; the points given for use by children have been
omitted, as toys are only a sub-category and do not have their own PC/AC.
To move from the scoring system for subcategories from ECETOC–TRA tool to the main categories used in IUCLID, expert judgement was required. To derive the final scores, elements like ‘which products within a main category are used the most’, ‘average scores of subcategories’, and ‘similarities across PC codes’ were considered. The final product exposure score was determined by multiplying the three components. An expert elicitation was performed to see if other experts would derive similar scores. This did not result in any changes being made to the methodology; a more in-depth discussion is provided in the next section.
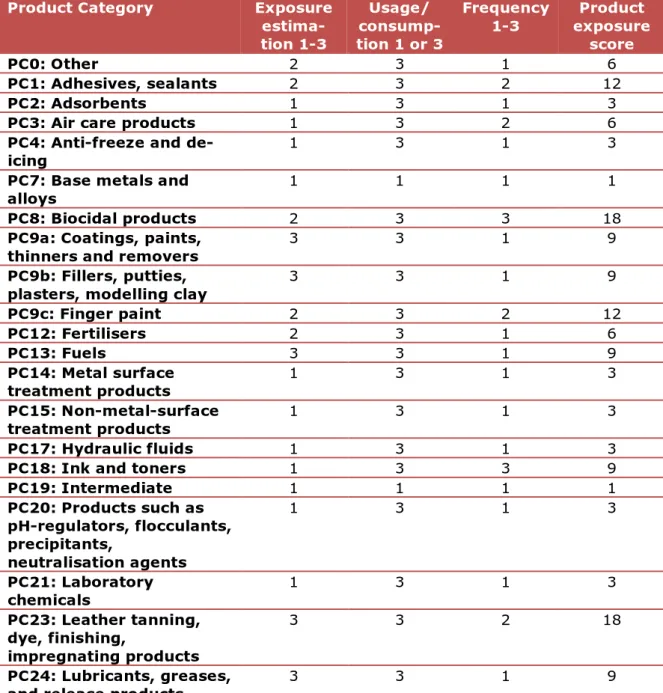
Table 6: Overview of the Product Categories and their exposure scores
Product Category Exposure
estima-tion 1-3 Usage/ consump-tion 1 or 3 Frequency 1-3 exposure Product score PC0: Other 2 3 1 6 PC1: Adhesives, sealants 2 3 2 12 PC2: Adsorbents 1 3 1 3
PC3: Air care products 1 3 2 6
PC4: Anti-freeze and
de-icing 1 3 1 3
PC7: Base metals and
alloys 1 1 1 1
PC8: Biocidal products 2 3 3 18
PC9a: Coatings, paints,
thinners and removers 3 3 1 9
PC9b: Fillers, putties,
plasters, modelling clay 3 3 1 9
PC9c: Finger paint 2 3 2 12 PC12: Fertilisers 2 3 1 6 PC13: Fuels 3 3 1 9 PC14: Metal surface treatment products 1 3 1 3 PC15: Non-metal-surface treatment products 1 3 1 3 PC17: Hydraulic fluids 1 3 1 3
PC18: Ink and toners 1 3 3 9
PC19: Intermediate 1 1 1 1 PC20: Products such as pH-regulators, flocculants, precipitants, neutralisation agents 1 3 1 3 PC21: Laboratory chemicals 1 3 1 3 PC23: Leather tanning, dye, finishing, impregnating products 3 3 2 18 PC24: Lubricants, greases,
Product Category Exposure estima-tion 1-3 Usage/ consump-tion 1 or 3 Frequency 1-3 exposure Product score PC25: Metal working fluids 1 3 1 3
PC26: Paper and board
dye, including bleaches 3 3 2 18
PC27: Plant Protection Products 1 3 1 3 PC28: Perfumes, fragrances 3 3 3 27 PC29: Pharmaceuticals 1 3 1 3 PC30: Photo-chemicals 1 3 1 3
PC31: Polishes and wax
blends 3 3 2 18 PC32: Polymer preparations and compounds 1 1 1 1 PC33: Semiconductors 1 1 1 1 PC34: Textile dyes, including bleaches 3 3 2 18 PC35: Washing and cleaning products
(including solvent based products) 2 3 3 18 PC36: Water softeners 1 3 1 3 PC37: Water treatment chemicals 1 3 1 3 PC38: Welding and soldering products, flux products
1 3 1 3
PC39: Cosmetics, personal
Table 7: Overview of the Article Categories and their exposure scores
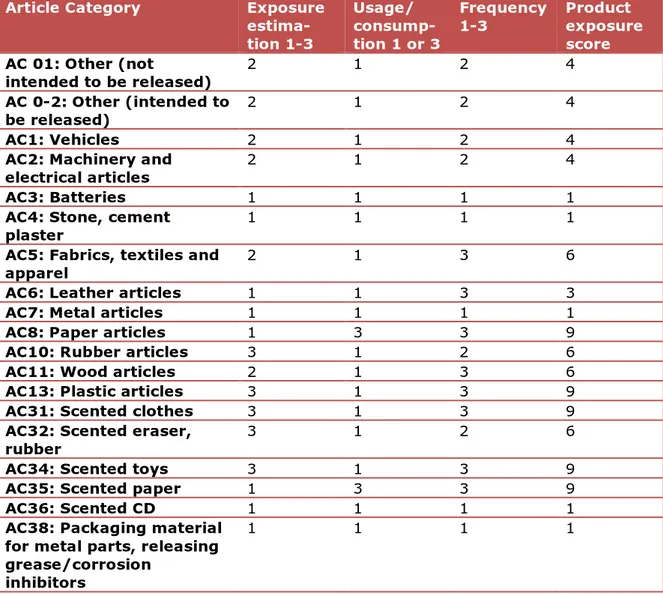
Article Category Exposure
estima-tion 1-3 Usage/ consump-tion 1 or 3 Frequency 1-3 Product exposure score AC 01: Other (not intended to be released) 2 1 2 4 AC 0-2: Other (intended to be released) 2 1 2 4 AC1: Vehicles 2 1 2 4
AC2: Machinery and
electrical articles 2 1 2 4
AC3: Batteries 1 1 1 1
AC4: Stone, cement
plaster 1 1 1 1
AC5: Fabrics, textiles and
apparel 2 1 3 6
AC6: Leather articles 1 1 3 3
AC7: Metal articles 1 1 1 1
AC8: Paper articles 1 3 3 9
AC10: Rubber articles 3 1 2 6
AC11: Wood articles 2 1 3 6
AC13: Plastic articles 3 1 3 9
AC31: Scented clothes 3 1 3 9
AC32: Scented eraser,
rubber 3 1 2 6
AC34: Scented toys 3 1 3 9
AC35: Scented paper 1 3 3 9
AC36: Scented CD 1 1 1 1
AC38: Packaging material for metal parts, releasing grease/corrosion
inhibitors
1 1 1 1
3.1.2.3 Expert elicitation PC and AC exposure scores
In the previous section, it was decided to take the product of the scores per PC/AC for the priority setting. Although Schuur & Traas (2011) provide clear guidance on how to apply the exposure scoring approach, a certain level of personal judgment is required to derive the scores of the potential exposure per category. In addition, Schuur & Traas’ proposal was setup at a level of subcategories. As the ECHA database only contains information at the level of the main PC/AC, the scoring was adapted to match the (lower) level of detail obtainable from the ECHA database. The quality of the scores derived by applying the approach and personal judgment was evaluated by comparison with scores assigned by experts who did not follow the exposure scoring approach.
By asking experts to elicit how they would scale the relative exposure to substances that may be present in a consumer product belonging to a PC or AC category, the scores can be put in broader perspective. Eight experts in the field of risk assessment were asked to score PCs and ACs from 1 to 9, where 9 indicated the highest exposure potential, and to
provide a rationale as to how they derived the given score. To avoid any bias, no information on possible consumer products or typical
substances was given to the experts.
The results of the expert elicitation show that the individual expert scores vary on many PCs and ACs. Large differences in scoring were noted, where for one PC the scores ranged from 1 to 9. As a
consequence, the score obtained by following the methodology often fell within the experts’ range. A comparison was also made between the experts’ average score per category and the methodology score. If the score differed by more than 6 points (to calculate the product exposure score scale, expert scores were multiplied by 3), the difference was considered to be large. This was the case in 23 of the 53 categories. Only four categories showed a small range and a small difference compared to the scores from the methodology, which in all four cases was within the range of the expert scores. The PCs involved were those not considered to have (much) consumer use (intermediates,
semiconductors, pH-regulators) and one for which direct contact is inevitable, i.e. cosmetics.
These observed differences between experts may be the result of the wide range of products within a category and that experts visualised different products or routes of exposure per PC or AC. It has proven to be difficult to assign a characteristic score for an entire PC or AC. This clearly shows the difficulties in assessing the potential exposure from any consumer product on such limited information. Furthermore, within one PC or AC, products can have entirely different uses and exposures. Also of note is the way the experts ranked the categories. Even though the specific scores may differ, the scores can show a high rank
correlation. The experts were individually compared with the scores from the methodology to obtain the rank correlations (Spearman’s rank
correlation scores), where correlations of -1, 1 and 0 indicate (perfect) negative, positive or no correlation, respectively. In this case, the results show one correlation (-0.04) between -0.10 and 0.10 indicating no correlation, one correlation (0.27) between 0.10 and 0.30 indicating low correlation, and six moderate correlations (0.45, 0.47, 0.49, 0.61, 0.62, 0.63) between 0.30 and 0.70. No high correlations, i.e. score higher than 0.70, or negative correlations were observed.
Overall, it can be concluded that the expert exposure scores relate moderately well to the scores based on the methodology and personal judgement. Due to the wide ranges of the individual scores, it is not justifiable to change the methodology or the scores for specific
categories. The elicitation exercise shows the complexity and diversity in screening for generic, i.e. substance independent, potential exposure from consumer products within the broad categories, without having knowledge of specific products. It underpins the uncertainty of the exposure scores for the specific Product and Article categories. 3.1.2.4 Combining Product/Article Categories and product exposure scores
The occurrence of a substance in PC/ACs and the corresponding product exposure scores can be combined in several ways.
In the chosen method, the highest product exposure score of a substance (1-27) is added to the total number of PC/ACs in which the substance is used (1-41). The resulting exposure thus scores the range from 2-68.
It is worth noting that, although the total number of PC/ACs is higher than the highest product exposure score, currently only nine of the 773 substances are used in more than 27 PC/ACs, while 159 substances have a highest product exposure score of 27. Thus, in general, the use in PC/ACs and the product exposure scores have approximately the same weight.
Summary exposure score Included
• Number of PC/ACs in which a substance is used
• A product exposure score as a measure for the exposure from the use of products/articles that contain the
substance Not included
• Tonnage
• Number of registrants
• Population size
• Function of the substance
• Physical chemical properties
3.2 Combining the hazard and exposure scores
The total scores for hazard and exposure were combined to rank both the selected substances and the PC/ACs (see the overviews in
Figure 2 and Figure 3). 3.2.1 Prioritisation of substances
All parameters discussed in section 3.1 were combined to gain a ranking of the substances, as depicted in Figure 2. As there was no reason to value either hazard or exposure higher, both scores were weighted similarly. Since the hazard scores of the current selection range from 2-18 and the exposure scores from 2-68, the hazard scores were
multiplied by 3.5 to place them in the same order of magnitude. Finally, both scores were added to reach the final score. In the text box below, zinc oxide is given as an example to illustrate how the total score was calculated.
In summary:
• Hazard score= hazard endpoint score + hazard potency score • Exposure score= number of PC/ACs + product exposure score • Total score = hazard score * 3,5 + exposure score
Example: Zinc Oxide Hazard score
• Endpoint score = 3 (R only)
• Potency score = 5 (DNEL 0.7 mg/kg/d)
• Hazard score = 3 + 5 = 8 Exposure score
• Number of PC/ACs = 23
• Highest Product exposure score = 27
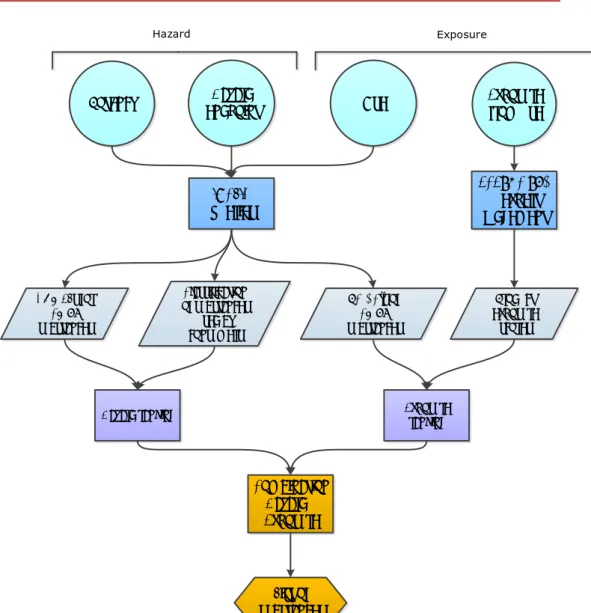
• Exposure score = 23 + 27 = 50 Total score • 8 x 3.5 + 50 = 78 PC/AC’s of CMRS substances IUCLID queries ECETOC TRA + expert judgement Product exposure scores Combination Hazard + Exposure List of substances Hazard
endpoint Use Exposure from use
Hazard Exposure Potency Classification of substances used by consumers DNMELs for CMRS substances
Hazard ranking Exposure ranking
Figure 2: Overview of the prioritisation of the substances. The input parameters are DN/MELs, classification, Product/Article Categories (PC/ACs) and product exposure scores. The parameters are combined resulting in a scored list of substances.
3.2.2 Prioritisation of PC/ACs
The ranking of the PC/ACs is based on the number of substances in each PC/AC, their hazard endpoint scores, and the product exposure score of that PC/AC (see Figure 3). Unfortunately, it is currently not feasible to also link the potency scores to the PC/ACs.
Similar to the ranking of the substances, hazard and exposure scores were given equal weight. The hazard score was derived by taking the sum of all hazard endpoint scores for all substances in a PC/AC. The exposure score was derived by multiplying the number of substances with the product exposure score belonging to the specific PC or AC, It was decided to multiply the hazard score by 2 to give hazard and exposure equal weight. Exposure and hazard scores are added together to calculate the total score. In the text box below, PC12: Fertilisers is given as an example to illustrate the calculation of the total score. In summary:
• Hazard score = sum hazard endpoint scores
• Exposure score = product exposure score x number of substances • Total score = hazard score * 2 + exposure score
Example: PC12: Fertilisers Hazard score
• Sum endpoint scores = C (46x4) + M (1 x 4) + R (54 x 3) + Sresp (0 x 2) + Sderm (26 x 1) = 378
Exposure score
• Number of substances = 128
• Product exposure score = 6
• Exposure score = 128 x 6 = 768 Total score
CMRS substances in a PC/AC IUCLID queries ECETOC TRA + expert judgement Product exposure scores Combination Hazard + Exposure List of PC/ AC’s Hazard
endpoint Use Exposure from use
Hazard Exposure
Classification of substances In a
PC/AC
Hazard ranking Exposure ranking
Figure 3: Overview of the prioritisation of the PC/ACs. The input parameters are classification, number of substances and product exposure scores. The
4
Results
The Excel tables with the substances and PC/ACs can be found in Annex A and confidential Annex B. Both files are essentially the same, except that the names, CAS-, and EC-numbers of substances with individual submissions have been replaced with a random number in Annex A. This is necessary to comply with the confidentiality requirements. A more thorough explanation of confidentiality issues is given in Chapter 5. The IUCLID queries were performed from June 2014 until March 2015 in the following order: Dermal sensitisers (June 2014) - Carcinogens (August 2014) - Mutagens (October 2014) – Reproductive toxicants (February 2015) - Respiratory sensitisers (March 2015).
The substances and the PC/ACs were scored as described in the
previous chapter. The rankings resulting from these scores are described in the first two sections of this chapter. In the second part of the
chapter, the results of this methodology are compared with the
prioritisation for the ILT (Inspectorate Environment and Transport) and the SIN (Substitute It Now) list.
4.1 Results presented for substances
THE RESULTS ARE PRESENTED IN THE EXCEL FILES IN ANNEX A
www.rivm.nl/bibliotheek/rapporten/2015-0194.xlsx
The list with all the selected substances and their respective scores for the different parameters is given on the tab ‘Substances’. The different parameters are in the coloured columns, and by using the filter options it is possible to sort the list or select a specific group of compounds, depending on the question of interest. A few examples:
• To select reproductive toxicants sorted on their use in PC/ACs: select substances with ‘Repro’ = 3 (column O), ‘Sum PCs and ACs’ = sort largest to smallest (column G)
• To select only carcinogens with DMELs, sorted from lowest to highest DMEL: select substances with ‘Carc.’ = 4 (column M), ‘DNEL/DMEL’ = DMEL (T), ‘DN/MEL converted to oral’ = sort smallest to largest (S)
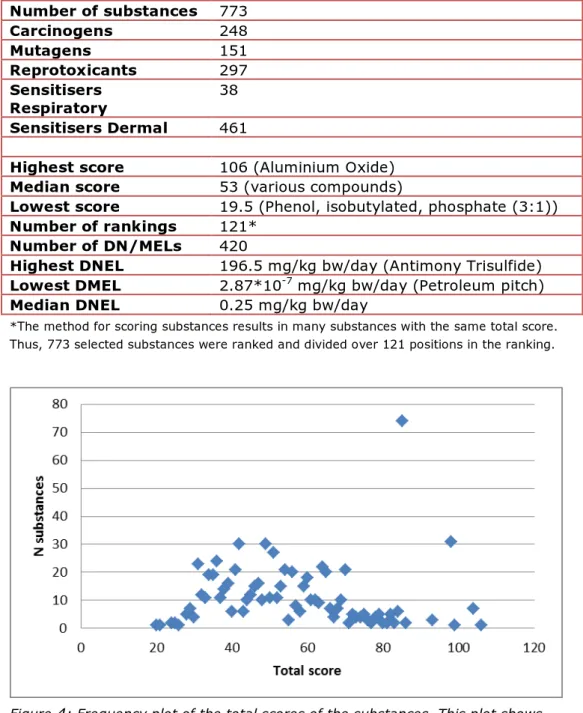
• To select only substances with a DN/MEL, sorted on the total hazard score: unselect blanks in ‘DN/MEL converted to oral’ (column S), ‘Total hazard score’ = sort largest to smallest (F) Table 8 summarises a few highlights from the results. Figure 4 shows a frequency plot of the total scores of the substances. As can be seen in the Excel table and in Figure 4, there are groups of substances that have the same scores, and thus essentially have the same ranking. These rankings can be found in the Annexes in column L, and range from 1 to 121.
Table 8: Highlights results substances Number of substances 773 Carcinogens 248 Mutagens 151 Reprotoxicants 297 Sensitisers Respiratory 38 Sensitisers Dermal 461
Highest score 106 (Aluminium Oxide)
Median score 53 (various compounds)
Lowest score 19.5 (Phenol, isobutylated, phosphate (3:1))
Number of rankings 121*
Number of DN/MELs 420
Highest DNEL 196.5 mg/kg bw/day (Antimony Trisulfide)
Lowest DMEL 2.87*10-7 mg/kg bw/day (Petroleum pitch)
Median DNEL 0.25 mg/kg bw/day
*The method for scoring substances results in many substances with the same total score. Thus, 773 selected substances were ranked and divided over 121 positions in the ranking.
Figure 4: Frequency plot of the total scores of the substances. This plot shows the number of substances (y-axis) for every total score (x-axis)
The substance with the highest score is Aluminium Oxide which is used in a large number of PC/ACs (30), including cosmetics, and has been selected for carcinogenicity. It should be noted that Aluminium Oxide is not carcinogenic itself, but is probably classified based on the presence of an impurity. Unfortunately, it is currently not possible to make this distinction in the IUCLID search.
As can be seen in Figure 4, the number of substances with the same score varies widely. At rank 2, 4, and 8 (scores of 103.5, 97.5, and 84.5 points) are three groups of substances that are exceptionally large. With the exception of a few fragrances in the 84.5 group, these substances are all petroleum and gas derivatives, including petrolatum, slack wax,