TRENDS IN
GLOBAL CO
2
EMISSIONS
2015 Report
Trends in global CO
2
emissions:
2015 Report
Background Study
This publication can be downloaded from: www.pbl.nl/en and edgar.jrc.ec.europa.eu.
Parts of this publication may be reproduced, providing the source is stated, in the form: Olivier JGJ et al. (2015), Trends in global CO2 emissions; 2015 Report, The Hague: PBL Netherlands Environmental Assessment Agency; Ispra: European Commission,
Joint Research Centre.
This CO2 report 2015 is one in a series of annual publications by PBL Netherlands Environmental Assessment Agency and the
European Commission’s Joint Research Centre (JRC). After publishing web reviews in 2007 and 2008, the CO2 report series started in
2009, providing up-to-date knowledge on the trend of global CO2 emissions from fossil fuels and cement. CO2 emission estimates
have been made by PBL and the JRC on the basis of energy consumption data for the period 1970-2012 published by the International Energy Agency (IEA), and for the period 2013-2014 published by British Petroleum, except for coal consumption in China over the 2012–2013 period, for which data published by the National Bureau of Statistics of China were used. The estimations are also based on production data for cement, lime, ammonia and steel, as well as on emissions per country, from 1970 to 2012, from the Emissions Database for Global Atmospheric Research (EDGAR) version 4.3, which was developed jointly by the JRC and PBL. The greenhouse gas emissions of from the EDGAR 4.2 FT2012 dataset have also been used for the global emissions overviews in the annual UNEP Emissions GAP Report. All reports are available from http://edgar.jrc.ec.europa.eu/whats_new.php?p=3 and http://www.pbl.nl/en/ publications/trends-in-global-co2-emissions-2015-report.
PBL Netherlands Environmental Assessment Agency is the national institute for strategic policy analyses in the fields of the environment, nature and spatial planning. It contributes to improving the quality of political and administrative decision-making, by conducting outlook studies, analyses and evaluations in which an integrated approach is considered paramount. Policy relevance is the prime concern in all our studies. PBL conducts solicited and unsolicited research that is both independent and always scientifically sound.
As the Commission’s in-house science service, the Joint Research Centre’s mission is to provide EU policies with independent, evidence-based scientific and technical support throughout the whole policy cycle. Its work has a direct impact on the lives of citizens, as its research outcomes contribute to a healthy and safe environment, secure energy supplies, sustainable mobility and consumer health and safety. Working in close cooperation with policy Directorates-General, the JRC addresses key societal challenges while stimulating innovation through developing new methods, tools and standards, and sharing its know-how with the Member States, the scientific community and international partners.
Trends in global CO2 emissions: 2015 Report © PBL Netherlands Environmental Assessment Agency The Hague, 2015
PBL publication number: 1803 JRC Technical Note number: JRC98184 Corresponding author
jos.olivier@pbl.nl Authors
Jos G.J. Olivier (PBL), Greet Janssens-Maenhout (IES-JRC), Marilena Muntean (IES-JRC), Jeroen A.H.W. Peters (PBL) Responsibility
PBL Netherlands Environmental Assessment Agency Institute for Environment and Sustainability (IES) of the European Commission’s Joint Research Centre (JRC) Acknowledgements
This report was drafted with input from many colleagues, gathered over several years. The authors would like to
thank W.T. van Ierland (DG CLIMA), P. Boot (PBL), P. Ciais (LSCE/IPSL), M.E. den Elzen (PBL), B. Koffi (JRC), M. Roelfsema (PBL), K. Blok (TU Delft/Ecofys), A. Jones (EIA) and M.P.M. Hartman (PBL) for their critical review and suggestions and G. Mulhern (JRC) for proofreading and editorial review. We thank the IEA, USGS, WSA and IFA for providing recent statistics.
Editing PBL and JRC Graphics
PBL Beeldredactie
Production coordination and English-language editing PBL Publishers
Layout
Contents
Summary and main findings 4
1 Introduction 6
1.1 Methodology and data sources used 7
2 Results 10
2.1 Increase in global CO2 emission growth almost stalled 10
2.2 Different trends in the six largest emitting countries/regions 16 2.3 Comparison of emissions in the various countries 27
2.4 CO2 emissions from oil and gas production 36
2.5 CO2 from cement and steel production (non-combustion) 38
2.6 Data quality and uncertainties 40
3 How to mitigate CO2 emissions from energy supply and consumption 44
3.1 Introduction 44
3.2 Trends in global fossil-fuel consumption and fuel mix 45 3.3 Trends in renewable energy sources 47
3.4 Trends in nuclear energy 51
4 Future perspectives 54
Annex 1: Methodology, data sources, comparisons 56 List of abbreviations and definitions 68
Summary and main findings
Growth in global CO
2emissions
almost stalled in 2014
After a decade of annual increases of 4%, on average, and two years (2012 and 2013) of slowing down to about 1%, the growth in global CO2 emissions almost stalled,
increasing by only 0.5% in 2014 compared to the record level in 2013. In that year, emissions from fossil-fuel combustion and from industrial processes (production of cement clinker, metals and chemicals) totalled to 35.7 billion tonnes CO2. At the same time, the world’s
economy grew by 3%, showing a partial decoupling between the growth in global CO2 emissions and that
in the economy.
Primary energy consumption
decreased
Global CO2 emissions mainly reflect the world’s fossil
energy consumption. In 2014, per capita primary energy consumption decreased compared to the previous year, for the first time since 1998 (excluding the recession year of 2009). The mild winter considerably helped to limit fossil-fuel demand for space heating, particularly in Europe. 2014 was the warmest year globally since records began in 1880, even in the absence of El Niño conditions, which would have caused even higher temperatures. This decrease in per capita primary energy consumption was not reflected in a decrease in power generation, but in a modest increase in power generation of only 350 TWh or 1.5%, which is the smallest increase since 2001 (except for the recession year 2009). Two-thirds of the global increase in power generation was supplied by renewable energy. Shifts towards low-carbon fuels have been observed in different world regions. Since 2004, when wind and solar power had a share of 0.5% in global power generation, the share doubled every four years, up to almost 4% in 2014. Although in the same period hydropower increased globally by almost 40% since 2004, its share remained the same at about 16%. The share of nuclear power decreased in this period by 5%, from about 16% to 11%. In East Asia (notably China and Japan), the phasing in of nuclear energy will also further help to reduce CO2 emissions.
China, United States, EU-28 and India
account for 61% of all emissions
The top 4 emitting countries/regions, which together account for almost two thirds (61%) of the total global CO2emissions are China (30%), the United States (15%), the European Union (EU-28) (10%) and India (6.5%). China saw no growth in coal demand in 2014 and increased its CO2
emissions by only 0.9% compared to 2013, which is the lowest annual increase over the last decade. The United States increased its CO2 emissions by only 0.9%, which is
lower than in the previous two years. This was mainly the result of a small drop in coal-fired power generation and an increased use of natural gas for space heating due to a colder winter than in 2013. The pace of the continued reduction in emissions in the EU-28 was increased in 2014 to 5.4%, mainly because of the decrease in fossil-fuel consumption for power generation and manufacturing, but also because of the 10% lower demand for space heating. Other non-OECD-1990 countries and Russia showed smaller decreases: Japan decreased by 2.6%, Australia by 2.1% and Russia by 1.5%. In contrast, CO2
emissions in most other non-OECD-1990 countries increased (e.g. by 7.8% in India, by 3.3% in Brazil and by 3.2% in Indonesia). Most of the increase in emissions since the late 1990s has occurred in non-OECD 1990 nations, which contributed to 61% of the global emissions in 2014, compared to 32% in 1990, the baseline year of the Kyoto Protocol. China, which accounted for almost half of the 61% share, has recently put a considerable effort in revising its energy statistics for the period 2000 to 2013. This has definitely resulted in better estimates of the real fossil-fuel consumption in this period, even though uncertainty levels may not have decreased by much. Comparisons of different bottom-up inventories for China have backed our uncertainty range of 10%.
Revision of China’s coal statistics
The major revision of China’s coal statistics for the 2000–2013 period, which was published in May 2015, showed coal consumption to be 7% to 13% higher than previously reported for the 2005–2012 period. This resulted in total national CO2 emissions fromhigher for that period compared to emissions based on International Energy Agency (IEA) statistics released in 2014, and global CO2 emissions increased accordingly by
a few per cent. These new figures have been used in this report, which shows accumulated CO2 emissions for China
to be 5 gigatonnes greater than our estimates published last year. In terms of accumulative global emissions, this historical revision means a shift of two months before the ‘carbon budget’ for the period to 2050 is reached that is considered safe for meeting the 2 oC target. For the most
accurate estimate of China’s CO2 emissions from
fossil-fuel combustion for 2011 to 2013 and recent updates for other countries up to and including 2013, we refer to the IEA’s 2015 edition of ‘CO2 emissions from fossil fuel
combustion’.
China largest emitter, but United
States tops per capita emissions
The new data show China’s CO2 emissions currently tobe twice as high of those in the United States, exactly 10 years after its emissions equalled those of the United States. China’s high ranking is mainly caused by the sheer size of its population and economy and the fact that its energy mix is strongly reliant on coal. China’s per capita emissions are similar to those of the European Union, while per capita emissions in the United States are twice as high as those of both China and the European Union. However, there are many indications that the growth in China’s emissions is also stalling: the share of Gross Domestic Product (GDP) of its growing service sector has surpassed that of the much more energy-intense industrial sector’s share and preliminary 2015 statistics of key indicators (such as the production of electricity, steel and cement) show all zero or negative growth rates. This report also assesses and largely dismisses conclusions in a recent paper on China’s CO2 emissions, which claimed
that international inventories such as EDGAR are far too high.
Structural changes in global CO
2emission trends still uncertain
The slowdown of the growth in China’s CO2 emissionssince 2012 reflects structural changes in China’s economy towards a less energy-intensive service sector and high value-added manufacturing industry that is more focussed on domestic consumption, with more energy efficiency and towards a low-carbon energy mix. On a global scale, the slowdown that has also lasted three years now, to a large extent, can be explained by the
changes in China’s economy and the associated energy consumption. However, it is uncertain whether these changes also reflect structural changes in the wider global economy, global energy efficiency improvements and in the energy mix of other key world players such the United States, European Union, India and Russia. What we do know is that it is very likely that the very high global annual emission growth rates of, on average, 3% per year observed in the years 2003 to 2011 are definitely over for many years to come (even 4% per year when excluding the global recession years 2008 and 2009), whereas the average global growth rate over the 1980–2002 period was 1.2% per year.
PBL and JRC co-production
The preliminary CO2 emission estimates in this report
have been made by PBL Netherlands Environmental Assessment Agency and the European Commission’s Joint Research Centre (EC-JRC), on the basis of fossil-fuel consumption data from the International Energy Agency (IEA) for the 1970–2012 period and revised coal consumption data for the 2000–2012 period, very recently published by the National Bureau of Statistics of China. The fossil-fuel estimates for 2013 and 2014 were based on trends in consumption data published by energy company BP. The estimates are also based on gas flaring and production data for cement, lime, ammonia and steel. The emissions per country from 1970 to 2012 are part of the Emission Database for Global Atmospheric
Research (EDGAR) version 4.3, which is a project run by the
EC-JRC with support of PBL.
Supplementary information
Supplementary information of key tables and figures in this publication can be downloaded from the PBL website: http://www.pbl.nl/en/publications/trends-in-global-co2-emissions-2015-report.
The CO2 emissions over the 1990–2014 time series, for
all countries, can be downloaded from the EDGAR website: http://edgar.jrc.ec.europa.eu/overview. php?v=CO2ts1990-2014.
For a concise summary of this report see the infographic on global CO2 emission trends at: http://infographics.pbl.
ONE
Introduction
ONE
This report presents the results of a trend assessment of global CO2 emissions from fossil fuel and cement up to
2014, and updates last year’s assessment (Olivier et al., 2014). This assessment focuses on the changes in annual CO2 emissions from 2013 to 2014, and includes not only
fossil-fuel combustion on which the BP (2015) reports are based, but also incorporates other relevant CO2 emissions
sources, including flaring of waste gas during gas and oil production, cement clinker production and other limestone uses, feedstock and other non-energy uses of fuels, and several other small sources. The report clarifies the CO2 emission sources covered, and describes the
methodology and data sources. For the years 2013 and 2014, more details are provided in Annex A1.1.
This assessment excludes CO2 emissions from
deforestation and logging, forest and peat fires, from the post-burn decay of remaining above-ground biomass, and from decomposition of organic carbon in drained peat soils. The latter mostly affects tropical non-OECD countries. These sources could add from 10% to 20% of CO2 to global emissions, according to different authors
(Van der Werf et al., 2009; Harris et al., 2012). However, these percentages are highly uncertain and show a large annual variability. Such variability is also one of the reasons why emissions and sinks from land use, land-use change and the forestry (LULUCF) sector are kept separate when reporting under the UN Framework Convention on Climate Change (UNFCCC) and the Kyoto Protocol. This explains also that the emissions from the LULUCF sector are not included in this assessment. Information on recent emissions from forest and peat fires and post-burn emissions is being assessed by the
Global Carbon Project (GCP), which has publishes
compre-hensive assessments of the global carbon budget, including all CO2 sources and sinks (GCP, 2014; Le Quéré
et al., 2014).
Chapter 2 presents a summary of recent CO2 emission
trends, per main country or region, including a comparison between emissions per capita and per unit of Gross Domestic Product (GDP), and of the underlying
trend in fossil-fuel production and use, non-fossil energy and other CO2 sources. This chapter also summarises the
main conclusions on trends, mitigation achievements and prospects, and the main conclusions of the Fifth
Assessment Report (AR5) of Working Group III (WG III) of the
Intergovernmental Panel on Climate Change (IPCC) (IPCC,
2014a) regarding global greenhouse gas emissions (Section 2.1). Section 2.2.1 presents our assessment of a recent paper on CO2 emissions in China of Liu et al. (2015)
that suggested that several other inventories substan-tially overestimate China’s CO2 emissions from fossil fuel
and cement production. In this section we also present our latest estimate of China’s CO2 emissions, including the
impact of the substantial revision of China’s coal balances from 2000 onwards, of which annual totals were
published in May 2015. The data quality and uncertainty estimates of countries and global emission estimates are discussed in Section 2.6, including a comparison of Emissions Database for Global Atmo spheric Research (EDGAR) data with official reports of national emissions. Chapter 3 focuses on the energy trends and shifts in the energy mix, with a special focus on fossil fuels, renewable energy and nuclear energy. In addition, the extent to which structural changes have caused the observed slowdown in the increase in global CO2 emissions is
discussed. For more information on energy efficiency improvements and carbon capture and storage (CCS) activities, please see the 2013 edition of the Global CO2
emissions report (Olivier et al., 2013).
Chapter 4 presents the context of the present report. The relationship between CO2 emissions and total greenhouse
gas emissions and pledges made by countries for 2020 under the Copenhagen and Cancun Agreements and the mitigation commitments of national governments for 2025 or 2030 ‘INDCs’, which are discussed at the 21st Conference of the Parties of the UNFCCC in Paris this year. This chapter also discusses other government authorities, such as municipalities, and groups within society which are equally important for realising national and collective global commitments to mitigate greenhouse gases.
ONE ONE
National CO2 emissions are accounted for in accordance
with the official Intergovernmental Panel on Climate Change (IPCC) reporting guidelines, which are approved and used by countries to report their national greenhouse gas emissions to the UNFCCC and Kyoto Protocol, and are based on domestic activities that generate greenhouse gas emissions (‘actual’ national emissions) (IPCC, 2006). However, due to the use of other data sources and emission factors, the data reported here will differ somewhat from the emissions officially reported by individual countries to the UNFCCC. Nevertheless, data are generally consistent within the related uncertainty estimated for both datasets (see Section 2.6). A detailed comparison of the EDGAR emissions data used in the Fifth Assessment Report of Working Group III of the IPCC (IPCC, 2014a) and those of the Carbon Dioxide Information
Analysis Centre (CDIAC) used in the Global Carbon Project
(GCP, 2014) is provided in Annex A1.5.
1.1 Methodology and data
sources used
This report assesses the trend in global CO2 emissions
with a focus on the contribution of fossil fuel use. For a comprehensive assessment of the trends in all greenhouse gas emissions up to 2010, including CO2 from
forest fires and other land-use change and the non-CO2
greenhouse gases such as methane and nitrous oxide, which contribute about one quarter to the global total CO2 eq. greenhouse gas emissions, we refer to the Fifth
Assessment report of Working Group III ‘Mitigating of Climate Change’ of the IPCC (2014a) and the Emissions Gap Reports of UNEP (2014, 2015b), for which data from EDGAR 4.2 and EDGAR 4.2FT2010, respectively, were provided.
For global CO2 emissions from 1970 to 2012, we use the
EDGAR 4.3 dataset (EC-JRC/PBL, 2015) for greenhouse gases, which results from a project of the European Commission’s Joint Research Centre (JRC) with assistance from the PBL Netherlands Environmental Assessment Agency (forthcoming in 2015), because it covers all countries with a detailed sectoral breakdown and consistent time series. This dataset provides greenhouse gas emissions per country and on a 0.1 x 0.1 degree grid for all anthropogenic sources identified by the IPCC (2006) (EC-JRC/PBL, 2015) for the 1970–2012 period. The CO2 emissions from fuel combustion in EDGAR are based
in the International Energy Agency (IEA) energy statistics for fossil fuel consumption released in 2014 (IEA, 2014a). However, for China we included the impact on coal emissions of the major revision of coal consumption statistics released by the Chinese National Bureau of
Statistics in May 2015 (NBS, 2015b). For the most accurate estimate of the CO2 emissions from fuel combustion of
China, including this revision, and of other countries due to updated fuel statistics that include 2013, we refer to the 2015 edition of the IEA report ‘CO2 emissions from
fuel combustion’, which uses the same IPCC methodology and identical IPCC default CO2 emission factors as used in
the EDGAR 4.3 dataset (IEA, 2015b). In particular Part III of this IEA report on total greenhouse gas emissions describes the greenhouse gas emissions data of EDGAR 4.3 FT2010, documented with references to data sources and methodologies (Olivier and Maenhout, 2015). EDGAR 4.3 includes CO2 emission factors for cement
production per tonne of cement produced, taking into account the decreasing share of clinker in cement. This is a significant improvement on most other global CO2
inventories (such as CDIAC and GCP), in particular those of countries such as China where the clinker fraction continues to decline, also in recent years. These shares have been updated from 1990 onwards and extended from 2008 to 2012 with country-specific data for all countries reporting annually their emissions inventories to the UNFCCC (mostly OECD1990 countries, Eastern European countries and Russia) and six other large countries, whereas regional estimates were used for the remaining countries. In addition to cement production, EDGAR 4.3 also includes other non-combustion industrial processes, such as the production of lime and soda ash (IPCC category code 2A) and carbon used in metal production (IPCC category code 2C). All sources of CO2
related to non-energy/feedstock uses of fossil fuels were estimated using the Tier 1 methods and data recommen-ded by the 2006 IPCC guidelines for national greenhouse gas inventories (IPCC, 2006). Collectively, the other carbonate sources added about 30% to CO2 emissions
from global cement production in 2010, which are not estimated in most other CO2 datasets (see Table A1.3 in
Annex A1.5).
The core EDGAR 4.3 dataset on CO2 emissions was
extended to 2014 using a fast-track approach. ). For each country, the trend from 2012 onwards has been estimated with the trend in the appropriate activity data or with the approximating trend using related statistics as the estimator. The 2012 CO2 emissions have been aggregated
into five main source sectors (with corresponding IPCC category codes in brackets):
(1) fossil-fuel combustion (1A), including international ‘bunkers’, (marine and aviation),
(2) fugitive emissions from fuels (1B),
(3) cement production and other carbonate uses (2A), (4) feedstock and other non-energy uses of fossil fuels
(2B+2C+2G+3+4D4),
ONE
Box 1.1 Why do CO
2emissions in this report differ from other data sets?
There are two main reasons why our CO2 emissions from fossil-fuel combustion and industrial processes differ
from those reported by countries or from other international data sets, although differences are generally well within the uncertainty estimates (see Section 2.6). Emissions are generally calculated using statistics on activities (e.g. TJ of coal consumption) and so-called emission factors (e.g. kg CO2/TJ coking coal combusted).
Sometimes, physical activities in statistics are converted to another unit for the application of preferred emission factors, for example from tonnes of coal to energy units (terajoules) for which conversion factors are established, such as TJ energy content per tonne of anthracite or per cubic metre of natural gas.
Even when different emission data sets were compiled using the same method and level of detail (e.g. of fuel types considered) for the calculation, differences will occur for the follow main reasons:
– The statistics used may differ somewhat due to different data sources, different release dates and different sources for the conversion factors used. Each of them may have different revisions included. For example, we incorporated the very recent major revision of China’s coal statistics in our data set.
– Countries will generally use country-specific emission factors for key sources, whereas international data sets generally use default factors, such as those recommended by the IPCC. Also, countries may use default values when representative country-specific data are missing or for small sources. The IPCC guidelines recommend for fuels to use emission factors expressed per unit of energy since these have less uncertainty than factors related to physical units (such as tonnes and m3). In cases where the fraction of fuel carbon that
is not oxidised during combustion is not very small, where representative country-specific values based on measurements are available, these should be used, according to the IPCC guidelines (IPCC, 2006).
– The definitions used for specific emission sources may differ between CO2 emission data sets. For fossil-fuel
combustion, for example, CO2 emissions related to coal and coke inputs in blast furnaces and coke ovens and
carbon losses in these processes may be partly or fully reported under industrial processes or fugitive sources or under fuel combustion.
– The level of detail of the methodology used can be different; detailed fossil-fuel types or only aggregated ones (e.g. coal, oil products and natural gas), corrections made for non-energy uses of fuels (e.g. natural gas for ammonia production), and fuels used for international transport.
– Another example is that of CO2 emissions from the use of oil and gas for non-energy use, for example as
chemical feedstock, which may be calculated with different methods and may be included under fossil-fuel combustion instead of under industrial processes. For example, BP does not make this distinction and includes these feedstock uses implicitly in their CO2 emissions. Also EIA includes these emissions in
fossil-fuel CO2 emissions.
– Some international data sets, notably those of EIA and BP, do not separate the use of so-called ‘bunker’ oil for international shipping and international aviation from a country’s oil consumption and report those emissions as part of total national emissions.
– CO2 emissions from fossil-fuel combustion for 2013 and 2014 in this report are calculated by extrapolation
from the EDGAR 4.3, fossil-fuel CO2 emissions per country for 2012 (based on detailed IEA fuel data for
combustion purposes), using the 2012 to 2014 trends in total coal, oil and gas consumption in energy units as reported by BP. These combined with the total CO2 emissions per country in 2012 by main fuel type. Some
countries have relatively large shares of oil sales for international transport or relatively large shares of non-energy uses of gas and oil products. In those cases, the annual BP trends may reflect the trends in the domestic fuel combustion part less accurately, when annual changes in these other uses are much different from those in the main use of domestic combustion.
Differences between official national CO2 emissions are generally within 5% for OECD-1990 countries and
around 10% for countries with less well-developed statistical systems (for details see Section 2.6). Main differences in allocation, methods and level of detail of major international data sets and of official national emission inventories are summarised in Annex A1.5.
ONE ONE
For the fuel combustion emissions (IPCC category code 1A) that account for about 90% of total global CO2
emissions, excluding forest fires, emissions per country for 2012 were divided into four main fuel types for use as trend indicators. These fuel types are coal and coal products, oil products, natural gas, and other fuels (e.g. fossil-carbon containing waste oils). For each sector, the 2012–2014 trend was based on BP fossil fuel consumption data released in June 2015 (BP, 2015). However, as detailed in Annex A1.1, the energy statistics of BP (2015) have been corrected: (i) in the national oil consumption data with corrections for biofuel and other fossil waste fuels, and (ii) with oil consumption data for international shipping and international aviation extrapolated from IEA bunker fuel statistics with the BP (2015) oil consumption trend. For the other emissions, (IPCC category codes 1B, 2, 3, 4, 6, 7), the CO2 process emissions of each activity
(production of steel and coke, of non-ferrous metals, of cement and lime) were estimated mainly with USGS (2015), WSA (2015) trends. The USGS (2015) commodity statistics were also used for the trends of the feedstock use and ammonia production. Only for the urea
production data from IFA (2015) were used. For flaring we assumed that the updated data of NOAA (2012) were constant for 2013-2014.
More details on the methodology and data sources are presented in Annex A1.1. Data quality and uncertainty in the data are discussed in Section 2.6. The uncertainty in CO2 emissions from fossil-fuel combustion using
inter-national statistics is discussed in detail by Marland et al. (1999) and Andres et al. (2012), and general uncertainty characteristics in global and national emission inventories by Olivier and Peters (2002).
This study provides time series of CO2 emissions from
fossil fuel use and industrial processes for 1990–2014 per country, per capita and per unit of GDP, which are also available on http://edgar.jrc.ec.europa.eu/overview. php?v=CO2ts1990-2014.
TWO
Results
TWO
2.1 Increase in global CO
2emission
growth almost stalled
In terms of CO2 emissions, energy consumption and the
weather, 2014 was a remarkable year, on both global and regional levels. The increase in global CO2 emission
growth almost stalled, per-capita energy consumption decreased, and it was the warmest year on record. After a decade of very high annual growth rates of global CO2 emissions of 4% on average, followed by two years of
slowdown to about 1%, the growth in emissions almost stalled in 2014 with an increase of only 0.5% to 35.7 billion tonnes (Gt) CO2 (Figure 2.1). At the same time, the world’s
population and economy continued to grow by 1% and 3%. Apart from the recent two years of recession, the 0.5% emission growth in 2014 was the lowest global growth rate since 1998. Where, in the previous years, it was debated whether or not the slowdown was accidental, now, after three years and trends over two or three quarters of 2015, we can conclude that the global slowdown is very likely due to structural changes. The slowdown in emissions and the continuing economic growth suggests a partial decoupling of the trend in global CO2 emissions from that of the global economy.
China, with 10.6 Gt CO2 and a share of 30% in global CO2
emissions, plays a pivotal role in this respect.
In 2014, global primary energy consumption, per capita, decreased for the first time since 1998 when Russia and the ‘Asian tiger’ countries were in recession (excluding the global recession year of 2009) (BP, 2015). Fossil fuel prices changed substantially during the year, (shale) oil
production in the United States increased in combination with continuous production in OPEC member countries, and there was no growth in the demand for coal in China. In addition, increasing renewable power production, accounting for two-thirds of the increase in global power production, also played a role. As for the weather, 2014 was the warmest year, globally, since records began in 1880. Including 2014, 9 of the 10 warmest years in the
135-year period on record occurred in this century. A large drop in demand for space heating (by 10%) in the European Union (EU-28) due to the warmest winter months on record contributed to plummeting gas consumption and the large drop (by 5%) in the EU’s CO2
emissions in 2014.
Major changes in fossil-fuel statistics of China, the country with the highest CO2 emissions
The main reason for the curbing of global CO2 emissions
is the change in the world’s fossil-fuel use due to the structural change in the economy and in the energy mix of China. Over the past three years, China’s economy has continued to become more oriented on service and domestic consumption. As a percentage of GDP, the service sector started to grow again about five years ago and, at 48%, has now surpassed the industrial sector as the largest economic sector (see Figure 2.5). Nevertheless, the smoothness of the transition is difficult to predict, especially as China still has extraordinarily high annual growth rates in all sectors. However, general trends are clear, as can be seen in countries that started earlier in their development from a mainly agricultural economy via industrial development towards a service-oriented economy.
China’s CO2 emissions have grown extraordinarily rapidly
since it started on its fast industrialisation path and after it joined the World Trade Organization (WTO) in 2003 (Figure 2.2). In 1990, its emissions were exactly half of those of the United States that, at the time, was the largest emitter of all countries in the world. Fourteen years later, in 2004, it surpassed the United States as the largest emitting country, and after yet another 10 years, in 2013, China’s emissions had increased by 80% and were twice the amount of those of the United States, whose emissions had decreased by 10% since 2004. In 2014, China’s CO2 emissions increased by only by 0.9%,
compared to 2013 levels, due to increasing consumption of oil products and natural gas, whereas coal
TWO TWO
These numbers are based on our latest estimate from EDGAR 4.3 of countries’ CO2 emissions, using IEA’s latest
data set on fossil fuel with data through 2012 (IEA, 2014a), but modified to include a large revision of China’s coal consumption statistics over the 2000–2013 period, as announced in May 2015 (NBS, 2015b), and extrapolated with BP data to 2014 (BP, 2015). Annex A1.4 provides more details on the method used and the impact on both China’s and global CO2 emissions.
Moreover, other CO2 emission sources have been updated
with the latest statistics of, notably, cement clinker and
lime production (UNFCCC, 2014; CCA, 2015; USGS, 2015). We assessed a short paper on China’s present CO2
emissions, published in Nature in August 2015, and concluded that most claims should be dismissed. For a more accurate calculation of the revised CO2 emissions
from fossil-fuel combustion in China over the 2011–2013 period, based on detailed revised energy balances published by China using the same method and emission factors as in this report, we refer to the 2015 edition of the annual IEA report ‘CO2 emissions from fuel
combustion’ (IEA, 2015b). Figure 2.1 1990 1995 2000 2005 2010 2015 0 10 20 30 40 1000 million tonnes CO2 pb l.n l / ec.europa.eu/jrc International transport Other countries Other large countries China
Other non-OECD1990 European countries Russian Federation Other OECD1990 countries Japan
European Union (EU28) United States
Global CO2 emissions per region from fossil-fuel use and cement production
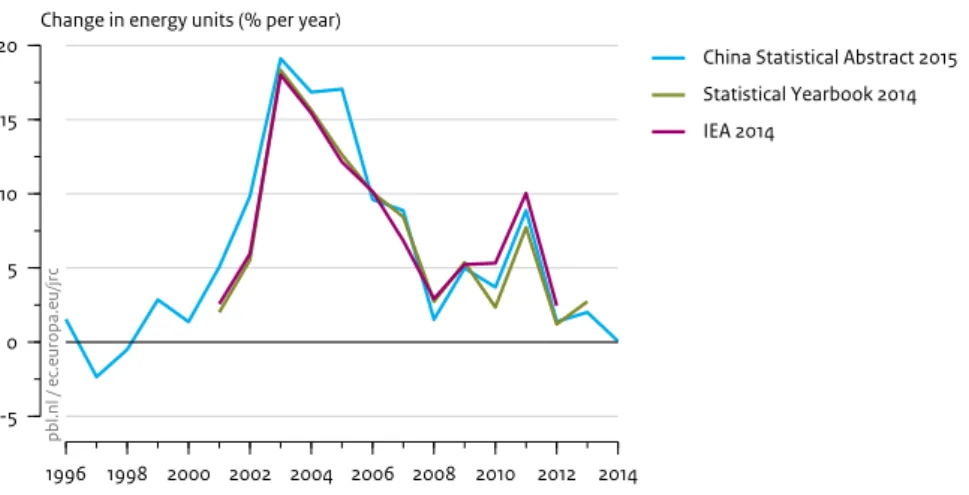
Source: EDGAR 4.3 (JRC/PBL, 2015) (1970-2012; notably IEA 2014 and NBS 2015); EDGAR 4.3FT2014 (2013-2014): BP 2015; GGFR 2015; USGS 2015; WSA 2015 Figure 2.2 1990 1994 1998 2002 2006 2010 2014 0 2 4 6 8 10 12 1000 million tonnes CO2
Source: EDGAR 4.3 (JRC/PBL, 2015) (1970-2012; notably IEA 2014 and NBS 2015); EDGAR 4.3FT2014 (2013-2014): BP 2015; GGFR 2015; USGS 2015; WSA 2015 pb l.n l / ec.europa.eu/jrc China
China before CSA 2015 revision United States
European Union (EU28) India
Russian Federation Japan
Uncertainty
CO2 emissions from fossil-fuel use and cement production in the top 5 emitting countries and the EU
TWO
Other global players determining global CO2 emissions in 2014
The very low global growth rate in 2014 was accompanied by a large drop in CO2 emissions of 5.4% to 3.4 Gt CO2
in the European Union (EU-28), which was mainly due to a decrease in fossil-fuel consumption for electricity generation and in manufacturing industries, and by a 10% lower demand for space heating than in 2013. The estimated growth of 0.9% to 5.3 Gt CO2 in 2014 for the
United States was largely due to the increasing demand for natural gas for space heating, partly compensated by a small drop in coal used in power generation. Together, the United States and the EU-28 account for a quarter of global CO2 emissions. The large decrease in EU-28
emissions especially contributed to the low global growth in emissions by 0.5%; for example, with the EU-28 compensating for the 7.8% growth shown by India, the fourth largest emitter with 2.3 Gt CO2, when we put the
European Union as a group in third place. If India’s CO2
emissions would continue to grow at the same average rate of 7% as they have over the past 10 years, they will surpass the current EU-28 emissions by 2020.
Largest emitting countries
In summary, the six largest emitting countries/regions in 2014 were: China (with 30%), the United States (15%), the European Union (EU-28) (9.6%), India (6.6%), the Russian Federation (5.0%) and Japan (3.6%) (Figure 2.2). Remarkable trends were seen in the top three emitting countries/regions, which account for 54% of total global emissions. In China and the United States, emissions increased by ‘only’ 0.9%. The European Union saw a large decrease of 5.4% in 2014, compared to 2013, which offset the 7.8% growth in India. The Russian Federation and Japan saw their CO2 emissions decline by 1.5% and 2.6%,
respectively.
Trends in global energy consumption
The shifts in energy production and consumption had major effects on energy prices as well as on the fuel mix. Of the three fossil fuels, global oil consumption increased by 0.8% in 2014, compared to 2013, mainly due to increased consumption in China (3%), Saudi Arabia (5%) and Brazil (3%), but for a large part this was offset by decreases in Japan (-5%) and the European Union (-1.5%). Oil prices fell sharply later in 2014, largely driven by the abundant supply, as production in the United States grew by a record amount while OPEC countries, by and large, maintained their output levels. For coal, growth in China’s consumption stalled in 2014 causing coal imports to plummet. The small increase in global coal consumption of 0.4% was mainly due to increases in India (+11%) and some smaller Asian countries, but
was largely compensated by a 7% decrease in the EU-28. The 0.4% growth in the consumption of natural gas was also small, since increases in the United States (3%), Iran (7%) and China (9%) were largely counterbalanced by the large fall of 11.6% in gas consumption in the European Union that was triggered by the exceptionally warm European winter. Renewable energy (excluding traditional fuelwood) was the fastest growing form of energy, accounting for one third of the increase in overall primary energy use (using the fossil fuel equivalency approach) and two thirds of the increase in power generation. Of the last, two thirds of the increase was in wind and solar energy, and one third in additional hydropower. Renewable energy currently accounts for a record 22.5% of global power generation (of which 16.5% is hydropower), but for only 9.8% of primary energy consumption (BP, 2015).
2014 was the warmest year on record
Winter temperatures that are lower or milder than usual have an impact on the demand for space heating and thus on CO2 emissions. Higher or cooler summer
temperatures have a similar impact the demand for air-conditioning, which is relevant for countries where many of these electrical appliances are used, such as in the United States, Japan and parts of China. We have not performed any sophisticated statistical analyses (apart from considering Heating Degree Days (HDD) for regions for which these are relevant and available), but find it important to highlight that the year 2014 was the warmest year, globally, since records began in 1880. The annually averaged temperature was 0.7 °C above the 20th century average of 13.9 °C, easily breaking the previous records of 2005 and 2010. Including 2014, 9 of the 10 warmest years in the 135-year period on record have occurred in the 21st century, i.e. in the past 14 years. This is the first time since 1990 that the high temperature record was broken in the absence of an El Niño event, which generally tends to increase global temperatures (NOAA, 2015).
Temperatures are rising at a faster pace in the northern latitudes of the Northern Hemisphere compared with other parts of the globe. According to NOAA’s 2014 Arctic Report Card, the Arctic on average is warming more than twice as fast as regions at lower latitudes. For more information on regional weather conditions in 2014 in the main energy-consuming countries and regions, and a comparison with 2013, see Annex 1.6.
Trends over the last decades
The moderate increases in global CO2 emissions in
2012, 2013 and 2014 of around 1% (0.5% to 1.5%) seem remarkable in times when global economic growth was
TWO TWO
3% annually, compared to average annual growth levels of 4% in emissions and 4.5% in GDP in the previous decade (with the exception of the recession years). In other words, a partial decoupling of global GDP and CO2
emissions can be observed over the past three years, similar to the 1990s that saw average annual emission increases of 1.3%. Within these percentages, however, there are notable differences in the performance of various countries. The service sector is not energy-intensive and currently contributes about 70% to global GDP. Therefore, increases in total energy consumption are not always closely related to overall economic growth, since total energy consumption is dominated by more energy-intensive sectors (e.g. power generation and the manufacturing industry) that make up only a relatively small share of total global GDP in most ‘developed’ countries (World Bank, 2015a). Since the share of the service sector at country level ranges from 20% to 87%, differences in growth rates between countries also help explain why CO2 emissions and
GDP are only very weakly related on a global level, as explained in Box 2.1. This also explains why annual growth rates in CO2 emissions and CO2 concentrations in
the atmosphere also are only weakly related.
Energy-intensive activities are of the highest relevance for CO2 emission trends, and fossil-fuel combustion
accounts for 90% of total CO2 emissions (excluding those
from deforestation and other land uses). Power generation remains the most important sector with respect to fossil-fuel consumption; therefore, the power sector’s choice to use fossil fuel is of the utmost importance. More details on recent energy trends are presented in Chapter 3, and Table 3.1 gives details on sector-specific shares of CO2 emissions.
Structural changes in global CO2 emission trends still uncertain
Reports published in recent years (Olivier et al., 2013, 2014) suggested that the small increases in CO2 emissions
registered in 2012 and 2013 – currently estimated at 0.8% and 1.5% – could be signs of a permanent slowdown in the increase in global CO2 emissions. The 2014 growth
rate of merely 0.5% is a continuation of the slowdown of the annual growth rate of emissions. Moreover, after three years of relative low growth rates in the previous decade, China’s growth in energy consumption and industrial production in the first three quarters of 2015 is stalling while the share of renewable energy continues to increase. Thus, we can conclude that the slowdown since 2012 of China has not been an accidental, temporary effect, as it has lasted for three years already. This reflects structural changes in China’s economy towards a less energy-intensive service sector and a high value-added manufacturing industry that is focused more on domestic consumption, with more energy efficiency, and towards a low-carbon energy mix.
On a global scale, however, the slowdown since 2012, which has also lasted for three years now, can be largely explained by the changes in the economy of China and the associated energy consumption. Whether these changes also reflect structural changes in the global economy, global energy efficiency improvements and in the energy mix of other key world players, such the United States, European Union, India and Russia, is uncertain.
However, further mitigation of fossil-fuel use will be needed to absolutely decrease global greenhouse gas emissions, which is necessary to substantially mitigate
Box 2.1 Relationship between CO
2emissions and GDP and global atmospheric CO
2concentrations
Gross Domestic product (GDP) can be considered the total value added achieved by all economic sectors, which greatly differ in terms of energy intensity, such as the power sector, energy-intensive basic materials industry, other less energy-intensive industries, service sectors and agriculture. Moreover, household energy consumption for heating, electrical appliances and private transport is not directly coupled to GDP. Annual growth rates often greatly vary between sectors. Therefore, annual trends in GDP and total energy consumption and related CO2 emissions (i.e. single year trends) are generally only weakly related. Since the energy mix
generally varies per sector and country, the link between global GDP and global CO2 emissions is even weaker.
The relationship between the increase in annual global CO2 emissions and the annual increase in atmospheric
CO2 concentrations (not included in this study) is also rather weak. This is because the net annual increase in CO2
concentration is affected by the large inter-annual changes in CO2 emissions from forest fires and deforestation
and in the amount of CO2 absorbed by vegetation; in particular by growing forests, which vary substantially
depending on temperature and the amount of sunshine and precipitation. In addition, the total absorption of atmospheric CO2 by the oceans also varies over time.
TWO
anthropogenic climate change within this century, as was concluded by the IPCC (2014a,b). Technically, these reductions are still feasible (IPCC, 2014a; UNEP, 2014), but would need to be widely implemented soon if future global greenhouse gas emission levels need to be compatible with pathways that could limit global warming to 2 oC by the end of the 21st century, compared
to the pre-industrial global mean temperature (see Box 2.2).
Importance of other sources of greenhouse gas emissions for mitigating climate change
This report assesses the trend in global CO2 emissions
from fossil-fuel use and industrial processes. For a comprehensive assessment of the trends in all
greenhouse gas emissions up to 2010, including CO2 from
forest fires and other land-use change, and the non-CO2
greenhouse gases such as methane and nitrous oxide (which account for about one quarter of the global total in CO2 eq greenhouse gas emissions), we refer to the Fifth
Assessment Report (AR5) of the IPCC Working Group III ‘Mitigation of Climate Change’ (IPCC, 2014a).
Although CO2 emissions from fossil-fuel and carbonate
use are key to greenhouse gas mitigation, other sources also contribute significantly, as is shown in Figure 2.3. This figure illustrates that CO2 emissions from fossil-fuel
use and industrial processes covered in this report represent two-thirds of global total greenhouse gas emissions, with the other sources of greenhouse gas emissions contributing the remaining third. Comparison between the global shares and those of the United States
and the European Union in Figure 2.3 also illustrates that the non-OECD countries, in particular tropical countries, have a relatively large share in CO2 emissions from forests
(fires and deforestation) and from large methane (CH4)
sources, such as rice, cattle, sheep and wastewater. The differences in total greenhouse gas emissions per capita as estimated in the EDGAR 4.2 FT2010 data set for 2010 are presented on the map shown in Figure 2.4. More information on recent trends in other sources can be found, for example, in national reports to the UNFCCC and in the EDGAR data set (EC-JRC/PBL, 2015), available at country and source level.
How do these trends relate to the COP21 climate conference in Paris?
For a first analysis of the targets and actions announced for the COP21, we refer to the UNFCCC (2015) and UNEP (2015c), amongst others, which has also analysed whether the new approach may result in a breakthrough on national emission targets for mitigating climate change, at the international negotiations in Paris, in December 2015.
For an analysis of the more recent trends in all green-house gas emissions in all major countries, including CO2
emissions from forest fires and other land-use change and non-CO2 greenhouse gases, the pledges by the
countries following the Copenhagen/Cancun Agreements to mitigate national emissions by 2020 and an assess-ment of the resulting national emission trend by 2020, we refer to PBL (2015) and UNEP (2015b).
Box 2.2 Main conclusions on anthropogenic global greenhouse gas emissions from the IPCC’s
Fifth Assessment Report (IPCC, 2014a,b)
– The effects of anthropogenic greenhouse gas emissions have been detected throughout the climate system and are extremely likely to have been the dominant cause of the observed warming since the mid-20th century.
– Cumulative emissions of carbon dioxide will largely determine global mean surface warming by the late 21st century and beyond.
– It would be possible, using a wide array of technological measures and changes in behaviour, to limit the increase in global mean temperature to 2 °C above pre-industrial levels.
– Substantial emission reductions over the next few decades can reduce climate risks in the 21st century and beyond.
– Without additional mitigation efforts to those in place today, and even with adaptation, warming by the end of the 21st century will lead to high and very high risks of severe, widespread, and irreversible impacts, on a global scale.
– There are multiple mitigation pathways that can limit the increase in global mean temperature to 2 °C above pre-industrial levels. These pathways would require substantial reductions in emissions over the next few decades, and near zero emissions of CO2.
– Many adaptation and mitigation options can help address climate change, but no single option would be sufficient by itself. Mitigation options are available in every major sector.
TWO TWO
Figure 2.3 2 % 6 % 18 % 10 % 64 %CO2 fossil fuel and
industrial processes
CO2 forests (representing 'LULUCF')
CH4
N2O
F-gases
World
Shares of greenhouse gas emissions, 2010
2 % 5 % 16 % 1 % 76 % China 6 % 4 % 9 % 1 % 80 % United States 3 % 5 % 12 % 4 % 76 % EU28 pbl.nl / ec.europa .eu/ jrc pbl.nl / ec.europa .eu/ jrc pbl.nl / ec.europa .eu/ jrc pbl.nl / ec.europa .eu/ jrc
Source: CO2 fossil and processes: EDGAR 4.3 (JRC/PBL, 2015); others: EDGAR 4.2 FT2010 (JRC/PBL, 2012)
Note: In this report, CO2 emissions are provided for Fossil fuel+Industrial process (‘FF+IP emissions’), and other sources of emissions; CO2 from forest fires
and deforestation (‘Forests’, representing the emissions part of ‘LULUCF’), methane (CH4), nitrous oxide (N2O) and the F-gases HFCs, PFCs, and SF6 as
shares in total greenhouse gas emissions (excluding CO2 removals such as forest growth and afforestation and using GWP-100 values from the Fourth
IPCC Assessment Report). The source used for other emission sources is EDGAR 4.2 FT2010 (EC-JRC/PBL, 2012).
Figure 2.4
Geenhouse gas emissions per capita, 2010
Source: http://edgar.jrc.ec.europa.eu/overview.php?v=GHGt
Note: Including emissions from forest fires/deforestation (emissions component of ‘LULUCF’). Excluding CO2 removals from forest growth and afforestation.
TWO
For an evaluation of the Intended Nationally Determined Contributions (INDCs) of countries, see Den Elzen et al. (2015b) and Climate Action Tracker (2015). In addition, the PBL Climate Pledge INDC tool (Den Elzen et al., 2015b) shows the projected impact of the emission reduction proposals (pledges or Intended Nationally Determined Contributions) and domestic policies, per country, on greenhouse gas emissions for 2020 and 2030. More specifically, the tool shows the effect of: (a) Pledges: national and global greenhouse gas emission projections for 2020, assuming that countries’ pledges will be fully achieved; (b) Intended Nationally Determined Contributions (INDCs): national and global greenhouse gas emission projections for 2030, assuming that countries’ INDCs will be fully achieved; (c) Measures: the impact of the most effective national climate and energy policies, such as carbon taxes, feed-in tariffs, or standards on emission levels for 2020 and 2030, for 19 major emitting countries and regions.
Further analysis may also show whether the recent national CO2 trends as estimated in this report fit into the
total national greenhouse gas emission trends expected from analyses of the Cancun pledges for 2020 and INDCs and other country pledges for 2025 or 2030 (e.g. see Admiraal et al., 2015; Carbon Action Tracker, 2015; UNEP, 2015b; IEA, 2015e).
The main question is that of how fast global CO2
emissions will level off and start to decrease in absolute terms. Future global emission trends will be determined by the collective emissions from all countries and all greenhouse gases, partly due to developments that are controlled by government policies, actions by non-state actors and more autonomous economic and
technological developments, which all have inherent uncertainties. The recent global emission trend shows that national policies collectively do reduce the rate of increase in global CO2 emissions. Examples of economic
and technological developments are the dependence of the use of new technologies on the oil price, as this may affect the economic feasibility of new energy sources, such as shale oil production and the production of shale gas, which may affect natural gas prices worldwide; increased transport and storage capacity of liquefied natural gas (LNG) may expand intercontinental trade in LNG, and thus influence continental natural gas markets; and overcapacity in power generation may cause rapid changes in the fuel mix used by utilities in the event of changes in the relative prices of gas and coal. These examples show both the potential and the uncertainty in reducing the rate of increase and curbing global CO2
emissions in the near future.
Uncertainties in emissions
We note that all national emission inventories are subject to uncertainty. Uncertainties in national CO2 emissions
vary between countries. In this report, they range from 5% to 10% (95% confidence interval), with the largest uncertainties concerning the data on countries with rapidly changing or emerging economies, such as Russian Federation data on the early 1990s and data on China since the late 1990s, based on Marland et al. (1999), Tu (2011), Andres et al. (2012), Guan et al. (2012) and Liu et al. (2015). Moreover, in general, most recent statistics are also somewhat more uncertain for every country, since first published statistics are often subject to subsequent revisions when more detailed data become available (Olivier and Peters, 2002). For China, Wang and Chandler (2011) give a good description of the revision process of energy and GDP statistics. For China and the Russian Federation, we assumed 10% uncertainty, whereas for the European Union, the United States, Japan and India, a 5% uncertainty was assumed. Our preliminary estimate of total global CO2 emissions in 2014 is believed to have
an uncertainty of about 5%, and our estimated emission increase of 0.5% may be accurate to within ±0.5%. For more details, see Section 2.6.
2.2 Different trends in the six largest
emitting countries/regions
This section analyses the emissions from the six largest emitting countries/regions in descending order of importance. The largest CO2 emitting country by far is
China, whose share of 30% in 2014 was twice as large as the second-largest, the United States, at 15%. Third is the European Union, at almost 10% (Figure 2.2).
A comparison of the shares of national GDP (on the basis of Purchasing Power Parity (PPP)) in global GDP
expressed in USD showed that the top three countries/ regions are very close (World Bank, 2015a): the shares in the world economy of both the European Union and China was 17%, and the United States’ share was 16%. These three are followed at a distance by India (7%), the Russian Federation (3%) and Brazil (3%). However, when looking at their contributions to global economic growth over the past ten years (which was 62% since 2002), China contributed 31%, India 11%, the United States 9%, the European Union 6% and the Russian Federation and Indonesia 3% each. Therefore, China contributed to halt or global economic growth lack in the past decade.
TWO TWO
In 2014, the growth in the world economy was around 3.3%, apart from the global credit crunch years of 2008 and 2009, but with large differences between the largest countries/regions. The economy of the United States increased by 2.4% in 2014 (compared to the annual average of 1.8% over the last decade), whereas the EU-28 economy grew by 1.4%, which is similar to its average historical growth rates. China’s annual economic growth in 2014 of 7.2% was similar to the growth reported for 2012 and 2013 (IMF, 2015) and only about three-quarters of the ten-year annual average of 10%. By contrast, the economic growth of the Russian Federation (0.6%) and Brazil (0.1%) in 2014 was much lower than the average of the previous decade. The economic growth rate in 2014 of India (7.2%) was similar to its annual average over the previous ten years (World Bank, 2015a).
Please note that for most OECD countries these GDP statistics reflect the revisions of the definition of the Gross
National Product (GNP) as adopted in the updated
international guidelines for national economic accounts of the 2008 UN System of National Accounts (‘SNA 2008’) (UN, 2009). However, the World Bank data for Russia, China and Brazil do not yet include these revisions (World Bank, 2015a).
For most OECD-1990 countries, the past decade has been strongly influenced by the 2008–2009 recession, and has since been slowly recovering. In 2014, countries such as Spain and Australia saw their historical economic growth rates continued. The growth in the GDP of the United States, Canada, Germany and the United Kingdom was higher than their historical average growth rates, whereas economic growth in Italy and Japan was negative in 2014.
2.2.1 China
China is by far the largest CO2 emitting country. This high
ranking is mainly due to the size of its population and economy, but also because of the high share of coal in its energy mix, as it is has much more coal reserves than oil and gas.
For China, the trend in CO2 emissions in 2014 has been
widely discussed since the end of 2014, as first analyses suggested that coal consumption had decreased over 2014, after a very long period of continuous increases. In August 2014, Myllyvirta (2014) suggested that coal consumption may have dropped in the first half of 2014. In January 2015, he announced that China’s apparent coal consumption had fallen in 2014 by 3.5% based on data reported by China’s Coal Industry Association (Myllyvirta, 2015a). In February 2015, the National Bureau of Statistics of China (NBS) published a statistical communiqué with preliminary estimates that stated that coal consumption had declined by 2.9% in 2014. In addition, NBS reported
that coal production in 2013 had been revised upwards by 7.9% based on the results of the Third National Economic Census (NBS, 2015a). In March 2015, the International Energy Agency (IEA) announced that preliminary data indicated that China saw less burning of coal and that global CO2 emission growth had stalled in 2014 (IEA,
2015c). In May 2015, NBS published a new preliminary estimate of total coal consumption in 2014 and a major revision of total fossil-fuel consumption by main fuel type dating back to 2000. Finally, a paper by Liu et al. (2015) published in August claimed that the best estimate of China’s current CO2 emissions from fossil fuels and
cement production was 14% lower than reported by other inventories such as EDGAR, CDIAC and emissions that China officially reported to the UNFCCC. Their paper gave rise to much public debate (Reuters, 2015) .
We have evaluated these claims and the main conclusions of our assessments are:
– A decrease in coal consumption of 2.9% (NBS, 2015a) in tonnes of mass may very well be consistent with a conversion to amounts in physical energy units (Joules or Standard Coal Equivalents), resulting in a 0.1% growth over 2014 (NBS, 2015b) if the average heat content of the coal increased by a few per cent in 2014. The U.S. Energy Information Administration (EIA) made an assessment and concluded that a change in the energy content could well explain a difference in the trend estimates in tonnes of mass and in energy units (EIA, 2015j). Lower coal prices and stricter enforcement of environmental regulations in 2014 make it economically acceptable to use higher quality coal. Average heating values implied in past Chinese Statistics have suggested 2% or higher changes from one year to another, reflecting changes in coal washing ratio and lignite use.
– A paper by Liu et al. (2015) published in August claims that China’s national coal consumption statistics used in the inventories are too low and that the ‘apparent
consumption’ is a more accurate estimate of actual
consumption. Extensive measurements made by the authors show that the average energy content and carbon fraction of the coal is much lower than the IPCC default value, which is primarily caused by the low quality and high ash content of Chinese coal. Moreover, they claim that the fraction of carbon that is not oxidised to CO2 during combustion is about 8%,
which is much higher than the IPCC default value, resulting in a significantly lower net emission factor in kg CO2/GJ. The authors suggest that other emission
inventories have substantially overestimated CO2
emissions in recent years. After a critical review of the paper and the supplementary data provided, we find several of these statements to be in error regarding the numbers or the comparisons. After a correct
TWO
comparison we conclude that the new estimate presented in this paper is only 6% lower than the EDGAR estimate, which is largely due to the 8% correction of the CO2 emission factor for the fraction
that was not oxidised. However, the oxidation factor data presented and used in the paper suggest only an average correction of about 4% at most, and the authors provide no further references to evaluate the accuracy of the numbers. We therefor conclude that Liu et al. do not provide good evidence to prove that present international CO2 emissions inventories such
as CDIAC, IEA and EDGAR are systematically and substantially too high. For more details of this assessment, see Box 2.4 in Section 2.6.
– The energy consumption statistics published by NBS in the China Statistical Abstract 2015 in May 2015, of which only the resulting total coal consumption was implicitly published as a percentage of total energy consumption in energy units (NBS, 2015b), show a substantial revision. From this new data one could conclude that coal consumption in energy units increased in 2014 by about 0.1%. Since the revision changes the coal consumption levels back to 2000, and as we want to show the latest CO2 trends, we
have estimated the impact of the coal consumption revisions on CO2 emissions from fossil-fuel
combus-tion based on the method described by EIA (2015j). This resulted in increases of 0.5 to 0.7 Gt CO2 per year
for the years 2005 to 2012 (8% on average) for CO2
from total fossil-fuel combustion, and decreasing back to 2000. Details of our estimation method are provided in Annex A1.4.
The result of our assessment – including the estimated impact of the revision of coal statistics – is that in 2014 China’s CO2 emissions increased by 0.9% to 10.6 billion
tonnes when using the 0.1% increase in coal consumption inferred from data (in energy units) reported in the China
Statistical Abstract 2015 published in May (NBS, 2015b).
These CSA coal consumption data are also reported by BP (2015) and used in an analysis of the revision of China’s coal statistics by the U.S. Energy Information
Administration (EIA, 2015j)1. Note that although the
increase in coal consumption essentially stalled in China in 2014, the consumption of oil products and natural gas continued to increase by 3.3% and 8.6%, respectively (NBS, 2015a; BP, 2015), and the CO2 emissions of gas and
oil together account for about 20% of total CO2 emissions
from fossil-fuel combustion. In addition, cement production increased by 2.3% (NBS, 2015a) and CO2
emissions associated with the calcination process of the limestone used in the production of cement clinker account for 7% of China’s total CO2 emissions from
fossil-fuel use and industrial processes.
Together with the 2.6% increase in 2012 and 3.2% in 2013, the past three years show the slowest annual rate of increase in emissions in a decade, compared with the annual average increase of 9.7% in the years since 2003, even including the global credit crunch years 2008 and 2009. The average absolute annual growth over the past three years was one third of that in the previous decade (about 0.2 versus 0.6 Gt CO2), and one quarter when
comparing average annual growth in percentages: 2.2% compared to 9.7%.
The relatively small increase of about 1% in CO2 emissions
in 2014 was mainly due to a virtual standstill (+0.1%) in the increase in coal consumption, while coal consumption in 2012 and 2013 increased by 1.4% and 2.0%, as reported in energy units by BP (2015) and NBS (2015b). In the decade preceding 2012 the average annual growth rate was mostly around 10% (See Table 2.1). Coal consump-tion, which makes up 73% of fossil-fuel consumpconsump-tion, is responsible for about 83% of China’s CO2 emissions from
fossil-fuel combustion. In contrast, the increase in natural gas consumption was 8.6% in 2014, following increases of 12% and 13% in 2012 and 2013, which is a slowdown in the annual increase compared to the average increase of about 18% from 2003 to 2011. Furthermore, cement production increased by 2.3% in 2014, so CO2 emissions
from the calcination of limestone during cement clinker production, which make up about 7% of China’s total CO2
emissions, also increased. Therefore, we estimate that total Chinese CO2 emissions increased by approximately
1% in 2014. The increases of the past three years were the lowest since 2001, the year after which the average annual increase in Chinese emissions accelerated from about 3% to 10%. Even in the two recent credit crunch recession years, China’s CO2 emissions continued to
increase by about 6% per year.
This small emission increase of 1% in 2014 is consistent with the small decrease of 0.3% in thermal power generation (predominantly coal-fired power plants) reported by the National Bureau of Statistics of China (NBS, 2015a). The decrease in the power generated by coal-fired power plants, which produce about three-quarters of total electricity (NBS, 2015a) and which contribute to about half of the country’s CO2 emissions
from fossil-fuel combustion (Table 3.1), was due to the still relatively ‘small’ growth rate of total power consumption of 3.8% in 2014, compared to the previous decade that showed double-digit growth figures (the lowest since 2000).
Moreover, hydropower generation increased by 16% in 2014 due an expansion of installed capacity of 8% by the end of 2014 and to favourable weather conditions. Hydropower accounted for two-thirds of the no-coal