ASSESSING POTENTIAL IMPACT TO GROUND WATER IN THE EU AND MEMBER STATE REGISTRATION PROCEDURES
JONES R. L.1, BOESTEN J. J. T. I.2, FISCHER R.3, GOTTESBÜREN B.4, HANZE K.5, HUBER A.6, JARVIS T.7, KLEIN M.8, POKLUDOVÁ M.9, REMY B.10, SWEENEY P.11, TIKTAK A.12, TREVISAN M.13, VANCLOOSTER M.14, VANDERBORGHT J.15
1
Bayer CropScience, 17745 S Metcalf Ave., Stilwell, KS, 66085 USA. E-mail. russell.jones@bayercropscience.com
2
Alterra, P.O. Box 47, 6700 AA Wageningen, the NETHERLANDS 3
Bundesamt für Verbraucherschutz und Lebensmittelsicherheit, Messeweg 11-12, D-38104 Braunschweig, GERMANY
4
BASF Agricultural Center Limburgerhof, D-67117, Limburgerhof, GERMANY 5
National Chemicals Inspectorate, Box 1384, S-17127, Solna, SWEDEN 6
Du Pont de Nemours GmbH, Du Pont Str. 1, D-61352, Bad Homburg v.d.H., GERMANY 7
Exponent International Ltd., The Lenz, Hornbeam Business Park, Harrogate, HG2 8RB UK 8
Fraunhofer Institute, Auf dem Aberg 1, D-57392, Schmallenberg, GERMANY 9
State Phytosanitary Administration, Plant Protection Product Division, Zemedelska 1A, Brno 61300, CZECH REPUBLIC
10
INRA, UMR SAD APT, Bâtiment EGER, BP 01, 78850 Thiverval-Grignon, FRANCE 11
Syngenta, Jealott’s Hill Research Station, Bracknell, Berks RG42 6ET, UK 12
Netherlands Environmental Assessment Agency (MNP), Postbus 303, 3720 AH Bilthoven, the NETHERLANDS
13
Istituto di Chimica Agraria ed Ambientale, Facoltá di Agraria, Universitá Cattolica del Sacro Cuore, Via Emilia Parmense, 84, 29100 Piacenza, ITALIA
14
Department of Environmental Sciences and Land Use Planning – Genie Rural, Université Catholique de Louvain, Croix du Sud 2, BP 2, B-1348 Louvain-la-Neuve, BELGIUM
15
Agrosphere, ICG-IV, Forschungszentrum Jülich GmbH, D52425 Jülich, GERMANY
ABSTRACT
A FOCUS work group was established in 2004 to update the EU ground water assessment procedures. The work group has proposed a four tier ground water assessment process considering initial modelling, more advanced modelling, approaches combining experiments with modelling, and ground water monitoring. The work group made minor changes to the soil profiles in the Piacenza and Porto scenarios to make them more representative of their respective agricultural regions. Harmonisation has concentrated on the dispersion length and the water balance. Water balance changes include a switch from the potential evapotranspiration calculated by MARS to that calculated by FAO for the five southern scenarios, development of irrigation schedules for each of the irrigated crops which are calibrated to the amounts actually used in the region, implementation of time varying crop coefficients in all models, standardisation of soil evaporation when no crops are present, and harmonisation of runoff amounts. Several different higher tier modelling approaches have been evaluated including spatially distributed modelling, inverse modelling, and non-equilibrium sorption. Two different GIS based approaches have been proposed for selection of regional crop-specific scenarios. The existing nine FOCUS scenarios cover most areas in the new member states for the purpose of Tier 1 simulations.
KEY WORDS: ground water, exposure assessments, pesticides, spatial modelling, water balance.
INTRODUCTION
FOCUS (FOrum for the Co-ordination of pesticide fate models and their USe) issued a set of scenarios and associated software packages in 2000 for use in assessing potential movement of
pesticides to ground water in the EU registration process (FOCUS, 2000). After these scenarios were released, a number of questions began to be asked about the relative roles of modelling versus field research and monitoring studies. A study by APECOP (Vanclooster et al., 2003) raised questions about the suitability of some of the scenarios. Differences between the various models, while acknowledged at the time of release, became more of an issue. Uses of higher tier assessment procedures such as GIS techniques were becoming more widespread. Finally the number of countries in the EU expanded and the question of whether new scenarios were necessary needed to be addressed. Therefore, FOCUS established a new work group in 2004 to review and update the ground water assessment procedures used in the EU. This group had the following four major objectives:
a. Develop a tiered process for assessing the risk for leaching to ground water in the EU including results from different studies and recommendations for national approaches.
b. Review the existing scenarios with emphasis on the appropriateness of the scenarios and harmonizing the results from the different models and various parameters.
c. Establish the principles for higher tier modelling approaches considering GIS based approaches, the combination of modelling approaches with experimental studies, and inclusion of relevant processes that have been ignored so far.
d. Explore any changes needed in the scenarios to include the conditions in the new member states.
The work group is nearing completion on objectives a, c, and d, while considerable effort is still needed to accomplish objective b. This paper presents the conclusions that have been reached to date by the work group.
ASSESSMENT OBJECTIVES
The assessment objectives are different for EU registration of the active ingredient (placement on Annex I) and product registrations in the member states. Although there is no official ground water decision scheme for Annex I inclusion, the current practice is to demonstrate at least one safe use on a representative crop in a significant area of Europe. For national assessments, all crops and the entire potential use area must be considered. If the compound cannot be used safely throughout the country, then the registration may be limited to the subset of conditions under which the compound can be used safely.
TIERED ASSESSMENT PROCEDURE
The FOCUS work group objective was to develop a scheme in which the initial (or earlier) tiers are quick, simple, and cheap to undertake and allow the compounds that clearly do not cause any concern to be passed. The later (or higher) tiers are more complex and expensive but should provide a more realistic result. Therefore, results of higher tier assessments supersede results from lower tier assessments. As an initial step in the development of this approach, the input of member states was sought in the form of a questionnaire that asked details about the assessment procedures currently in use. After considerable discussion the work group suggested the basic scheme with four tiers that is shown in Figure 1. This tiered approach is applicable to both EU and member state evaluations, even though the objectives are different.
Tier 1 in the EU consists of the standard scenarios proposed by FOCUS (2000) and which will eventually be replaced by revised scenarios developed by the current work group. In the member state evaluations, a subset of the FOCUS standard scenarios or national scenarios can be
used. Degradation rates may be from either laboratory or normalised degradation rates from field dissipation studies.
1)
standard scenarios with lab or field degradation data
2a) Modeling with refined parameters 2b) Modeling with refined scenarios 4) groundwater monitoring Tier 1 * Tier 2 * Tier 3 * Tier 4 * * Mitigation possible 3a) Combined modeling refined parameters & scenarios 3b) Advanced spatial Modeling 3d) Other modeling approaches 3c)
Higher tier leaching experiments set into context by modeling 1)
standard scenarios with lab or field degradation data
2a) Modeling with refined parameters 2b) Modeling with refined scenarios 4) groundwater monitoring Tier 1 * Tier 2 * Tier 3 * Tier 4 * * Mitigation possible 3a) Combined modeling refined parameters & scenarios 3b) Advanced spatial Modeling 3d) Other modeling approaches 3c)
Higher tier leaching experiments set into context by modeling
Figure 1: Proposed Generic Tiered Assessment Scheme for Ground Water
Tier 2 consists of more refined modelling approaches. Tier 2a consists of modelling with refined parameters. This includes providing data on specific processes (for example, sub-surface degradation or non-equilibrium sorption) or particular conditions (such as soil-specific degradation rates) relevant to a particular crop or member state. Tier 2b consists of modelling with refined scenarios. This approach is appropriate when the standard Tier 1 scenarios are not representative of a specific crop or use area. The work group report presents two different methods in detail for determining refined scenarios.
Tier 3 consists of four options consisting of different modelling approaches and modelling combined with experiments. When relevant to the proposed use pattern, Tier 3a combines the refinements detailed in Tiers 2a and 2b to provide an assessment based on both approaches. In Tier 3b spatially-distributed leaching models provide the user with maps of the predicted leaching concentrations in the intended use area or in a climatic zone. Frequency distributions and percentiles of the leaching concentration can be directly inferred from these maps. The quality of such assessments is very much dependent on the quality and coverage of the underlying soil profile and climatic information. Currently the uncertainty of the soil profile information on a European scale is too high for EU-wide assessments. However, in some countries (for example, the Netherlands), high quality data are available. GEOPEARL is an example of a spatially distributed model, but any of the FOCUS models could be incorporated into a spatially distributed modelling framework. Tier 3c combines information from experimental studies such a lysimeter experiments and field leaching studies. While field study measurements do not have the limitation of the assumptions used in leaching models, the results
may only be directly relevant to the climatic, pedological and agronomic (crop, timing, application rate etc) conditions in which the studies were conducted. Therefore, results must be put into context using modelling. This can be accomplished in a number of ways, including comparing the vulnerability of conditions in the experiment with the vulnerability of the conditions in a specific Tier 1 scenario, or using inverse modelling to develop estimates of input parameters such as degradation rates and sorption constants and then re-running the standard scenarios. Tier 3d includes other modelling approaches (for example, stochastic and 3-D modelling). At this time the view of the FOCUS work group is that other modelling approaches are not sufficiently developed for regulatory use at a high tier of the risk assessment scheme. However the work group expects that the science will develop in the future and that current research applications may, in time be usable for regulatory purposes.
Tier 4 consists of ground water monitoring data. Ground water monitoring data are seen as the highest tier of assessment since the actual concentrations in ground water are directly measured rather than being estimated by modelling approaches or approximated from small scale field studies. For existing pesticides monitoring data can be useful at both the EU level and the national level. For instance, representative data from one member state could demonstrate a “safe use” for the EU evaluation. For new active substances historical monitoring data are clearly not available, but post-registration monitoring programs may be possible. Monitoring data can include the results of dedicated analyses of ground water by notifiers or other agencies (i.e. water companies, environment agencies etc) where there may be a detailed initial assessment of the relevance of the monitoring points (for example, by knowledge of historical compound usage in the area and characteristics of the aquifer) and certain minimum quality criteria are demonstrated.
At any tier of the assessment process, mitigation (measures taken to adjust or restrict the use of a pesticide to obtain a favourable risk assessment) is possible. Mitigation measures often relate to the GAP, and include crops to which a compound can be applied, the timing/crop stage for uses on each specific crop, the application rate, the number of applications, and the timing between applications. Other potential mitigation measures include preventing applications on soils with certain properties (through soil or geographical restrictions), restricting applications in hydrogeologically vulnerable areas, and limiting applications to certain times of the year.
VULNERABILITY CONCEPT AND REVISED SCENARIOS
Due to the lack of data bases, the original scenarios were selected by a combination of approaches including expert judgement, locations in major agricultural areas, and distribution of sites to cover all European climatic zones. A study designed to check vulnerability of the scenarios using a regionalized modelling approach (Vanclooster et al., 2003) showed that the Porto and Piacenza scenarios did not represent the 80th percentile soil and weather for the relevant climatic zone. To revise the scenarios, the work group had to decide the vulnerability criteria for revision of these scenarios. The criterion selected was the the 90th percentile leaching vulnerability for the climatic zone represented by the Porto and Piacenza scenarios. The climatic zone was defined on the basis of the EU area with 15 member states so that the addition of member states did not require the whole set of scenarios to be revised. In addition, the basic spatial unit for leaching was defined as the soil mapping and the basic temporal unit was an annual average for annual applications. The work group also reviewed several approaches for determining specific percentile values for ranked series of average annual concentrations and decided that the overall 90th percentile concentration (80th percentile weather) would be the average of the 16th and 17th of the 20 ranked values from the simulation. In the previous
simulations, the 17th ranked value was used. For applications made every second or third year, FOCUS (2000) recommended calculating flux weighted averages for each of the 20 two or three year periods and then selecting the 80th percentile of these 20 values. The work group investigated taking the 80th percentile of the 40 or 60 yearly values. Because the two methods gave similar results, the work group recommended continuing with the calculating the 80th percentile of the 20 flux weighted averages.
A spatial analysis of the climatic zones represented by the Porto and Piacenza scenarios indicated that a change in the organic matter was appropriate to make them fit the vulnerability concept. The organic matter in the surface soil at Porto was decreased from 6.6 to 2.45 percent, resulting in changes to the bulk density, hydraulic properties, and the organic matter in the deeper soil layers. The organic matter in the surface soil at Piacenza was increased from 1.72 to 2.17 percent, along with changes to the organic matter in the deeper soil layers.
HARMONISATION OF THE DISPERSION LENGTH
One of the remits of the work group was to harmonise the dispersion lengths in the four models when used to assess concentrations in ground water for Tier 1 in the EU registration process. In simulations conducted according to the procedures in the previous work group (FOCUS, 2000) PEARL and MACRO used a dispersion length of 5 cm and the effective dispersion length (set by compartment size) in PRZM and PELMO was 2.5 cm. Later work by Boesten (2004) showed that the difference in dispersion lengths was a major source of the difference between predictions of PEARL and PELMO or PRZM. Work group members undertook several activities associated with dispersion. First, a data base of dispersion lengths reported in the literature was derived (Vanderborght and Vereecken; 2007a). This review demonstrated that dispersion increases with depth. Second, changes in how the dispersion process is modelled in a soil profile with depth dependent sorption and decay factors resulted in different predictions of pesticide concentrations at the bottom of the soil profile, even when the different models predicted the same breakthrough of an inert tracer (Vanderborght and Vereecken, 2007b). The pesticide fate models use a one-dimensional convection dispersion equation to describe transport and two options to parameterise this model were discussed. The first option assumes a constant dispersion in the entire soil profile, thereby overestimating the leaching through the upper soil layer where most decay takes place. The second option divided the upper meter in three layers (corresponding to the three different default degradation factors) with increasing dispersion lengths as a function of depth, but the validity of the process description in this approach was questioned. The work group could not come to a consensus over which of the two approaches was preferable. However, because of the need for harmonisation, the constant CDE approach with a dispersion length of 5 cm will be used in the revised scenarios produced by the work group. The constant CDE approach is the more conservative of the two approaches, at least for parent compounds.
HARMONISATION OF THE WATER BALANCE
One of the objectives of the work group was to harmonise the discrepancies in the water balances obtained with the various models. Examination of these differences led to the identification of work in five areas:
1. the most appropriate source of potential evapotranspiration data 2. the use of time varying crop kc (evapotranspiration) values 3. calculating evaporation from bare soil
4. determining appropriate amounts of runoff for each location/crop location and how to achieve this with the different models
5. developing appropriate irrigation files for each location/crop location in the locations where irrigation is a common agricultural practice
FOCUS (2000) used potential evapotranspiration calculated from the MARS data base and FAO crop coefficients. The work group examined whether FAO or MARS potential evapotranspiration was most appropriate. The work group decided to use FAO evapotranspiration for Porto, Piacenza, Châteaudun, Thiva, and Sevilla for consistency between the crop coefficients and evapotranspiration values. The MARS approach to calculating evapotranspiration will be retained for Okehampton, Kremsmünster, Hamburg and Jokioinen, because the reference long wave radiation parameterisation procedure proposed by the FAO is not appropriate for northern European conditions.
A comparison of the evapotranspiration showed that the different procedures within the models for implementing crop kc factors were contributing significantly to the variability of the overall water balance. Therefore the work group decided to harmonize the procedures by implementing a common procedure in which the year was divided into four periods (harvest to emergence, emergence to maturity, maturity to senescence, and senescence to harvest) and a constant kc factor was assigned to each of the four periods. Changes will be made to the models and shells to implement this procedure.
The work group is still examining other changes to harmonise the water balance. In the absence of a crop, evaporation from bare soil is predicted differently in the different models. The procedure used in PEARL, based on Boesten and Stroosnijder (1986), will be used as the standard and the depth of evaporation parameter in PELMO and PRZM will be adjusted to give approximately the same amount of soil evaporation during the time the crop is not present. Whether and how to include runoff is a topic currently a topic of discussion within the work group. The work group expects to generate irrigation files using an irrigation routine in one of the leaching models. Irrigation schedules will be developed for each crop, compared to a group of crops in the FOCUS (2000) scenarios. Irrigation schedules will also be added for some crops in Sevilla. If necessary, irrigation amounts will be calibrated to the actual amounts of irrigation used in the region. The PRZM and PELMO models will be changed to allow for input of irrigation schedules (in the past irrigation was combined with rainfall) and irrigation will not be subject to runoff.
HIGHER TIER MODELLING APPROACHES
The work group remit included higher tier modelling approaches involving GIS. The work group report outlines the principles for spatially distributed modelling and as mentioned earlier presents two different GIS based approaches for creating crop specific scenarios. The work group report provides information on European-wide data sets that could be useful in performing GIS analyses. The report also discusses several approaches, including a detailed discussion of inverse modelling, that combine the results of both field or lysimeter studies with modelling. The work group report also presents a detailed discussion of non-equilibrium sorption, including recommendations for implementation in regulatory submissions.
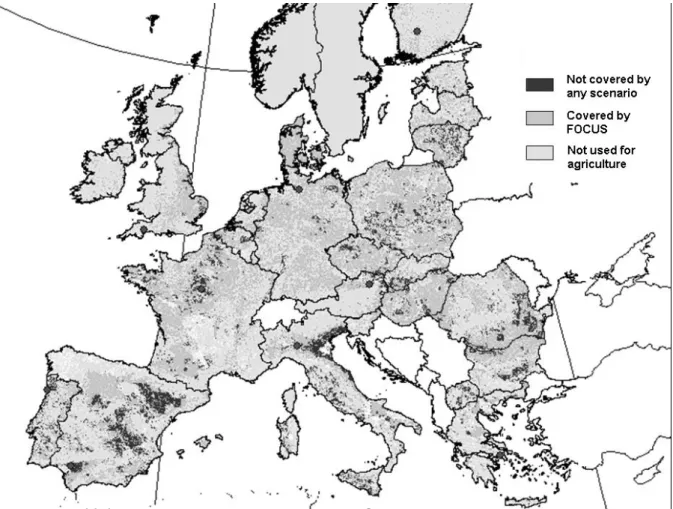
APPLICABILITY OF THE EXISTING SCENARIOS TO THE NEW MEMBER STATES The FOCUS (2000) scenarios were developed when the European Union consisted of 15 countries. Since that time ten additional counties have joined. Therefore the work group assessed whether the FOCUS (2000) scenarios ‘cover’ the agricultural area of new member countries. A scenario ‘covers’ an area when it represents either the same properties or represents a more vulnerable situation like higher rainfall amounts or lower organic carbon contents. The spatial analysis shows that the current set of FOCUS leaching scenarios is applicable to new member states for the purpose of Tier 1 screening simulations. Some smaller areas (shown in Figure 2), located both in the original 15 member states and in the newer ten member states are not covered by current scenario properties. Note that in Figure 2, Sweden and Cypus are indicated as not being used for agriculture because the Corine Land Cover includes no information for these countries. In a number of areas shown in Figure 2 as not being used for agriculture, there are areas of agricultural land but the resolution and size of the map is not sufficient to indicate these areas. The areas indicated as not being covered by any scenario could have soil properties either less vulnerable or more vulnerable than the FOCUS scenario for this climatic zone.
FUTURE WORK
The tasks remaining for the work group are to complete the harmonisation of the water balance and make the necessary changes in the models and associated shells to implement the harmonised crop kc, runoff, and irrigation approaches. Then predictions obtained with the old and new scenarios will be compared. Finally, the predictions of each model for each location/crop combination will be compared. After this information is available the final report will be completed and submitted for review by member states and EFSA. The work group is working towards completing the report for review by mid-2008.
REFERENCES
Boesten, J.J.T.I., 2004. Influence of dispersion length on leaching calculated with PEARL, PELMO and PRZM for FOCUS groundwater scenarios. Pest Manag Sci. 60, 971-980.
Boesten, J.J.T.I., Stroosnijder, L., 1986. Simple model for daily evaporation from fallow tilled soil under spring conditions in a temperate climate. Netherlands Journal of Agricultural Science 34, 75-90
FOCUS, 2000. FOCUS groundwater scenarios in the EU pesticide registration process. Report of the FOCUS Groundwater Scenarios Workgroup, EC Document Reference Sanco/321/2000 rev 2. 202pp.
Vanclooster, M., Pineros-Garcet, J.D., Boesten, J.J.T.I., Van den Berg, F., Leistra, M., Smelt, J., Jarvis, N., Roulier, S., Burauel, P., Vereecken, H., Wolters, A., Linnemann, V., Fernandez, E., Trevisan, M., Capri, E., Padovani, L., Klein, M., Tiktak, A., Van der Linden, A., De Nie, D., Bidoglio, G., Baouroui, F., Jones, A., Armstrong, A.. 2003. Effective approaches for assessing the predicted environmental concentrations of pesticides. Final report. Printed by
the Université Catholique de Louvain, Belgium (Available at
http://www.geru.ucl.ac.be/recherche/projets/apecop-pub/).
Vanderborght, J., Vereecken, H.. 2007a. Review of Dispersivity Lengths for Transport Modeling in Soils. Vadose Zone J. 6:27-51.
Vanderborght, J., Vereecken, H.. 2007b. One-Dimensional Modeling of Transport in Soils with Depth Dependent Dispersion, Sorption, and Decay. Vadose Zone J. 6:140-148.