RIVM report 250912003/2005
Bacillus cereus: characteristics, behaviour in the gastro-intestinal tract, and interaction with
LM Wijnands, JB Dufrenne, FM van Leusden
This investigation has been performed by order and for the account of Food and Consumer Product Safety Authority (VWA), within the framework of project 250912, Quantitative research of Bacillus cereus within the scope of hazard characterization and exposure assessment, and within the Fifth European Community Framework Programme, within the framework of project QLK1-CT-2001-00854, Bacillus cereus: Preventing Bacillus cereus foodborne poisoning in Europe; detecting hazardous strains, tracing contamination routes and proposing criteria for foods.
RIVM, P.O. Box 1, 3720 BA Bilthoven, telephone: 31 - 30 - 274 91 11; telefax: 31 - 30 - 274 29 71
Rapport in het kort
Bacillus cereus: algemene karakteristieken, gedrag in maagdarmkanaal en interactie
met Caco-2 cellen.
Door het eten van voedsel dat besmet is met de bacterie Bacillus cereus kan diarree ontstaan. Onderzoek naar de bacterie zelf en het ziekmakend proces hebben geleid tot meer kennis over het optreden van de ziekte.
Allereerst zijn stammen van de bacterie op grond van specifieke karakteristieken ingedeeld. Hierbij is onder andere gebruik gemaakt van kunstmatig darmsap en lichaamstemperatuur om de groeimogelijkheden van de verschillende stammen Bacillus cereus goed te kunnen bepalen.
Daarnaast bleek dat slechts een beperkt aantal stammen ziekte kunnen veroorzaken. Dit zijn voornamelijk stammen die goed groeien bij 37ºC en die zich goed kunnen aanpassen aan omstandigheden zoals die voorkomen in de dunne darm.
Een essentiële stap in het ziekmakend proces blijkt de hechting van de Bacillus cereus aan de wand van de dunne darm te zijn. Dit proces is in het onderzoek nagebootst met Caco-2 cellen. Daarnaast kunnen de cellen van de dunne darm aanzetten tot ontkieming en vermenigvuldiging van Bacillus cereus sporen. Sporen zijn bacteriecellen die zich in een soort sluimerstand bevinden.
In een wetenschappelijke publicatie zullen gegevens worden gepubliceerd ten aanzien van het vóórkomen van Bacillus cereus bacteriën in voedsel.
Trefwoorden: Bacillus cereus, algemene karakteristieken, ziekmakend vermogen, dunne
Abstract
Bacillus cereus: characteristics, behaviour in gastro-intestinal tract, and interaction
with Caco-2 cells.
The consumption of food contaminated with the bacterium Bacillus cereus may lead to diarrhoea. Investigation of characteristics of the bacterium and the pathogenesis increased knowledge regarding the onset of disease.
Strains of Bacillus cereus were categorised according to specific characteristics. Besides artificial media to determine the growth characteristics of the strains, simulated intestinal fluid and human body temperature were used.
Diarrhoeal disease is mainly caused by strains which grow well at 37ºC and which adapt easily to small intestinal conditions.
Adhesion of Bacillus cereus to the epithelium of the small intestine appears to be of vital importance for the onset of disease. Moreover, epithelial cells are able to induce germination of Bacillus cereus spores. These are forms of the bacterium able to withstand a variety of adverse conditions, such as dryness and heat.
Data on the occurrence of Bacillus cereus in food commodities in The Netherlands will be published elsewhere.
Key words: Bacillus cereus, general characteristics, pathogenesis, small intestine,
Contents
Samenvatting 6
Summary 7
1. Introduction 9
2. Characteristics of Bacillus cereus 11
2.1 Introduction 11
2.2 Materials and Methods 11
2.3 Results 14
2.4 Discussion 16
2.5 Conclusions 17
3. Behaviour of Bacillus cereus in the gastro-intestinal tract under simulated circumstances 19
3.1 Introduction 19
3.2 Materials and Methods 19
3.3 Results 23
3.4 Discussion 28
3.5 Conclusions 33
4. Interaction between Bacillus cereus and differentiated Caco-2 cells (as a model for the epithelium of
the small intestine) 35
4.1 Introduction 35
4.2 Materials and Methods 36
4.3 Results 38
4.4 Discussion 40
4.5 Conclusions 42
5. General discussion and conclusion 43
References 45
Appendix 1 Simulated gastric and intestinal fluid 49
Appendix 2 Characteristics of Bacillus cereus 53
Appendix 3 Behaviour of Bacillus cereus in the gastro-intestinal tract under simulated
circumstances 63
Appendix 4 Interaction between Bacillus cereus and differentiated Caco-2 cells (as a model for the epithelium of the small intestine) 83
Samenvatting
Bacillus cereus is een bacterie die bij vóórkomen in voedsel twee typen aandoeningen kan
veroorzaken: het braaksyndroom en het diarreesyndroom. De bacterie kan voorkomen als vegetatieve cel, maar ook als spore. Dit rapport handelt voornamelijk over het diarreesyndroom.
Omdat de ziekteverschijnselen van het diarreesyndroom over het algemeen vrij mild van aard zijn en vrij kort duren, wordt zelden een arts geraadpleegd. Daardoor is het moeilijk een goede schatting van het optreden van dit syndroom te maken. Om een betere schatting van het vóórkomen te maken zijn gegevens nodig omtrent de aanwezigheid van B. cereus in voedsel en gegevens ten aanzien van het ziekmakend mechanisme. Ook gegevens over karakteristieke eigenschappen van B. cereus zijn van belang.
Gegevens ten aanzien van het vóórkomen van B. cereus in voedsel in Nederland zullen elders worden gepubliceerd. In dit rapport wordt voornamelijk ingegaan op het ziekmakend mechanisme.
In hoofdstuk 1 van dit rapport wordt een aantal karakteristieken van circa 30 B. cereus stammen op een rij gezet. Dit betreft vooral gegevens over groeisnelheden en aanpassingsfasen bij diverse temperaturen. Op basis van deze gegevens is een begin gemaakt om de stammen in te delen in psychrotrofe (i.e. stammen die kunnen groeien bij temperaturen < 10°C, maar niet zo goed bij 37°C) en mesofiele stammen (i.e. stammen met goede groei bij 37°C, maar geen groei bij temperaturen < 10°C). Het bleek echter moeilijk op basis van deze gegevens een duidelijk onderscheid te maken tussen psychrotrofe en mesofiele stammen. Groeisnelheden en aanpassingsfasen gemeten in media die de in vivo situatie zo dicht mogelijk benaderen, zoals het gebruik van gesimuleerd darmsap in plaats van artificieel cultuurmedium, maken een beter onderscheid tussen psychrotrofe en mesofiele stammen mogelijk. Tevens blijkt uit ons onderzoek dat de hittegevoeligheid van sporen van psychrotrofe stammen groter is dan die van sporen van mesofiele stammen.
Hoofdstuk 2 van het rapport behandelt het gedrag van B. cereus in het maagdarmkanaal. Experimenten met gesimuleerd maag- en darmsap wijzen uit dat mesofiele stammen beter bestand zijn tegen de omstandigheden in het maagdarmkanaal dan psychrotrofe stammen. Niet alleen de temperatuur is daarbij van belang, ook de samenstelling van de inhoud van de dunne darm speelt een rol.
In hoofdstuk 3 van dit rapport wordt nader ingegaan op de interactie tussen B. cereus en het epitheel van de dunne darm, het voornaamste doelwit van de enterotoxinen van B. cereus. Dit onderzoek is uitgevoerd met een cellijn die het epitheel simuleert. Cellen van B. cereus blijken te kunnen hechten aan het epitheel van de dunne darm, hetgeen een voorwaarde lijkt voor het optreden van ziekteverschijnselen. Daarnaast kunnen dunne darmcellen sporen van
B. cereus aanzetten tot ontkieming, een noodzakelijke stap om tot groei en de daaraan
gerelateerde productie van toxinen over te kunnen gaan.
Samenvattend kan worden gesteld dat gegevens met experimenten, die de in vivo situatie zoveel mogelijk benaderen, leiden tot andere uitkomsten in risicoschattingen dan wanneer gegevens worden gebruikt die verkregen zijn in experimenten met algemene media.
Summary
Bacillus cereus may cause two types of food borne disease: an emetic syndrome and a
diarrhoeal syndrome. Complicating factor is that the organism may occur as vegetative cell, and as heat resistant spore. In this report mainly the diarrhoeal syndrome will be dealt with. The symptoms of the diarrhoeal syndrome are not very severe and of short duration. Therefore, few ill people will see a physician. This leads to a too low estimation of incidence of the disease. To improve this estimation data on occurrence of B. cereus in food commodities and data on the pathogenic mechanism are necessary. Also data on the characteristics of B. cereus are of importance. Data on occurrence will be published elsewhere, this report deals mainly with the pathogenic mechanism and characteristics.
Chapter 1 is a compilation of data on growth speed and lag phase of circa 30 B. cereus strains determined in artificial culture medium. These data were used to discriminate between psychrotrophic (i.e. strains able to grow at temperatures below 10°C, but with poor growth at 37°C) and mesophilic strains (i.e. strains that do not grow at temperatures below 10°C, but grow well at 37°C). Determination of growth speed and lag phases in simulated intestinal fluid proved to show better discrimination between psychrotrophic and mesophilic strains. Our researches show heat sensitivity of spores to be related to the growth temperature profile of the strains. Spores of psychrotrophic strains appear to be more heat sensitive than spores of mesophilic strains.
The behaviour of spores and vegetative cells in the gastro-intestinal tract is the subject of research in chapter 2 of this report. Using simulated fluids, the mesophilic strains appear better to withstand the gastro-intestinal environment than psychrotrophic strains. Not only temperature plays a role, also the composition of the intestinal fluid is of importance.
In the last part of this report the interaction between the epithelium of the small intestine (simulated by using a human cell line) and B. cereus is investigated. Spores and vegetative cells are able to adhere to the epithelial cells, apparently a prerogative for the onset of diarrhoeal disease. Moreover, the epithelial cells are able to induce germination of spores of
B. cereus, an important step before start of growth and subsequent enterotoxin production..
Overall can be concluded that the outcome of a risk assessment is more realistic using data from experiments closely relating the in vivo situation instead of data from a more artificial design.
1.
Introduction
The genus Bacillus consists of Gram positive, spore forming microorganisms that are ubiquitously distributed in the environment. The genus is subdivided in three groups based upon cellular morphology and physiological properties. Group 1, the Bacillus cereus group, consists of B. cereus, B. thuringiensis, B. mycoides, B. pseudomycoides, B anthracis, and
B. weihenstephanensis. Several species from this group receive special attention as either
suspect or proven pathogens. B. thuringiensis is well known and widely used as insecticidal agent; B. anthracis is well known as the agent that causes anthrax, a disease that may affect mammals; B. cereus is known to cause food borne disease.
The close relationship of this group is emphasized by their similarity on DNA-level (Daffonchio et al., 1998; Helgason et al., 2000).
B. cereus can cause two forms of food borne disease, an intoxication or emetic syndrome, and
a toxico-infection or diarrhoeal syndrome (Kramer and Gilbert, 1989). For both syndromes the incubation time and the duration are relatively short. As a consequence many patients do not see physicians, which leads to an underestimation of the number of cases. Nevertheless cases of food borne disease caused by B. cereus comprise yearly around 4% of the total number of food borne diseases, as reported through the Food and Consumer Safety Authority (Duynhoven et al., 2005). The majority of these reports concern the emetic syndrome, since outbreaks of this syndrome usually involve two or more individuals at the same time. The diarrhoeal syndrome is thought to involve usually individual cases, but no hard figures on this are available.
The incubation time of the emetic syndrome varies between 30 minutes and 5 hours, the duration of symptoms usually is 24 hours. The pathogenesis of this syndrome is well known: emetic toxin (or cereulide) is produced by B. cereus in the incriminating food commodity prior to consumption. After ingestion of the contaminated food, the toxin reaches the small intestine, activating a 5HT-3 receptor and thus triggering emesis (Agata et al., 1995).
The incubation time of the diarrhoeal syndrome varies between 6 – 24 hours, and the duration of symptoms is around 24 hours (Kramer and Gilbert, 1989; Granum, 1994). The pathogenesis of the diarrhoeal syndrome is more complicated. B. cereus cells (spores and/or vegetative cells) are ingested with contaminated food. After passing the stomach and reaching the small intestine B. cereus must grow and produce enterotoxins that are responsible for the diarrhoeal symptoms. Many aspects concerning the pathogenesis of this syndrome, however, need more clarification. These include growth characteristics from B.
cereus in food, survival and growth of B. cereus in the gastro-intestinal tract and the
interaction between B. cereus and the epithelium of the small intestine. This report is concerned solely with the diarrhoeal syndrome, the emetic syndrome is discussed elsewhere.
This report is a compilation of various investigations regarding: 1) characteristics of B. cereus that are of importance to survival during preparation of food, 2) behaviour of B. cereus in simulated gastro-intestinal conditions in order to estimate the influence of physical conditions on the survival and growth of B. cereus, and 3) the interaction between B. cereus and differentiated Caco-2 cells as a model for epithelial cells of the small intestine being the target site for the enterotoxins. Data regarding the prevalence of B. cereus in food commodities in the Netherlands will be published elsewhere (Wijnands et al., in preparation a).
Most investigations have been carried out with a set of twelve strains to mimic the diversity of B. cereus.
2.
Characteristics of Bacillus cereus
2.1
Introduction
Bacillus cereus is a microorganism that can grow at a great variety of temperatures, ranging
from psychrophilic to thermophilic strains, strains able to grow at very low or very high temperatures, respectively (Kramer and Gilbert, 1989).
Within the framework of food safety and human disease, only a limited number of strains is of importance. After processing, food is often stored at refrigerator temperatures (4 - 10°C), and strains able to grow or survive at these temperatures may be of importance. Since the main steps in the diarrhoeal syndrome occur in the gastro-intestinal tract, strains able to grow at 37°C and higher are also of importance.
The potential of strains to grow at certain temperatures is most obviously determined by assessing growth rate at the temperature of interest. However, recently a molecular biological method has been described (Stetten et al., 1998), which is able to discriminate between strains able to grow below 7°C (psychrotrophic stains) and strains unable to grow below 7°C (mesophilic strains). This PCR method is based on small differences in base sequence in the 16S rDNA of the strains. Such differences have not only been found in B. cereus strains, but also in B. thuringiensis, and B. mycoides.
The ability of Bacillus strains to form spores plays an important role in the concept of food safety. Spores are highly resistant to environmental influences, and therefore attention must be paid to the type and duration of processes in food preparation. Heating is a process step often included in food preparation. Where bacterial vegetative cells do not survive proper heating, spores are much more heat resistant and their elimination requires more drastic measures. Therefore, more knowledge on the heat resistance of spores is of importance.
2.2
Materials and Methods
2.2.1 Strains
The strains that were selected for research are described in Table A.2.1 (see Appendix 2). The “Sensor project” (De Wit et al., 2001) was a population-based cohort study on gastroenteritis in the Netherlands. NVH is the Norwegian School on Veterinary Science, INRA is the French National Institute for Agronomic Research, DSMZ is the German Collection of Microorganisms and Cell Cultures, NCTC is the British National Collection of Type Cultures.
2.2.2 Spore production
B. cereus strains (see Table A.2.1) were grown on polymyxine pyruvate egg yolk mannitol
bromothymol blue agar (PEMBA) (Holbrook and Anderson 1980) for 48 hours at 30ºC. Colonies were collected, suspended in and washed with sterile demineralized water until milky white. The spores were suspended in physiological salt solution, heated 10 minutes at 80ºC and stored at -70ºC or -20°C in physiological salt solution in 1.5 ml vials (1 ml per vial), or stored in 30% glycerol in physiological salt solution in 1.5 ml vials containing glass beads at -70ºC or -20°C.
2.2.3 Growth characteristics
2.2.3.1 Growth characteristics in Brain Heart Infusion broth
Growth at 10°C
A glass bead from the -20°C spore stock of each strain was transferred to a tube containing 10 ml BHI-broth. Following incubation at 30°C (18-24 hours), 100 μl BHI-culture was transferred to 50 ml BHI-broth in a 60 ml infusion bottle (precooled at 10°C), and placed in a 10°C water bath (the water bath was placed in a room conditioned at 4°C). Strains were checked every 24 hours for turbidity. The optical density at 600 nm (OD600) was measured from the moment the first signs of turbidity were visible. When the OD600 was more than 0.7, the sample was diluted in physiological salt solution before measurement. The OD600 was measured until no changes were seen for more than two days. Purity of the culture after the experiment was checked by culture on Columbia agar with sheep blood (Oxoid) at 30°C during 18-24 hours. Experiments were conducted in duplicate.
Since most of the OD 600 values in the experiments at 10oC did not exceed the 0.100 value, growth characteristics were also assessed in separate experiments by making decimal dilutions of samples, plating these on Trypton Soy Agar (TSA), and incubating the plates 18-24 hours at 30°C. These experiments were carried out twice, with 12 strains out of the 30 strains of the initial selection, based on their growth at 28 and 37oC.
Growth at 28°C, 37°C, and 42°C
The method at these temperatures differed from the growth experiments at 10°C at the following points: 1) the temperatures of the water bath were 28°C, 37°C, or 42°C, and 2) the duration of the experiments was 10 hours at 28°C, and 8 hours at 37°C and 42°C. Most experiments were conducted in duplicate.
2.2.3.2 Growth characteristics in simulated intestinal fluid
Growth at 37°C
Growth of B. cereus strains at 37°C in complete simulated intestinal fluid (SIF, including bile salts and pancreatic juice, described in Appendix 1 was carried out with 12 strains (see 2.2.3.1, Growth at 10oC). These strains have been selected from the strains used for the growth characteristics in BHI based on their growth profiles and PCR results. These twelve strains were also used for further experiments regarding investigations into the pathogenic pathway of the diarrhoeal syndrome. Simulated intestinal fluid was prepared based on a
previously described method (Rotard et al., 1995), and pipetted in 60 ml infusion bottles (50 ml per bottle).
After thawing of the spores (from the -70°C stock in physiological salt solution) at room temperature, 100 µl spore suspension was added to 50 ml SIF (preheated at 37°C). Bottles were kept at 37°C in a water bath. Samples were taken at t=01, 1, 2, 3, and 4. From the samples the number of colony forming units were determined by plating 10-fold dilutions in duplicate on Trypton Soy Agar (TSA), and incubating the plates 18-24 hours at 30°C. Purity of the spores was assessed by plating samples at t=0 and t=4 on Columbia agar with sheep blood (Oxoid).
2.2.3.3 Evaluation of results and calculations
All OD600 and culture data of the experiments were collected in Excel-files. The OD600 values were transformed to LN (natural logarithm). These data were plotted, and a straight line was calculated. The generation time was calculated as follows: LN2/RC = generation time. The lag phase was calculated as follows: LN(intersection with the y-axis)/RC = lag phase.
When using the culture data, the data were plotted, and preferably in the logarithmic part of the curve Excel calculated the linear equation. Both the generation time and the lag phase were determined as described for the OD 600 data.
The generation times and lag phases for all strains are shown in this report.
2.2.4 Growth temperature profile
Two methods were used to determine whether strains were psychrotrophic or mesophilic, namely a PCR-method based on a difference in 16S rDNA signature between psychrotrophic and mesophilic strains (Stetten et al., 1998) and a culture method in which growth at 10°C and 37°C were the main parameters.
2.2.4.1 Determination of growth temperature profile by PCR
The method was carried out as previously described (Stetten et al., 1998). Briefly, B. cereus strains were grown in Brain Heart Infusion (BHI) broth, overnight at 30°C. A PCR mixture was made as follows: 5 μl 10x PCR-buffer (Roche Molecular Biochemicals), 1.5 mM MgCl2, 200 µM of each of the deoxynucleoside triphosphates, 300 µM of each primer [MF, UR, UF, and PR, according to von Stetten (Stetten et al., 1998)], 2.5 units AmpliTaQ polymerase (Roche Molecular Biochemicals), 1 μl template DNA (= 1 μl BHI-culture), and sterile Milli-Q water to a final volume of 50 μl. The PCR was carried out in a Hybaid thermal cycler (Thermo Electron Corporation) with the following program: 2 minutes at 94°C (1 cycle), 30 cycles of 15 seconds at 94°C/15 seconds at 55°C/15 seconds at 72°C, and finally 2 minutes at 72°C. The PCR products were analyzed by electrophoresis in a 2 % agarose gel, using a 100 bp ladder. The psychrotrophic strains display a band at 130 bp, the mesophilic strains a band of 250 bp. Intermediate strains may display both bands.
2.2.4.2 Determination of growth temperature profile by culture at various temperatures
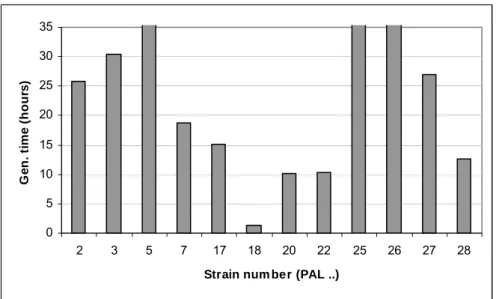
For these determinations the data on growth characteristics at 10°C, 37°C, and 42°C, as described under chapter 1.2.3.1, were used. These temperatures are most important in determining whether strains are mesophilic or psychrotrophic. The generation time data were plotted in bar-graphs.
2.2.5 Heat resistance of Bacillus cereus spores
The heat resistance of B. cereus spores was determined as previously described (Dufrenne et
al., 1994). Briefly, six glass tubes with screw cap with rubber inlay, each containing 7 ml
phosphate buffered physiological salt solution (0.07M, pH 7.2), were submerged in a water bath at the desired temperature. Spores, stored at -20°C and thawed at room temperature, were added and incubated for 25, 20, 15, 10, 5 and 0 minutes (for each time period a different tube was used). After the indicated time, all tubes were placed on melting ice until further research. Samples from each tube were investigated by plating 100 µl of decimal dilutions in duplicate on Trypton Soy Agar (TSA), and incubating the plates 18-24 hours at 30°C.
The temperatures at which the heat resistance was measured were 80°C, 85°C, 87.5°C, 90°C, 95°C, and 97.5°C. From the colony counts plotted against time, D-values at each temperature were determined for each strain. Not each temperature was applied to each strain, but for each strain at least three different temperatures were used to obtain an inactivation curve from which the D-value could be calculated. Also, dependant on the results or expected results, the time periods, in which measurements were made, were varied.
2.2.6 Statistical analysis
Statistical analyses were performed in Excel (Microsoft) using the t-test: two-sample assuming unequal variances.
2.3
Results
For figures and tables mentioned in this chapter see Appendix 2.
2.3.1 Determination of generation times using BHI
The results of the calculations of the experiments for determining the growth characteristics are shown in Tables A.2.2 to A.2.6. The Tables A.2.2, A2.2.4, A2.2.5, and A2.2.6 are based on OD 600 measurements at 10°C, 28°C, 37°C, and 42°C in BHI, respectively. The OD values at 10°C in BHI did not exceed the 0.100, and were regarded as unreliable. Therefore, the experiments at 10°C were repeated, growth was monitored by culturing samples on TSA-plates, and the results of these experiments are shown in Table A.2.3. Also the generation
times at 10°C, 37°C and 42°C are shown in Figures A.2.1, A.2.2 and A.2.3, in which the strains with immeasurable generation times are shown as having a very long generation time. The results for some strains have not been shown (see Tables A.2.2 and A.2.6, strains with the indication “n.d.”), since growth of these strains took so long that these experiments were stopped and the results were not recorded. Therefore, the generation times and lag phases could not be determined reliably. In Figures A.2.1, A.2.2 and A.2.3, that show the results at 10°C, 37°C and 42°C respectively, these unreliable generation times are shown as bars exceeding the generation time used for the Y-axis.
In the legend at the bottom of Tables A.2.2, A.2.4, A.2.5 and A.2.6 the 95% confidence intervals for the mean generation times and the mean lag phases are mentioned. Strains with generation times smaller than the interval grew well at the indicated temperature, strains with generation times above the interval grew poorer at the indicated temperature. Also the lag phases were taken into consideration. Strains were considered psychrotrophic based upon good growth and short lag phase at 10°C, and poorer growth and long lag phases at 37°C and 42°C. Mesophilic strains were generally characterized by poorer growth and long lag phases at 10°C, and good growth and short lag phases at 37°C and 42°C. For example, strain PAL 2 has a relative short mean generation time and an average lag phase at 10°C (Table A.2.2), at 37°C both generation time and lag phase are on average, and at 42°C both parameters are below average. Combined with the corresponding lag phases PAL 2 was considered to be mesophilic. Therefore, from the tables and the figures the growth temperature profile of the strains can be distinguished. Strains PAL 17, PAL 18, PAL 20, and PAL 22 have relatively low generation times at 10°C, and relatively high generation times at 37°C. The differences with the rest of the strains is not significant (P>0.05), but the tendency is clear. Also, strain PAL 17 has a high generation time at 42°C. These four strains were, based on these results, designated as psychrotrophic. Also in the PCR-method these strains showed to be psychrotrophic.
For the experiments at 10°C in BHI with culture of samples only a limited number of strains has been used. This selection was based on the results in BHI at 42°C, 37°C and 10°C with OD-measurement, where not only the OD 600 was measured with the spectrophotometer, but also growth and turbidity were assessed visually: the OD from bottles with non turbid BHI was not yet measured to prevent the occurrence of cross-contamination.
The results at 28°C are the least discriminative, as they were carried out near the optimal growth temperature of B. cereus., and therefore not taken into consideration for determining the growth temperature profile.
2.3.2 Determination of generation times using simulated intestinal fluid
In Table A.2.7 the results of the calculations for determining generation time and lag phase are presented for the same limited number of strains used to determine these characteristics at 10°C in BHI with culture of samples. Two strains (PAL 3 and PAL 7) showed no growth at all, and therefore no generation time or lag phase could be determined (indicated by “n.g.“). In general short generation times correspond with short lag phases.These experiments were conducted later than the growth experiments in BHI, when the limited selection of strains had already been divided in psychrotrophic and mesophilic, based on the growth characteristics and PCR-results.
In Figure A.2.4 the results from the calculations of the generation times have been plotted in a graph. The psychrotrophic strains (PAL 3, PAL 17, PAL 18, and PAL 20) appear to have higher generation times than the mesophilic strain with the exception of strain PAL 25. Two psychrotrophic strains (PAL 7 and PAL 22) did not show growth in simulated intestinal fluid at 37°C, and therefore no bars are shown for these two strains. The P-value of a t-test is slightly higher than 0.05, and therefore the difference between he mesophilic strains (minus strain PAL 25) and the psychrotrophic strains is not significant.
2.3.3 Determination of growth temperature profile by PCR
From the results of the growth experiments growth temperature profile of the various strains can be derived. Most important temperatures were 10°C, 37°C, and 42°C. Not only the generation time is of importance, also the lag phase adds to determine growth temperature profile. (See also section 3.2).
In Table A.2.8 the results are shown. A distinction is made on the basis of PCR-signature between psychrotrophic (p) and mesophilic (m) strains.
2.3.4 Heat resistance of spores
In Table A.2.9 and Figure A.2.5 the results of the determination of heat resistance of spores of various strains at various temperatures are shown, represented as D-values in minutes. In Figure A.2.5, the data from Table A.2.9 are shown separately for psychrotrophic (x) and for mesophilic strains (▲), irrespective of the strain number. The individual strains are not shown, but this graph shows the difference in D-values between mesophilic and psychrotrophic strains in a different manner. From Figure A.2.5 can be derived that, in general, the mesophilic strains have higher D-values than the psychrotrophic strains. The difference at 90°C, the only temperature with data of all twelve strains, is not significant (p>0.05), but the tendency in Figure A.2.5 is clear.
2.4
Discussion
The generation times of strains PAL 17, PAL 18, PAL 20, and PAL 22 at 37°C in BHI are significantly higher, and based upon these data these strains may be called psychrotrophic. At 10°C the data are less discriminative. Some strains do indeed show a sufficiently high deviation from the mean generation time to call them mesophilic (PAL 2, PAL 27) or psychrotrophic (PAL 20, PAL 22). But in general the outcomes are not very clear. Strain 3 appears to be mesophilic from the results at 10oC, but has in the PCR-test a clear psychrotrophic signature.
The growth temperature profile of strains PAL 17, PAL 18, PAL 20, and PAL 22, as detected in growth experiments at 37ºC, is confirmed by the PCR test, where these strains show the
psychrotrophic signature. Psychrotrophy of strain PAL 3 can be derived form the results at 37°C and 42°C: at both temperatures this strain fails to grow (as indicated in Figures A.2.2 and A.2.3 by the lacking bars). From the results at 42°C, see Figure A.2.3, there is a strong indication that strain PAL 7 is psychrotrophic. The results for these two strains are confirmed by the PCR-test where both strains show psychrotrophic signatures. From the graphs in Figures A.2.2 and A.2.3 can be read that strains PAL 25, PAL 26, PAL 27, and PAL 28 have low generation times, indicating mesophily of these strains. These results are confirmed by the PCR test.
The growth experiments at 37°C in simulated intestinal fluid (SIF) confirm the results obtained with the other techniques and seem to be more discriminative. Although the difference is not significant due to the aberrant behaviour of strain PAL 25, there is a clear tendency for the psychrotrophic strains to grow slower (as indicated by higher generation times, see Table A.2.7 and Figure A.2.4) than the mesophilic strains. Moreover, two psychrotrophic strains, PAL 7 and PAL 22, do not even grow in SIF.
The difference in heat resistance between psychrotrophic spores and mesophilic spores can best be seen in Figure A.2.5. The heat resistance of mesophilic spores is consequently higher at each of the temperatures at which both types of spores have been tested. At only one temperature all strains have been tested; i.e. 90°C. At this temperature the results, and more specific the differences between psychrotrophic and mesophilic strains, are not significant (0.05<p<0.1). There is however a strong tendency that the D-values of the mesophilic strains are higher at each temperature than the D-values of the psychrotrophic strains.
Bacillus cereus is a species with a large variety of strains. This variety is not only expressed
in the growth characteristics at different temperatures, as described in this part of the report. The variety is also expressed in the differences in heat resistance of the spores.
Such information is of importance in risk assessment, when conclusions have to be drawn on the potential health risk of, for example, food preparation processes. One always has to bear in mind the large variety of properties of the species.
2.5
Conclusions
The results with growth experiments at various temperatures are generally in concordance with the results by PCR growth temperature profile: the same strains are named psychrotrophic or mesophilic. The PCR results present a black and white discrimination, where the classification based upon growth is less discriminative.
The results of the growth experiments in simulated intestinal fluid confirm and emphasize the differences between psychrotrophic and mesophilic strains. We conclude that data from experiments in simulated intestinal fluid, resembling more closely the in vivo situation, are better suitable for modeling than data from tests in culture media.
The differences in growth temperature profile are also expressed in the differences in heat resistance of spores. Although the difference is not significant, spores from mesophilic strains are generally more heat resistant than spores from psychrotrophic strains.
3.
Behaviour of Bacillus cereus in the
gastro-intestinal tract under simulated circumstances
3.1
Introduction
The mechanism of the diarrhoeal syndrome is believed to be as follows: food contaminated with B. cereus, spores and/or vegetative cells, is consumed. Spores pass the stomach, reach the small intestine, germinate, grow, and produce the enterotoxins. Vegetative cells are believed to be very susceptible to stomach conditions, and will therefore hardly reach the small intestine.
However, during food consumption the pH in the stomach rises. The highest pH and the subsequent drop after ingestion of the food depend on the type and amount of food (Russell et
al., 1993; Dressman et al., 1990). The lapse of pH after the ingestion of three types of food
(solid, intermediate and fluid) and the role of age in the lapse of pH after food intake have been described before (De Jonge et al., 2003). During food uptake the pH in the stomach may reach values at which vegetative cells of B. cereus may survive, and subsequently reach the small intestine. There they may grow and thus contribute to the onset of disease. Results concerning the possible contribution of vegetative cells to the pathogenesis of B. cereus will be discussed elsewhere (Wijnands et al., in preparation b).
Aim of these investigations was twofold, namely to confirm the hypothesis that spores pass the stomach unharmed and germinate and grow in the small intestine, and to confirm that the gastric conditions have a negative effect on survival of vegetative cells before they are transferred to the small intestine. All studies are to be performed in vitro. As the human gastro-intestinal tract is a very complicated organ it is nearly impossible to mimic the exact circumstances and physiological properties. Our set up includes the use of artificial gastric and intestinal fluids. A variety of formulations used to simulate the gastric environment can be found in the literature (Anonymous, 1995; Cooper et al., 1995; Longland et al., 1977). For the experiments described in this report, formulations were used as previously described for the determination of heavy metals after ingestion (Rotard et al., 1995).
3.2
Materials and Methods
3.2.1 Strains.
The twelve Bacillus cereus strains used for these experiments are described in Table A.3.1 (Appendix 3). The strains were grown on MEYP2-agar (Mossel et al., 1967) and subsequently tested for glucose fermentation, acetylmethylcarbinol production according to Voges-Proskauer, nitrate-reduction and gelatin turn-over. Purity was checked by plating the strains on Columbia agar with sheep blood and incubating overnight at 30°C. The growth
temperature profile of the strains was established by a previously described method based on polymerase chain reaction (Stetten et al., 1998).
3.2.2 Spore production.
Pure Bacillus cereus strains were grown on PEMBA3-agar (Holbrook and Anderson 1980) for 48 hours at 30°C. Spores were collected by scraping colonies from the plates, using distilled water, and centrifugation (10 minutes 1800xg). Washings and centrifugation were continued until the suspension was milky white (generally 4 times). After the final centrifugation step, the spores were suspended in physiological salt solution, heated 10 minutes at 80ºC, and stored in 1.5 ml vials (1 ml per vial) at -70ºC. Spore counts were performed after the final suspension of spores in physiological salt solution, but the final suspensions were not adjusted to equal spore concentrations before storage and experiments.
3.2.3 Production and use of vegetative cells in gastro-intestinal
experiments
Stationary phase vegetative cells were produced by inoculating 10 ml BHI with a glass bead with spores from the –70ºC stock and incubating the inoculated BHI at either 30ºC or 37ºC, dependent on the growth temperature profile of the strain (psychrotrophic strains were incubated at 30ºC, mesophilic strains at 37ºC). The incubation-time in BHI was circa 5 hours. Subsequently the strains were inoculated in Luria Bertani Glucose broth (LBG) (pH 7.0) and incubated overnight. Psychrotrophic strains at 30ºC, mesophilic strains at 37ºC.
Log phase vegetative cells were produced by inoculation of 10 ml BHI with a glass bead with spores from the –70ºC stock and overnight incubation at 30ºC (psychrotrophic strains) or 37ºC (mesophilic strains). Subsequently, LBG-broth was inoculated with BHI culture (0.2 ml BHI-culture to 25 ml LBG broth). The strains were incubated for 4 hours at either 30°C or 37°C dependent on their growth temperature profile characteristics and used in the gastro-intestinal experiments. For experiments with gastric fluid 0.2 ml LBG-culture was added to 50 ml SGF4, for intestinal experiments 0.2 ml LBG-culture was added to 50 ml SIF5. For combined experiments 0.2 ml LBG-culture was added to 50 ml SGF, whereafter 1 ml of the inoculated SGF was added to 50 ml SIF. All experiments involving SGF or/and SIF were performed at 37ºC.
3.2.4 Simulated gastric and intestinal fluids
The simulated gastric and intestinal fluids are based on previously described formulations (Rotard et al., 1995) and the composition of (each of the components for) simulated gastric fluid (SGF) and simulated intestinal fluid (SIF) is described in Appendix 1.
3 PEMBA = polymyxin pyruvate egg yolk mannitol bromothymol blue 4 SGF = simulated gastric fluid
3.2.5 Evaluation of survival and growth
Samples, taken during the experiments, were investigated for the total number of colony forming units (vegetative cells and spores, i.e. total count) and for the number of spores (i.e. spore count) after heating the 10x diluted original samples for 10 minutes at 80°C. Ten-fold dilutions of the samples in physiological salt solution containing 0.1% (w/v) peptone were plated in duplicate on Trypton Soy Agar. Agar plates were incubated overnight (i.e. 18 – 20 hours) at 30°C, and numbers of colonies were recorded from countable plates (15 < x < 150 per plate). The means of the duplicates of total and spore counts were calculated and used for further evaluations.
All experiments were carried out with all twelve strains, unless mentioned otherwise.
3.2.6 Behaviour of Bacillus cereus spores and vegetative cells in gastric
conditions
After thawing, spores were suspended in 50 ml simulated gastric fluid (SGF) at pH 2.5 for 60 minutes at 37°C in a water bath. Samples were taken at the start of the incubation (t=0), after 30 minutes (t=30) and at the end of the incubation period (t=60). From the samples the total number of viable cells and the number of spores were determined.
Vegetative cells, both stationary phase and exponential phase cells, were suspended in SGF of various pH, with and without pepsin. At regular time intervals samples were taken for colony counts. The length of the time intervals was adjusted to the expected survival of the cells, i.e. the lower the pH the lower the expected survival the shorter the time intervals. From the colony counts D-values were calculated, being the time in minutes necessary to decrease at a certain pH the colony count with one log-unit.
3.2.7 Behaviour of Bacillus cereus spores and vegetative cells in
intestinal conditions
After thawing, spores were suspended in 50 ml simulated intestinal fluid (SIF) at pH 7.8 +/- 0.3 in a water bath at 37ºC for 4 hours. Vegetative cells (stationary or exponential phase), prepared as described before, were suspended in 50 ml simulated intestinal fluid (SIF) at pH 7.8 +/- 0.3 in a water bath at 37ºC for 4 hours. Samples were taken at the start of the experiment (t=0) and at each hour afterwards, expressed in minutes (t= 60, 120, 180, and 240). Samples were investigated for total number of viable cells and numbers of spores. Vegetative cells, stationary phase and exponential phase, were suspended in the various formulations of SIF including complete SIF, and at regular time intervals samples were taken for colony counts. The colony counts were plotted and from the slope of the resulting graphs generation times in minutes were calculated.
3.2.8 Behaviour of spores and vegetative cells in simulated
gastro-intestinal transfer
After thawing, spores were suspended in 50 ml SGF at pH 2.5. After one hour incubation at 37ºC, 1 ml SGF suspension was transferred to 50 ml SIF and incubated further for 4 hours at 37ºC.
Samples were collected at the start of the experiment in SGF (t=0 SGF), after 60 minutes incubation in SGF (t=60 SGF), immediately after transfer to SIF (t=0 SIF) and every hour during incubation in SIF, expressed in minutes (t=60 SIF, 120 SIF, 180 SIF, and 240 SIF). Similar experiments, with SGF of pH 1.0 and of pH 4.0, were carried out with one psychrotrophic and one mesophilic strain.
Stationary and exponential phase cells of the mesophilic strains and stationary phase cells of the psychrotrophic strains were exposed to pH 2.5 in 50 ml SGF. After 30 minutes 1 ml SGF was transferred to 50 ml complete SIF. At regular time intervals (see above, but note that exposure to gastric conditions lasted for 30 instead of 60 minutes) samples were collected for colony counts. The colony counts in complete SIF were recalculated to compensate for the 50-fold dilution of the SGF after transfer to complete SIF.
Exponential phase psychrotrophic cells were not included in this experiment because the yield of cells after 4 hours of incubation in LBG-MOPS at pH 7.0 grown at 37°C was too low.
3.2.9 Influence of low temperature storage on behaviour of spores and
vegetative cells in simulated gastro-intestinal transfer
Since food commodities are often stored in refrigerators, the influence of such treatment on the behaviour of spores in simulated gastro-intestinal conditions was investigated. Following incubation at 10ºC overnight, spores were exposed to SGF at pH 2.5 and subsequently to SIF. Samples were collected and investigated as described before. These experiments were carried out with spores from psychrotrophic strains 7, 18, and 22 and mesophilic strains 2, 5, and 27. Comparable experiments were carried out stationary phase vegetative cells from the same strains. No exponential phase cells were used for these experiments.
3.2.10 Influence of pH of gastric fluid on the behaviour of spores and
vegetative cells in simulated gastro-intestinal transfer
Most experiments have been carried out at pH 2.5. However, since the pH in the stomach may vary between nearly 1 and nearly 5, preincubation of spores at pH 1.0 and pH 4.0 was used to assess the subsequent behaviour in SIF. For these experiments spores from one psychrotrophic strain (PAL 22) and one mesophilic strains (PAL 27) were used. Apart from the pH of the simulated gastric fluid, the design of the experiments was the same as described before.
Comparable experiments were carried out with stationary phase vegetative cells from psychrotrophic strains PAL 7, 18, and 22, and mesophilic strains PAL 2, 5, and 27.
3.2.11 Reproducibility of experiments
The simulated gastric and intestinal fluids had to be produced freshly for each experiment. In addition, a limited number of strains that could be tested on one day. Therefore, a variety of batches of simulated fluids were used. To assess the reproducibility of results between tests, spores of strain PAL 2 were subjected to the tests in each experiment in which spores were involved, and served therefore as an internal control.
3.3
Results
In Appendix 3 figures and tables referring to this chapter can be found.
In general, when colony counts of < 10 were detected, for graphs and calculations this number of cfu was represented by 1.
3.3.1 Behaviour of spores and survival of vegetative cells in SGF
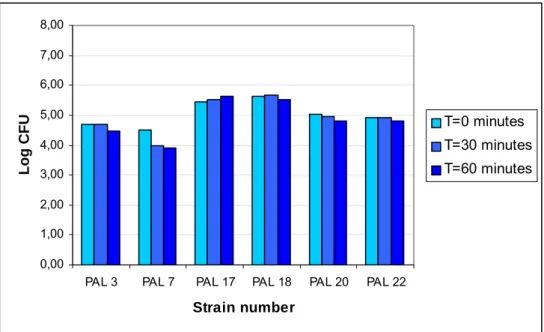
In Figures A.3.1 and A.3.2 the effect of exposure of spores of psychrotrophic strains and mesophilic strains respectively to pH 2.5 in simulated gastric fluid with pepsin is shown. Only total counts are reported, at t=0, t=30 minutes and t=60 minutes. The counts are reported in logarithms of the colony count (log CFU). Since germination and growth are impossible under these circumstances, the small “increases” and “decreases” of the total counts of the strains in Figure A.3.1 and A.3.2 are more an indication of the margin of error in colony count. Therefore, only strain PAL 7 (see Figure A.3.1), with a decrease of nearly one log-unit in the total counts, appears to be slightly affected by pH 2.5 in simulated gastric fluid.
Taking the same margin of error into account as with the psychrotrophic strains, none of the mesophilic strains show increase or decrease of the colony counts during the total time of exposure, indicating that pH 2.5 in simulated gastric fluid does not affect the spores of the mesophilic strains.
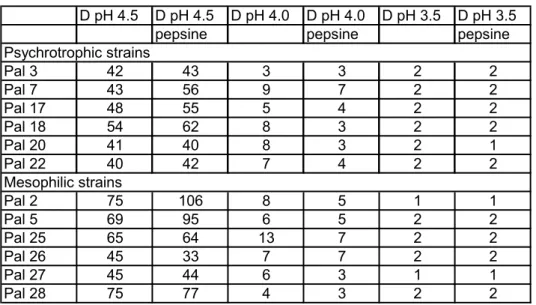
The results of survival of vegetative cells, stationary phase and exponential phase, at low pH values in SGF are described in tables 2 and 3 respectively. The results are presented as D-values in minutes, i.e. time in minutes in which the colony count decreases with one log-unit. The stationary phase cells appear to be more acid tolerant. This can be derived from the difference in D-values of the stationary phase cells at pH 4.0 (Table A.3.2) compared with the D-values of the exponential phase cells at pH 4.0 (Table A.3.3). The average D-value of the stationary phase cells at pH 4.0 is about 10 times higher than the average D-value of the exponential phase cells. At pH 3.5 these differences in D-value become less apparent for most of the strains. In general the mesophilic exponential phase cells appear to be more acid tolerant than the psychrotrophic exponential phase cells, because the average D-value without pepsin for the mesophilic strains at pH 4.5 is 62 minutes, whereas for the psychrotrophic strains the average D-value at pH 4.5 is 45 minutes (see Table A.3.3). Also with pepsin there is such difference in average D-values. At pH 4.0 with the stationary phase cells (see Table
A.3.2), the differences in average D-values between the stationary phase mesophilic and psychrotrophic strains are much smaller (see Table A.3.2).
3.3.2 Behaviour of spores and vegetative cells in complete SIF
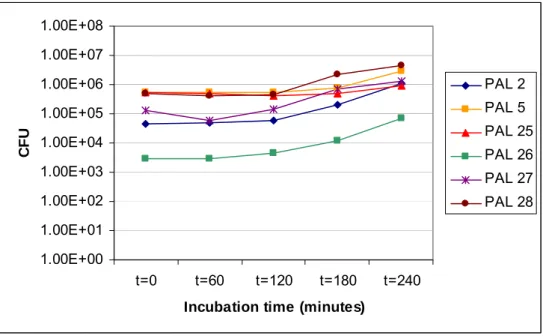
The effect of exposure of spores to complete SIF during 4 hours (= 240 minutes) is depicted in Figures A.3.3, A.3.4, A.3.5 and A.3.6. The incubation time is set at the X-axis, the colony counts on a logarithmic scale at the Y-axis. Figures A.3.3 and A.3.4 show the results of total and spore counts respectively when spores of the psychrotrophic strains were used. In Figures A.3.5 and A.3.6 the results of total and spore counts respectively for the spores of the mesophilic strains are shown. From the psychrotrophic strains only strains PAL 17 and PAL 18 show a slight increase in total count during the time of the experiment (see Figure A.3.3). These are also the strains that show the highest degree of germination, since the spore count from both these strains after 1 hour of exposure drops more than 1 log unit (see Figure A.3.4). From the mesophilic strains only strain PAL 25 shows hardly any increase in total count (see Figure A.3.5). This is also reflected by the lack of decrease in spore count of this strain indicating that hardly any germination took place (see Figure A.3.6). Also strain PAL 5 does not show any measurable decrease in spore count (Figure A.3.6), although contrary to strain PAL 25 strain PAL 5 does show an increase is total count indicating growth in the complete simulated intestinal fluid (Figure A.3.5).
Mesophilic strain PAL 26 shows a remarkable decrease in spore count over the duration of the experiment (see Figure A.3.5). This spectacular decrease is not reflected in an equal increase in total count (see Figure A.3.6).
The results of the investigations concerning the behaviour of vegetative cells in simulated intestinal fluid (SIF), in SIF with bile salts, in SIF with pancreatin, and in complete SIF (= SIF with bile salts and pancreatin) are shown as generation times, calculated from the colony counts at regular time intervals, in Tables A.3.4 and A.3.5 for stationary phase and exponential phase cells, respectively.
Generation times over 120 minutes were recorded as >>>, since the slope of the graph ( and therefore the increase in numbers of cfu) was so small that the errors in the calculations would be too high.
As can be derived from Tables A.3.4 and A.3.5 the addition of bile or pancreatin results in higher generation times for exponential and stationary phase cells. In complete SIF (with bile and pancreatin) the generation times are higher than in SIF (i.e. no bile and pancreatin included).
For the stationary phase cells of the psychrotrophic strains all generation times are over 120 minutes, while only one stationary phase mesophilic strain (PAL 2) has a generation time over 120 minutes (see Table A.3.4). In the exponential phase two psychrotrophic strains show generation times of over 120 minutes (see Table A.3.5). No mesophilic strain in exponential phase shows generation times of more than 120 minutes.
3.3.3 Behaviour of spores and vegetative cells in complete SIF after
exposure to pH 2.5 in SGF
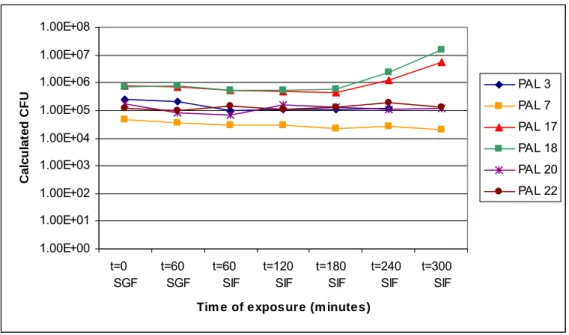
The effect of exposure of spores to complete SIF after exposure to pH 2.5 in SGF (simulating passage through the stomach into the small intestine) is depicted in Figures A.3.7, A.3.8, A.3.9 and A.3.10. Figures A.3.7 and A.3.8 show the results of total and spore counts of the psychrotrophic strains. The results of the total and spore counts of the mesophilic strains are depicted in Figures A.3.9 and A.3.10. In all figures the colony counts in the complete SIF are calculated values and shown on a logarithmic scale at the Y-axis as a function of exposure time at the X-axis. In the experiment only 1 of 50 ml of SGF was transferred to 50 ml complete SIF, causing a 50-fold drop in actual colony count. In order to compensate for this drop in colony count the colony counts for the complete SIF were recalculated by multiplying them with a factor 50. As in the experiment in complete SIF, in this combination experiment the psychrotrophic strains PAL 17 and 18 show an increase in total colony count during the time of the experiment (see Figure A.3.7). These are also the strains that show the highest degree of germination, as can be derived from the decrease in spore count throughout the course of the experiment (see Figure A.3.8).
From the mesophilic strains strain PAL 5 shows hardly any increase in total count (see Figure A.3.9). This corresponds to the lack of decrease in spore count of this strain indicating that hardly any germination took place (see Figure A.3.10). Also strain PAL 25 does not show any decrease in spore count (Figure A.3.10), although contrary to strain PAL 5 strain PAL 25 does show an increase is total count indicating growth in the complete SIF (Figure A.3.9). All other mesophilic strains show both increase in total counts and decrease in spore count.
The vegetative cells were exposed to complete SIF after 30 minutes of exposure to pH 2.5 in SGF. In Figures A.3.19 and A.3.20 the results are shown for the stationary phase cells (psychrotrophic and mesophilic strains respectively), and in Figure A.3.21 the results for the exponential phase of all the mesophilic strains. In all three figures calculated values for the numbers of cfu in SIF are shown to compensate for the transfer of 1 ml SGF to 50 ml SIF. To indicate the effect of transfer of cells from pre-incubation medium to SGF, the colony counts of the starting material have also been incorporated in the figures. Immediately after transfer of cells from the pre-incubation medium to SGF a sample was taken of the SGF to determine the loss of viability upon exposure to SGF. From the stationary phase cells of the psychrotrophic strains only strain PAL 7 does not seem to recover from the low pH-shock after 4 hours in complete SIF; from the stationary phase mesophilic cells PAL 5 does not recover after 4 hours of exposure in complete SIF.
The experiments with exponential phase cells in complete SIF after exposure to pH 2.5 in SGF were carried out only with the mesophilic strains since the psychrotrophic strains grew so slow at 37°C prior to exposure to SGF that the numbers were too low to give reliable results (see Figure A.3.21). The experiment involving strain PAL 26 was unsuccessful. Exponential phase cells seem to be more susceptive to low pH than stationary phase cells because only two of the five strains grew after 4 hours of exposure in complete SIF, while
five out of six strains in stationary phase showed growth after 4 hours (compare Figures A.3.20 and A.3.21).
3.3.4 Influence of different pH’s in SGF on the behaviour of spores in
complete SIF
The experiments described in section 2.3.3 have been carried out at pH 2.5 in SGF preceding the exposure to complete SIF. To investigate the influence of other pH’s in SGF one psychrotrophic and one mesophilic strain have been exposed in SGF to pH 1.0, 2.5 and 4.0 prior to transfer to complete SIF. In figures 11 and 12 the results are shown. Here too, the colony counts in complete SIF have been recalculated to compensate for the dilution step during transfer from SGF to complete SIF. Only total counts are shown on a logarithmic scale at the Y-axis as a function of exposure time on the X-axis. The colony counts of the psychrotrophic strain (PAL 22) after exposure to pH 1.0 appear to be affected, indicated by the slightly lower colony counts (see Figure A.3.11). Between the colony counts after exposure to pH 2.5 and pH 4 respectively no difference can be observed. All in all no increase in colony count can be observed, indicating that this psychrotophic strain is unable to germinate and grow in simulated intestinal conditions.
Exposure to pH 1 in SGF appears to decrease the number of viable spores from the mesophilic strain (PAL 27). However, the ability to germinate and grow is not affected (see Figure A.3.12). Preincubation at pH 1 appears to lead to lower generation times after germination of the spores, but spore counts are lower than after pre-exposure to pH 2.5. In Figure A.3.12 this phenomenon can be derived from the smaller slope of the curve between t=180 and t=300. From the colony counts, on which the graphs in figure 12 are based, could be calculated that the generation time between t=180 and t=300 is 45 minutes with pH 1.0 preincubation, versus 29 and 24 minutes with pH 2.5 and pH 4.0 preincubation respectively. The experiments involving exposure of stationary phase cells to SGF at pH 2.5 and subsequent exposure to SIF were repeated with a limited number of strains at pH 4.0 (60 minutes exposure) and at pH 1.0 (5 minutes exposure) in SGF. The results are shown in Figures A.3.22 to A.3.25, with calculated cfu values at logarithmic scale at the Y-axis due to compensation for the transfer of 1 ml SGF to 50 ml SIF. The calculated cfu values are shown as function of the time of exposure in SGF/SIF. All three psychrotrophic and mesophilic strains that were used for this experiment, show growth after 4 hours in complete SIF following the 60 minute exposure at pH 4.0 in SGF (see Figures A.3.22 and A.3.23). Exposure to pH 1.0 resulted in a lower number of growing strains after transfer to complete SIF, namely two psychrotrophic and two mesophilic strains (see Figures A.3.24 and A.3.25). Also growth appears to be reduced.
3.3.5 Reproducibility of experiments with spores and vegetative cells
In order to give an indication of the reproducibility of experiments with spores, the results obtained with strain PAL 2 are shown in Figures A.3.13 and A.3.14, total counts and spore counts respectively. The colony counts is SIF are calculated values to compensate for thetransfer of 1 ml SGF to 50 ml complete SIF. The colony counts are shown at a logarithmic scale on the Y-axis as a function of the time of exposure in minutes at the X-axis. To assess the reproducibility of the experiments the total counts and the spore counts of the repeated experiments with strain 2 (Figure A.3.7), involving the exposure of spores to gastric fluid followed by incubation in intestinal fluid, were log transformed. Per sample point in time the average and standard deviation were calculated. The results were considered to be reproducible when the standard deviation per sampling point in time was within 0.25 log unit (95% confidence interval ± 0.5 log unit). At all time points the standard deviation was ≤ 0.25 (the maximum standard deviation found in the total counts was 0.21, in the spore counts 0.25).
Therefore, the reproducibility of the experiments is considered to be satisfactory.
The reproducibility of the experiments with vegetative cells is shown in Table A.3.7. The generation times of strain PAL 2, that was used in each experiment, show for the stationary phase and the exponential phase cells in SIF and complete SIF good correlations. Although for the stationary phase cells in complete SIF nothing can be concluded, since all generation times are over 100 minutes. From these results can be read that repeated production of the intestinal fluid does not influence the outcome of the experiments.
All experiments in SIF were always carried out together with SIF without additions as control experiment. Therefore from all twelve strains there are triplicate results in SIF. Here too, from the numbers of cfu over the exposure time, growth rates and generation times were calculated. The generation times can be read from Table A.3.8. Using linear regression in the statistical program SAS, straight lines were drawn through the log cfu/time points, using the least squares method. The slopes of the different curves (= rate of growth) were compared and the p-value of the observations under the hypothesis of parallelism calculated. A significance level of 0.05 was used to test this hypothesis. The calculations were carried out twice, once using all the cfu data, and once using only the reliable data, i.e. data from counts between 15 and 150 colonies per plate (see chapter 3.2.5). The results in terms of p-value per strain were exactly the same for both calculations. Therefore, the result of only one calculation [= p-value per strain per growth phase using all data points plus the indication whether parallelism of the different growth curves (≡ generation time) per strain could be proven] is shown in Table A.3.9. From this table can be read that only the p-value for the exponential phase cells from strain PAL 20 is smaller than 0.05, and therefore the hypothesis of parallelism is rejected for this strain. As can be seen in Table A.3.8 the calculated generation time separate lines are not parallel.
3.3.6 Influence of storage at 10
°
C on the behaviour of spores and
vegetative cells in SGF and SIF
In Figures A.3.15 to A.3.18 the results are shown of the experiments involving incubation of spores at 10°C prior to exposure to pH 2.5 in SGF and subsequent exposure to complete SIF. Figures A.3.15 and A.3.16 depict the results for the psychrotrophic strains, total counts and spore counts respectively. In Figures A.3.17 and A.3.18 the results for the mesophilic strains
are shown, also total counts and spore counts respectively. Again, the colony counts in SIF, total and spore, are calculated values to compensate for the transfer of 1 ml SGF to 50 ml SIF. The colony counts are shown at logarithmic scale at the Y-axis, as a function of the time of exposure in minutes at the X-axis. The spore counts for both the psychrotrophic and the mesophilic strains have not been performed for all time points, as indicated at the X-axis. As can be seen from Figures A.3.17 and A.3.18 the behaviour of the mesophilic strains is comparable to their behaviour in the experiment without preincubation at 10°C (see Figures A.3.9 and A.3.10). From the psychrotrophic strains (see Figures A.3.15 and A.3.16) strain PAL 7 reacts very different compared to the experiment without preincubation at 10°C (see Figures A.3.7 and A.3.8). The other psychrotrophic strains (PAL 18 and PAL 22) show comparable results without and with preincubation at 10°C (compare figures A.3.7 and A.3.8 with A.3.15 and A.3.16).
Like spores stationary phase vegetative cells were subjected to overnight exposure to 10°C prior to exposure to pH 2.5 in SGF and subsequent transfer to complete SIF. The results of these experiments are shown in Figures A.3.24 and A.3.25, for the psychrotrophic and the mesophilic strains respectively. Again, on the Y-axis calculated values for the numbers of cfu at a logarithmic scale are shown due to compensation for the transfer of 1 ml SGF to 50 ml SIF. The X-axis shows the time of exposure in SGF/SIF. From the three psychrotrophic strains that were used for this experiment only strain 18 appeared to grow after 4 hours of incubation in complete SIF (see Figure A.3.24). From the three mesophilic strains two grew after 4 hours of incubation in complete SIF (see Figure A.3.25).
3.3.7 Comparison of generation times in BHI and SIF
Differences between growth of vegetative cells in BHI and SIF at 37°C are shown in Table A.3.6. The generation times are longer in SIF than in BHI for both the psychrotrophic and the mesophilic strains.
3.4
Discussion
3.4.1 Discussion of the results
The diarrhoeal syndrome caused by Bacillus cereus is a toxico-infection. In other words,
Bacillus cereus (vegetative cells or spores) must be ingested, must grow in the small intestine
and subsequently produce enterotoxins that are responsible for the onset of the disease symptoms. Because Bacillus cereus may occur as vegetative cells and as spores, the fate of both types of cells during passage through the gastro-intestinal tract has been subject of this study.
In food both psychrotrophic and mesophilic strains can be found, therefore both types of strains have been used for the current investigations. At first, the results will be discussed for the spores and vegetative cells separately, and finally the impact of the obtained results on the risk of disease will be discussed.
In Figures A.3.1 and A.3.2 the behaviour of spores of psychrotrophic and mesophilic strains during exposure to pH 2.5 in simulated gastric fluid (SGF) is shown. The variation in counts at the various time points is all within one log-unit without any regular trend, not upward nor downward. From this can be concluded that during the 60 minute exposure the total number of spores measured as colony forming units does not change.
Two notable observations from the experiments regarding survival of vegetative cells in SGF (see Tables A.3.2 and A.3.3) can be made. Firstly, a sharp drop in survival with the decrease of 0.5 unit in pH. And secondly, the pH below which the D-values sharply drops, differs for stationary phase cells and exponential phase cells. The stationary phase cells appear to be more acid-tolerant than the exponential phase cells, regardless of the growth temperature profile (psychrotrophic or mesophilic) of the strains.
Comparison of Tables A.3.2 and A.3.3 (columns on D pH 4.0 and D pH 4.5) also shows the influence of the addition of pepsin to the SGF. When taking a closer look at the stationary phase cells at pH 4.0 (Table A.3.2), the D-values of the investigated psychrotrophic strains appear to drop more dramatically upon addition of pepsin than the D-values of the mesophilic strains. The influence of pepsin on the exponential phase cells at pH 4.5 appears to be different: pepsin appears to increase the D-values of circa 60% of the tested strains. It should be mentioned that other phenomena also may be of influence here. Firstly, pH 4.5 is a condition at which Bacillus cereus may actually grow instead of staying alive or even die. And secondly, the influence of pepsin decreases with increasing pH (the optimal working pH is 1.5). At the other pH values used for these researches the influence of the addition of pepsin to SGF is less apparent.
After passing the stomach spores reach the small intestine. The pH of the small intestine is near neutral, and, even before food reaches the small intestine, bile salts and pancreatic juice are secreted into the small intestine (Marieb, 1998). In Figures A.3.3 to A.3.6 the results are described of exposure of spores to complete simulated intestinal fluid (complete SIF). Total cell- and spore counts have been performed in order to discover what happens to the spores. From the graphs in Figure A.3.3 can be concluded that spores from two of the six psychrotrophic strains (namely PAL 17 and PAL 18) germinate in complete SIF and grow slightly. In Figure A.3.4 can be seen that the spore counts of all six strains show some degree of decrease; this can been interpreted as germination of spores of all strains. However, for four of the six psychrotrophic strains the conditions in the small intestine appear to be unfavorable for growth of germinated spores (see Figure A.3.3).
The spores of the mesophilic strains, however, all show growth during exposure to complete SIF, although strains PAL 5 and PAL 25 lag behind (see Figure A.3.5). Contrary to the other four mesophilic strains the spore counts of the samples of strains PAL 5 and PAL 25 show hardly any decrease. This means that the germination efficiency was very small, The spore count of strain PAL 26 (see Figure A.3.6) drops more dramatic than of the other strains, while the total count does not increase proportionally. No explanation can be given for this phenomenon.
From these results it can be concluded that spores of both types of strains (psychrotrophic and mesophilic) appear to be capable to germinate under conditions simulating the small intestine. Subsequently all mesophilic strains appear to be able to grow, whereas only two of six psychrotrophic strains appear to show growth. This is another report of differences between psychrotrophic and mesophilic strains, comparable to differences in heat susceptibility between the two types of strains (Dufrenne et al., 1995, chapter 1 of this report).
The effect of exposure to simulated intestinal fluid with and without the addition of pancreatin and bile (either separately or in combination) is expressed in generation times in minutes in Tables A.3.4 and A.3.5. The addition of additives (pancreatic juice, bile salts, pancreatic juice plus bile salts) to simulated intestinal fluid (SIF) has an adverse effect on the stationary phase cells of psychrotrophic and mesophilic origin although the effect on the latter is less dramatic. This can be deducted from the fact that the generation times of all six psychrotrophic strains reach values of over two hours (see Table A.3.4). The effect on exponential phase cells is less dramatic (see Table A.3.5). The generation times of two of the six psychrotrophic strains increase to over 2 hours, whereas the generation times of the other four strains also show an increase, which is however less dramatic. The increases in generation times for the mesophilic exponential phase cells are, apart from strain PAL 2 with the addition of bile, less than with the mesophilic stationary phase cells. From the separate additions bile seems to induce the largest increase in generation time. For all strains, psychrotrophic as well as mesophilic in exponential and in stationary phase, the generation times increase upon the addition of bile. The addition of pancreatin, on the contrary, appears to have less influence. For most strains an increase in generation time can be observed. Apart from the stationary phase psychrotrophic strains, the effect of co-exposure to bile salts and pancreatin, as in complete SIF, appears to be smaller than the effect of each of the additions separately.
The previously described differences between spores of psychrotrophic and mesophilic strains are confirmed by the experiments in which spores were first exposed to low pH in SGF and subsequently transferred to complete SIF. The results of these experiments are shown in Figures A.3.7 and A.3.8 for the psychrotrophic strains, and in Figures A.3.9 and A.3.10 for the mesophilic strains. Again, like in the experiment with complete SIF alone, the psychrotrophic strains PAL 17 and PAL 18 are able to germinate and grow in SIF after exposure to SGF (Figure A.3.7), while the other psychrotrophic strains show no increase in total numbers.
However, pre-exposure to pH 2.5 of spores from the mesophilic strains appears to be favorable for subsequent growth in SIF. Comparing Figures A.3.5 and A.3.9, the total counts at t=300 SIF in figure 9 appear to be higher than the total counts at t=240 in figure 5. However, contrary to the findings in complete SIF alone, PAL 25 shows proper growth after prior exposure to low pH in SGF. Due to the missing value at t=300 in SIF it is hard to draw conclusions on the behaviour of this strain in complete SIF after exposure to SGF at low pH.