RIVM Letter report 2019-0124
Selection and ranking of chemical
substances and consumer products
based on a consumer product database
To be used in the NVWA analysis on the supply chain of consumer productsRIVM Letter report 2019- 0124
Page 2 of 39
Colophon
© RIVM 2019Parts of this publication may be reproduced, provided acknowledgement is given to the: National Institute for Public Health and the Environment, and the title and year of publication are cited.
DOI 10.21945/RIVM-2019-0124 M. Woutersen (author), RIVM S. Wijnhoven (author), RIVM F. Affourtit (author), RIVM Contact:
Marjolijn Woutersen
Centre for Safety of Substances and Products (VSP) marjolijn.woutersen@rivm.nl
This investigation was performed by order, and for the account, of the Netherlands Food and Consumer Product Safety Authority, within the framework of “kennisvraag 9.5.1. Keten Risicobeoordeling
consumentenproducten”.
This is a publication of:
National Institute for Public Health and the Environment
P.O. Box1 | 3720 BA Bilthoven The Netherlands
Synopsis
Selection and ranking of chemical substances and consumer products based on a consumer product database
To be used in the NVWA analysis on the supply chain of consumer products
This report describes the results of an analysis of chemical substances in products used by Dutch consumers. The Netherlands Food and
Consumer Product Safety Authority (NVWA) will use the results to determine the risks in the supply-chain of consumer products.
The analysis is based on queries in the ISA database. This database has been built as a tool for retailers (in particular do-it-yourself stores). The queries investigated the use of chemical substances in consumer
products. These products are mainly do-it-yourself products, but also cleaning agents, adhesives, and cosmetics. Included in the queries were substances with a hazard classification or potential endocrine disrupting properties. The database contains over 18.000 consumer products that contain at least one hazardous substance. In total 274 hazardous substances were found that are used in consumer products. These substances and products have been scored and ranked on hazard and exposure.
The product group with the highest total product score is ‘paint’, followed by ‘construction materials’ and ‘cosmetics’. Paint and
construction materials contain a relatively high number of hazardous substances. These are product groups with many different products. The substance with the highest total score was ethanol, mainly due to its widespread use. The substances with the highest hazard scores are pesticides and metal compounds, which are carcinogenic and reprotoxic, such as thiacloprid, diuron, an organotin compound, and lead chromate. In addition to the substances, also products are classified by their
manufacturers. There is a difference between the classification of the substances and classification of the products. A product with a
carcinogenic substance does not have to be classified as carcinogenic if the concentration of the classified substance is sufficiently low. In addition, the classification of some substances depends on the presence or absence of specific impurities. For example, the level of benzene in petroleum compounds determines whether they should be classified as carcinogenic.
Keywords: chain analysis, consumer products, chemical substances, classification, hazard, exposure, risk
Publiekssamenvatting
Selectie en rangschikking van chemische stoffen en
consumentenproducten op basis van een consumentenproducten database
Voor gebruik in de NVWA risicoanalyse keten consumentenproducten Dit rapport beschrijft de resultaten van een analyse van chemische stoffen in producten die Nederlandse consumenten gebruiken. De
Nederlandse Voedsel en Warenautoriteit (NVWA) gebruikt de uitkomsten om te bepalen óf en welke risico’s er zijn in de keten
consumentenproducten.
De analyse is gebaseerd op zoekopdrachten in de ISA database. Deze database is opgesteld om verschillende leveranciers (vooral
bouwmarkten) te helpen. Hierin is gezocht naar de aanwezigheid van chemische stoffen in consumentenproducten. Het gaat daarbij vooral om doe-het-zelf producten, schoonmaakmiddelen, lijmen en cosmetica. Daarnaast is geselecteerd op stoffen met een gevaarsclassificatie of met mogelijk hormoonverstorende eigenschappen. In de database komen meer dan 18.000 consumentenproducten voor die minimaal één gevaarlijke of mogelijke gevaarlijke stof bevatten. Van de onderzochte (mogelijk) gevaarlijke stoffen komen er 274 voor in
consumentenproducten. Deze stoffen en producten zijn gescoord en gerangschikt op basis van gevaarseigenschappen en blootstelling. De groep met de hoogste totale score is ‘verf’, gevolgd door
‘bouwmaterialen’ en ‘cosmetica’. In verf en bouwmaterialen zitten een relatief groot aantal (mogelijk) gevaarlijke stoffen. Dit zijn
productgroepen met veel verschillende producten. De stof met de hoogste totale score is ethanol, vooral omdat dit in veel producten zit. De meest schadelijke stoffen in consumentenproducten zijn bepaalde pesticiden en metalen die kankerverwekkend en schadelijk voor de voortplanting zijn, zoals thiacloprid, diuron, een organotinverbinding en lood chromaat.
Naast de stoffen zijn ook de producten geclassificeerd door de fabrikant. Er is een groot verschil tussen de classificatie van stoffen en de
producten. Een product met een mogelijk kankerverwekkende stof erin hoeft niet als kankerverwekkend geclassificeerd te worden als de
concentratie van deze stof heel laag is. Ook bij stoffen is de classificatie soms afhankelijk van de aan- of afwezigheid van specifieke vervuilingen. Bijvoorbeeld het gehalte benzeen in petroleumderivaten bepaalt of deze al dan niet als kankerverwekkend geclassificeerd moeten worden. Kernwoorden: ketenanalyse, consumentenproducten, chemische stoffen, classificatie, schadelijkheid, blootstelling, risico
Contents
Summary — 9 1 Introduction — 11 2 Methodology — 13
2.1 Selection of hazardous substances in products from the ISA database — 13
Lists with substances used as search criteria — 13 2.1.1
2.2 Running the queries in the Quintens’ ISA database — 14 2.3 Derivation of the scores for prioritisation — 15
Hazard score — 15 2.3.1
Exposure score — 17 2.3.2
Scoring of the substances — 21 2.3.3
Scoring of the product groups — 21 2.3.4
Note regarding the differences with the prioritisation tool from 2.3.5
Woutersen et al. — 22
3 Limitations regarding the methodology of the study — 23
3.1 The ISA database — 23
3.2 Selection of the substances — 23 3.3 Hazard score — 23
3.4 Exposure score — 24
4 Results and discussion — 25
4.1 Overview outcome search in ISA — 25 Substances in individual products — 25 4.1.1
Substances in product groups — 26 4.1.2
Classification of substances and product classifications — 28 4.1.3
4.2 Outcome of product and substance scores — 30 Substances with the highest total score — 30 4.2.1
Substances with highest hazard scores — 30 4.2.2
Substances used in most product groups — 31 4.2.3
Product groups with the highest score — 31 4.2.4
The difference between CLP and SZW classifications — 32 4.2.5
Cosmetics — 33 4.2.6
4.3 Implications for the risk analysis of the chain of consumer products — 33
4.4 Recommendations for further investigation — 34
5 Acknowledgements — 37 6 References — 39
Summary
In order to improve the choices in surveillance activities of the
Netherlands Food and Consumer Product Safety Authority (NVWA), the Risk Assessment & Research Office (BuRO) of the NVWA is currently carrying out supply-chain-oriented risk assessments.
This report provides input for the supply chain-analysis of chemical risks of consumer products. Targeted search queries were carried out in a large ISA (Informatie Systeem Artikelen) database of the company Quintens, which includes information on a large variety of consumer products of different retailers in the Netherlands. These products are mainly do-it-yourself products, but also cleaning agents, adhesives, and cosmetics. Included in the queries were substances with harmonised classifications, SZW classifications (classified by the Dutch department of Social Affairs and Employment) and potential endocrine disruptors. In total 274 substances were found in > 18,000 consumer products. Both substances and products were ranked based their hazard and exposure. The product group with the highest total product score was paint, followed by construction materials and cosmetics. The substance with the highest total score was ethanol, due to its SZW classification for Reprotoxicity and Carcinogenicity in combination with its widespread use. It should be noted that it is not compulsory to use the SZW
classifications in product labelling. The second highest scoring substance is the pesticide thiacloprid, due to its harmonised classification for Carcinogenicity, Reproductive toxicity, and STOT SE (Specific Target Organ Toxicity Single Exposure).
In general, the substances with the highest hazard scores were pesticides and metal compounds.
There is a difference between the classification of the substances and classification of the products, as a product does not have to be classified if the concentration of the classified substance is sufficiently low. In addition, the classification of some substances depends on the presence or absence of specific impurities, such as benzene in petroleum
1
Introduction
Consumer products contain a wide range of chemical substances. To ensure the safety of the use of consumer products in daily life, it is important to know what substances are used in which concentrations in the various categories of products available on the consumer market. The Netherlands Food and Consumer Product Safety Authority (NVWA) conducts investigations and monitoring activities to control the safety of consumer products.
The NVWA aims to perform risk based supervision. To this end, the Office for Risk Assessment & Research (BuRO) of the NVWA is currently carrying out supply-chain-oriented risk assessments
( https://www.nvwa.nl/over-de-nvwa/hoe-de-nvwa-werkt/integrale-ketenanalyses, in Dutch). Their goal is to identify vulnerable stages of the production and supply chain with regards to the safety of the final consumer products and to define priorities for control activities. In the NVWA risk analysis for the Supply chain consumer products, chemical, microbiological, as well as physical risks of consumer products will be identified.
RIVM is asked to contribute to the chemical and microbiological parts of the risk analysis, of which the chemical part is discussed in this report. The request is to perform an inventory and to prioritize chemical hazards in relation to public health in the consumer products supply chain. The main question within this assignment is:
To which potentially hazardous substances is the Dutch consumer most likely exposed when using consumer products?
To answer this question, two sub-questions have been formulated: 1. Which potential hazardous substances are present in consumer
products?
2. What is the expected exposure of a consumer to these substances during use of consumer products?
To answer these questions, queries were carried out in a large ISA (“Informatie Systeem Artikelen”) database by the company Quintens (https://www.quintens.nl/isa/), which owns the database. Quintens is a consultancy firm that works in the field of environment, safety and sustainability. Quintens creates interactive web services, applications and monitoring systems tailored to information management needs and wishes.
The ISA (Informatie Systeem Artikelen) database contains information on almost 2 million articles and products of 2500 different suppliers and retailers. The information in the database is based on legally compulsory documents, such as SDSs (Safety Data Sheets) and DoPs (Declaration of Performance), of a large variety of consumer products of different
retailers in the Netherlands. These products are mainly do-it-yourself products, but also cleaning products, adhesives, and cosmetics.
Page 12 of 39
The products and substances retrieved from the database were scored on hazard and exposure, according to the previously developed
prioritisation methodology (Woutersen et al. 2015).
Chapter 2 describes the methodology of the queries as well as the scores for prioritisation of the products and substances. In Chapter 3, results of the search queries are described and the ranking using the prioritisation scores. The limitations of the study with respect to the used methodology are described in Chapter 4. Conclusions as well as recommendations of the study are described in the final chapter of the report.
2
Methodology
2.1 Selection of hazardous substances in products from the ISA database
Three existing lists of substances were provided by RIVM to Quintens to execute the query for hazardous substances in products. These are the SZW list, a list with endocrine disruptor (ED) substances and a selection of harmonised classifications (see the explanation below). The
substances are included on these list based to their hazardous
properties. These lists were used as search criteria in the ISA database. Selected were all products that contain one or more substances on the lists.
Lists with substances used as search criteria 2.1.1
1. SZW list: A list of carcinogenic, mutagenic and reprotoxic (CMR) substances of the Dutch Ministry of Social Affairs and
Employment (SZW). This list includes more than 500 different substances with their CAS numbers, divided by hazard endpoint (SZW 2019).
2. ED-list: A list of (potential) Endocrine Disrupting (ED) substances used in a former RIVM project by Brand et al (internal report). This is compiled of two other lists, the EU priority list and the International Chemical Secretariat SIN list, resulting in a list of 701 substances.
a. EU priority list (2003). Substances with human health relevant data and assigned to Category 1 (evidence of ED activity in at least one species using intact animals) and Category 2 (at least some in vitro evidence of biological activity related to endocrine disruption) were selected from this list, resulting in 319 substances (194 category 1
substances plus 125 Category 2 substances). The EU Priority List of 2003 is a fixed list and therefore has not been updated since the RIVM consultation in April 2017 (reported in
internal RIVM report Brand et al. 2018).
b. The Substitute It Now! (SIN) list (consulted in August 2018) contains substances identified as SVHCs according to the criteria in REACH by ChemSec, an NGO (Chemsec 2018). The list has been filtered for ‘endocrine disruptor’ resulting in substances with human health and/or environmental
concerns. It was not possible to distinguish between human health and environmental concerns. In addition, substances with concerns related to reproductive toxicity are also
included as these substances to a greater or lesser extent are regularly also EDs. This resulted in 382 substances.
3. The Annex VI list of REACH with harmonised classified substances (ECHA 2019). The following classifications were used in the selection:
- Skin Corrosion: 1A, 1B, 1C - Skin Sensitisation: 1, 1A, 1B - Respiratory Sensitisation
Page 14 of 39
- STOT SE 1, 2, 3 (Specific Target Organ Toxicity, Single Exposure)
- STOT RE 1, 2 (Specific Target Organ Toxicity, Repeated Exposure)
- Carcinogenic 1A, 1B, 2 - Mutagenic 1A, 1B, 2 - Reprotoxic 1A, 1B, 2
Not included in the selection are the classifications for acute toxicity, skin/eye irritation, and acute and chronic aquatic toxicity.
This list contains >3500 entries. It should be noted if an entry contained more than one substance or CAS number only the first substance is included, as it was not possible within the scope of this project to split these out in different rows.
Also not taken into account is that some CMR substances only have to be classified when they contain a specific impurity, such as benzene, above a certain concentration. This is shown in Annex VI of CLP with a note behind the classification that states the impurity and concentration limit. These substances have been treated as if they are always
classified within this project.
Finally, as the search was performed on CAS numbers, all entries without CAS number could not be included.
The complete lists with details of the substances are provided in Annex A of the current report. In total ~4500 substances were included in the query.
2.2 Running the queries in the Quintens’ ISA database
RIVM contracted Quintens to run tailor-made queries with the ~4500 selected substances in the ISA database. In these queries, Quintens searched for all products that contain one or more of the selected substances. The initial outcome was a list of products with the substances they contain; these are called product-substance combinations.
To preserve the confidentiality both product and supplier names were removed by Quintens and instead only the groups of products and suppliers were included in the results send to RIVM.
The list derived from the queries by Quintens can be found in Annex A, sheet ‘Results Quintens’. In this sheet, each row is a product-substance combination. The information that can be found in the different columns in this sheet is explained in Table 1.
Table 1: Overview of the outcome of the queries by Quintens as presented in the sheet ‘Results Quintens’ in Annex A
Column Column title Used in the
ranking? Remarks
A Physical state Yes Physical state of the product (liquid, solid, aerosol)
B Product group Yes The product group of the product (paint, detergent, cosmetic, see also table 5)
C Product group
score Yes Exposure score of the product group (see 2.3.2)
D Supplier status No Type of supplier
E Chemical name Yes Name of the substance
F CAS number Yes CAS number of the substance
G CAS concentration No Concentration range of the selected substances in the product
H CLP classification
CAS Yes Classification substance according to Annex VI of CLP
I Score CLP-CAS Yes Hazard score substance based on CLP classification (see 2.3.1)*
J H-sentence CAS No H-sentence of the substance (based on classification of the substance)
K GHS pictogram
CAS No GHS pictogram of the substance (based on classification of the substance)
L CLP score product No Hazard score of the product, based on the product classification according to CLP (product classification not available in list)
M Product volume No Volume of the product
N Product volume
unit No Unit of the product volume (piece, mL, kg, …)
O Is object active No Is the product in the active assortment at the time of the query?
* Only the CLP classification was taken into account in the initial scoring. No scores were attributed for the SZW classification or potential ED status.
By utilizing the PivotTable function in Excel, RIVM transposed the initial results to a list of substances (Annex A, ‘substancesinproducts’). In this list, the occurrence of every substance in each product group is given, with the number displaying the number of substance-product
combinations. This table was subsequently used as starting point for the ranking.
2.3 Derivation of the scores for prioritisation
The search in the ISA database resulted in a list of substances and the products in which they are used. To be able to prioritise the substances and products, they have been scored on hazard and exposure.
Hazard score 2.3.1
The hazard score is based on the classification of the substances. The scoring methodology is similar to the previously performed methodology in the prioritisation tool (Woutersen et al. 2015). However some
adaptations had to be made in the current approach for the following reasons:
Page 16 of 39
1. No potency score is assigned in the current methodology, because information on the DN/MEL (Derived No/Minimal Effect Level) of the substance is not included in the ISA database. 2. Woutersen et al. (2015) focused only on CMR endpoints and
sensitisation. Here, additional endpoints are taken into account, namely endocrine disruption, STOT RE, STOT SE, and corrosion. The additional scores for ED, STOT RE, STOT SE, and corrosion have been derived by using the disability weights used to weigh the severity of different health effects against each other in the WHO global burden of disease analysis (Salomon et al. 2012), the same basis as was used for the classification scores of the prioritisation tool (Woutersen et al. 2015), together with expert judgment.
In the hazard score, the severity of the classified effect is taken into account by assigning a higher score to more severe health effects (based on harmonised classification). The scores assigned to various health effects are listed in Table 3.
To compensate for the absence of the potency score and to create room for additional endpoint scores, all scores from the prioritisation tool have been multiplied by two, except the score for respiratory sensitisation. This score has been multiplied by a factor of 1.5 resulting in a hazard endpoint score of 3 (and not 4). The reason for this is that the
maximum disability weight (Dw) for the corresponding effect asthma of respiratory sensitisation (0.132) is lower than that of severe burns corresponding to corrosion (0.438) and neurological disorders, corresponding to STOT SE (0.422), two endpoints with a hazard endpoint score of 4.
In the WHO analysis, cancer has a mean Dw ranging from 0.294 to 0.519. Disabilities considered as reproductive effects have Dws between 0.004 and 0.606. These include infertility, foetal alcohol syndrome, intellectual disability, hearing and vision loss, musculoskeletal problems, disfigurement and motor and/or cognitive impairments. STOT RE and STOT SE both could cover large varieties of diseases, of which only the most severe are mentioned. Allergic diseases are not listed by the WHO. However, asthma (Dw: 0.009-0.132) is considered as an equivalent effect of respiratory sensitizers and burns (<20%) and open wounds (Dw: 0.005-0.096) for effects of dermal sensitizers. The order of
severity indicated by the Dws confirms the order of the endpoint scores applied in the current report.
When two classifications lead to the same effect, such as mutagenicity and carcinogenicity, the score is applied only once for substances with both classifications. Also reproduction toxicity and ED are considered equivalent, although ED can also lead to other effects.
Substances causing only one type of effect, and thus having ‘only’ one classification, e.g. reprotoxic, are considered less hazardous compared to substances with more types of effect, or classifications, e.g.
reprotoxic and skin sensitising. Therefore, for the hazard endpoint score, the scores of all classifications of a substance are summed. The
has a minimum of 2 (Sderm only) and a maximum of 32 (8+6+5+4+4+3+2, sum of all possible classifications).
Note that the subcategories of the harmonised classification (e.g.
carcinogenic 1A, 1B and 2) are not taken into account in the scores. The reason is that for CMR classifications, the division in categories is based on the available evidence, rather than the potency of the substance to cause the specific effect.
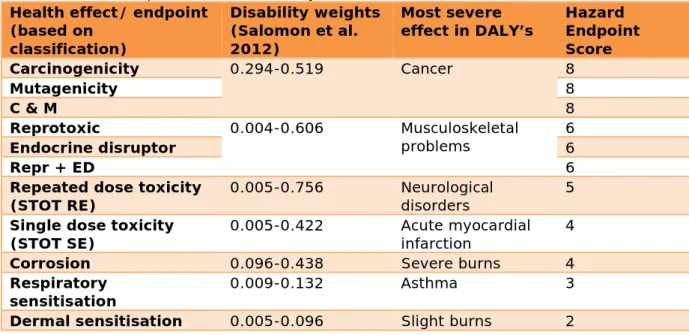
Table 3: Hazard endpoint scores indicated by hazard classification
Health effect/ endpoint (based on classification) Disability weights (Salomon et al. 2012) Most severe
effect in DALY’s Hazard Endpoint Score Carcinogenicity 0.294-0.519 Cancer 8 Mutagenicity 8 C & M 8 Reprotoxic 0.004-0.606 Musculoskeletal problems 6 Endocrine disruptor 6 Repr + ED 6
Repeated dose toxicity
(STOT RE) 0.005-0.756 Neurological disorders 5
Single dose toxicity
(STOT SE) 0.005-0.422 Acute myocardial infarction 4
Corrosion 0.096-0.438 Severe burns 4
Respiratory
sensitisation 0.009-0.132 Asthma 3 Dermal sensitisation 0.005-0.096 Slight burns 2 Exposure score
2.3.2
The exposure score is based on two components:
• the number of product categories in which a substance is used, and
• the relative exposure to the substance from the use of these products.
With regard to the first, the number of product categories in which a substance is used is taken as a score for the relative use of the substance. This score ranges from 1 to 12 (based on results from the Quintens database).
For the latter, a product exposure score is determined for the product groups in the ISA database. They are based on the product category as given in the SDS.
A product exposure score is determined for products
semi-quantitatively, in the same way as previously in the prioritisation tool described in Woutersen et al. (2015).
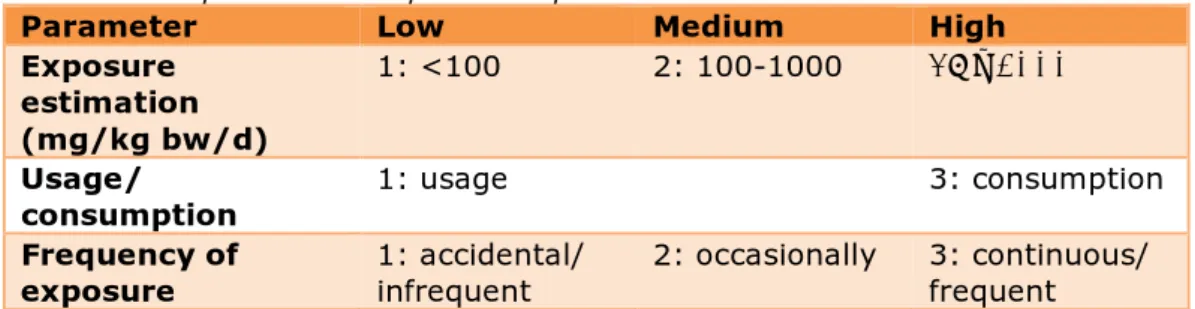
The product exposure score is determined by multiplying three components, which are each given 1-3 points (See Table 4):
• exposure estimation,
• usage versus consumption and • frequency of exposure
Page 18 of 39
Table 4: Components of the product exposure score
Parameter Low Medium High Exposure
estimation (mg/kg bw/d)
1: <100 2: 100-1000 3: ≥1000
Usage/
consumption 1: usage 3: consumption Frequency of
exposure 1: accidental/ infrequent 2: occasionally 3: continuous/ frequent Thus, the product exposure scores range from 1 to 27 (see also Table 5).
For some product groups, separate product exposure scores were derived for different subcategories, depending on the physical state of the products (solid, liquid, and aerosol).
The exposure estimation is based on the outcomes using default values in the ECETOC-TRA consumer exposure tool version 3.1 and covers the combined exposure for all routes, calculated for a fictive substance with high vapour pressure in a similar way as described by Schuur and Traas (2011). For product categories and subcategories for which no default values in the ECETOC-TRA tool are available, the exposure estimation is based on expert judgment.
The estimates from the ECETOC-TRA tool are event concentrations, rather than chronic concentrations, which would favour products with high product amounts per event. As compensation, the
usage/consumption and the frequency of exposure are taken into account. Usage/consumption reflects the difference between an article like a matrass, which releases less substance with every use (usage) and a product like paint, which is replenished with every use
(consumption).
By including usage/consumption and use frequency, the scores of products with lower product amounts per event, but which are used up and are frequently used, are levelled. Detergents are a good example. They have a moderate exposure estimation (score=2), but because they have a high exposure frequency and are consumed, they have a
relatively high overall product exposure score.
Taking the exact outcome from the ECETOC-TRA tool was also considered, but discarded because it would provide a false sense of accuracy mismatching with the high level of abstraction of the
information obtained from ISA database. The product exposure score should therefore be seen as a screening. The usage/consumption and frequency of exposure is based on expert judgement. The final product exposure score was determined by multiplying the three components. The highest product exposure score from the products found was added to the number of product categories to derive the total exposure score.
Table 5: Overview of the product groups and their product exposure scores
Product group Subcategory Exposure
estimation 1-3 Usage/ consumption 1 or 3
Frequency
1-3 Product exposure score
Examples
Battery Solid material 1 1 1 1
Biocide Aerosol 2 3 3 18
Solid powder 1 3 3 9
Liquid 2 3 3 18
Construction
material Aerosol 2 3 2 12 Adhesives, fillers
Solid powder 3 3 1 9 Concrete, gypsum
Liquid 2 3 2 12 Cosmetic Aerosol 3 3 3 27 Liquid 3 3 3 27 Detergent Aerosol 2 3 3 18 Solid 3 3 3 18 Liquid 2 3 3 18
Animal care product Liquid 3 3 3 27 Veterinary care products, animal shampoo
Technical fluid Liquid 3 3 1 9 Terpentine, thinner
Remover Liquid 3 3 1 9
Gasses in pressure
cylinder Gas 1 3 1 3 Camping gas, argon, CO2
Plant protection
product Solid (granular, powder) 1 3 3 9
Liquid 2 3 3 18
Medical device Liquid 3 3 3 27 Toothpaste, mouth water
Fertilizer Aerosol 1 3 1 3
Page 20 of 39
Product group Subcategory Exposure
estimation 1-3 Usage/ consumption 1 or 3 Frequency 1-3 Product exposure score Examples Liquid 1 3 1 3
(Car) careproduct Aerosol 2 3 1 6 Car/bicycle care
Solid (granular, pow 3 3 1 9
Liquid 3 3 1 9
Screen washer Aerosol 1 3 2 6
Liquid 1 3 2 6
Spray cans, aerosol Liquid 1 3 2 6 Spray snow, air fresheners
Solid flammable
product Solid 1 3 2 6 Fire starters
Paint Aerosol 3 3 1 9
Solid 1 3 1 3
Liquid 3 3 1 9
Consumer article Aerosol 1 3 3 9 Gas lighters
Solid 1 3 2 6 Candles
Liquid 1 3 1 3 Lighter fuel
Scoring of the substances 2.3.3
The hazard and exposure scores were attributed to each individual substance. The hazard score based on the CLP classification had already been derived by Quintens. The scores of the SZW classification and ED scores were added manually to the relevant substances in the final substance list.
The hazard and exposure scores were combined to gain a ranking of the selected substances. As there was no reason to value either hazard or exposure higher, both scores were weighted similarly. Since the hazard scores of the current selection range from 2-21 and the exposure scores from 2-39, the hazard scores were multiplied by 2 to place them in the same order of magnitude. Both scores were added to reach the total substance score. In the text box below, n-hexane is given as an example to illustrate how the total substance score was calculated. In summary:
• Hazard score = sum of endpoint scores
• Exposure score = number of product groups + product exposure score
• Total substance score = hazard score x 2 + exposure score
Example: n-hexane Hazard score
• Hazard score = 15 (Repr + STOT SE + STOT RE)
Exposure score
• Number of product groups = 7 • Highest product exposure score = 18 • Exposure score = 7 + 18 = 25
Total substance score
• 15 x 2 + 25 = 55 Scoring of the product groups 2.3.4
The ranking of the product groups is based on the number of product-substance combinations in each product group, the hazard scores of the substances from Annex VI of CLP, and the product exposure score of that product group.
Unfortunately, it was not feasible to include in this exercise the scores of the substances with classifications based on the SZW list and potential ED substances, as these could not be linked to the product-substance combinations within a short time. Hence, the hazard scores of the product groups are based only on the harmonised classification of CLP. No differentiation has been made between the physical states of the products. Instead the score of the most common physical state was used for the overall group. Liquid/aerosol was the most common state for all groups except for consumer articles and batteries (solid) see also Figure 4 in Chapter 3.
The hazard and exposure scores were generally in the same order of magnitude and were added without multiplier. The hazard score was derived by taking the sum of all hazard endpoint scores for all substances (combined with the products) in a product group. The
Page 22 of 39
exposure score was derived by multiplying the number of product-substance combinations with the product exposure score belonging to the specific product group. Exposure and hazard scores are added together to calculate the total score. In the text box below, Biocides is given as an example to illustrate the calculation of the total score. In summary:
• Hazard score = sum hazard scores
• Exposure score = product exposure score x number of product-substance combinations
• Total product score = hazard score + exposure score
Example: Biocides Hazard score
• Sum hazard scores = 2728
Exposure score
• Number of product-substance combinations = 577 • Product exposure score = 18
• Exposure score = 577 * 18 = 10386
Total product score
• 2728 + 10386 = 13114
Note regarding the differences with the prioritisation tool from 2.3.5
Woutersen et al.
In the prioritisation tool, the REACH database was used as information source. An important difference with the ISA database is that the REACH database is substance oriented and the ISA database is product
oriented. Hence, in the results of the ISA query, substances are always linked to products in substance-product combinations.
In the REACH database, no information is available on the exact products in which a substance is used, only the broad categories of products and articles.
In the analysis of the results, it was possible make a list of substances with all product groups in which they are used, and likewise, a list of product groups with all substances included in the query (Annex A, ‘substancesinproducts’).
However, it is more complicated to use the substances in the product group, rather than the product-substance combinations. It can also be argued which is more relevant, as the product-substance combination also incorporates the number of products in the group. Ideally, both would be used, but due to time constraints, this was not possible. The quality of both databases is dependent on the information provided by the companies, which might vary.
3
Limitations regarding the methodology of the study
In the interpretation of the results, a number of factors should be kept in mind, related to the limitations in the methodology of the study.
3.1 The ISA database
The ISA database contains a large number of consumer products from various retailers. However, it remains a sub-set (participating
companies) of all Dutch companies and cannot provide an overview of all substances and all consumer products on the market in the
Netherlands.
As the ISA database is derived primarily from SDSs, the information on some product groups is limited as no SDS has to be provided. These include all kinds of articles, batteries, and cosmetics. However, some retailers still provide information on some of these products.
A limitation is that half of the products in the database are not available anymore on the market in the Netherlands.
3.2 Selection of the substances
In the current study, only substances were included with certain harmonised or SZW classifications, with the addition of potential EDs. This means that some classifications, such as acute toxicity, were not included, as well as substances with only self-classifications (many skin-sensitisers). Most CMR substances will be included, as these are taken up for harmonised classification with priority.
An important limitation concerns cases where multiple substances are included in the same entry in Annex VI of CLP. These are all included in the same row of the table and thus difficult to separate in an efficient manner. Due to time constraints, only the first substance could be included in these cases.
No differentiation could be made between substances that are classified themselves, or those that only have to be classified if they contain a specific impurity. Both are treated equally within this project.
3.3 Hazard score
The hazard scores are based on expert judgement of the severity of the health effects based on classifications. Naturally, there can be large differences between substances in the actual effects that they can induce, in particular for the endpoints STOT RE and STOT SE. Likewise, only one score was assigned regardless of the category of classification (in case of 1A, 1B or 2).
Furthermore, potency was in this exercise not included, and it should be noted that there can be large differences in the potency of the
substances with the same hazard score.
Due to time constraints, the hazard scores of SZW and ED substances were not included in the analysis of the product groups.
Page 24 of 39
3.4 Exposure score
The product groups are very broadly defined, which means that the exposure scores are based on an estimation of the typical product for each group, however large differences between exposure routes and levels of chemicals from products within one product group can exist.
4
Results and discussion
The tables with the results of the search in the ISA database and the subsequent scored lists can be found in Annex A. This Annex contains the following sheets:
1. Results Quintens; the raw data received from Quintens
2. Substances in products; overview of the number of products in each product group in which the various substances are used 3. Substance list; overview of all substances found in the database
including CAS number, derived scores and ED and CLP classification.
4. Product list; overview of the products grouped into product groups with the total substance-product combinations per group, total number of substances within the product group, the scoring and the various subgroups based on the phases of the product. 5. CLP list; the list of Annex VI substances of CLP
6. ED list; the list of potential ED substances 7. The list of CMR substances according to SZW
4.1 Overview outcome search in ISA
Substances in individual products 4.1.1
The first search executed by Quintens in the ISA database resulted in a list of products with at least one of the about 4500 hazardous
substances of the three lists used for the selection (SZW-list, ED-list and Annex VI-list of REACH). The search based on the substance list resulted in a total of 18,811 products (from ca. 400 different suppliers) which were found in the database containing (at least) one of the hazardous substances. Approximately 46% of these products (n= 8,680) are currently available in shops in the Netherlands (active assortment); the other products (> 10,000) are not available anymore on the market but still present in the database and could still be used at home.
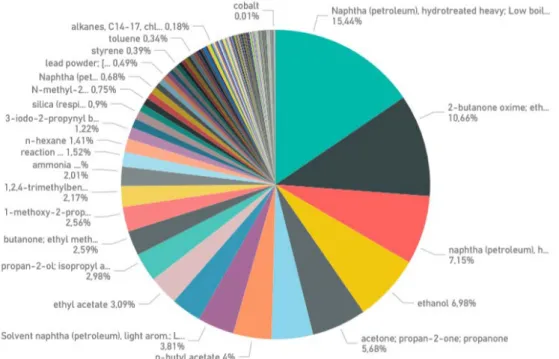
In total 38,893 product-substance combinations were derived from the database (an average of 2-3 hazardous substances per product). The amount of unique CAS numbers was 274, meaning that 274 of the about 4500 different substances were found in the products in the database (See Figure 1).
Page 26 of 39
Figure 1: Overview of the substances used in the highest number of products
Substances in product groups 4.1.2
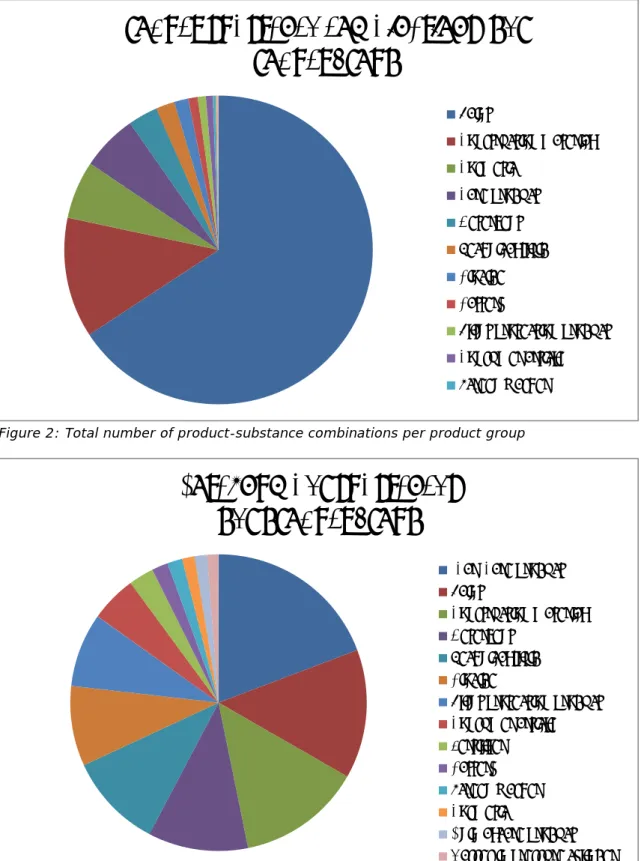
After aggregation of different products in product groups, the number of product-substance combinations per product group has been analysed (see Figure 2).
Paint is by far the product group with the largest number of product-substance combinations (25,583), followed by the group construction materials (4895), cosmetic products (2358) and (car) care products (2278).
The number of product-substance combinations gives an indication of the frequency of the use of hazardous substances within a product group. The number of combinations naturally depends both on the number of substances and the number of products within each group, which both can vary widely between the different product groups. However, the number of products per group is not easy to derive from the search queries. This would have required product identifiers in the results, which were deliberately left out to preserve confidentiality. The total number of hazardous substances per product group is given in Figure 3. This number indicates whether there are many different hazardous substances used, or whether a few substances are used in a majority of the products in one category.
In (car) care products, the highest number of different hazardous substances (141) is found, followed by paint (103) and construction material (99). Cosmetics is a product category with a large number of product-substance combinations, but relatively a small set of substances (10). The reason for this is that a high percentage of the cosmetic products (2175/ 2358) contains ethanol.
Figure 2: Total number of product-substance combinations per product group
Figure 3: Total number of substances per product group
Product-substance combinations per
Product group
Paint Construction material Cosmetic Care product Detergent Technical fluid Biocide BatteryPlant protection product Consumer article Screen washer
Total number substances
per product group
(Car) Care product Paint
Construction material Detergent
Technical fluid Biocide
Plant protection product Consumer article Fertilizer
Battery Screen washer Cosmetic
Animal care product Gasses in pressure cylinder
Page 28 of 39
Figure 4: Physical state of the products with hazardous substances
Finally, the distribution of the physical state of the different product-substance combinations is given in Figure 4. In the vast majority of all product-substance combinations the product is a liquid (ca. 30,000), followed by aerosol (7850), solid, gas and other.
Classification of substances and product classifications 4.1.3
The substances used for the selection are all classified or have been recognized as potential EDs. The scoring with regard to hazard is based on health endpoints based on the substance classifications.
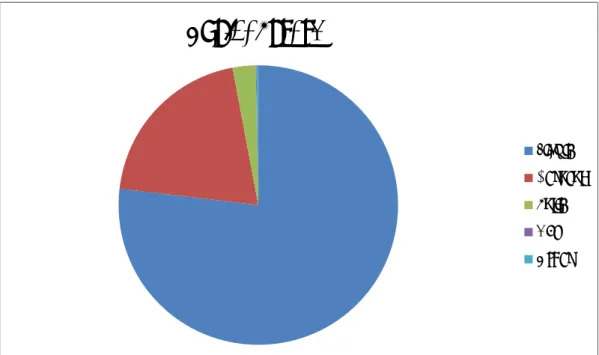
In addition, products need to be classified and this classification has to be notified in the SDSs. An overview of the product classifications as provided in the database are given in Annex A, the most frequent ones are depicted in Figure 5.
Of the 18,811 products, a high number (>10,000) is classified. The main classification is STOT SE, followed by skin sens and STOT RE. Only a minority of products is classified as CMR.
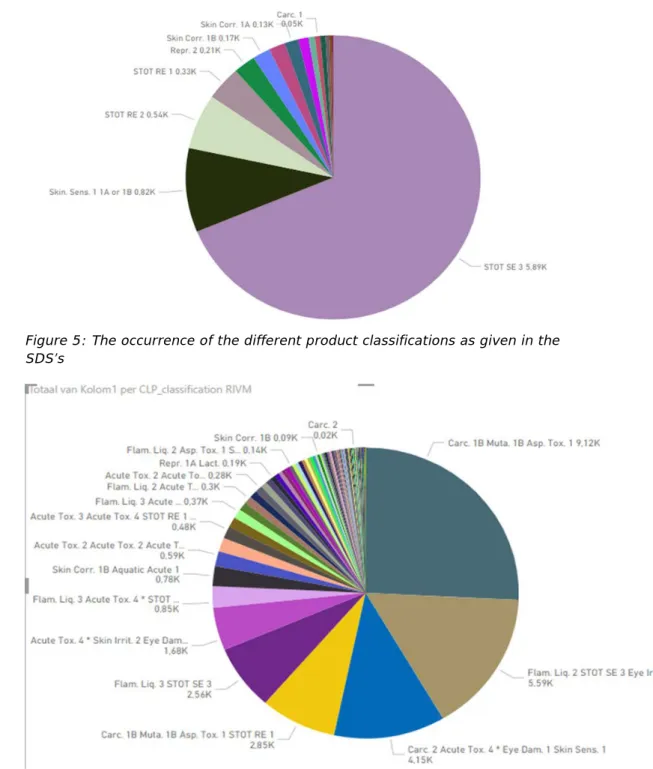
The most frequently occurring substance classifications are given in Figure 6. Very notable is the high occurrence of substances with a classification for carcinogenicity, especially because only a minority of products is classified as such. This indicates that most products that contain a carcinogen-classified substance are not classified as carcinogenic themselves.
There are a few reasons for this difference between the classification of a product containing a substance and the classification of the substance. The first reason can be found in Figure 1: in many cases the
carcinogenic substance is a naphtha (petroleum) compound. These oil-derived substances are complex mixtures, which only have to be
classified as Carc if they contain ≥0.1% benzene. According to industry representatives, a purified mixture is usually used in consumer products, which does not have to be classified.
Physical state
Liquid Aerosol Solid Gas OtherThe second reason is that there are concentration limits under which the product does not have to be classified. The concentrations of the
substances in the products can be found in Annex A, column G of the sheet ‘Results Quintens’.
Figure 5: The occurrence of the different product classifications as given in the SDS’s
Figure 6: The occurrence of the substance classifications in substance-product combinations
Page 30 of 39
4.2 Outcome of product and substance scores
The scored lists of substances and product groups are included in Annex A. The lists can be sorted on the different scores (hazard, exposure, or total substance score). Also included are the substance classifications under CLP and SZW and their (potential) ED status.
In the following paragraphs several highlights from the results are briefly discussed.
Substances with the highest total score 4.2.1
The ten highest scoring substances are given in Table 6. The substance with the highest total score was ethanol, due to its high hazard score of 14 based on the SZW classification for Repr and Carc in combination with its widespread use (number of product groups is 12). It should be noted that it is not legally required to use the SZW classification in product labelling. With regard to the exposure, the score is high, ethanol is used in cosmetics, which has the highest score of 27.
The second highest scoring substance is the pesticide thiacloprid, used in the product groups biocide, plant protection product and fertilizer. The high ranking is due to the high hazard score (18) because of its
harmonised classification for Carc, Repr, and STOT SE.
Table 6: Highlight of the 10 substances with the highest total scores
Substance name CAS-No. Hazard score N product groups
Product Exposure score
Total Exposure
score Total score
ethanol 64-17-5 14 12 27 39 67 thiacloprid (ISO) 111988-49-9 18 3 18 21 57 n-hexane 110-54-3 15 7 18 25 55 phenol 108-95-2 17 2 18 20 54 toluene 108-88-3 15 5 18 23 53 dibutyltin dilaurate 77-58-7 19 3 12 15 53 Naphtha (petroleum), hydrotreated heavy; 64742-48-9 8 9 27 36 52 naphtha (petroleum), hydrodesulphurized heavy; 64742-82-1 13 7 18 25 51 diuron (ISO) 330-54-1 19 3 9 12 50 stoddard solvent 8052-41-3 13 5 18 23 49
Substances with highest hazard scores 4.2.2
The seven substances with the highest hazard scores (≥18) are all either biocides/pesticides or metal compounds. Biocides/pesticides have high hazard scores because they are intended to have adverse
properties. The active ingredients have been registered for only one or a few products and seem to serve a very specific purpose. For that
Particularly interesting is the organotin compound dibutyltin dilaurate, as it is used in product groups where a reasonable extent of exposure could be expected (construction materials, technical fluids, (car) care products). These products are often mixtures and classified as
hazardous, because their ingredients, including in some cases dibutyltin dilaurate, are present in concentrations that warrant classification. This is in contrast to for example batteries, for which no labelling is required because they are considered articles and no exposure is normally expected to the hazardous substances present inside the battery.
It should be noted that the harmonised classification of dibutyltin dilaurate as Repr. 1B is in force since 1 December 2018. Hence, it could/should be that these products are no longer produced or available on the public market.
Substances used in most product groups 4.2.3
The substances that are used in most product groups are various solvents. Solvents are used as carrier in many different products. Since STOT SE is the classification of some of the most common solvents, and these form the largest fraction of the volume of most products, it is quite logical that the most common product classification is STOT SE. Interesting is the frequent use of the reaction mass of 5-chloro-2-methyl-2H-isothiazol-3-one and 2-5-chloro-2-methyl-2H-isothiazol-3-one (3:1), better known as MCI:MI or Kathon GC. This preservative was recently restricted in cosmetics, and indeed no cosmetic use was found in the ISA database for this substance. However, it is used in nine other product groups, in particular paint, in which it is used as preservative. Product groups with the highest score
4.2.4
The product group with by far the highest total score (product score x number of product-substance combinations + sum of CLP hazard scores of all product-product combinations) is paint followed with some
distance by construction materials and cosmetics (Figure 7). The high scores of paint and construction materials are mainly due to the large number of different products included in these groups, which is not surprising considering the scope of the database. This selection bias should be kept in mind: it mainly tells us that retailers have a broad variety of paints in stock, but that does not necessarily mean that those are the products consumers are most using overall.
On the other hand, in Woutersen et al. (2015), paint was also included in the top three of the product categories. The highest scoring group in that publication was cleaning agents, which scored much lower in the ISA database as the number of products in cleaning agents is a factor 20 smaller than in the group of paint products.
Alternatively, it would be possible to adapt the scores by correcting for the number of product-substance combinations, and thereby laying more emphasis on number of substances, hazard score and exposure score. Unfortunately, it was not possible to work this out within the given time.
Page 32 of 39
Figure 7: Overview of the total scores per product group
The difference between CLP and SZW classifications 4.2.5
From the 274 substances found in products in the database, 35 originated from the ED list. From those 35 substances, 6 substances were also classified as Repr.
With regard to the SZW list, 16, 2 and 49 substances classified for respectively Carc, Mut, and Repr. are included in the ranked list of substances. Six substances were classified for Carc (1,4,5,6,7,7-hexachloor-5-norborneen-2,3-dicarboxylisch zuur, nikkeldihydroxide silica (respirabel stof, kristallijn), cycasine, chroom(VI)verbindingen, 5 o-toluïdine dihydrochloride, ethanol, and sulphuric acid ... %) and 5 substances for Repr. (nikkeldihydroxide, ethanol, styrene, boric acid Boric acid, and alkanes, C14-17, chloro; chlorinated paraffins, C14-17) by SZW, and not present on Annex VI.
CLP and SZW classifications are both based on the GHS classification criteria. However there is a difference between CLP and SZW
classifications. The SZW classifications are national and primarily intended for the protection of workers; it is not legally required to use these as product classifications. In contrast, harmonised classifications under CLP have to be used in the product classification if the classified substance is present above certain concentrations
(https://echa.europa.eu/regulations/clp/understanding-clp).
In the current project, substances classified as CMR by SZW are, in most cases also classified as such under CLP. However, there are some
exceptions of which ethanol, inhalable silica, and sulphuric acid are the most notable, from the results presented here.
Ethanol is the substance with the highest overall score, due to its use in a wide range of products and its SZW classification for Carc. and Repr. These classifications have been included manually in the calculation of
the hazard scores of the substances for use of the ranking of substances.
In the product list, the SZW classifications could not be taken into
account. As only a small number of substances is only classified by SZW, this has not a large impact overall (<10% of the substance/product combinations). The exceptions are the product groups cosmetics and screen washers, due to the large number of products containing ethanol. Cosmetics
4.2.6
The high total product score of cosmetics is notable, as it is not compulsory to submit SDSs for cosmetic products. However, product information files were nevertheless available for a large group of
cosmetic products, which combined with a high product exposure score leads to a high ranking.
As noted, the SZW classification of ethanol was not included in the list of the products. As a result, the hazard score as well as the total score as product group of cosmetics would be much higher if the classification of ethanol would have been included.
Moreover, it seems many substances in cosmetics are not included in the product files of cosmetics. In particular the fragrances, which are often skin sensitizers, are nearly absent. A reason for this could be that it is not compulsory to include these in the information files, or because skin sensitizers often do not have a harmonised classification and thus were not included in the search query.
4.3 Implications for the risk analysis of the chain of consumer products
Classification substances and products
The outcome of the ISA-search gives a wealth of information on the substances used in various products that are sold at retailers. This is nearly at the end of the chain of consumer products, where the information on composition and classification of the products and substances is often provided by the formulators or suppliers.
A notable outcome of the search is the difference in the classification of the substances in the products and of the resulting classification of the products. This does not necessarily mean that these products are incompliant, as the classification depends on the concentrations of the various components in the product.
In some cases it even depends on the level of an impurity in the substance whether the classification should be applied (for example relevant in the case of petroleum substances or some metal
substances). Therefore, it is of high importance to use of sufficiently high grade materials at the formulation stage, because otherwise the lack of classification can be unjustified.
In addition, in some cases the indicated concentration range of substances does raise questions on the product classification. The regulation of mixture classifications is very complex
(https://echa.europa.eu/support/mixture-classification) and requires a high level of knowledge on the product and its ingredients, as well as good communication throughout the chain. It is therefore recommended to include this in the chain analysis.
Page 34 of 39
Possible approach based on high scoring products
The consumer products are a very large group that encompasses many different products, which fall under multiple legislations (REACH,
cosmetics, biocides (BPR), toys, batteries, veterinary medicine, medical devices).
This report, together with other RIVM reports on prioritization (Nijkamp et al., Woutersen et al., Brand et al) might help in the ranking of the product group with possibly the highest risks to consumers, based on the presence of hazardous substances in the products. Based on the results of the current report, the highest ranking group is paint. Paint is an interesting group for the following reasons:
• this group has the highest total score
• paints contain relatively many hazardous substances and those have relatively high hazard scores
• paints fall under REACH and CLP, and in some cases BPR, which are the largest of the legislations that apply to consumer
products
Another group worth mentioning is (car) care products, as this is the group which contains the highest number of hazardous substances; even though the number of products-substances combinations is much lower than of paints.
4.4 Recommendations for further investigation
Due to the restrictions of the project, choices had to be made in the methodology, as well as in the interpretation of the results. Some of the options that were not included in this report could be considered in future iterations or updates.
Recommendations with regard to the methodology:
• SZW/ED classifications were not included in the ranking of the product groups. Ideally, several rankings can be made for each list of substances (CLP, SZW, ED), as well as a combination of all lists.
• The scoring of the product groups could be adapted to remove the impact of the product-substance combinations and give more weight to the other parameters (number of substances,
exposure/hazard score).
• The entries in Annex VI of CLP with multiple substances, or substance (groups) without CAS number were not included in the search. These could be added given enough time. This would require a new search by Quintens.
• Several parameters could be added in the interpretation of the results, such as product volume or concentration ranges of substances.
• Additional information on the substances might be collected, for example from the ECHA database, such as DNELs. In that case, a hazard score on potency could be included.
• The REACH database could be used to check if the substances ranked high in this study are registered, including the use mentioned in this database. The description of the safe use described in the Chemical Safety Report could be reviewed.
• The substances classified based on impurity/specific constituent could be reported separately
• Refine the results with information on products which are actually in stock at the retailers
In the interpretation of the results and further chain analysis, it is also highly recommended to consider the report ‘Approaches and tools to better support consumer exposure assessment under REACH’ by Wijnhoven and Affourtit (2018) for DG Environment. This report investigates how information on consumer exposure is communicated through the supply chain, in particular of paints.
Because of lack of time and resources, the results from this investigation are not compared with results from similar studies in literature, such as from the group at US-EPA from Wambaugh et al. (seer for example Goldsmith et al. 2014; Dionisio et al. 2018). Also no discussion is included on the results from this study compared with results from previous investigations at RIVM (Nijkamp et al., 2014; Woutersen et al. 2015; Brand et al. 2018).
In this case, the Quintens database was used as data source, which has the advantage that it is relevant for the Dutch market. However, it does not provide a full picture of all consumer products. There are also other relevant databases on which this approach could be applied. Options for databases with information on ingredients that could be further
investigated or discussed for their relevance and use are: • The Pharos database on building materials
https://www.pharosproject.net/
• CPdat, a database from US-EPA which includes information on >16.000 chemicals in (based on MSDSs from companies such as Procter&Gamble, Unilever, https://www.epa.gov/chemical-research/chemical-and-products-database-cpdat
• Skin Deep cosmetics database, with information on ingredients in cosmetic products (also US based)
https://www.ewg.org/skindeep/
• The database from the Danish EPA with results on ingredients and consumer products from their consumer surveys;
https://vidensbank.mst.dk/v2/
• Possible other available information sources
As a last remark, it should be noted that Quintens continuously updates its database with new substances and products. Hence, if the search is repeated after a few years, this will give more information as well as insight in changes of products on the market and use of hazardous substances.
5
Acknowledgements
We would like to thank Geert Posma and Thijs van Diggelen of Quintens for the fruitful discussions, the use of their extensive database and the performance of the queries.
Dirk van Aken, Jacqueline Biesterbos, Jacqueline Castenmiller, and Nathan Kuper are acknowledged for their input and initiation of this project.
We thank Gerlienke Schuur, Wouter ter Burg, and Joke Herremans for their critical review of the final report.
6
References
Brand W., Affourtit F., Woutersen M. 2018. Selection and ranking of (suspected) endocrine disruptive chemicals used in consumer products - an update using the REACH database in 2018. Bilthoven, The
Netherlands: National Institute for Public Health and the Environment. Internal RIVM publication (14663) for NVWA
Dionisio K.L., Phillips L., Price P.S., Grulke C.M., Williams A., Biryol D., Hong T., Isaacs K.K. 2018. Data Descriptor: The Chemical and Products Database, a resource for exposure-relevant data on chemicals in
consumer products. www.nature.com/scientific data.
https://www.nature.com/articles/sdata2018125.pdf
ECHA. 2019. CLP (Classification Labelling and Packaging) Annex VI, retrieved April 2019,
https://echa.europa.eu/information-on-chemicals/annex-vi-to-clp
Goldsmith M.R., Grulke C.M., Brooks R.D., et al. 2014. Development of a consumer product ingredient database for chemical exposure screening and prioritization, Food and Chemical Toxicology, Volume 65, Pages 269-279, ISSN 0278-6915, https://doi.org/10.1016/j.fct.2013.12.029. Chemsec. 2018. Substitute It Now (SIN) list. Retrieved 08-2018,
http://chemsec.org/what-we-do/sin-list
Nijkamp M.M., Maslankiewicz L., Delmaar J.E., Muller J.J.A. 2014. Hazardous substances in textile products. Bilthoven, The Netherlands: National Institute for Public Health and the Environment. 2014-0155 Salomon J.A., Vos T., Hogan D.R., Gagnon M., Naghavi M., Mokdad A., et al. 2012. Common values in assessing health outcomes from disease and injury: disability weights measurement study for the Global Burden of Disease Study 2010. The Lancet, 380(9859), 2129-2143. doi:
http://dx.doi.org/10.1016/S0140-6736(12)61680-8
Schuur A.G., Traas T.P. 2011. Prioritisation in processes of the European chemical substances regulations REACH and CLP. Bilthoven, The
Netherlands: National Institute for Public Health and the Environment. 601352001/2011
SZW (Ministerie van Sociale Zaken en Werkgelegenheid). 2019. SZW-lijst van carcinogene, mutagene en reproductietoxische stoffen en processen, Staatscourant van het Koninkrijk der Nederlanden 2019, 38
https://zoek.officielebekendmakingen.nl/stcrt-2019-38.html
Woutersen M., Smit K., ter Burg W., Bokkers B., and Schuur G. 2015. Prioritisation tool for chemical substances in consumer products.
Bilthoven, The Netherlands: National Institute for Public Health and the Environment. 2015-0194