RIVM report 680125003/2007 MNP report 500080003/2007
Direct and indirect nitrous oxide emissions from agricultural soils, 1990 - 2003
Background document on the calculation method for the Dutch National Inventory Report
K.W. Van Der Hoek, M.W. Van Schijndel1
and P.J. Kuikman2
1Netherlands Environmental Assessment Agency
(MNP)
2Alterra
Contact:
K.W. Van Der Hoek
Laboratory for Environmental Monitoring (LVM)
Klaas.van.der.Hoek@rivm.nl M.W. Van Schijndel
Agriculture and Rural Areas Team (LDL)
Marian.van.Schijndel@mnp.nl
This investigation has been performed by order and for the account of SenterNovem, within the framework of project 1331-04-02-02-005/4700007562 and
0377-04-01-06-003/4700008403.
Abstract
Direct and indirect nitrous oxide emissions from agricultural soils, 1990 - 2003
Background document on the calculation method for the Dutch National Inventory Report Since 2005 the Dutch method to calculate the nitrous oxide emissions from agricultural soils has fully complied with the Intergovernmental Panel on Climate Change (IPCC) Good Practice Guidelines. In order to meet the commitments of the Convention on Climate Change and the Kyoto Protocol, nitrous oxide emissions have to be reported annually in the Dutch National Inventory Report (NIR). Countries are encouraged to use country-specific data rather than the default values provided by the IPCC. This report describes the calculation schemes and data sources used for nitrous oxide emissions from agricultural soils in the Netherlands.
The nitrous oxide emissions, which contribute to the greenhouse effect, occur due to nitrification and denitrification processes. They include direct emissions from agricultural soils due to the application of animal manure and fertilizer nitrogen and the manure production in the meadow. Also included are indirect emissions resulting from the
subsequent leaching of nitrate to ground water and surface waters, and from deposition of ammonia that had volatilized as a result of agricultural activities. Before 2005 indirect emissions in the Netherlands were calculated using a method that did not compare well with IPCC definitions and categories. The elaborate explanation here should facilitate reviewing by experts. Finally, the report also presents an overview of the nitrous oxide emissions from agricultural soils and the underlying data used in the 1990 - 2003 period.
Key words: nitrous oxide, greenhouse gases, emissions, animal manure, fertilizer, Kyoto Protocol, climate change, IPCC, agricultural soil, nitrification, denitrification
Rapport in het kort
Directe en indirecte lachgas emissies uit de landbouwbodem, 1990 - 2003
Achtergronddocument van de berekeningsmethode voor het Nederlandse National Inventory Report
Sinds 2005 berekent Nederland de uitstoot van lachgas uit landbouwbodems volgens de richtlijnen van het Intergovernmental Panel on Climate Change (IPCC). Dit rapport beschrijft deze gegevens op toegankelijke wijze.
De uitstoot van lachgas, dat bijdraagt aan het broeikaseffect, is het gevolg van nitrificatie- en denitrificatieprocessen. De lachgasemissies bestaan uit directe en indirecte emissies uit landbouwbodems. De directe emissies komen voort uit dierlijke mest en kunstmest die op landbouwbodems is toegediend en uit dierlijke mest die in de weide is geproduceerd. De indirecte lachgasemissies ontstaan nadat nitraat uit mest naar het grond- en oppervlaktewater is uitgespoeld. Een andere bron van indirecte lachgasemissies is ammoniak dat vrijkomt uit mest en neerslaat op de bodem. In voorgaande jaren werden indirecte emissies op een andere manier berekend, die niet goed aansloot bij de definities en categorieën van het IPCC.
In het Kyotoprotocol is afgesproken dat Nederland jaarlijks rapporteert over de broeikasgasemissies in het National Inventory Report (NIR). Landen worden daarbij aangemoedigd landspecifieke gegevens te gebruiken in plaats van de standaarddata die het IPCC aanbiedt. Nederland heeft aan dat verzoek gehoor gegeven.
Het rapport geeft een beschrijving van de rekenregels van het IPCC en de databronnen die Nederland heeft gebruikt om de uitstoot van lachgas uit de landbouwbodem te rapporteren. De uitvoerige toelichting hierbij maakt deze werkwijze toegankelijk voor experts. Het rapport omvat ten slotte een overzicht van de officieel geregistreerde lachgasemissies uit de
landbouwbodem en van alle onderliggende data tussen 1990 en 2003.
Trefwoorden: lachgas, broeikasgas, emissies, dierlijke mest, kunstmest, Kyoto protocol, klimaatverandering, IPCC, landbouwbodem, nitrificatie, denitrificatie
Contents
Summary 7
1. Introduction 9
2. Agricultural nitrogen flow in the Netherlands 11 3. Direct N2O (nitrous oxide) emissions from agricultural soils 13
3.1 Contribution of agricultural direct N2O emissions to total Dutch GHG emissions 13
3.2 Scientific background of direct N2O emissions from agricultural soils 13
3.3 Method of calculating direct N2O emissions from agricultural soils 15
3.4 Relevant statistical data necessary for calculating direct N2O emissions from agricultural soils 16
3.5 Emission factors for direct N2O emissions from agricultural soils 21
3.6 Overview of direct N2O emissions from agricultural soils 1990 - 2003 24
4. Indirect N2O (nitrous oxide) emissions from agricultural soils 27
4.1 Contribution of agricultural indirect N2O emissions to total Dutch GHG emissions 27
4.2 Scientific background of indirect N2O emissions from agricultural soils 27
4.3 Method of calculating indirect N2O emissions from agricultural soils 28
4.4 Relevant statistical data necessary for calculating indirect N2O emissions from agricultural soils 29
4.5 Emission factors for indirect N2O emissions from agricultural soils 30
4.6 Overview of indirect N2O emissions from agricultural soils 1990 - 2003 31
5. Reflection and recommendations 33
References 35
Appendix 1. Basic data on agricultural nitrogen in the Netherlands 1990 – 2003 39 Appendix 2. Animal numbers in the Netherlands 1990 - 2003 40 Appendix 3. Nitrogen excretion per animal type 1990 - 2003 42 Appendix 4. Biological nitrogen fixation and area of crops involved 1990 – 2003 45 Appendix 5. Crop residues: data per type of crop 46 Appendix 6. Crop residues: area of crops involved 1990 – 2003 48
Summary
The countries that have ratified the Kyoto Protocol are obliged to provide an annual National Inventory Report (NIR) on the relevant greenhouse gas (GHG) emissions. To facilitate the production of national emission inventories, the Intergovernmental Panel on Climate Change (IPCC) has issued Good Practice Guidelines. At the same time the IPCC encourages
countries to use country-specific methods and data if these give a more realistic picture of the emission of greenhouse gases. However, if a country uses country-specific methods and data, it has to provide a transparent description of the emission calculation method and data
sources used.
This report describes the calculation schemes and data sources used in the Netherlands for direct and indirect nitrous oxide emissions from agricultural soils, due to nitrification and denitrification processes.
• Direct emissions result from the application of animal manure and fertilizer to agricultural soils, from manure production in the meadow, from crop residues left in the field, from biological nitrogen fixation by crops and from cultivation of organic soils (histosols).
• Indirect emissions are the result of the subsequent leaching of nitrate from agricultural soils to ground water and surface waters. Deposition of ammonia that had been
volatilized as a result of agricultural activities contributes to indirect emissions of nitrous oxide.
The Netherlands is characterised by a high animal density and a high fertilizer consumption, which makes available a considerable amount of statistical data on animal manure and fertilizer to comply with environmental protection and manure legislation. The Dutch recommendations for fertilizer use also take into account the nitrogen release from crop residues left in the field, from biological nitrogen fixing crops and from cultivated organic soils (histosols) with a lowered ground water table. The availability of these data in the Netherlands means that country- and year-specific animal manure and fertilizer data can be used as well as country-specific data on crop residues and organic soils. In facilitating expert reviewing, this report presents the Dutch approach and also provides an overview of the Dutch data used for the calculations.
This report not only provides the calculation schemes but also presents an overview of direct and indirect nitrous oxide emissions from agricultural soils and all underlying data used in the 1990 – 2003 period.
1.
Introduction
The United Nations Framework Convention on Climate Change (UNFCCC), aimed at stabilizing emissions of greenhouse gases to levels that prevent a negative impact of human activities on climate was agreed on in Rio de Janeiro in 1992. The convention has been ratified by the Netherlands and came into force in March 1994. One of the commitments for Parties under the Convention is to develop, publish and regularly update national emission inventories of greenhouse gases.
The awareness that further steps were needed led in 1997 to the Kyoto Protocol, in which Annex 1 Parties agreed to reduce greenhouse gas emissions by some 5% in the 2008 - 2012 period relative to 1990. Reduction commitments differ per country. The agreements reached in Kyoto and, subsequently, in the European Union, have resulted in a 6% emission reduction commitment for the Netherlands. This target pertains to the most important greenhouse gases: carbon dioxide (CO2), nitrous oxide (N2O), methane (CH4) and a number of fluorinated (F)
gases.
The Netherlands has implemented a series of policies and measures to achieve a reduction in greenhouse gas emissions. Emissions and emission reductions have to be monitored,
registered and reported in compliance with international (IPCC) standards.
The monitoring process in the Netherlands
The Netherlands has, for many years, had a system for the registration and reporting of relevant emissions to air, water and soil. This system, the Pollutant Emission Register (PER), was implemented under the responsibility of the Ministry of Housing, Spatial Planning and the Environment (VROM). Since April 2004, the Netherlands Environmental Assessment Agency (MNP in Dutch) has coordinated the PER on behalf of the Ministry. The MNP acts as the interface between science and policy. It assesses the quality of the environment for people and ecosystems so as to advise national and international policy makers.
Several institutes are involved in the process of compiling the national greenhouse gas inventory. Actual data collection and elaboration is done by institutes such as CBS, MNP, RIVM, LEI and TNO1 on the basis of the annual environmental reports from companies, questionnaires and studies. Agricultural data are collected and reported by LEI (Agricultural Economics Research Institute) and CBS (Statistics Netherlands). MNP calculates the
methane and nitrous oxide emissions on the basis of the annual agricultural census data. In December 2005 SenterNovem was designated by law as the National Inventory Entity. In addition to co-ordinating the establishment of a National System for monitoring greenhouse gas emissions, the tasks of SenterNovem include the overall co-ordination of (improved) quality control and quality assurance activities as part of the National System and co-ordination of the support/response to the UNFCCC review process. In this context,
SenterNovem was involved in the development of monitoring protocols for greenhouse gas emissions and also commissioned this background document.
The Monitoring Improvement Programme
The Kyoto Protocol under the UNFCCC requires Parties to implement a national system for greenhouse gas emissions. This is a programme implemented in the Netherlands under the responsibility of the Ministry of VROM (Environment), which has led to the establishment of the Dutch National System. This system was in place by the end of 2005. Practical
co-ordination of this programme was assigned to SenterNovem. The most important projects in this programme included:
• Adaptation of the monitoring procedures (where needed) to new international requirements, with methods, instructions, working processes, tasks and
responsibilities described in protocols. Where necessary, agreements with sectors and institutes were made on adapting the present methods to comply with new
international standards.
• Updating and elaborating the quality assurance and control process of greenhouse gas monitoring.
• Improving the uncertainty assessment and management in emission data. Many data necessarily imply estimates or rough assessments; the climate convention requires an assessment of related uncertainties.
• Studies into more accurate and detailed emission factors and/or methodologies.
The background document
This report, the result of a study carried out as part of the improvement programme, provides background information for two agricultural protocols available via www.greenhousegases.nl
These include:
• nitrous oxide emissions from agricultural soils: direct emissions and emissions from ‘animal production’ (this is the IPCC term for production of animal manure while grazing in the meadow).
• indirect nitrous oxide emissions from agricultural soils.
The report also provides an overview of emissions and underlying statistical data used. After a brief overview of the agricultural nitrogen flow in the Netherlands in Chapter 2, the two subsequent chapters describe the Dutch procedures for calculating direct and indirect nitrous oxide emissions from agricultural soils. Nitrous oxide emissions from animal production (grazing animals) are included in direct emissions. These two chapters may be read independently. The last chapter of the report (Chapter 5) reflects briefly on several topics that might be put on the research agenda.
This background document was originally intended for NIR 2005, covering the 1990 – 2003 period (Klein Goldewijk et al., 2005). Because of a delay in preparation, however, it was decided to include new insights used for NIR 2006. In this way the report serves as a background document for NIR 2006. This meant including the methodology for the full 1990 – 2004 period, but presenting data for the 1990 – 2003 period, data being in conformity with the NIR 2006 (Brandes et al., 2006).
2.
Agricultural nitrogen flow in the Netherlands
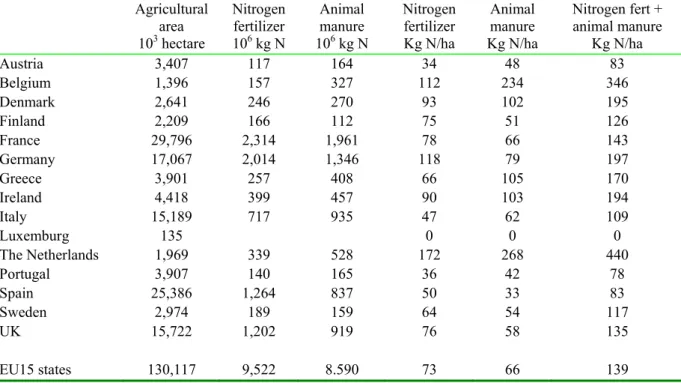
The Netherlands, with a total agricultural area of 2,000,000 hectare, is characterized by a high animal density and a high level of fertilizer use. Amidst other European countries it ranks highest with respect to nitrogen loading per hectare of agricultural land. Table 2.1 presents the figures for all EU15 Member States for the year 2000. The high use of fertilizer on grassland is one of the reasons that the Netherlands uses about 2.4 times more fertilizer nitrogen per hectare than the average figure of 73 kg per hectare for the EU15. The high animal density in the Netherlands is responsible for a four times higher manure nitrogen production per hectare than the EU15 average figure of 66 kg per hectare of agricultural area.
Table 2.1 Fertilizer use and animal manure production in de EU15 Member States in 2000.
Agricultural
area Nitrogen fertilizer Animal manure Nitrogen fertilizer Animal manure Nitrogen fert + animal manure 103 hectare 106 kg N 106 kg N Kg N/ha Kg N/ha Kg N/ha
Austria 3,407 117 164 34 48 83 Belgium 1,396 157 327 112 234 346 Denmark 2,641 246 270 93 102 195 Finland 2,209 166 112 75 51 126 France 29,796 2,314 1,961 78 66 143 Germany 17,067 2,014 1,346 118 79 197 Greece 3,901 257 408 66 105 170 Ireland 4,418 399 457 90 103 194 Italy 15,189 717 935 47 62 109 Luxemburg 135 0 0 0 The Netherlands 1,969 339 528 172 268 440 Portugal 3,907 140 165 36 42 78 Spain 25,386 1,264 837 50 33 83 Sweden 2,974 189 159 64 54 117 UK 15,722 1,202 919 76 58 135 EU15 states 130,117 9,522 8.590 73 66 139
Source: agricultural areas: Eurostat; fertilizer and manure data: EEA, 2006
Some basic data for the Netherlands are presented in Table 2.2. Both the nitrogen fertilizer consumption and the nitrogen excretion by animals decreased by approximately 30% in the 1990 – 2003 period. This is the result of the Dutch manure policy to reduce the load of nitrogen and phosphorus to agricultural soils in order to minimize nitrate and phosphate leaching to ground water and surface water.
The nitrogen excretion through animal husbandry in the Netherlands is split up in excretion in the animal house and excretion in the meadow.
In the 1990 – 2003 period the amount of nitrogen excreted in animal houses decreased from 493 to 376 million kg; this corresponds to a decrease of 24%. During manure storage in the animal house and in the storage facilities outside the animal house, ammonia is emitted to the air. A small part of the stored amount of manure which is available for land spreading is exported abroad (<5%). Land spreading also gives rise to ammonia volatilization, resulting in a lower net nitrogen flow to the soil. Between 1990 and 2003 the net flow of nitrogen in
stored animal manure to soil decreased from 315 to 281 million kg, a decrease of 11%. Apparently the 24% decrease of total nitrogen excretion effectuated by the Dutch manure policy is not fully reflected in the 11% decrease of the net nitrogen flow to soil. Reason is that the Dutch manure policy is partly counteracted by the Dutch ammonia policy aimed at reducing ammonia emissions from animal houses, animal manure storages outside the animal houses and ammonia emissions during manure application. Low ammonia emissions from manure go along with conservation of a relatively higher amount of nitrogen in the animal manure. In 1990 almost all animal manure was applied on the surface and in subsequent years low emission techniques like shallow (sod) injection on grasslands and direct incorporation on arable lands were introduced and made obligatory.
In the 1990 – 2003 period the nitrogen excretion in the meadow is nearly halved, because the period that cattle stay in the meadow for grazing has decreased. This is done in order to increase both the cost-effectiveness of milk production and the efficiency of manure application as an effect of the Dutch manure policy.
Table 2.2 Agricultural nitrogen flow in the Netherlands, with amounts given in 106 kg N.
1990 1995 2000 2003 Change 2003 - 1990 Nitrogen fertilizer consumption 412.0 406.0 339.0 291.0 - 29% of which ammonium fertilizer 3.6 11.2 6.5 40.1 + 1023% NH3-N emission during application 11.1 10.6 9.2 11.1 - 1%
Net fertilizer to soil 400.9 395.4 329.8 279.9 - 30%
Nitrogen excretion by animals 663.8 656.9 528.1 470.7 - 29% Nitrogen excretion in animals houses 493.0 500.4 415.0 375.7 - 24%
of which in solid form 61.9 71.2 76.9 59.6 - 4%
of which in liquid form 431.2 429.3 338.0 316.1 - 27% NH3-N emission in animal houses 73.5 73.8 60.7 48.7 - 34%
Net available manure for application 419.5 426.6 354.3 327.0 - 22% Nitrogen in manure exported abroad 6.4 22.1 14.7 12.0 + 88% NH3-N emission during application 98.2 51.4 36.8 33.8 - 66%
Net animal manure to soil 314.9 353.1 302.7 281.2 - 11% Nitrogen excretion in meadow 170.8 156.5 113.1 95.0 - 44% NH3-N emission in meadow 13.0 11.9 8.5 7.1 - 45%
Net animal manure to soil 157.8 144.6 104.6 87.9 - 44% Nitrogen fixation in arable crops 7.8 4.9 4.7 5.2 - 34% Nitrogen in crop residues left in field 36.4 34.9 34.1 34.5 - 5% Nitrogen in sewage sludge on agric. land 5.0 1.5 1.5 1.6 - 68% Total agricultural NH3-N emission 195.8 147.7 115.2 100.6 - 49%
3.
Direct N2
O (nitrous oxide) emissions from
agricultural soils
This chapter focuses on direct nitrous oxide emissions from agricultural soils (IPCC source category 4D1). Animal production (IPCC source category 4D2) is also included in this chapter. Direct emissions are linked to direct nitrogen additions to the agricultural soils like nitrogen fertilizer and animal manure.
Indirect nitrous oxide emissions are linked to the leaching of nitrate from the upper soil and to the deposition of NOx and NH3 emitted during manure management, and fertilizer and
manure application. Chapter 4 deals with the indirect emissions.
3.1
Contribution of agricultural direct N
2O emissions to total
Dutch GHG emissions
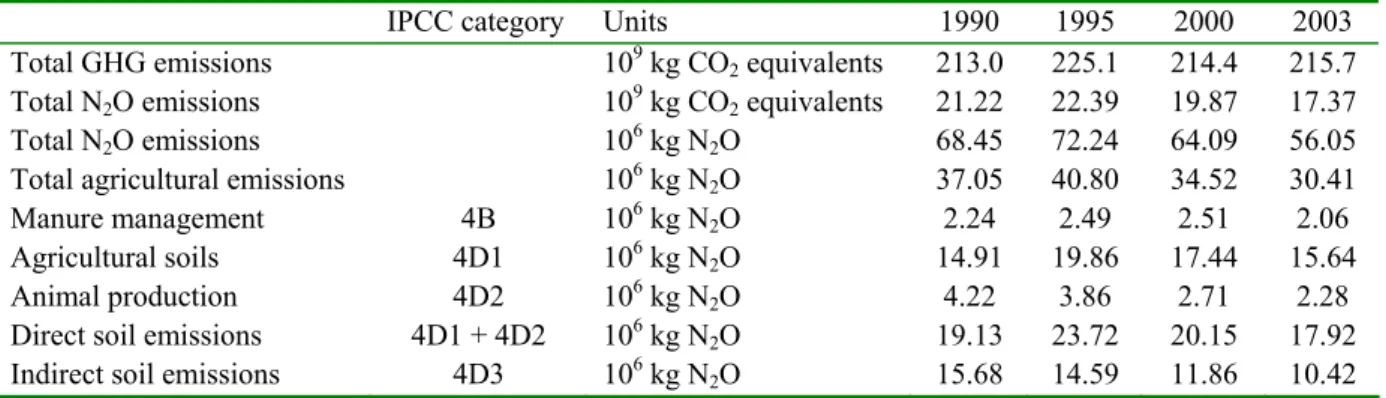
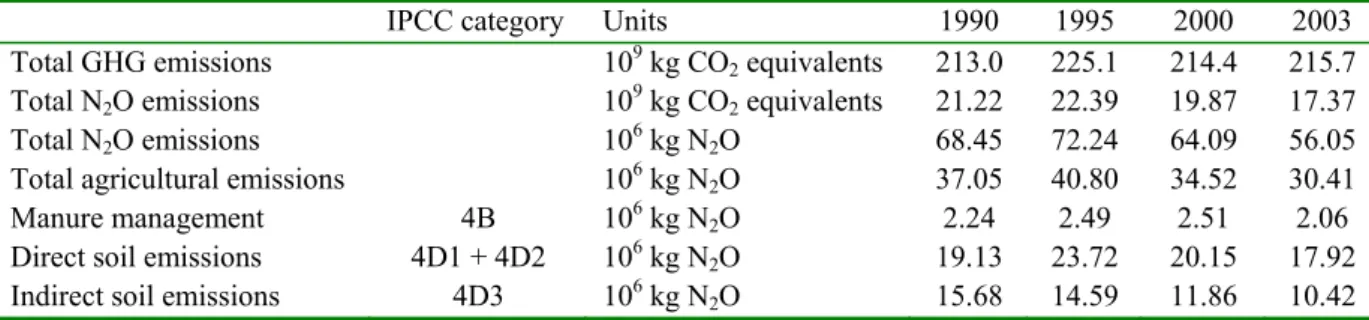
Total Dutch greenhouse gas emissions were about 215 * 109 kg CO2 equivalent in 2003
(Brandes et al., 2006). Roughly 10% is N2O based and the share of agriculture in N2O is
roughly 50% (Table 3.1). Direct soil emissions (including animal production emissions) comprise 50 to 60% of agricultural soil emissions. Manure management comprises the nitrous oxide emissions from animal houses. These emissions are discussed in another background document (Van der Hoek and Van Schijndel, 2006) and associated protocol (VROM, 2005c). The protocol is also available via www.greenhousegases.nl.
Table 3.1 Relevance of agricultural nitrous oxide emissions in the Netherlands.
IPCC category Units 1990 1995 2000 2003
Total GHG emissions 109 kg CO
2 equivalents 213.0 225.1 214.4 215.7
Total N2O emissions 109 kg CO2 equivalents 21.22 22.39 19.87 17.37
Total N2O emissions 106 kg N2O 68.45 72.24 64.09 56.05
Total agricultural emissions 106 kg N
2O 37.05 40.80 34.52 30.41 Manure management 4B 106 kg N 2O 2.24 2.49 2.51 2.06 Agricultural soils 4D1 106 kg N 2O 14.91 19.86 17.44 15.64 Animal production 4D2 106 kg N 2O 4.22 3.86 2.71 2.28
Direct soil emissions 4D1 + 4D2 106 kg N
2O 19.13 23.72 20.15 17.92
Indirect soil emissions 4D3 106 kg N
2O 15.68 14.59 11.86 10.42
Source: Brandes et al., 2006
3.2
Scientific background of direct N
2O emissions from
agricultural soils
Nitrogen is involved in many important soil processes. Nitrogen added to the soil can be in mineral form (ammonium or nitrate) like synthetic fertilizers, in organic form like compost and sewage sludge or it can be in both forms like in animal manure. The mineral nitrogen (e.g. ammonium) is readily transformed into nitrate. The organic nitrogen decomposition is a slower process, but will also end up as mineral nitrogen. In the soil, mineral nitrogen is incorporated into soil organic matter and at the same time soil organic matter is decomposed.
Free ammonium and nitrate can be taken up by crops and nitrate is also susceptible to leaching. Nitrate can also be denitrified to nitrogen gas.
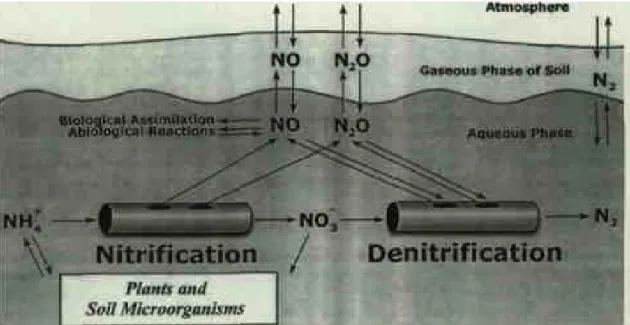
Nitrous oxide can be produced as a by-product during nitrification and denitrification processes. Nitrification is an aerobic process which oxidizes ammonium into nitrate and denitrification is an anaerobic process which denitrifies nitrate into nitrogen gas. When the conditions are insufficiently aerobic (nitrification) or insufficiently anaerobic (denitrification) nitrous oxide is likely to be formed.
Figure 3.1 Effect of water-filled pore space on nitrification and denitrification (Davidson et al., 2000).
The water-filled pore space (WFPS) concept is very useful in understanding when suboptimal conditions prevail. WFPS is the percentage of total soil pores occupied by water. Optimal water contents for nitrification range between 30% and 70% WFPS. At the upper end of this range oxygen transfer can be limited and nitrous oxide can be produced. Above 60% WFPS denitrification will take place and because there is no absolute anaerobic situation, nitrous oxide can be produced as a by-product. With higher WFPS levels the anaerobic situation is more guaranteed and the production of nitrous oxide will decrease. Nitric oxide (NO) can be produced too during nitrification and denitrification (Firestone and Davidson, 1989;
Davidson et al., 2000). Nitric oxide, however, is not discussed in this report, because it is not a greenhouse gas.
There are three levels of regulating the nitrous oxide emissions leaving the soil: 1. The amount of ammonium and nitrate in the soil.
2. The conversion rate of ammonium and nitrate into nitrous oxide.
3. The conversion rate of nitrous oxide into nitrogen gas before it leaves the soil.
This regulation is also known as the hole in pipe concept (Figure 3.2). Ammonium enters the first pipe (= nitrification) and leaves it as nitrate, whereas holes in this pipe represent the escape of nitric and nitrous oxides. Nitrate enters the second pipe (= denitrification) and nitrogen gas (N2) is leaving and holes in this pipe represent the escape of nitric and nitrous
oxides as well as the entrance of nitric and nitrous oxides produced elsewhere. The nitrogen flow into the pipes and/or total nitrogen output via crop products is the first level of
regulation and the holes in the pipes represent the second and third levels (Firestone and Davidson, 1989; Davidson et al., 2000).
Figure 3.2 Hole in pipe concept (Davidson et al., 2000).
Blocking one or more of these holes in the pipe (without decreasing the total input and/or total output via crops) usually leads to increased fluxes from other holes. The extent of the changes in the fluxes depends on the local circumstances.
Detailed information on emission factors for nitrous oxide emissions for different nitrogen sources and different soil types will be presented in section 3.5.
3.3
Method of calculating direct N
2O emissions from
agricultural soils
Until 2004 the direct nitrous oxide emissions from agricultural soils were calculated for most sources as described in the IPCC Guidelines (1997, 2001). Country-specific activity data for nitrogen fertilizer, animal manure and ammonia volatilization were used as well as country-specific emission factors (Kroeze, 1994). Later on, the calculation methods were summarized in Spakman et al. (1997, 2003).
In 2005 the calculation method was adjusted by including crop residues and the cultivation of organic soils (histosols) as two new sources and removing the source background emissions for a better compliance with IPCC source definitions. Other minor adjustments are found in the calculation method for biological nitrogen fixing crops and for animal grazing (= animal production), and in the introduction of two different emission factors for two types of nitrogen fertilizers.
This section gives a full description of the calculation methods as they are now in use in the Netherlands and also provides background information for the following agricultural protocol, which is available via www.greenhousegases.nl:
• Nitrous oxide emissions from agricultural soils: direct emissions and emissions from animal production (VROM, 2005a).
The IPCC Guidelines methodology for the calculation of direct nitrous oxide emissions from agricultural soils is based on an emission factor per kg N in the source, see Equation (1). Total N2O Emission = ∑ 44/28 * N amount in sourcei * Emission factor per kg N in sourcei
(1)
The factor 44/28 is used for converting N2O-N into N2O
According to the IPCC Guidelines the net amount of nitrogen in every source has to be taken into account (IPCC, 1997, p 4.93 and IPCC, 2001, p 4.56). This means that the corresponding ammonia nitrogen emissions have to be subtracted.
The following seven sources are taken into account:
IPCC category 4D1 - synthetic fertilizer applied to agricultural soils - animal manure applied to agricultural soils - sewage sludge applied to agricultural soils2
- biological nitrogen fixation by crops
- crop residues
- cultivation of organic soils (histosols)
IPCC category 4D2 - animal manure during grazing (= animal production)
The following two soil types are taken into account: mineral soils and organic soils. Organic soils (= histosols) are soils containing an organic rich surface layer at least 40 cm in
thickness, with a minimum of 20% organic matter if the clay content is low, and a minimum of 30% organic matter where the clay content exceeds 50% (IPCC, 2001, page 4.53;
Kuikman et al., 2005).
3.4
Relevant statistical data necessary for calculating direct
N
2O emissions from agricultural soils
The Netherlands are characterized by a high animal density. As a consequence of manure and ammonia policy, a lot of statistical data for animal manure and ammonia emissions is
available. Therefore the Netherlands use country- and year-specific values for nitrogen excretion per animal and for ammonia emissions.
This section provides information about the statistical data (= activity data) necessary to calculate the direct nitrous oxide emissions from the seven nitrogen sources mentioned in section 3.3. The nitrogen sources are described in the same sequence as in section 3.3, and for every nitrogen source the appropriate subdivision of mineral soils and organic soils is given. The IPCC methodology is based on the net supply of nitrogen, and gives default figures for ammonia emissions. Country- and year-specific values for ammonia emissions are used in the Dutch calculations.
2 This source has been included in the latest submission of the National Inventory Report (NIR2006), which will
● Synthetic fertilizer (IPCC category 4D1)
Net synthetic nitrogen fertilizer to soil = A – B
A = amount of applied nitrogen fertilizer, specified into ammonium fertilizer (without nitrate) and other nitrogenous fertilizer, which, every year is recorded by LEI (Dutch Agricultural Economics Research Institute) and reported in Landbouwcijfers (Agricultural Data); figures also available on the internet via www.lei.wur.nl (see also Appendix 1).
B = ammonia emissions associated with fertilizer application are taken from the annual emission inventories from PER (Pollutant Emission Register). The calculation method for these ammonia emissions is described in full detail in Van der Hoek (1994, 2002). Emission data are available via www.mnp.nl, click through to Environmental Data Compendium (http://www.mnp.nl/mnc/index-en.html) (see also Appendix 1). The country-specific ammonia emissions for nitrogen fertilizer application are much lower than the IPCC default values of 10%.
It is assumed that 90% of the fertilizer is used on mineral soils and 10% on organic soils. These figures reflect the subdivision of the Dutch agricultural soils into mineral soils and organic soils (Kroeze, 1994). Very recently the area of organic soils was calculated at 223,000 hectare, which is about 11% of the total Dutch agricultural area (Kuikman et al., 2005).
● Animal manure applied to agricultural soils (IPCC category 4D1)
Net animal manure nitrogen application to soil = A – B – C – D – E
A = total nitrogen excretion by the animals as calculated by the WUM (Working Group on Uniform Data for Animal Excretion) on an annual basis for all animal categories except horses and ponies. The first WUM reports describe in detail the methodology (WUM, 1994a, b and c); for subsequent years an annual publication is available (Van Eerdt, 1995a, b, 1996, 1997, 1998, 1999, Van Eerdt et al., 2003, Van Bruggen, 2003, 2004, 2005).
Data on annual nitrogen excretion for horses and ponies are taken from the Belgian manure legislation (VLM, 2000). It is assumed that 70% of the annual manure production of horses and ponies is produced in the animal house and 30% in the meadow (Van der Hoek and Van Schijndel, 2006).
The nitrogen excretion per animal type is collected in Appendix 3 and the number of animals in the Netherlands is presented in Appendix 2. Combining Appendices 2 and 3 results in total nitrogen excretion by the animals; national totals are presented in Appendix 1.
B = total nitrogen excretion in the meadow, calculated by the WUM, see under entry A. C = ammonia emissions from animal houses and manure storage facilities outside the animal houses, taken from the annual emission inventories from PER (Pollutant Emission Register). The calculation method for these ammonia emissions is described in full detail in Van der Hoek (1994, 2002). Emission data are available via www.mnp.nl and then go to
Environmental Data Compendium (http://www.mnp.nl/mnc/index-en.html) (see also Appendix 1).
Ammonia emissions from horses and ponies are not yet accounted for by PER, but will be in the near future. Instead we used an average emission factor for the housing period of
3.6 kg NH3 per animal per year. This value is derived from the emission factors for horses
and ponies used in the Dutch ammonia legislation (RAV, 2005). The average emission factor is calculated by multiplying the share of the numbers per animal type in the total population of horses and ponies times the emission factor per animal type: 16/36 * 5.0 (horses over 3 year) + 8/36 * 2.1 (horses under 3 year) + 9/36 * 3.1 (ponies over 3 year) + 3/36 * 1.3 (ponies under 3 year) = 3.6 kg NH3.
D = animal manure exported abroad, taken from the annual emission inventories from PER (Pollutant Emission Register). Data are available via www.mnp.nl, click through to the Environmental Data Compendium (http://www.mnp.nl/mnc/index-en.html) (see also Appendix 1).
E = ammonia emissions during application of animal manure, taken from the annual emission inventories from PER (Pollutant Emission Register). The calculation method for these
ammonia emissions is described in full detail in Van der Hoek (1994, 2002). Emission data are available via www.mnp.nl and, click through to Environmental Data Compendium (http://www.mnp.nl/mnc/index-en.html) (see also Appendix 1).
Ammonia emissions during application of manure from horses and ponies are not accounted for by PER, making entry E a little underestimated.
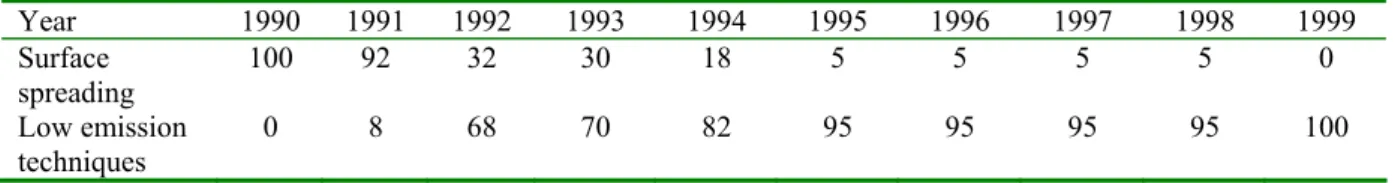
The ammonia policy implied that from 1990 onwards surface spreading of animal manure was gradually replaced by shallow (sod) injection on grassland and by direct incorporation on arable land. The implementation of low emission application techniques took place in the 1990 – 1995 period, see Table 3.2 (Van der Hoek, 2002).
Table 3.2 Implementation of low emission application techniques for animal manure in the Netherlands (in % of total applied animal manure).
Year 1990 1991 1992 1993 1994 1995 1996 1997 1998 1999 Surface spreading 100 92 32 30 18 5 5 5 5 0 Low emission techniques 0 8 68 70 82 95 95 95 95 100
Source: Van der Hoek, 2002
The country-specific ammonia emissions from animal housing, manure storage outside the animal houses, manure application and manure during grazing (defined as % of total nitrogen excretion) decreased from approximately 28% in 1990 to approximately 19% in 2003. The IPCC default value is 20%. The Dutch figures have the advantage that they are year specific and therefore reflect the effects of the Dutch ammonia emissions policy.
It is assumed that 87% of the animal manure is used on mineral soils and 13% on organic soils. These figures reflect the subdivision of the Dutch agricultural soils into mineral soils and organic soils (Kroeze, 1994). Very recently the area of organic soils was calculated at 223,000 hectare, which is about 11% of the total Dutch agricultural area (Kuikman et al., 2005). The net nitrogen mineralization in cultivated organic soils with a low ground water table implies a saving on nitrogen fertilizer, and explains why the figure of 10% for synthetic nitrogen fertilizer is lower than the figure of 13% for animal manure on organic soils.
● Sewage sludge applied to agricultural soils (IPCC category 4D1)
Net sewage sludge to soil = A – B
A = amount of applied sewage sludge taken from the annual emission inventories from PER (Pollutant Emission Register). The quantities are low and available via www.mnp.nl, click through to Environmental Data Compendium (http://www.mnp.nl/mnc/index-en.html) (see also Appendix 1).
B = ammonia emissions associated with sewage sludge application, not accounted for by PER. The mineral nitrogen content of sewage sludge is very low and therefore the ammonia emissions using land spreading are negligible. It is assumed that all sewage sludge is applied on mineral soils.
● Biological nitrogen fixation by crops (IPCC category 4D1)
In line with the IPCC Guidelines biological nitrogen fixation is calculated only for arable and horticultural crops. The following crops3 are considered in the Netherlands (the amount of country-specific fixated nitrogen per hectare is in brackets) (Mineralen Boekhouding, 1993):
Arable crops:
• Lucerne (422 kg N per hectare)
• Green peas (dry to harvest) and bump cherry, marrow fats and peas, kidney beans, peas (green to harvest) (164 kg N per hectare)
• Broad and field beans (325 kg N per hectare) Horticultural crops:
• Tribe broad beans (green to harvest), stick broad beans (75 kg N per hectare) • Broad beans (164 kg N per hectare).
Total areas grown with these crops are taken from the annual agricultural census. Arable and horticultural crops are assumed to be only grown on mineral soils. These data are reported in Landbouwcijfers (Agricultural Data), issued by LEI (Dutch Agricultural Economics Research Institute) and CBS (Statistics Netherlands) and included in Appendix 4. These data are also available on the internet www.cbs.nl (select Statline).
3 These crops have the following Dutch names:
Akkerbouw gewassen
• Luzerne (422 kg N per hectare)
• Groene erwten (droog te oogsten) en schokkers, kapucijners en grauwe erwten, bruine bonen, erwten (groen te oogsten) (164 kg N per hectare)
• Veldbonen (325 kg N per hectare) Tuinbouwgewassen
• Stambonen (groen te oogsten), pronk-/sla-/stokbonen (75 kg N per hectare) • Tuinbonen (164 kg N per hectare)
● Crop residues (IPCC category 4D1)
In line with the IPCC Guidelines only crop residues from arable and horticultural crops are taken into account. The Netherlands consider all arable and horticulture crops which are part of the annual agricultural census.
Also in line with IPCC Guidelines only above-ground parts of crops are considered as a source for N2O emission. The long history of fertilizer research in the Netherlands enables
the use of country-specific values for the nitrogen content in the above-ground parts of the crop residues. As these crops are harvested in mature state, fixed amounts of nitrogen are used for the different crop residues (Appendix 4 in Velthof and Kuikman, 2000). A correction has been made for the part of the residues that are leaving the field, for instance, straw from cereals and stems from fodder maize (personal communication of W. Van Dijk (Applied Plant Research, PPO in Dutch). This information is included for all crop types in Appendix 5. Total areas grown with arable and horticultural crops are taken from the annual agricultural census. These data are reported in Landbouwcijfers (Agricultural Data) issued by LEI (Dutch Agricultural Economics Research Institute) and CBS (Statistics Netherlands). This data are included in Appendix 6 and on the internet www.cbs.nl (select Statline).
The nitrogen release from incorporated crop residues is also accounted for in the Dutch Guidelines for fertilization of arable crops (Van Dijk, 2003). It is assumed that arable and horticultural crops are only grown on mineral soils.
● Cultivation of organic soils (histosols) (IPCC category 4D1)
Recently, the 1970 Dutch soil survey was actualized for organic soils. The area of cultivated organic soils was calculated at 223,000 hectare in the year 2003. The decrease in the organic soil area since the 1970 survey mainly took place in the early 1980s, due to the policy of lowering water tables in that period. Therefore it is reasonable to use the area of
223,000 hectare for the full 1990 – 2003 period (Kuikman et al., 2005).
Measurements of the decline of surface levels in organic soils areas were carried out in the Netherlands on a long-term basis. Combining these decline rates with carbon oxidation rates and C/N ratios of the organic soil layers that had disappeared results in an annual release of 235 kg nitrogen per hectare of cultivated organic soils with lowered water tables (Kuikman et al., 2005).
The nitrogen release from cultivated organic soils with lowered water tables is also accounted for in the Dutch Guidelines for fertilization of grasslands (Anonymous, 2005).
● Animal manure during grazing (= animal production) (IPCC cat 4D2)
Net animal manure nitrogen to soil by grazing = A – B – C
A = total nitrogen excretion by the animals, calculated by the WUM (Werkgroep
Uniformering Mestcijfers, Working Group on Uniform Data for Animal Excretion) on an annual basis for all animal categories except horses and ponies. The first WUM reports describe in detail the methodology (WUM, 1994a, b and c) and an annual publication is available for subsequent years (Van Eerdt, 1995a, b, 1996, 1997, 1998, 1999, Van Eerdt et al., 2003, Van Bruggen, 2003, 2004, 2005).
Data on annual nitrogen excretion for horses and ponies are taken from the Belgian manure legislation (VLM, 2000). It is assumed that 70% of the annual manure production of horses and ponies is produced in the animal house and 30% in the meadow (Van der Hoek and Van Schijndel, 2006). The nitrogen excretion per animal type is collected in Appendix 3 and the number of animals in the Netherlands is presented in Appendix 2. Combining Appendices 2 and 3 results in the total nitrogen excretion by the animals; the national totals are presented in Appendix 1.
B = total nitrogen excretion in animal houses, is calculated by the WUM, see under entry A. C = ammonia emissions during grazing are taken from the annual emission inventories from PER (Pollutant Emission Register). The calculation method for these ammonia emissions is described in full detail in Van der Hoek (1994, 2002). Emission data are available via
www.mnp.nl, click through to the Environmental Data Compendium (http://www.mnp.nl/mnc/index-en.html) (see also Appendix 1).
Ammonia emissions from horses and ponies during grazing are not accounted for by PER. As the contribution of horses and ponies to the total nitrogen excreted in the meadow is small, ranging from 0.6% in 1990 to 2.0% in 2003, this omission is negligible.
The Netherlands emission inventory differentiates between the nitrogen in faeces and urine with respect to the emission factor for nitrous oxide emissions (see section 3.5). The shares of nitrogen in faeces and urine of grazing cattle are dependent on the nitrogen content of grass. The shares of nitrogen in faeces and urine were assumed to be 30/70 in the 1990 – 1999 period and 35/65 in 2000 and onwards (Valk et al., 2002).
In contrast with the application of nitrogen fertilizer and animal manure to agricultural soils, no distinction is made between mineral soils and organic soils in the case of animal manure during grazing. This item is discussed in more detail in section 3.5.
3.5
Emission factors for direct N
2O emissions from
agricultural soils
Until recently the emission factors for direct nitrous oxide emissions from agricultural soils originated mainly in Dutch research (Kroeze, 1994). In this research the Netherlands distinguishes different emission factors for mineral soils and organic soils.
In 2005 the emission factors were reviewed and partly refined on the basis of data on N2O
emissions collected from research projects carried out under the ROB-Agro Programme4 (Kuikman et al., 2006). This review confirmed the use of some of the emission factors from the past (e.g. a doubling of the emission factor for organic soils compared to mineral soils for the application of nitrogen from fertilizer and manure). Measurements showed that after correction for a specific emission factor for cultivation of organic soils, the latter still have higher nitrous oxide emissions than mineral soils (Velthof et al., 1996).
4 ROB-Agro (Reductieplan Overige Broeikasgassen) is a program coordinated by SenterNovem and involves
research in the field of reduction of non-CO2 greenhouse gases. More information is available on the website
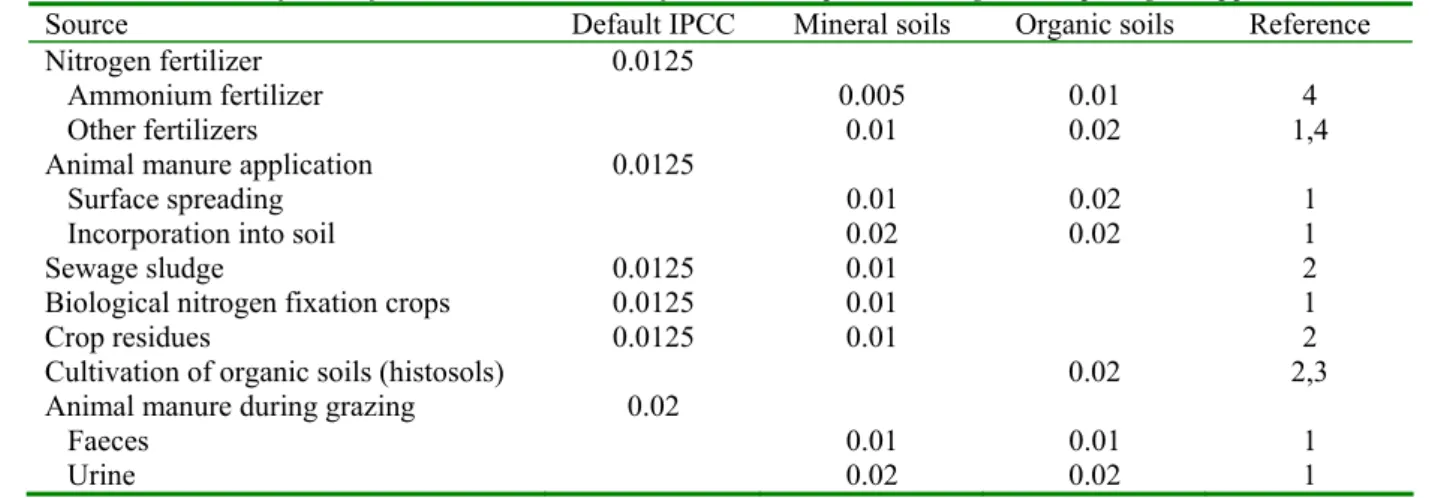
Therefore, most emission factors now in use in the Netherlands are the same as the ones used in the past (see Table 3.3 for these emission factors, along with the IPCC default values). The only difference is the refinement of the emission factor for synthetic fertilizer.
The emission factors for the seven nitrogen sources are described here in the same sequence as in section 3.3.
Table 3.3 Emission factors for direct N2O emission from soils, expressed as kg N2O-N per kg N supplied.
Source Default IPCC Mineral soils Organic soils Reference Nitrogen fertilizer 0.0125
Ammonium fertilizer 0.005 0.01 4
Other fertilizers 0.01 0.02 1,4
Animal manure application 0.0125
Surface spreading 0.01 0.02 1
Incorporation into soil 0.02 0.02 1
Sewage sludge 0.0125 0.01 2
Biological nitrogen fixation crops 0.0125 0.01 1
Crop residues 0.0125 0.01 2
Cultivation of organic soils (histosols) 0.02 2,3
Animal manure during grazing 0.02
Faeces 0.01 0.01 1
Urine 0.02 0.02 1
References 1 = Kroeze, 1994; 2 = this publication; 3 = Kuikman et al., 2005; 4 = Kuikman et al., 2006.
● Synthetic fertilizer (IPCC category 4D1)
The values of the emission factors for mineral (0.01) and organic soils (0.02) originated mainly in Dutch research in the early 1990s (Kroeze, 1994). More recent research showed that ammonium fertilizer (without nitrate) had lower nitrous oxide emissions on grassland in springtime especially during wet periods (Velthof et al., 1997). Therefore it has been decided to refine the emission factor for fertilizer application by using a 50% lower emission factor for ammonium fertilizer (without nitrate). These findings were confirmed by research carried out by Stehfest and Bouwman (2006) and by the review of Kuikman et al. (2006).
● Animal manure applied to agricultural soils (IPCC category 4D1)
The values of the emission factors for surface spreading and incorporation into the soil on mineral (0.01 and 0.02, respectively) and organic soils (0.02 and 0.02, respectively) originate mainly in Dutch research in the early 1990s (Kroeze, 1994). The higher value for
incorporation is explained by two mechanisms. Incorporation of animal manure into the soil produces less ammonia emission and hence more reactive nitrogen enters the soil.
Furthermore, the animal manure is more concentrated (e.g. hot spots) in comparison with surface spreading and hence the process conditions for nitrification and denitrification can be more suboptimal. A recent review of the literature showed that in most experiments with simultaneous surface spreading and incorporation the latter produces higher nitrous oxide emissions. It was, however, not possible to derive a new emission factor for incorporation or shallow (sod) injection (Kuikman et al., 2006). Therefore it was decided not to change the existing emission factors.
● Sewage sludge applied to agricultural soils (IPCC category 4D1)
Dutch research in the early 1990s did not pay attention to the application of sewage sludge on agricultural soils (Kroeze, 1994). However, later on sewage sludge was mentioned as a source to take into account (IPCC, 1997; 2001). There are no arguments that these emission factors should be any different than the emission factors for application of nitrogen fertilizer or animal manure on agricultural soils.
● Biological nitrogen fixation by crops (IPCC category 4D1)
The value of the emission factor for mineral (0.01) soils originates mainly in Dutch research in the early 1990s (Kroeze, 1994). There are no new Dutch measurements available so there is no reason to change this value. A recent Canadian study revealed that nitrous oxide emissions of biological nitrogen fixation crops are very low and hardly exceed the
background emissions from agricultural soils. As most of the nitrous oxide emissions arise from the roots, the authors propose to remove the biological nitrogen fixation crops as such from the IPCC inventory. Instead of reporting nitrous oxide emissions under biological nitrogen fixation crops, the amount of nitrogen should be added to the crop residues (Rochette and Janzen, 2005).
● Crop residues (IPCC category 4D1)
Nitrous oxide emissions from crop residues were not explicitly discussed in the study by Kroeze (1994). It was decided to use the emission factor 0.01 for mineral soils, because nitrogen losses from crop residues are comparable with application of nitrogen fertilizer and animal manure to mineral soils. A Dutch laboratory incubation study with crop residues showed that most crop residues had an emission factor less than 0.01. Only sprouts, mustard, and broccoli had higher emission factors on sandy soils, ranging from 0.03 to 0.06 (Velthof et al., 2002).
● Cultivation of organic soils (histosols) (IPCC category 4D1)
Nitrous oxide emissions from cultivation of organic soils were not explicitly discussed in the study by Kroeze (1994). However, the anthropogenic biogenic emissions (so-called
background emissions) from (organic) soils in Kroeze (1994) are implicitly comparable to the N2O emissions from the cultivation of organic soils.
The nitrogen which is mineralized in cultivated organic soils with low water tables is subject to the same nitrification and denitrification processes as the nitrogen from fertilizer and animal manure applied to organic soils. Therefore it is reasonable to use the emission factor of 0.02 for the mineralized nitrogen in organic soils with a low water table (Kuikman et al., 2005).
Combining the annual release of 235 kg nitrogen (see section 3.4) per hectare cultivated organic soils with an emission factor of 0.02 (see Table 3.3) results in a nitrous oxide
emission of 4.7 kg N2O-N per hectare of cultivated organic soils. This country-specific value
● Animal manure during grazing (= animal production) (IPCC cat 4D2)
The values of the emission factors for faeces (0.01) and urine (0.02) originate mainly in Dutch research in the early 1990s (Kroeze, 1994). The emission factor for urine is higher than for faeces because the ratio mineral nitrogen/total nitrogen is higher in urine than in faeces, leading to faster nitrification and denitrification in urine-affected spots. Furthermore, urine penetrates faster into the soil than faeces, which enhances the lack of sufficient oxygen in the soil for the nitrification process. Together with the higher mineral nitrogen ratio in urine, it is clear that urine creates a higher potential for suboptimal conditions for nitrification and denitrification than faeces. Finally, there are no new Dutch measurements available so there is no reason to change both of these emission factors.
● Comparison to IPCC default emission factors
To compare the country-specific emission factors with the IPCC defaults, implied emission factors have to be calculated on the same source level. The implied emission factors for nitrogen fertilizer (0.0102 – 0.0110), animal manure application (0.0113 – 0.0200) and animal manure during grazing (0.0165 – 0.0170) are presented in Table 3.4 of section 3.6. For nitrogen fertilizer and animal manure during grazing the country-specific implied emission factors are approximately 15 to 20% lower than the IPCC value. The implied emission factor is approximately 60% higher for application of animal manure after 1995 (this means almost 100% incorporation into soil).
3.6
Overview of direct N
2O emissions from agricultural soils
1990 - 2003
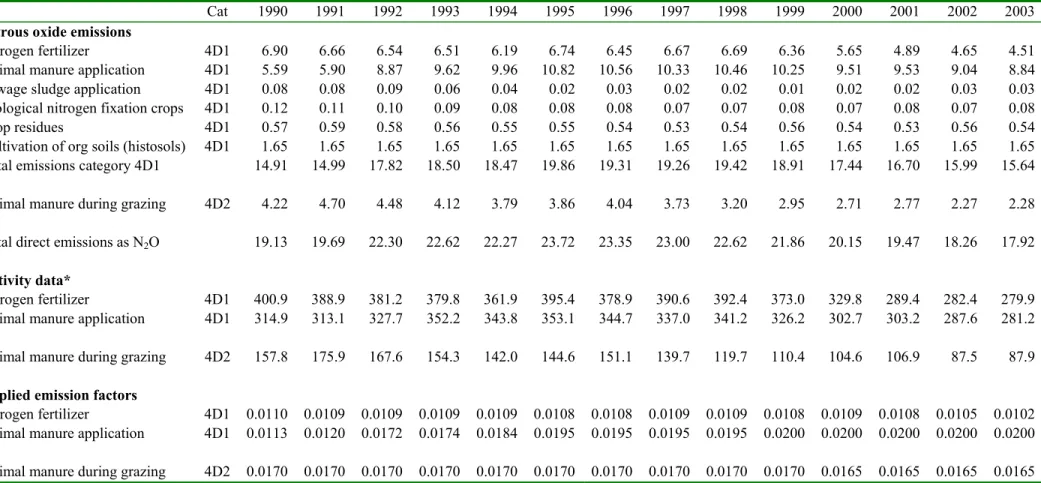
An overview of the direct nitrous oxide emissions for the different nitrogen sources is presented in Table 3.4. The total direct nitrous oxide emissions from agricultural soils increased in the 1990 -1995 period and steadily decreased in more recent years.
It should be noted that the direct nitrous oxide emissions increased in the 1990 – 1995 period and decreased after 1995. The increase is explained by the gradual implementation of low ammonia emission techniques for application of animal manure. These techniques have a higher emission factor for nitrous oxide than the original technique of surface spreading. The effects of decreasing amounts of nitrogen in fertilizer and animal manure become visible after 1995.
The implied emission factor is often used as a check on the correctness and completeness of the calculations. The implied emission factor is simply calculated by dividing the total emission by the total size of the source. For nitrogen fertilizer, animal manure application, and animal manure during grazing the implied emission factors are presented in Table 3.4. These sources are chosen because of the two types of activity data for each source (two types of nitrogen fertilizer, two animal manure application techniques and the presence of faeces and urine in animal manure during grazing) and the fact that emission factors are dependent on soil type (mineral soils or organic soils). It appears that the calculated implied emission factors are consistent with the assumptions and differentiations in the three sources. At the same time the implied emission factors present an overall average emission factor, which can be easily compared with the default IPCC emission factors (see also Table 3.3 and discussion at the beginning of section 3.5).
The total direct nitrous oxide emissions from agricultural soils for the Netherlands in the year 2000 are estimated at 20.15 * 106 kg. This corresponds with 10.2 kg N2O per hectare
agricultural soil. The total direct nitrous oxide emissions from agricultural soils for the EU15 Member States was estimated at 443.9* 106 kg in the year 2000, corresponding with
3.4 kg N2O per hectare of agricultural soil (EEA, 2006).
The amount of nitrogen in fertilizer and animal manure in the Netherlands is on average roughly three times higher than that in the EU15 Member States: 440 kg N per hectare versus 139 kg N per hectare, see Table 2.1. However, a more detailed analysis of all data sets will be necessary before a linear relationship between N2O emission and nitrogen input can be
Table 3.4 Overview of direct nitrous oxide emissions from agricultural soils during the 1990 – 2003 period.
Cat 1990 1991 1992 1993 1994 1995 1996 1997 1998 1999 2000 2001 2002 2003 Nitrous oxide emissions
Nitrogen fertilizer 4D1 6.90 6.66 6.54 6.51 6.19 6.74 6.45 6.67 6.69 6.36 5.65 4.89 4.65 4.51
Animal manure application 4D1 5.59 5.90 8.87 9.62 9.96 10.82 10.56 10.33 10.46 10.25 9.51 9.53 9.04 8.84
Sewage sludge application 4D1 0.08 0.08 0.09 0.06 0.04 0.02 0.03 0.02 0.02 0.01 0.02 0.02 0.03 0.03
Biological nitrogen fixation crops 4D1 0.12 0.11 0.10 0.09 0.08 0.08 0.08 0.07 0.07 0.08 0.07 0.08 0.07 0.08
Crop residues 4D1 0.57 0.59 0.58 0.56 0.55 0.55 0.54 0.53 0.54 0.56 0.54 0.53 0.56 0.54
Cultivation of org soils (histosols) 4D1 1.65 1.65 1.65 1.65 1.65 1.65 1.65 1.65 1.65 1.65 1.65 1.65 1.65 1.65
Total emissions category 4D1 14.91 14.99 17.82 18.50 18.47 19.86 19.31 19.26 19.42 18.91 17.44 16.70 15.99 15.64
Animal manure during grazing 4D2 4.22 4.70 4.48 4.12 3.79 3.86 4.04 3.73 3.20 2.95 2.71 2.77 2.27 2.28
Total direct emissions as N2O 19.13 19.69 22.30 22.62 22.27 23.72 23.35 23.00 22.62 21.86 20.15 19.47 18.26 17.92
Activity data*
Nitrogen fertilizer 4D1 400.9 388.9 381.2 379.8 361.9 395.4 378.9 390.6 392.4 373.0 329.8 289.4 282.4 279.9
Animal manure application 4D1 314.9 313.1 327.7 352.2 343.8 353.1 344.7 337.0 341.2 326.2 302.7 303.2 287.6 281.2
Animal manure during grazing 4D2 157.8 175.9 167.6 154.3 142.0 144.6 151.1 139.7 119.7 110.4 104.6 106.9 87.5 87.9
Implied emission factors
Nitrogen fertilizer 4D1 0.0110 0.0109 0.0109 0.0109 0.0109 0.0108 0.0108 0.0109 0.0109 0.0108 0.0109 0.0108 0.0105 0.0102
Animal manure application 4D1 0.0113 0.0120 0.0172 0.0174 0.0184 0.0195 0.0195 0.0195 0.0195 0.0200 0.0200 0.0200 0.0200 0.0200
Animal manure during grazing 4D2 0.0170 0.0170 0.0170 0.0170 0.0170 0.0170 0.0170 0.0170 0.0170 0.0170 0.0165 0.0165 0.0165 0.0165
Values of nitrous oxide emissions and activity data are given as 106 kg N
2O per year, implied emission factors as kg N2O-N per kg applied N
4.
Indirect N2
O (nitrous oxide) emissions from
agricultural soils
This chapter focuses on indirect nitrous oxide emissions from agricultural soils (IPCC source category 4D3). Direct emissions are linked to direct nitrogen inputs to the agricultural soils like nitrogen fertilizer and animal manure. Indirect emissions are linked to the leaching of nitrate from the upper soil and to the deposition of NOx and NH3.
Direct nitrous oxide emissions are discussed in Chapter 3.
4.1
Contribution of agricultural indirect N
2O emissions to
total Dutch GHG emissions
Total Dutch greenhouse gas emissions were about 215 * 109 kg CO2 equivalent in 2003
(Brandes et al., 2006). Roughly 10% is N2O-based and the share of agriculture in N2O is
roughly 50% (Table 4.1). Indirect soil emissions comprise roughly 40% of agricultural N2O
emissions. Direct soil emissions are discussed in Chapter 3. Manure management comprises the nitrous oxide emissions from animal houses, which are discussed in another background document (Van der Hoek and Van Schijndel, 2006) and associated protocol (VROM, 2005c). The protocol is also available via www.greenhousegases.nl.
Table 4.1 Relevance of agricultural nitrous oxide emissions in the Netherlands.
IPCC category Units 1990 1995 2000 2003
Total GHG emissions 109 kg CO
2 equivalents 213.0 225.1 214.4 215.7
Total N2O emissions 109 kg CO2 equivalents 21.22 22.39 19.87 17.37
Total N2O emissions 106 kg N2O 68.45 72.24 64.09 56.05
Total agricultural emissions 106 kg N
2O 37.05 40.80 34.52 30.41
Manure management 4B 106 kg N
2O 2.24 2.49 2.51 2.06
Direct soil emissions 4D1 + 4D2 106 kg N
2O 19.13 23.72 20.15 17.92
Indirect soil emissions 4D3 106 kg N
2O 15.68 14.59 11.86 10.42
Source: Brandes et al., 2006
4.2
Scientific background of indirect N
2O emissions from
agricultural soils
Indirect nitrous oxide emissions are connected with nitrate that is no longer available for agricultural plant uptake (usually 100 cm or more below the surface of soils) or with ammonium after volatilization and deposition elsewhere. This process usually leads to nitrogen loadings to ground water and surface waters or to deposition of nitrogen compounds on soil and surface waters.
In the root zone of a soil, ammonium is normally taken up by the crop or converted into nitrate, and only nitrate is susceptible for leaching. In the ground water flow and also in the receiving water bodies, denitrification can occur with simultaneous production of nitrous oxide. Runoff to surface waters and nitrogen deposition on soil and surface waters may also contain ammonium, which is readily converted to nitrate and is subsequently eventually
denitrified.
4.3
Method of calculating indirect N
2O emissions from
agricultural soils
Until 2004 the indirect nitrous oxide emissions were calculated with a method - later summarized in Spakman et al. (1997, 2003) - that was not comparable to the IPCC method (Kroeze, 1994).
In 2005 the IPCC method was adopted to calculate the indirect emissions. IPCC default values for emission factors and for the leaching fraction are used here in combination with country-specific activity data on nitrogen manure and fertilizer application and on ammonia volatilization.
This section gives a full description of the calculation methods as they are now in use in the Netherlands and also provides background information for the following agricultural protocol, available via www.greenhousegases.nl:
• Indirect nitrous oxide emissions from agricultural soils (VROM, 2005b).
The IPCC Guidelines methodology for calculation of indirect nitrous oxide emissions from agricultural soils is based on an emission factor per kg N in the applied nitrogen.
Total N2O Emission = ∑ 44/28 * N amount in sourcei * Emission factor per kg N in sourcei
(2)
The factor 44/28 is used for converting N2O-N into N2O.
The IPCC Guidelines distinguish five nitrogen sources for indirect N2O emissions:
1. Atmospheric deposition of NOx and NH3
2. Leaching and runoff of nitrogen that is applied to agricultural soils. 3. Discharge of human sewage into rivers and estuaries.
4. Formation of N2O in the atmosphere from NH3 emissions.
5. Discharge of effluents from food processing and other operations to surface waters. The calculation methods for the first and second sources are as follow.
● Atmospheric deposition of NO
xand NH
3The IPCC Guidelines explain that the calculations should be based on the emissions of NOx
and NH3 originating from nitrogen fertilizers and animal manure in the Netherlands and not
on the deposition of NOx and NH3 on Dutch territory (IPCC, 2001, page 4.67).
NOx emissions from fertilizer and animal manure application are not accounted for in the
Dutch annual emission inventories from PER (Pollutant Emission Register). However, this emission source was included for the NIR 2005 calculations on the basis of the assumption that NOx emissions are equal to 15% of the ammonia emissions in the Netherlands (based on
De Vries et al., 2003). During the critical review of this emission source during the preparations for the NIR 2006 the magnitude of this source was found to be uncertain. Therefore it was decided to leave out this emission source.
● Leaching and runoff of nitrogen that is applied to agricultural soils
A modified equation (3) is used, with the term FRACleach indicating which percentage the
nitrogen in the source is leached into the ground water.
Total N2O Emission = 44/28 * N amount in source * FRACleach * Emission factor per kg N
leached (3)
The factor 44/28 is used for converting N2O-N into N2O.
The last three nitrogen sources are not included in the agricultural emission inventory. • Discharge of human sewage into rivers and estuaries is discussed in the Waste sector
(CRF category 6B).
• Formation of N2O in the atmosphere from NH3 emissions is lacking in the IPCC
calculation method.
• Discharge of effluents from food processing and other operations to surface waters is discussed in the Waste sector (CRF category 6B).
4.4
Relevant statistical data necessary for calculating
indirect N
2O emissions from agricultural soils
This section provides information about the data that are necessary to calculate the indirect nitrous oxide emissions (see also equations 2 and 3).
● Atmospheric deposition of nitrogen
As described in section 4.3, calculation of nitrous oxide emissions after atmospheric
deposition of nitrogen has to be based on the emission of the nitrogen compounds and not on its deposition on Dutch territory.
Ammonia emissions from fertilizer application and agricultural activities (animal houses, manure storage facilities outside the animal houses, manure application and grazing) are taken from the annual emission inventories from PER (Pollutant Emission Register). The calculation method for these ammonia emissions is described in full detail in Van der Hoek (1994, 2002). Emission data are available via www.mnp.nl, then click through to the Environmental Data Compendium (http://www.mnp.nl/mnc/index-en.html (see also Appendix 1).
Ammonia emissions from horses and ponies are not yet accounted for by PER. Instead, we used an average emission factor for the housing period of 3.6 kg NH3 per animal per year.
The value of this factor is derived from the emission factors for horses and ponies used in the Dutch ammonia legislation (RAV, 2005). The average emission factor is calculated by multiplying the share of the numbers per animal type in the total population of horses and ponies times the emission factor per animal type: 16/36 * 5.0 (horses over 3 year) + 8/36 * 2.1 (horses under 3 year) + 9/36 * 3.1 (ponies over 3 year) + 3/36 * 1.3 (ponies under 3 year) = 3.6 kg NH3. The number of horses and ponies is taken from the Dutch annual census (see
Appendix 2).
Ammonia emissions during application of manure from horses and ponies are not accounted for by PER, indicating that this entry is a little underestimated.
Ammonia emissions from horses and ponies during grazing are not accounted for by PER. The small contribution of horses and ponies (ranging from 0.6% in 1990 to 2.0% in 2003 for the total nitrogen excreted in the meadow) makes this omission negligible.
● Nitrogen leaching and runoff
The IPCC Guidelines clearly indicate that the nitrogen supply with fertilizer and animal manure to the soil should not be corrected for their ammonia emissions. This reflects the methods’ assumption that such nitrogen is subject to leaching after redeposition to soil (IPCC, 2001, note 25 on page 4.71).
Only subtraction of animal manure exported abroad is justified. The Dutch inventory focuses on the nitrogen input by application of synthetic fertilizer and animal manure (including animal manure production during grazing) to the Dutch agricultural soils. The application of sewage sludge to agricultural soils is not taken into account. However, the mineral nitrogen content of sewage sludge is very low and therefore this omission is negligible.
Fertilizer and animal manure to soil = A + B – C
A = amount of applied nitrogen fertilizer, recorded every year by LEI (Dutch Agricultural Economics Research Institute) and reported in Landbouwcijfers (Agricultural Data); figures are also available on the internet via www.lei.wur.nl (see also Appendix 1).
B = total nitrogen excretion by the animals as calculated by the WUM (Working Group on Uniform Data for Animal Excretion) on an annual basis for all animal categories except horses and ponies. The first WUM reports describe in detail the methodology (WUM, 1994a, b and c), while an annual publication is available for subsequent years (Van Eerdt, 1995a, b, 1996, 1997, 1998, 1999, Van Eerdt et al., 2003, Van Bruggen, 2003, 2004, 2005).
Data on annual nitrogen excretion for horses and ponies are taken from the Belgian manure legislation (VLM, 2000).
The nitrogen excretion per animal type is collected in Appendix 3 and the number of animals in the Netherlands is presented in Appendix 2. Combining Appendices 2 and 3 results in the total nitrogen excretion by the animals, with the national totals presented in Appendix 1. C = amount of animal manure exported abroad, taken from the annual emission inventories from PER (Pollutant Emission Register). Data are available via www.mnp.nl and then go to Environmental Data Compendium (http://www.mnp.nl/mnc/index-en.html) (see also
Appendix 1).
4.5
Emission factors for indirect N
2O emissions from
agricultural soils
The following emission factors are used in the Dutch calculations.
● Atmospheric deposition of nitrogen
● Nitrogen leaching and runoff
The IPCC default values for FRACleach (= 0.30) and for the nitrous oxide emission factor
(0.025 kg N2O-N per kg N leached).
More information about the background of these default values is available (Seitzinger and Kroeze, 1998; Mosier et al., 1998; Nevison, 2000; Denier van der Gon et al., 2004). The Netherlands does not use country-specific values for FRACleach and the corresponding
emission factor. This is because of a lack of coherent data at the time (see also Chapter 5).
4.6
Overview of indirect N
2O emissions from agricultural
soils 1990 - 2003
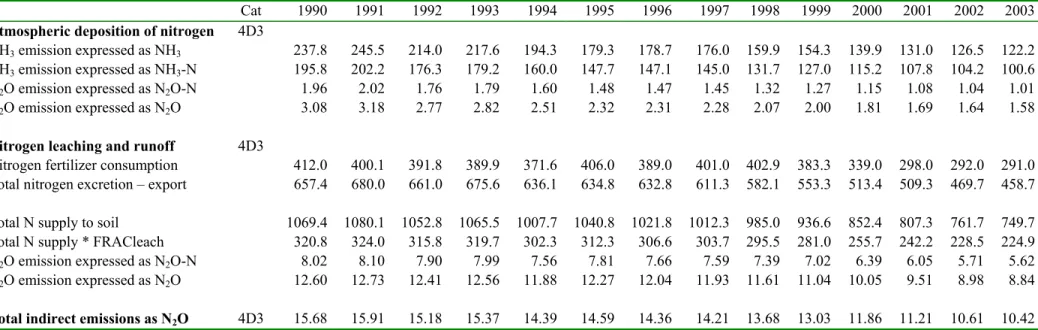
An overview of the indirect nitrous oxide emissions for the two nitrogen sources is presented in Table 4.2. The total indirect nitrous oxide emissions from agricultural soils decreased from 15.68 to 10.42 * 106 kg N2O in the 1990 – 2003 period. This decline is observed for both
atmospheric deposition of nitrogen and for leaching and runoff and corresponds with the decrease in ammonia emissions and nitrogen load to the soil, respectively.
Table 4.2 Overview of indirect nitrous oxide emissions from agricultural soils during the 1990-2003 period.
Cat 1990 1991 1992 1993 1994 1995 1996 1997 1998 1999 2000 2001 2002 2003 Atmospheric deposition of nitrogen 4D3
NH3 emission expressed as NH3 237.8 245.5 214.0 217.6 194.3 179.3 178.7 176.0 159.9 154.3 139.9 131.0 126.5 122.2
NH3 emission expressed as NH3-N 195.8 202.2 176.3 179.2 160.0 147.7 147.1 145.0 131.7 127.0 115.2 107.8 104.2 100.6
N2O emission expressed as N2O-N 1.96 2.02 1.76 1.79 1.60 1.48 1.47 1.45 1.32 1.27 1.15 1.08 1.04 1.01
N2O emission expressed as N2O 3.08 3.18 2.77 2.82 2.51 2.32 2.31 2.28 2.07 2.00 1.81 1.69 1.64 1.58
Nitrogen leaching and runoff 4D3
Nitrogen fertilizer consumption 412.0 400.1 391.8 389.9 371.6 406.0 389.0 401.0 402.9 383.3 339.0 298.0 292.0 291.0
Total nitrogen excretion – export 657.4 680.0 661.0 675.6 636.1 634.8 632.8 611.3 582.1 553.3 513.4 509.3 469.7 458.7
Total N supply to soil 1069.4 1080.1 1052.8 1065.5 1007.7 1040.8 1021.8 1012.3 985.0 936.6 852.4 807.3 761.7 749.7
Total N supply * FRACleach 320.8 324.0 315.8 319.7 302.3 312.3 306.6 303.7 295.5 281.0 255.7 242.2 228.5 224.9
N2O emission expressed as N2O-N 8.02 8.10 7.90 7.99 7.56 7.81 7.66 7.59 7.39 7.02 6.39 6.05 5.71 5.62
N2O emission expressed as N2O 12.60 12.73 12.41 12.56 11.88 12.27 12.04 11.93 11.61 11.04 10.05 9.51 8.98 8.84
Total indirect emissions as N2O 4D3 15.68 15.91 15.18 15.37 14.39 14.59 14.36 14.21 13.68 13.03 11.86 11.21 10.61 10.42