Risk assessment of Shiga-toxin producing
Escherichia coli O157 in steak tartare in the
Netherlands
M.J. Nauta, E.G. Evers, K. Takumi and A.H. Havelaar
This investigation has been performed by order and for the account of the Directory Board of RIVM, within the framework of project 257851, “Exposure modelling of zoonotic agents in the animal production chain”.
Abstract
The methodology of quantitative microbiological risk assessment (QMRA), a tool to evaluate food related health risks, is rapidly developing. As a contribution to this development, a QMRA of Shiga-toxin producing E. coli (STEC) O157 in steak tartare in the Netherlands is conducted, using the Modular Process Risk Model (MPRM) concept. STEC O157 has caused a number of large-scale outbreaks in several industrial countries with severe public health consequences, often associated with the consumption of beef products. An exposure model was constructed, covering the whole food pathway from farm animals to human
consumption. This model was linked with a newly developed dose response model of STEC O157 based on Japanese outbreak data. It resulted in estimates of steak tartare contamination (prevalence and concentration) and the incidence of STEC O157 associated illness by steak tartare consumption. As in other QMRAs, these estimates are highly uncertain as a
consequence of a lack of adequate data all over the food pathway. Expert opinion was used to obtain estimates of several model parameters. Compared with independent data, the model estimate of the prevalence of contaminated raw tartare patties (0.3%) is low, whereas the estimated incidence rate of diarrhoeal illness (8 per 100.000 person years) is high. The QMRA approach allows for an overall scenario analysis. It was found that intervention at the farm or during slaughter is probably more efficient to reduce STECO157 health risks than intervention at the consumer stage. Furthermore, important data gaps could be identified.
Preface
The risk assessment described in this report is the result of extensive collaboration between the authors and a variety of researchers and experts in different disciplines. We are grateful that those researchers and experts were prepared to expose themselves to our -sometimes unusual- questions and provide us -if possible- with answers and data. We would also like to thank several collegues who critically reviewed (part of) the report.
The names of the people who are gratefully acknowledged are listed below:
E. de Boer, A.E. Heuvelink and J.C.M.M. van den Akker from the Inspectorate for Health Protection and Veterinary Public Health, Zutphen;
B.W. Ooms from the National Inspection Service for Livestock and Meat, Voorburg;
A.W. van de Giessen, A.M. Henken, J. Jansen, P.H.M. Janssen, H.M.J.A. van Leent, F.M. van Leusden, M.C. Ocké, W. van Pelt and P.F.M. Teunis from the National Institute of Public Health and the Environment, Bilthoven;
M.J. Faas, E.A.M. van Gurp, M. Hekman and F. de Vries from the Netherlands Nutrition Centre, The Hague;
K.F.A.M. Hulshof and G. Keizer from the Netherlands Organisation for Applied Scientific Research, Zeist;
J. Bergsma and P.P. Westra from the Product Boards for Livestock, Meat and Eggs, Rijswijk; L.L. Kelly from the Veterinary Laboratories Agency, Weybridge, UK;
M. Powell from the United States Department of Agriculture, Washington; L.J.A. Lipman and R.D. Reinders from Utrecht University;
Contents
Samenvatting 7 Summary 101. Introduction 13
1.1 A Risk Assessment of pathogenic E. coli 13 1.2 Report outline and guide 14
2. Defining microbial risk assessment 17
2.1 Generic statement of purpose 17 2.2 General 17
2.3 Product choice 18
2.3.1 Sessions 18
2.3.2 Consumption amounts of tartare and hamburger 19
2.4 Species/serotype definition 20 2.5 Choice of interventions 21 2.6 Consumer definition 23 2.7 Statement of purpose 24
3. Exposure assessment 25
3.1 The Food Pathway 25
3.1.1 Introduction 25 3.1.2 A simple scheme 25 3.1.3 Improved scheme 27 3.2 Data 30 3.2.1 Prevalence 30 3.2.2 Concentration 40 3.2.3 Other 41
3.2.4 Food handling data 42
3.3 Risk model definition 47
3.3.1 Introduction 47
3.3.2 Basic processes 48
3.3.3 Modelling the Food Pathway 52
3.3.4 Estimation of parameter values 61
3.3.5 The spreadsheet model 75
4. Effect model 77
4.1 Introduction 77
4.2 Materials and methods 77
4.2.1 Outbreak data 77
4.2.2 Binomial likelihood 78
4.2.3 Exponential model for the parameter p 78
4.2.4 Hypergeometric model for the parameter p 79
5. Risk characterisation 83
5.1 Results of the baseline model 83 5.2 Evaluation of alternative scenario’s 86 5.3 Validation 87
6. Information campaign 93
6.1 Introduction 93
6.2 Communication and Innovation Studies Wageningen 94 6.3 The Netherlands Nutrition Centre 95
6.4 RIVM/Department for Public Health Forecasting 101
7. Discussion 103
7.1 The public health risk of STEC O157 in the Netherlands 103
7.1.1 Health risk estimation 103
7.1.2 STEC O157 in steak tartare patties 105
7.1.3 Scenario analysis and the statement of purpose 106
7.2 The risk model 107
7.2.1 The food pathway 107
7.2.2 Process step models 108
7.2.3 Parameter estimation by expert elicitation 110
7.2.4 The effect model 111
7.3 Lessons on risk assessment modelling 112
References 115
Appendix 1 Mailing list 123 Appendix 2 Data 127
2.1 Prevalence at the Farm 127 2.2 Prevalence at Slaughterhouse 145 2.3 Prevalence at Retail 154
2.4 Prevalence Reviews 160 2.5 Concentration in faeces 162 2.6 Concentration on carcasses 162 2.7 Concentration in ground beef 163
2.8 Transmission of micro-organisms in Slaughterhouse 163
Samenvatting
In toenemende mate wordt gebruik gemaakt van kwantitatieve microbiologische risicoschatting (Quantitative microbiological risk assessment, QMRA) om voedsel-gerelateerde microbiële gezondheidsrisico’s te beheersen. Onlangs is het ‘Modular Process Risk Model’ (MPRM) gelanceerd als methode waarmee een risicomodel ‘van boerderij tot consument’ kan worden opgezet. De transmissie van een microbiologisch gevaar over het hele traject kan er kwantitatief mee worden beschreven. Bestaande gezondheidsrisico’s kunnen worden ingeschat, en risicomanagers wordt de mogelijkheid geboden om verschillende opties voor interventie ter verlaging van de risico’s modelmatig door te rekenen en te vergelijken.
QMRA is een complex onderzoeksgebied en nog volop in ontwikkeling. De doelstelling van het in dit rapport beschreven onderzoek was daarom voornamelijk om meer ervaring op te doen in het uitvoeren van een QMRA ‘van boerderij tot volksgezondheid’. Blootstellingschatting van de consument is gecombineerd met dosis-respons modellering. Het microbiologische gevaar dat onderzocht werd is Shiga-toxine producerende Escherichia coli O157 (STEC O157), een beruchte pathogeen. Infectie met STEC O157 kan leiden tot verschillende symptomen, variërend van milde gastro-enteritis, haemorraghische colitis, het haemolytisch uremisch syndroom (HUS) bij jonge kinderen, tot sterfte. Ernstige explosies van STEC O157 zijn tot dusver niet in Nederland voorgekomen, maar uit verschillende andere (westerse) landen zijn deze wel bekend. Rundvee wordt veelal beschouwd als het belangrijkste reservoir van STEC O157. Het levensmiddel dat in deze risicoschatting bestudeerd werd is daarom een rundvleesproduct. De keuze is gevallen op rundertartaar, vanwege de consumptiefrequentie, het potentiële risico (omdat rundertartaar (deels) rauw gegeten wordt) en de relatieve eenvoud van het productieproces. Het onderzoek beperkte zich verder tot Nederlandse runderen en slachthuizen, en Nederlandse consumenten.
Volgens de richtlijnen van de MPRM methodiek is ten behoeve van de blootstellingschatting de proces-keten beschreven en opgedeeld in basisprocessen. Voor de basisprocessen ‘opdelen’ en ‘mengen’ zijn nieuwe modellen ontwikkeld waarmee de effecten van niet-willekeurige verdeling van micro-organismen in het substraat meegenomen kunnen worden. Aangezien de wijze waarop runderen geslacht worden kan verschillen, is er onderscheid gemaakt tussen drie blootstellingsroutes. Deze routes verschillen in wijzen van slachten en verdere bewerking: ‘industrieel’ en ‘traditioneel’. Om aan te sluiten bij de effectmodellering, zijn consumenten ingedeeld in drie leeftijdsklassen: 1-4 jaar, 5-14 jaar and 15+. Daarnaast zijn er drie verschillende bereidingswijzen van tartaartjes meegenomen: rauw, licht gebakken en goed doorbakken. (Nederlandse) gegevens omtrent prevalentie en concentratie van STEC O157 zijn verzameld voor verschillende stadia van de keten: boerderij, slachterij, detailhandel en consument. Dit rapport biedt een uitgebreid overzicht van deze gegevens. Bij het opstellen van het model bleek dat er weinig overlap is tussen de beschikbare gegevens en de gegevens die nodig zijn om de waarden van de modelparameters te schatten. Er is daarom een bijeenkomst met deskundigen georganiseerd, waarin de deskundigen is gevraagd de waarden van een aantal modelparameters in te schatten. Bij deze modelparameters valt
bijvoorbeeld te denken aan de fecale verontreiniging van karkassen uitgedrukt in gram feces per karkas. Het risicomodel is vervolgens geïmplementeerd in een @Risk spreadsheet waarmee Monte Carlo simulaties zijn uitgevoerd. Daarbij is alleen variabiliteit meegenomen, niet de onzekerheid. Vanwege de grote en complexe bronnen van onzekerheid, zowel in de proceskennis, de modellen en de gegevens, bleek het niet mogelijk de onzekerheid op een zinvolle manier te kwantificeren. Als alternatief is een ‘standaardmodel’ met de meest waarschijnlijke parameterwaarden vergeleken met alternatieve scenario’s, modellen waarin de parameterwaarden zijn aangepast. Met deze methode kan het effect van onzekerheid in input-parameters op de output bestudeerd worden.
Uit de blootstellingschatting blijkt dat volgens het model ongeveer 0,3% van de rauwe tartaartjes besmet is met STEC O157. Het merendeel hiervan (>60%) is besmet met slechts één kolonievormende eenheid (kve). Hoge besmettingsniveaus zijn schaars. Vergelijking met een microbiologisch onderzoek waarin één op de 82 rauwe tartaartjes (1.2%) positief voor STEC O157 werd gevonden, wijst er op dat dit resultaat van het model een onderschatting van de werkelijkheid zou kunnen zijn.
Het blootstellingsmodel is gekoppeld aan een nieuw dosis-respons model voor STEC O157, dat is opgesteld met gegevens van een explosie op een Japanse basisschool in 1996. Van deze explosie zijn unieke humane gegevens bekend omtrent zowel de dosis als het aantal blootgestelde en geïnfecteerde personen. Zowel het exponentiële als hypergeometrische dosis-respons model zijn aan deze gegevens gefit. Zij voorspellen een hoge virulentie van STEC O157. Volgens het exponentiële model is de kans op ziekte per cel ongeveer 0,5%. Het voorspelde aantal STEC O157 infecties in Nederland als gevolg van de consumptie van tartaar is volgens het ‘standaardmodel’ zo’n 2300, en het aantal ziektegevallen zo’n 1300. Dit laatste komt overeen met een incidentie van 8 per 100.000 persoonsjaren. Een onafhankelijke schatting van de totale incidentie in Nederland, op grond van epidemiologische gegevens, is 2000 ziektegevallen, of 13 per 100.000 persoonsjaren. Ogenschijnlijk wordt een groot deel van de STEC O157-gerelateerde ziektegevallen dus veroorzaakt door de consumptie van rundertartaar. De onzekerheid in de genoemde schattingen is echter groot. Een mogelijke overschatting van het aantal ziektegevallen is in tegenspraak met de mogelijke onderschatting waar het gaat om de besmetting van tartaartjes.
Deze conclusies blijven gelden als de onzekerheid in de parameterschattingen wordt meegenomen. Het blijkt dat de hoge ziekte-incidentie met name afhangt van het gebruikte dosis-respons model. Voorspellingen met andere dosis-respons modellen van STEC O157 vallen veel lager uit. Deze modellen zijn echter gebaseerd op niet humane gegevens of op andere pathogenen. Het is ook mogelijk dat de specifieke Japanse explosie niet representatief is voor de Nederlandse situatie met betrekking tot STEC O157 in tartaar, bijvoorbeeld omdat het in Japan een hoogvirulente STEC O157 betrof.
Ondanks de onzekerheid in de risicoschatting, kan het risicomodel gebruikt worden om de gevolgen van onzekerheid in verschillende processtappen te vergelijken, en om een uitspraak te doen over de effecten van interventie. Analyse van alternatieve scenario’s laat zien dat de onzekerheid in prevalentie en concentratie van STEC O157 op de boerderij een groot effect kan hebben op het eindresultaat. Hetzelfde geldt voor groei en inactivatie van STEC O157 op
het karkas in het slachthuis. Het effect van groei van STEC O157 tijdens de opslag in de winkel en bij de consument thuis is daarentegen verwaarloosbaar, en het effect van voorlichting die moet leiden tot veiliger bereidingswijzen is twijfelachtig. Pogingen tot interventie op de boerderij of tijdens het slachtproces hebben daarom waarschijnlijk meer kans van slagen dan pogingen tot interventie bij de consument.
Geconcludeerd kan worden dat het uitvoeren van deze risicoschatting een nuttige en leerzame ervaring is geweest. De MPRM methodiek lijkt goed bruikbaar. QMRA ‘van boerderij tot volksgezondheid’ zal zich in de toekomst ten eerste moeten richten op een bruikbare ‘statement of purpose’ en op een beschrijving van de procesketen, met daarbij een inventarisatie van de gegevensbehoefte vóórdat alle beschikbare data opgespoord worden. De mogelijke discrepantie tussen modelcomplexiteit en gegevensbeschikbaarheid dient zorgvuldig te worden overwogen. Het ontwikkelen van vaardigheden in het bevragen van deskundigen verdient de nodige aandacht. Het uitvoeren van QMRA is ingewikkeld en tijdrovend. Het vraagt om verregaande integratie tussen verschillende werkterreinen als microbiologie, modellering en risicomanagement.
Summary
Quantitative microbiological risk assessment (QMRA) is increasingly used as a tool to evaluate food related health risks. Recently, the Modular Process Risk Model (MPRM) was proposed as a methodology to set up a ‘farm to fork’ risk assessment model, which quantitatively describes the transmission of a microbiological hazard through the food pathway. This not only allows an assessment of current health risks, but also offers the opportunity to compare the effects of risk management interventions proposed to reduce the risks.
QMRA is a relatively new and complex area of research. The objective of the study presented in this report was to further develop the methodology for conducting a QMRA ‘from farm to fork and beyond’, to discover potential pitfalls and to explore the available data and their suitability for QMRA. It integrates ‘farm to fork’ exposure assessment modelling with microbiological dose response modelling. The hazard considered is Shiga toxin producing
Escherichia coli O157 (STEC O157), a notorious pathogen. Related illnesses range from
mild gastro enteritis, haemorrhagic colitis, haemolytic uremic syndrome in young children, to death. Although no large-scale outbreaks of STEC O157 have occurred in the Netherlands so far, several major outbreaks have occurred abroad. Cattle is generally considered as the most important reservoir of STEC O157. Therefore, a beef product was chosen as the food product for which the risk is evaluated. Based on consumption frequency, potential risk and relative simplicity of processing, the product choice was ‘steak tartare patties’, a lean ground beef product, typically eaten raw or partially raw. To limit the complexity of the assessment, only the Dutch population and only data on Dutch animals and slaughterhouses were considered in the analysis.
In exposure assessment the food pathway ‘from farm to fork’ is described and modelled using the MPRM methodology. This implies that the food pathway is separated into basic processes. New models of the basic processes ‘mixing’ and ‘partitioning’ are developed that allow evaluation of the effect of non-random distribution of micro-organisms in the substrate. As slaughter practices may differ, three routes of exposure were compared, separating ‘industrial’ and ‘traditional’ ways of both slaughter and subsequent processing. Consumers were separated in three age classes, 1-4 years, 5-14 years and 15+, to fit with the effect modelling. Next, three preparation styles of the steak tartare patties (raw, medium and well done) were considered. (Dutch) data were collected on the prevalence and concentration of STEC O157 at the different stages in the food pathway: farm, slaughter, retail and consumer. This report offers an extensive overview of these data.
When the food pathway was modelled, it appeared that important information required to estimate the values of the model parameters was lacking. Therefore an expert elicitation workshop was organised to estimate the values of the remaining parameters for which no data were found. One of these parameters is for example the faecal contamination of carcasses, expressed in gram faeces per carcass. The model was implemented in an @Risk spreadsheet and Monte Carlo simulations were run. In these simulations, only variability was considered.
Uncertainty could not be quantified, due to its complex nature and the level of uncertainty in both the food pathway, the models and the data. As an alternative, a baseline model with (most likely) default values for the parameters is compared with alternative scenario’s in which parameter values were modified for single parameters. This resulted in an evaluation of the effect of the uncertainty in single parameters on the end result of the risk assessment. The exposure model predicts that about 0.3% of the raw steak tartare patties is contaminated with STEC O157. Of these contaminated patties, a large fraction (>60%) is contaminated with one colony forming unit (cfu) only. High contamination levels are rare, with for example only 7% of the contaminated raw steak tartare patties containing more than 10 cfu. In a microbiological survey it was found that one of 82 raw steak tartare patties (1.2%) was positive for STEC O157. Knowing that the probability of detection of single cfu’s in such a survey is small, this suggests that the model prediction is an underestimation of the actual level of contamination of steak tartare patties.
The ‘farm to fork’ exposure model was linked to a dose response model of STEC O157, based on data of an outbreak in an elementary school in Japan in 1996. This outbreak is unique as it supplies accurate human data on dose and the number of people exposed and infected. The exponential and the hypergeometric model fitted to these data indicate that STEC O157 is highly infective. With the exponential model, the probability of illness per single cell is estimated at about 0.5%
Next, the number of STEC O157 infections by steak tartare consumption per year in the Netherlands was predicted with the baseline model at 2300, and the number of cases of gastro enteritis at about 1300. The latter equals an incidence rate of 8 per 100.000 person years. This result can be compared with an independent estimate of the total incidence of STEC O157 associated gastro enteritis in the Netherlands based on epidemiological data: 2000 cases or 13 per 100.000 person years. Apparently a large fraction of the cases is a consequence of steak tartare consumption. However, the uncertainty in these estimates is large. As many more routes of exposure to STEC O157 are known, the large attributable fraction of steak tartare consumption (that is the high contribution to the total incidence), seems an overestimation. In contrast, the contamination level in raw tartare seems to be underestimated by the model. These qualitative conclusions hold when the uncertainty in the different parameter estimates is taken into account. The high incidence of illness appears to be particularly related to the dose-response model used. Other dose-response models predict considerably lower incidences of illness. However, all of these are based on proxies for the host or the pathogen. Nevertheless it is possible that the specific Japanese outbreak data are not representative for the general exposure to STEC O157 in steak tartare consumed by Dutch people, for example because a particularly virulent strain was involved.
The risk estimate is highly uncertain, but nonetheless the risk model can be used to investigate the impact of uncertainties in the model input on the model output, and to evaluate intervention at different stages along the food pathway. Analysis of alternative scenario’s shows that the uncertainty in prevalence and concentration of STEC O157 at farm level may have a large effect on the final model estimates. The same holds for uncertainty about growth and inactivation of STEC O157 on the carcass. In contrast, the effect of growth of STEC
O157 during retail and domestic storage is negligible and the effect of advocating the consumption of ‘well done’ steak tartare patties is questionable. This suggests that intervention at farm level or at slaughter is more likely to be effective as a strategy to reduce STEC O157 associated risks than intervention at the consumer level.
As a conclusion, the risk assessment has been a valuable experience. The MPRM was a useful approach. In the future, the focus of QMRA ‘from farm to fork and beyond’ should first be on a manageable statement of purpose and a description of the food pathway making an inventory of data needs, before surveying the available data. The potential discrepancy between model complexity and data availability should be carefully considered. Also, developing expertise in expert elicitation is recommended. Finally, conducting QMRA is complex and time consuming. It needs an integrative approach, with microbiologists, modellers and managers involved.
1. Introduction
1.1 A Risk Assessment of pathogenic E. coli
Quantitative microbiological risk assessment (QMRA) modelling is increasingly used as a tool to evaluate food related health risks. Recently, an increasing number of papers have been published that describe QMRA studies for a range of micro-organisms and food products (Whiting and Buchanan 1997, Cassin et al. 1998, Marks et al. 1998, Coleman et al. 1998, Bemrah et al. 1998). So far, different approaches have been used, and several protocols and guidelines have been proposed (e.g. CODEX Alimentarius Commission 1998, ILSI 2000). Recently, we developed the Modular Process Risk Model (MPRM) methodology to structure exposure assessment modelling from ‘farm to fork’, and applied this to a QMRA of Bacillus
cereus in a vegetable product (Nauta 2001b).
Risk assessment can be divided in four steps: hazard identification, hazard characterisation (including dose response assessment), exposure assessment and risk characterisation (e.g. CODEX Alimentarius Commission 1998). At the Microbiological Laboratory for Health Protection (MGB) within RIVM, expertise has been developed on these different steps. We now aim to integrate this expertise as described previously (Havelaar et al. 2000), and conduct a specific risk assessment ‘from farm to fork and beyond’, that is up to an evaluation of the health burden on population scale. To specify a risk assessment, one needs to identify a pathogen, a product, a food pathway and a population (see Nauta 2001b). For this study, we decided to study pathogenic Escherichia coli in a beef product consumed by the Dutch population.
An important reason to conduct a QMRA for pathogenic E. coli was its potential impact on public health. Outbreaks associated with pathogenic Escherichia coli have frequently been reported in the USA (69 outbreaks in the period 1982-1994) and other countries. As yet, no large outbreak has occurred in the Netherlands, but such an outbreak cannot be excluded for the future (Heuvelink 2000b).
The most important animal reservoir for Shiga toxin-producing E. coli O157 (STEC O157), the serotype receiving most attention, is cattle, although STEC can be found in the faecal flora of a wide variety of animals. Animals carrying STEC O157 are usually asymptomatic. STEC O157 can persist in manure, water troughs, and other places on cattle farms. Transmission to humans occurs via food of animal origin (mainly undercooked ground beef and raw milk), fruit and vegetables, water, person-to person and animal-to-person contact and occupational exposure. Ground beef is the vehicle responsible for the largest portion of foodborne STEC O157 outbreaks in the USA, including the large multistate outbreak in 1993 (Armstrong et al. 1996). This outbreak affected over 700 persons and caused the death of four children (Bell et al. 1994). Once infected with enterohaemorrhagic E. coli, people may develop gastro enteritis, including severe, bloody haemolytic colitis. Young children can
develop HUS (Haemolytic Uraemic Syndrome), a severe renal disease that may lead to renal failure and even to death (Heuvelink 2000c, Havelaar et al. 2001).
Another reason for selecting STEC O157 was the availability of recent data from research on this pathogen in the Netherlands (Heuvelink 2000b). Finally, this risk assessment on STEC O157 was facilitated by the experience of other risk assessments on this pathogen, performed in North America (Cassin et al. 1998, Marks et al. 1998, Coleman et al. 1998).
The main objective of the study described in this report was to further develop experience in conducting a risk assessment ‘from farm to fork and beyond’, and to discover potential pitfalls. This means that the risk assessment described here was not primarily aimed at assessing health risks or to be used as a tool for risk management.
1.2 Report outline and guide
This report describes several aspects of risk assessment and gives quite some details that reflect our experiences. Not all these details will be of interest for all readers. The outline below may therefore be used to select specific topics of interest. In general, each chapter can be read separately without studying the other chapters in detail.
In chapter 2 the statement of purpose is defined. It describes the process in which the choices were made that lead to the formulation of the statement of purpose, which includes definitions of pathogen, product, food pathway and population of concern. The statement of purpose is the important first step of any risk assessment (CODEX Alimentarius Commission 1998). It serves to clarify exactly what the risk assessment is about, and what it is aiming at. Because this was a feasibility study, choices were made after consultation with experts rather than risk managers as proposed by Codex.
Chapter 3 describes the exposure assessment. First, the food pathway for steak tartare production in the Netherlands is explained. Next, it gives an overview of available data on prevalence and concentration of STEC O157 at several stages along the food pathway, and data on consumption and food handling. Finally, the risk model is defined, using the MPRM methodology. The food pathway is modelled by splitting it up in a series of consecutive basic process models. Model parameter values are estimated on the basis of available data and expert opinion. The exposure assessment model is implemented in a spreadsheet program. Chapter 4 deals with the dose response model for STEC O157, developed especially for this study on the basis of a Japanese elementary school outbreak (Shinagawa 1997). The data are fitted with both an exponential and a hypergeometric model. The resulting dose response models are compared with other dose response models for STEC O157 (Haas et al. 2000, Powell et al. 2000).
The risk characterisation, which integrates the exposure model with the dose-response model is given in chapter 5. It shows the results of the risk model, in terms of estimates for the prevalence and concentration of STEC O157 raw steak tartare patties, and the incidence of STEC O157 associated illness in the Dutch population. Next to the baseline model,
alternative scenarios are analysed. The model results are compared with independent data for the purpose of validation.
Chapter 6 deals with quantifying and modelling the effect of an information campaign and describes previous experiences with information campaigns related to public health. Such a campaign is a possible intervention measure to reduce the incidence of STEC O157 related diseases.
Finally, in chapter 7 the risk assessment exercise is reviewed. The relevance of the risk model results for the public health risk of STEC O157 in the Netherlands and the modelling approach are discussed. Lessons on risk assessment modelling are summarised.
2. Defining microbial risk assessment
2.1 Generic statement of purpose
Risk assessment should start with defining a clear statement of purpose (CODEX Alimentarius Commission 1998), because it is important to have a clear goal of the project for all co-workers. At the start of the project, ample time was spent on generating a clear-cut statement of purpose. Danger of a clear-cut statement of purpose is that it becomes unrelentingly clear if a project in the end does not comply with this statement of purpose. This was partly the case for this project as stated in section 2.7.
The statement of purpose of the risk assessment was originally formulated in a more or less generic sense as follows:
1) Assess the exposure distribution for a pre-defined category of Dutch consumers to the pathogen in a specific product, produced in a specific pre-defined process;
2) Assess the health burden that results from the exposure assessed above;
3) Assess the effect of one or two risk mitigation strategies proposed by selected experts (“risk managers”) at the start of the project.
In sections 2.2 to 2.6 below, restrictions to the risk assessment will be obtained, resulting in section 2.7 in the clear-cut statement of purpose to be used in this study.
2.2 General
In general, and in this case also, time is limited to execute a microbial risk assessment. Therefore, it is not realistic to execute ‘a microbial risk assessment for Escherichia coli’. Moreover, this is a The baseline demarcation for this project was made beforehand. The idea was to perform a microbial risk assessment for E. coli with ground beef as transmission route. However, more detailed demarcations were necessary to obtain a realistic project size.
These are:
− product definition: exactly which ground beef product is to be considered;
− species/serotype definition: exactly which type or set of types are to be considered; − interventions: two interventions was considered a reasonable number.
The output of the risk assessment, the health burden (point 2 of the statement of purpose), was not specified further.
Two sessions with experts were undertaken to make the choices.
− session 1: with food microbiologists from the Inspectorate for Health protection and Veterinary Public Health;
− session 2: with food and veterinary microbiologists from the National Institute of Public Health and the Environment.
Mathematical modellers from the National Institute of Public Health and the Environment made the definitive decisions for interventions in a subsequent session. A definitive decision on product choice was made on the basis of a limited investigation of consumption amounts.
2.3 Product choice
The risk assessment is restricted to products that are produced from meat of Dutch slaughterhouses whether from Dutch or foreign origin. So imported products but not imported live animals are excluded. We did not limit the risk assessment to meat from Dutch cattle only, as it proved to be impossible to discriminate between Dutch and foreign cattle after slaughter. This means we will have to try to collect data on prevalence and concentration of STEC O157 in foreign live cattle too.
2.3.1 Sessions
CriteriaTwo criteria were passed to the session experts:
− Preference is given to that product for which processing in the butcher's shop and preparation in the household is the simplest;
− Preference is given to that product for which the estimated public health risk is the largest.
It is realised that these criteria are contradictory: a simpler processing scheme generally gives a lower public health risk, because there are less moments of possible (cross-) contamination. Session 1
Hamburger, tartare, minced meat and filet americain were considered. Tartare is minced beef with a fat content of less than 10 % and filet americain is tartare mixed with a mayonnaise-based sauce (80 to 20 %) (Heuvelink et al. 1999a, Heuvelink 2000f). Minced meat was discarded as this can be prepared in the household in many ways. Filet americain was discarded as there is much variation between butchers in the way it is prepared. Also it is usually not consumed by children, whereas children must be included because of the disease HUS.
This leaves the choice between hamburger and tartare. Three public health arguments plead for tartare:
1 Tartare is thicker than a hamburger, therefore the risk of insufficient heating of the centre is larger;
2 People tend to accept a partially raw tartare but do not accept a partially raw hamburger; 3 Tartare is sometimes consumed raw: a tartare roll in e.g. snack bars.
One simplicity argument pleads for tartare:
One public health argument pleads for hamburger:
1 Hamburgers are used for barbecue which is a public health risk due to cross contamination between raw and prepared hamburgers, and inadequate cooking.
More arguments plead for tartare and therefore this product is chosen in first instance. However, it was thought that a definitive choice should also depend on consumed amounts. Session 2
Products were briefly discussed. Filet americain is thought to be not very risky as it is made directly from a piece of steak. One expert chose for hamburger, because of consumed amounts. The other expert could not choose between hamburger and tartare.
2.3.2 Consumption amounts of tartare and hamburger
IntroductionThe first selection of minced products as described above left two minced products: tartare and hamburger, with some preference for tartare. However, it was thought reasonable that eventually a choice for hamburger would be made if the amount consumed would be much higher, say a factor 10 or more, than that of tartare. A higher amount consumed results in a higher public health risk and a subjective limit of a factor 10 was set to revert the product choice from tartare to hamburger. Setting a more objective limit would require a time-consuming investigation.
Data
Two data sources were used to estimate the amount of consumption, both based on field research by GfK PanelServices Benelux:
− Data obtained from the Product Boards for livestock, meat and eggs (PVE);
− A report from TNO Nutrition and Food Research Institute in which results of the third Dutch nutrition surveillance are presented (Kistemaker et al. 1998).
The data from PVE are expressed in kg of a product per year. Assumptions used for the calculations below:
− The percentage of household of total purchase for hamburgers does not deviate much from that for the category 'ready to cook/snacks in general', which includes hamburgers and equals 53 %;
− The household category ‘other minced meat’ is for the main part tartare;
− The percentage of household of total purchase for tartare does not deviate much from that for the category ‘minced meat’ in general, which includes tartare and equals 86 %.
From Kistemaker et al. (1998) the data were used that refer to a research panel of 6250 people including households with heads 75 years or older of age (Table 1 in that report). Food consumption data were registered by these people for two consecutive days. For each product, the mean consumption per day (g) of users was multiplied by the number of users and thereafter divided by the total number of people (6250) to arrive at the mean
consumption per day for all people. For comparison with PVE data, this number was multiplied by 15 x 106 people and 365 days and divided by 1000 to arrive at the annual Dutch consumption in kg. Also, the mean number of products consumed per day for all people was estimated, assuming that nobody consumed a product on both days.
Results for hamburger
PVE data: household purchase is 11 x 106 kg. Total purchase is then estimated at 20.8 x 10⁶ kg.
TNO data: addition of two products, ‘hamburger raw’ (code 1435) and ‘hamburger prepared’ (code 1569), gives a value of 3.03 g pppd (per person per day). The annual Dutch consumption is then estimated at 16.4 x 10⁶ kg, agreeing reasonably with the PVE figure. The mean number of hamburgers consumed per day for all people was estimated at 0.037.
Results for Tartare
PVE data: household purchase is 2.4 x 10⁶ kg. Total purchase is then estimated at 2.8 x 10⁶ kg.
TNO data: addition of two products, ‘beef tartare raw’ (code 1415) and ‘beef tartare prepared’ (code 1550), gives a value of 1.70 g pppd. The annual Dutch consumption is then estimated at 9.3 x 10⁶ kg, more than a factor 3 higher than the PVE figure. The mean number of beef tartare consumed per day for all people was estimated at 0.018.
Comparison
The ratio of hamburger to tartare is:
− according to PVE data (weight): 7.4 to 1; − according to TNO data (weight): 1.8 to 1; − according to TNO data (pieces): 2.1 to 1.
None of these figures are greater than 10, the limit set above to choose for hamburger as product. Moreover the PVE data are less reliable as they are not as product specific as the TNO data. Therefore tartare is chosen as product for the microbial risk assessment.
2.4 Species/serotype definition
Three criteria were passed to the experts:
− The type should constitute a public health risk; − Measurements should be available;
− The choice should be practicable.
STEC O157, which is synonymous to VTEC O157, was chosen as the serotype for the risk assessment (STEC = Shiga toxin-producing E. coli; VTEC = verotoxigenic E. coli). The choice was made in session 1 and not rejected in session 2. This choice was data-driven: STEC O157 is the only serotype for which measurements are available. Based on medical data, the importance of non-O157 STECs is currently limited (Armstrong et al. 1996). An
exact definition of STEC O157 is: E. coli O157-strains that are VT1 and/or VT2 positive. The eae status is not part of the definition, however STEC O157 strains are usually eae positive.
2.5 Choice of interventions
It was made clear to the experts that choice of interventions is important as the model is to be made more detailed in the parts related to the proposed interventions. The choice was to be limited to two interventions at different positions in the chain farm – slaughterhouse (carcass processing) – butcher’s shop/supermarket (meat (product) processing) – household/restaurant. It must be stressed that in session 1 and 2 below the opinion of the consulted experts is reflected.
Session 1
Two links in the chain were considered less suitable for interventions, namely farm and butcher’s shop. The farm is less suitable as contamination routes are currently unclear and as the farm sector is relatively difficult to direct. Interventions at the butcher’s shop seem less relevant. Cross-contamination is the most important danger here. Points of interest are:
− Separate meat products ready for consumption and meat products to be heated prior to consumption;
− Cleaning the meat mincer;
− Good storage conditions (temperature); − End product treatment (radiation).
The first link to be considered is the final stage in the farm combined with the slaughter house. Less suitable interventions for this stage are:
− ‘Flaming’ risky parts of the carcass. This influences meat quality;
− Starving the cows a short time period prior to slaughter, resulting in less filled intestines. A better intervention would be to clean the cows before they enter the slaughter house. This includes two partial interventions:
− Cleaning at the farm: removing visible faeces with brush and water; − Cleaning the transport truck.
The best intervention is to improve hygiene of slaughter. The two most important partial interventions are improvement of hygiene with respect to:
− Dehiding, e.g. avoiding contact between hide and carcass meat; − Removal of intestines, e.g. by a peg on or a bag below the rectum.
The second link to be considered is household/restaurant. Focus will be on households rather than restaurants, because most food poisonings occur in households and because outbreaks,
which are usually related to restaurants, seldom occur in the Netherlands. Good interventions would be:
− Putting labels with a text on packaged meat, probably also resulting in a discussion which has positive effects in itself;
− Giving education on secondary schools.
The best intervention according to the experts is starting an information campaign. The message should be: all raw meat is potentially contaminated with pathogens, take care. Attention should be given to heating and cross contamination.
Session 2
Interventions and best interventions were selected for the four links and thereafter the two overall best interventions were selected.
Good interventions for the farm are:
− Keeping it closed, that is, not allowing animals from outside other than via quarantine; − Selecting feed that reduces infection with STEC O157 (there is no scientific agreement on
the properties of such feed); − Using GMP-produced feed;
− Separating age groups of cows, as young animals are more sensitive to infection.
The best intervention for the farm is hygiene interventions, such as removing feed rests and cleaning drinking water bowls.
Interventions for the slaughter house are:
− Surveillance for STEC O157 at cattle farms, applying strict hygiene interventions for slaughter if positive;
− Decontamination of raw meat at the end of the slaughter line; − Hygiene interventions;
− Spray cleaning of cattle before slaughter (removing faeces) − ‘Shaving’ the animals, possibly after killing (removing faeces) − More supervision on currently prescribed interventions
− Not starving the cows before slaughter, which reduces the risk of infection
The best intervention is also a hygiene intervention, namely logistic slaughter. Logistic slaughter means that on a day, the not infected animals are slaughtered before the infected animals. An additional effect is that flows of meat go separately to the butcher’s shop.
Interventions for the butcher’s shop are:
− Preventing growth by controlling temperature and cleaning; − Complete separation of raw and prepared products;
− Execute internal surveillance by taking microbiological samples.
The best intervention is prevention of cross contamination, meaning contamination of meat by employees or by microbial populations that are resident in the butcher’s shop.
The best intervention for households is hygiene education at primary and secondary schools. Interventions for restaurants are hygiene interventions, such as cleaning and separate lines. The best intervention is increasing the number of samples taken at Critical Control Points. Preference is given to interventions at the beginning of the food chain. A greater risk reduction is realised by reducing the initial contamination level than by (hygiene) interventions in links later in the food chain. Furthermore, interventions for the households will only be effective in the long term. Therefore the following two interventions are chosen: − Hygiene interventions at the farm;
− Logistic slaughter at the slaughter house. Subsequent session
From the two previous sessions, four interventions were selected:
− Hygiene interventions at the farm (feed residues; drinking water) (session 2); − Logistic slaughter (session 2);
− Improving hygiene at slaughter (dehiding; removal of intestines) (session 1); − Execute an information campaign (session 1).
The only intervention that seems to be relatively simple to implement, is ‘logistic slaughter’. However, there are problems: intermittent shedding of STEC O157, the absence at present of a fast test kit for screening of animals at slaughter, the necessity to test the main part of the animals, but these problems seem relatively minor. Furthermore, some work already has been done on this subject. Therefore, this intervention is selected. As it is preferred to spread interventions along the food chain, the intervention ‘improving hygiene at slaughter’ is discarded. See (Gannon 1999) for a review on control of E. coli O157 at slaughter and (Roessink and Bosboom 1999) and (Heuvelink et al. 2001) for information on the related zero-tolerance program for slaughter houses in The Netherlands.
This leaves ‘hygiene interventions at the farm’ and ‘information campaign’. ‘Hygiene interventions at the farm’ is difficult because of unclear contamination routes, difficulties in directing and complex modelling. See (Hancock et al. 1998) for a review of on-farm ecology of E. coli O157 and possible control strategies. ‘Information campaign’ suffers from the fact that the effect is doubtful and that it is difficult from a political point of view. It was decided to start with the intervention ‘information campaign’, with the argument that then one intervention from each session will be investigated. If it would prove to be very difficult to implement this intervention, then ‘hygiene interventions at the farm’ would be chosen as intervention to be investigated.
2.6 Consumer definition
Consumption data were obtained from the Dutch nutrition surveillance (Kistemaker et al. 1998). This implies that the sample population definition used in this surveillance sets the exact consumer definition used in the present study also. This definition is: persons that live
in households in The Netherlands and do not live in institutions, have sufficient knowledge of the Dutch language, and are 1 year or older. Dutch nationality is no prerequisite.
2.7 Statement of purpose
Based on section 2.1 to 2.6 above, the statement of purpose can be formulated as:
1. Assess the exposure distribution to STEC O157 in tartare for consumers in The Netherlands;
2. Assess the health burden that results from the exposure assessed above;
3. Assess the effect of the interventions ‘logistic slaughter’ and ‘information campaign’. As will be clear from the remainder of this report, part 3 of the statement of purpose was not realised, mainly because of project time limitations. As for information campaigns, a number of institutes were visited with primary aim to obtain quantitative information on the effects of a campaign. The information obtained from these institutes is presented in chapter 6. It is not readily implementable in the model, but gives insight in the state of the art of knowledge on information campaign effects and might also be useful in future risk assessment projects.
3. Exposure assessment
3.1 The Food Pathway
3.1.1 Introduction
In Section 3.1 a description of the flow of meat and the accompanying pathogen and also starting points for modelling that were defined at the start of the project are given. At the same time, this section gives insight into developments that took place during the execution of the project. First, a simple scheme was developed using mainly knowledge of the authors at that moment (Section 3.1.2). Second, an improved scheme was developed using mainly knowledge from the Inspectorate for Health Protection and Veterinary Public Health (Section 3.1.3). Finally, this scheme is to be compared with the scheme that is eventually used in risk assessment modelling (Figure 3-6 and 3-7). Also, the initially defined starting points for modelling (Section 3.1.4) are to be compared with the final risk model (Section 3.3).
3.1.2 A simple scheme
A meat product can be produced in many ways. There can be variation in the origin and type of the animals, the slaughtering process, meat processing and the way of preparation. A ‘generic’ process will be modelled.
In Figure 3-1 a simple scheme is presented that was used as a starting point for this risk assessment study. The flow of events consists of two parts:
− Exposure modelling, from cattle in the farms to a prepared product with a dose just before consumption;
− Effect modelling, from a prepared product with a dose just before consumption to public health burden expressed in Disability Adjusted Life Years (DALY’s).
In a number of cases, the flow was divided in two or more subflows. This was a preliminary subdivision, to be maintained only if the subflows would prove to have different characteristics. The chain starts with the farm, in which, first, Dutch and foreign cattle and, second, veal calves, dairy cattle and veal cattle are distinguished, leading to six categories. After transport the cattle is slaughtered in the slaughterhouse. Again after transport or otherwise the carcasses are further processed into a product in either an industrial or a traditional setting. It was assumed that the two flows remain separate, the ‘industrial’ meat ending up in a supermarket after transport and the ‘traditional’ meat ending up in a butcher's shop. Then the flows were supposed to intermingle and after transport the meat ends up in either a restaurant or in a private household. There it is prepared for consumption. Along with
Time Calf Cattle Cattle Calf Cattle Cattle
NL NL NL For. For. For. Farm Meat Dairy Meat Meat Dairy Meat
Transport Slaughter house Transport Industrial Traditional Meat processing Product Product Transport Supermarket Butcher's
Product Product Sale
Transport
Restaurant Private
Preparation
Human
gastrointestinal tract
Dose response relationship
age < 5 yr age >5 yr Infection-disease relationship Disease-DALY-relationship prob. of disease DALY's dose prob. of infection prob. of infection prob. of disease prob. of infection prob. of disease Cattle Carcass
Prepared product with dose Prepared product
Raw product Raw product
Prepared product Carcass Carcass
Figure 3-1 Simple scheme for farm to public health process flow. NL = Dutch, For. =
the consumed product a certain dose of micro-organisms is ingested. At this point in the food chain exposure modelling ends and effect modelling starts.
A dose response relationship results in the probability of infection. Starting from this probability, two flows to the probability of disease that are separated by an age limit of 5 years were distinguished in the simple scheme (Figure 3-1). This distinction is related to the disease of HUS. Finally, the probabilities of diseases in combination with population size can be used to estimate the public health burden expressed in DALYs.
3.1.3 Improved scheme
The general Scheme (Figure 3-1) was made more specific for the present risk assessment, mainly based on information obtained from the Inspectorate for Health Protection and Veterinary Public Health. This resulted in Figure 3-2. In this scheme, three types of butchers are distinguished:
− the “cattle” butcher that slaughters cattle himself;
− the “carcass” butcher that receives half carcasses from the industrial slaughter house and does the meat cutting himself; and
− the “meat” butcher that receives the fresh meat and does very little processing himself. Meat production firms deliver products that have no fresh meat features any more due to e.g. heating, addition of herbs, marinating, etc. Wholesale firms only function as middleman. The distribution centres have a buffer and distribution function. In order to avoid a ‘forest of arrows’ in Figure 3-2, meat flow coming from the industrial deboning plant always goes via a distribution centre, but this should be interpreted as optional, meat might go via a distribution centre, and it might not. Restaurant chains are on the one hand companies that have a separate processing chain of their own, and on the other hand companies that do not have this.
The origin of cattle meat is twofold. On the one hand, there is the male part: fattening firms that fatten male cattle to a lower age (veal calves) or higher age (veal cattle). On the other hand, there is the female part: cows from dairy farms. The bulk of tartare will probably be produced from meat of dairy cattle and veal cattle, as the white meat from veal calves will probably seldom be used for tartare.
For public health now three age categories are distinguished (as opposed to the simple scheme of Figure 3-1 which uses two): 1- 4 years, 5-14 years, and older.
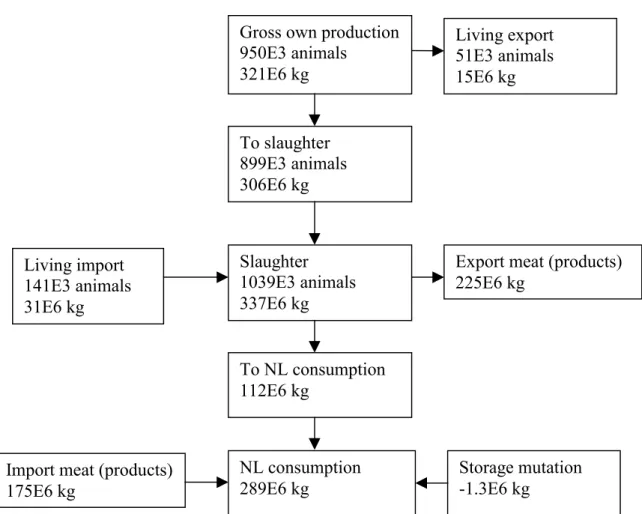
An important aspect for the interpretation of a risk assessment is the extent of import and export. For the cattle sector in the Netherlands in 1998, meat flows are depicted in Figure 3-3. The data were obtained from the Product Boards for Livestock, Meat and Eggs (PVE 2001). The Dutch consumption of cattle meat (289 x 106 kg) is much larger than calve meat, which amounts to 20 x 106 kg. The calve sector thus constitutes only 6 % of the total (cattle + calve) sector, which makes it relatively unimportant for risk assessment of tartare if it is assumed that there is no strong preference for calve meat for tartare production. From Figure 3-3 the following observations can be made:
− Also a small part (9%) of slaughter is living import; − An important part (67%) of slaughter is exported;
− An important part (61%) of Dutch consumption consists of imported meat (products).
Time Cattle at Farm Cattle 1/2 Carcass 1/2 Carcass Fresh meat centre "Meat" Retail Butcher Fresh meat Prepared meat Consumption
Dose response relationship
age 1-4 yr age 5-14 yr older prob. infection prob. infection prob. infection
Infection-disease relationship prob. disease prob. disease prob. disease
Disease-DALY-relationship Industrial Slaughter house "Cattle" Butcher Exposure Butcher Restaurant prob. of disease Distribution Effe ct dose prob. of infection DALY's Industrial deboning plant "Carcass"
Prepared meat with dose Chain Restaurant Private household Dutch Meat Dutch Dairy Foreign Meat Foreign Dairy Distri-bution centre Whole-sale firm Meat pro- duction firm
Gross own production 950E3 animals 321E6 kg Living import 141E3 animals 31E6 kg Living export 51E3 animals 15E6 kg To slaughter 899E3 animals 306E6 kg Slaughter 1039E3 animals 337E6 kg
Export meat (products) 225E6 kg
Import meat (products) 175E6 kg To NL consumption 112E6 kg NL consumption 289E6 kg Storage mutation -1.3E6 kg
Figure 3-3 Meat flow scheme for the cattle sector in the Netherlands in 1998.
It must be stressed that these are numbers for cattle meat as a whole, therefore drawing conclusions for tartare must be done with care. For risk assessment, import and export are important if STEC O157 prevalence and/or concentrations differ much between The
Netherlands and foreign countries. One can choose for a risk assessment for tartare produced from:
− Cattle from Dutch farms;
− Cattle slaughtered in the Netherlands;
− All sources (Dutch cattle, living import and import of meat (products)).
For the last two options in principle foreign STEC O157 data are required. In the present risk assessment we chose (see the beginning of section 2.3) to restrict the risk assessment to tartare produced from meat originating from Dutch slaughterhouses, which corresponds to the second option.
3.2 Data
3.2.1 Prevalence
Dutch prevalence data are presented in full in Appendix 2.1 - 2.4. Below, these data are summarised and interpreted. In the tables, the references are preceded by a code which refers to the exact section of the Appendix where extensive information on the reference can be found. The data are subdivided into three links: farm, slaughterhouse and retail. First, three tables are given containing all relevant references. The farm references are presented in Table 3-1. These references are subdivided into on the one hand, references on dairy cattle, veal calves and veal bulls and on the other hand, references on the prevalence at farm and animal level, the time dynamics on farm and animal level, the length of the individual excretion period and the relationship between age and excretion. Table 3-2 presents the slaughterhouse references. The references are again subdivided into dairy cattle, veal calves and veal bulls. Also, analogous to the previous table, a subdivision is made into the prevalence at farm and animal level and time dynamics at animal and farm level. Table 3-3 presents the retail references. For these, a subdivision is made into references that are more relevant or less relevant. Most useful are references with data on tartare and STEC O157. Less useful are references with data for which either the product or the serotype definition, or both, are too broad.
Table 3-4 - 3-6 give a summary of the data. Table 3-4 describes farm data. Data on animal and farm level are again given separately. For animal level, it is indicated whether samples were taken at farms considered previously 'negative' or 'positive'. An attempt is made to give an impression of variation with time or farm. At animal level, these two sources of variation usually are mixed and thus difficult to separate. The number of sampling events, the number of samples per sampling event and the number of visited farms is presented. A higher number of sampling events and of farms gives a better impression of the variation related to time and farm, respectively. Finally, it is indicated whether the investigation was performed for a minimum of one year or not.
At farm level, data are available for dairy cattle and veal calves and are lacking for veal bulls. The prevalence at farm level varies per quarter of a year from 0 - 19 % and 0 - 25 % for dairy cattle and veal calves, respectively. At animal level, data are available for dairy cattle and veal bulls and are lacking for veal calves. For dairy cattle, prevalence at animal level varies from 0 - 9 % and 0 - 61 % for farms found previously negative and positive, respectively. For veal bulls, prevalence at animal level varies from 10 - 36 % for farms found previously positive.
Table 3-5 describes slaughterhouse data. Data on herd and animal level are given separately. Sampling details given are: the number of sampled animals, herds and slaughterhouses, the length of the sampling period and the frequency within this period. Information on variation related to herds or slaughterhouses was not or limited available. Variation per sampling
period is indicated. At herd level, data are available for veal calves and veal bulls but not for dairy cattle. Prevalences at herd level are 0 % and 0 - 33 % for veal calves and veal bulls, respectively. At animal level, data are available for all categories. Prevalences at animal level are 9 - 11 %, 0 - 1 % and 0 - 15 % for dairy cattle, veal calves and veal bulls, respectively. Table 3-6 describes retail data. For these, no information is available on variation with location. Prevalence at product level was 2.6 and 0 % in 1996 and 1997, respectively, and no further details on sampling moment were available.
It must be noted - perhaps unnecessarily - that the measured prevalences depend on the sensitivity of the method and the way of processing of the samples (e.g. pooling).
R IV M report 25 785 1 0 03 pag e 33 of 169 Table 3-1 Referenc es on prev alenc
e of STEC O157 in cattle at the
farm,
at farm
and animal level.
B e a w ar e that pr evalen ce at animal lev
not from a random sample o
f fa rms. Da ta ty pe Da ir y c attle Ve al ca lve s Ve al bulls Prev alen ce f arm lev el 2.1.F2 Rei nde rs an d Bi jk er 1999 2.1.F3 Heuv el ink et a l. 1999 b 2.1.F4 V an d e Gie ssen 1998 2.1.F5 V an d e Gie ssen 1999 2.1.F6 V an d e Gie ssen 2000 2.1.F3 Heuv el ink et a l. 1999 b 2.1.F4 V an d e Gie ssen 1998 2.1.F5 V an d e Gie ssen 1999 2.1.F6 V an d e Gie ssen 2000 Prev alen ce an im al lev el 2.1.F1 Heuv el ink et a l. 1998 b Heuv elink 2000d (2x) 2.1.F2 Rei nde rs an d Bi jk er 1999 (2x ) 2.1.F7 De Bod t 2000 2.1.F2 Rei nde rs an d Bi jk er 1999 Tim e dy na m ics fa rm lev el 2.1.F1 Heuv el ink et a l. 1998 b Heuv elink 2000d (2x) 2.1.F2 Rei nde rs an d Bi jk er 1999 2.1.F3 Heuv el ink et a l. 1999 b 2.1.F4 V an d e Gie ssen 1998 2.1.F5 V an d e Gie ssen 1999 2.1.F7 De Bod t 2000 2.1.F3 Heuv el ink et a l. 1999 b 2.1.F4 V an d e Gie ssen 1998 2.1.F5 V an d e Gie ssen 1999 2.1.F2 Rei nde rs an d Bi jk er 1999 Tim e dy na m ics anim al lev el 2.1.F1 Heuv el ink et a l. 1998 b Heuv elink 2000d 2.1.F2 Rei nde rs an d Bi jk er 1999 2.1.F7 De Bod t 2000 2.1.F2 Rei nde rs an d Bi jk er 1999 Leng th ind iv idua l excr et ion p er iod 2.1.F1 Heuv el ink et a l. 1998 b Heuv elink 2000d 2.1.F2 Rei nde rs an d Bi jk er 1999 A ge and excr et ion 2.1.F1 Heuv el ink et a l. 1998 b Heuv elink 2000d 2.1.F3 Heuv el ink et a l. 1999 b
pag e 34 of 169 R IV M report 25 785 1 0 03 Table 3-2. Referenc es on prev alenc
e of STEC O157 in cattle at the sl
au
gh
terhouse
at fa
rm and animal level. *: c
attle ori ginating from dair farm s. Da ta ty pe Da ir y c attle Ve al ca lve s Ve al bulls Ve al bulls a nd/or da iry c attle P reval enc e fa rm le vel 2.2.S7 Reinders 2000 2.2.S6 Reinders and B ijker 1999 P reval enc e ani m al level 2.2.S3 Heuvelink et
al. 1998a Heuvelink 2000
g
2.2.S2
Heuvelink et al. 1996 (2x
)
2.2.S3
Heuvelink et al. 1998a
Heuvelink 2000
g
2.2.S4
Reinders et al. 1997a
/2.2.S5 Reinders et al. 1997b 2.2.S7 Reinders 2000 2.2.S6 Reinders and B ijker 1999 2.2.S1 De Boe r et al . 1994 2.2.S2 Heuvelink et al. 1996 * Time d yna mic s fa rm level 2.2.S7 Reinders 2000 2.2.S6 Reinders and B ijker 1999 Time d yna mic s an ima l le ve l 2.2.S7 Reinders 2000 2.2.S6 Reinders and B ijker 1999
R IV M report 25 785 1 0 03 pag e 35 of 169 Table 3-3 Referenc es on prev alenc e of STEC O157 at r etail. Data t ype Tartar e & STEC O157
Product too broad
S erot yp e too b road P
roduct and Serot
too broad P reval enc e 2.3.R6 De B oer et al. 1997 2.3.R8 Heuvelink 2000a 2.3.R2 Van He erw aard en and D e B oer 1993 2.3.R4 Heuvelink et al. 1996 Heuvelink 2000e 2.3.R5 De B oer et al. 1996 2.3.R7 Heuvelink et al. 1999 a Heuvelink 2000f 2.3.R3 Heuvelink et al. 1994 2.3.R1 De Boer et 1992
pag e 36 of 169 R IV M report 25 785 1 0 03 Table 3-4 Summar y of literatur e data on p revalen ce o
f STEC O157 in cattle at the f
arm, at f arm and animal level. '% ': the pr evalen ce. '-' a nd farms found pr eviousl y ne gative and positive, re spectivel y. 'v ar ': ty pe of v ariation gi
ven in the column ‘%
’. 'q.v. ': quarte rl y variation. 'fsv ': f and seasonal v ariation. 's v' : seasonal v ariation. 'n /s' : numbe r of animals sampled p er samplin g event. 's ': the numbe r of sampl in g ev en ts, 'f' number of fa rms. ‘Part’ and ‘ ye
ar’: studies done
for pa rt of a ye ar and at least a whole ye ar, re spectivel y. 'a' : 2.1.F
1 is two studies with
overlappin g data. ' b ': E. coli O157. T ype Prevalenc e Stud y % var n/s s f period Da ir y c attle Fa rm le ve l 2.1.F 2 Reinde rs and B ijker 1999 2.1.F 3 H euvelink et al. 1999b 2.1.F 4 V an de Gi essen 1998 2.1.F 5 V an de Gi essen 1999 2.1.F 6 V an de Gi essen 2000 b 5. 9 -20 373 4y ea r 0-10.3 qv 1-60 82 82 part 0-9.2 qv 1-60 267 267 ye ar 0-19.2 qv 1-60 161 161 ye ar 1. 8 - 1-60 555 5p ar t Anima l le ve l 2.1.F 1 H euvelink et al. 1998b Heuvelink 2000d a 2.1.F 2 Reinde rs and B ijker 1999 2.1.F 7 D e B odt 2000 -: 0-5.0 f(s)v 73-195 5 5 part +: 1.9-22.4 f(s)v 67-162 5 5 part -: 0-9.1 (f)sv 22-131 11 2 ye ar +: 0-61.0 (f)sv 38-106 12 2 ye ar +: 0-31 (f)sv ≈ 70-81 ≈ 26 2 part +: 0-30.3 sv 56-119 8 1 part Veal c al ves Farm le ve l 2.1.F 3 H euvelink et al. 1999b 2.1.F 4 V an de Gi essen 1998 2.1.F 5 V an de Gi essen 1999 2.1.F 6 V an de Gi essen 2000 b 0-12.5 q.v. 1-60 113 113 part 0-20.0 q.v. 1-60 152 152 ye ar 7.1-25.0 q.v. 1-60 60 60 ye ar 3. 1 - 1-60 323 2p ar t Anima l le ve l -Ve al bulls Fa rm le ve l -Anima l le ve l 2.1.F 2 Reinde rs and B ijker 1999 +: 9.7-36.4 (fs)v 11-40 5 3 part
R IV M report 25 785 1 0 03 pag e 37 of 169 Table 3-5. Summar y of literatur e data on pr evalen ce of
STEC O157 in cattle at the slau
gh te rhouse at he rd and animal level. '% ' is the prevalen ce, possible va riation is per sampling p eriod, onl y 'v
eal bulls animal level
' is pe
r sampling
p
eriod and slau
gh te rhouse . 'n ' is the numbe of sampled animals. 'h ' is the number of h erds. 's l' is the number of sl au gh terhouses. ‘Part’ and ‘y ea r’ r efe rs to studies done for p art of a ye ar at least a whol e ye ar, respe ct iv el y. frequ enc y i s t he f requ enc y of s am pl in g ev ent s. T ype Prevalenc e Stud y % n h sl period frequen cy Herd level -Da ir y c attle Anima l le ve l 2.2.S3
Heuvelink et al. 1998a
Heuvelink 2000 g 9.3, 11.1 540 -5 2 x part weekl y Herd level 2.2.S7 Reinders 2000 0 ≈ 840 28-56 1 ye ar monthl y Veal c al ves Anima l le ve l 2.2.S2 Heuvelink et al. 1996 2.2.S3
Heuvelink et al. 1998a
Heuvelink 2000
g
2.2.S4
Reinders et al. 1997a /
2.2.S5 Reinders et al. 1997b 2.2.S7 Reinders 2000 0.9 365 -1 part weekl y 0.5, 0.5 397 45 4 2 x part weekl y 0 273 -1 part weekl y 0 ≈ 840 28-56 1 ye ar monthl y Herd level 2.2.S6 Reinders and B ijke r 1999 0-33.3 285 53 1 3 x part -Veal bul ls Anima l le ve l 2.2.S6 Reinders and B ijke r 1999 0-15.0 329 -2 4 x part -Herd level -Veal bul ls and da iry c attle Anima l le ve l 2.2.S1 De B oe r et al. 1994 0 550 -part
-pag e 38 of 169 R IV M report 25 785 1 0 03 Table 3-6 Summar y of (literatu re) d ata on pr evalenc
e of STEC O157 in tartar
e. '% ' is the p reval ence at product (ta rtar e) lev el. ' p' is th e numbe of ta rt ar es sa mple d. No inf or m ation wa s a va ila ble on the mome nt of sa
mpling within the
studie s. Product P revalenc e S tud y % p Period Tartar e P roduct level 2.3.R6 De B oer et al. 1997 2.3.R8 Heuvelink 2000a 2.6 39 -04 3
-Average prevalence values were calculated to exclude time dynamics. For this, only year-round data can be used if one wants to avoid making assumptions. The calculation for dairy cattle at the farm is shown below. Table 3-7 gives the usable data at farm level. The average prevalence at farm level can be calculated as 35/599 = 0.058.
Table 3-7. STEC O157 farm level prevalence data of dairy cattle at the farm.
Study No. of
positive farms
No. of farms
Data from Overall prevalence 2.1.F2 Reinders and Bijker 1999 2 34 Jan-Dec 1997
2.1.F3 Heuvelink et al. 1999b 6 82 Apr-Dec 1997
2.1.F4 Van de Giessen 1998 13 267 1998
2.1.F5 Van de Giessen 1999 13 161 1999
2.1.F6 Van de Giessen 2000 1 55 Jan-Mar 2000
sum 35 599 0.0584
Table 3-8 gives the usable data at animal level. The overall animal level prevalence can be calculated using the average prevalence at farm level (0.058) and the animal level prevalence at negative and positive farms (0.0045 and 0.092, respectively). The overall animal level prevalence equals 0.058 × 0.092 + (1 - 0.058) × 0.0045 = 0.0096.
Table 3-8 STEC O157 animal level prevalence data of dairy cattle at the farm. Negative and
positive farms are farms previously found positive and negative, respectively. (Data from 2.1.F1 Heuvelink et al. 1998b, Heuvelink 2000d.) For negative farms, November measurements were averaged. For positive farms, September measurements were averaged and November 1997 measurements were not used. Animal level prevalence equals the no. of positive animals divided by the total no. of animals.
Farm No. of animals positive Total no. of animals Animal level prevalence Data from
Negative 3.5 777.5 0.00450 Nov 1996 - Nov
1997
Positive 64.5 702 0.0919 Sep 1996 - Sep
1997
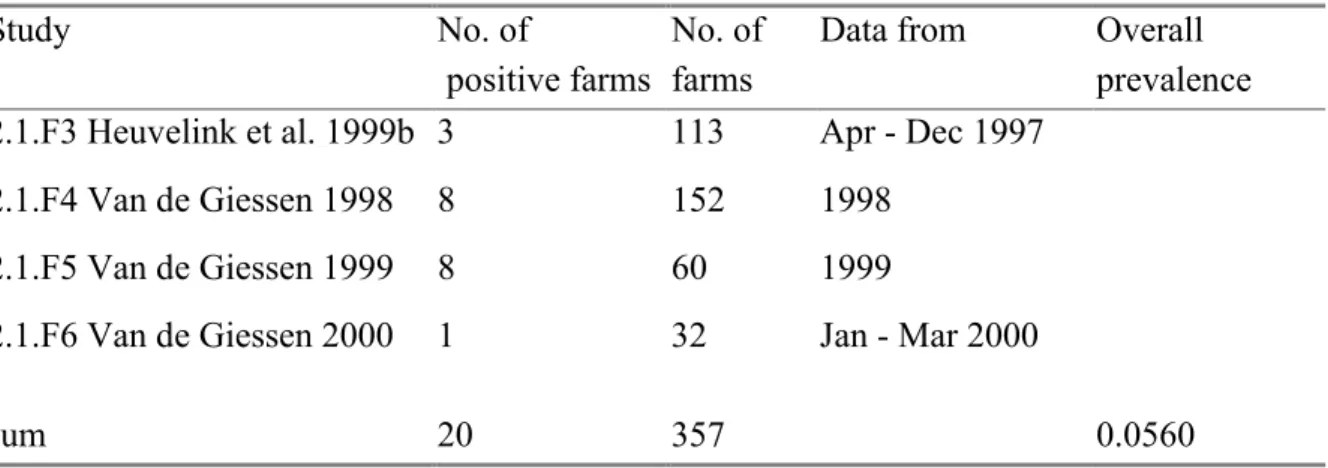
The calculation for veal calves at the farm is shown below. Table 3-9 gives the usable data at farm level. The average prevalence at farm level can be calculated as 20/357 = 0.056. There are no animal level prevalence data available for veal calves at the farm.
Table 3-9 STEC O157 farm level prevalence data of veal calves at the farm.
Study No. of
positive farms
No. of farms
Data from Overall prevalence 2.1.F3 Heuvelink et al. 1999b 3 113 Apr - Dec 1997
2.1.F4 Van de Giessen 1998 8 152 1998
2.1.F5 Van de Giessen 1999 8 60 1999
2.1.F6 Van de Giessen 2000 1 32 Jan - Mar 2000
sum 20 357 0.0560
For the slaughterhouse, the availability of year-round data is very limited. No data on dairy cattle are available. Usable veal calve data are shown in Table 3-10. Herd and animal level prevalence are equal to zero.
Table 3-10 STEC O157 prevalence data of veal calves at the slaughterhouse. Data from 1997
- 2000 from 2.2.S7 Reinders 2000.
Level No. positive Total no. Prevalence Herd 0 herds ca. 42 herds 0
Animal 0 animals ca. 840 animals 0
The retail data are shown in Table 3-11. The average tartare prevalence is equal to 1/82 = 0.012.
Table 3-11 STEC O157 prevalence data at product level for tartares at retail.
Study No. of
positive tartares
Total no. of tartares
Data from Overall prevalence
2.3.R6 De Boer et al. 1997 1 39 1996
2.3.R8 Heuvelink 2000a 0 43 1997
sum 1 82 0.0122
3.2.2 Concentration
This section describes the data found on concentrations of STEC O157. A more extensive description is given in Appendix 2.5 - 2.7.