ASSESSMENT OF THE
HUMAN ENVIRONMENT
Assessment of the Human
Environment 2012
Inhoud
Contents
Main conclusion 6 Main findings 11
Assessment of the Human Environment 2012 12 The State of the Human Environment 12
Main policy tasks for human environment policy 28
System change – a new policy task: what national government can do to effectively improve the quality of the human environment 31
References 55 Colophon 57
Main conclusion
The paradox of successful policy: the quality of the local human environment has improved in many areas but persistent global issues require systemic changes The quality of the local human environment has improved in the Netherlands since 1990. There has been a clear improvement in air, water and soil quality, a slowing down in biodiversity loss and, in general, good coordination between the spatial investments made by both government and private parties. This represents successful national policy on environment, nature and spatial development.
The paradox of this success, however, is that the improvement seen in the local human environment is in sharp contrast with the global issues around human environment quality that the Netherlands faces in 2012. Two of these issues, combating climate change and maintaining biodiversity, are well-known and persistent problems. The high level of dependence of prosperity in the Netherlands on rare raw materials is also a growing concern. These issues may seem abstract and far-removed, but in the long term could have a significant effect on society. They therefore require changes to be made to production and consumption systems.
The ‘greening’ of the economy has become necessary at the same time that the
Netherlands is struggling to deal with an economic crisis. It is now, at this time of review, that careful consideration should be given to our dependence on natural resources. After all, greening represents a search for a policy that is also sustainable in the long term. The main challenge for the coming years is to change the production and consumption system to such an extent that the strength of the economy and society is found in the most efficient use of natural resources while keeping hazardous emissions to a minimum. In some cases this can be achieved by intensifying policy; at other times a more fundamental change of approach is required. This therefore requires systemic changes; institutional reforms that help achieve a high-quality human environment without undermining the natural constraints, either in the Netherlands or elsewhere.
The Assessment of the Human Environment 2012 consists of two parts. The first part is the digital assessment, www.pbl.nl/balans2012 (in Dutch). This digital assessment documents all the numerical analyses of developments in the human environment. All developments concerning the environmental, nature and spatial objectives set can be found in this section. The second part is the assessment ‘book’. In the book, the PBL Netherlands Environmental Assessment Agency has analysed six social systems: climate and energy, the food system, rural areas and nature, water security and management, accessibility, and urban area development. The book includes an assessment of how best to achieve the sustainable management of the physical human environment. Which intervention options are available? These options vary per system (e.g. in the
relationship between regulation, pricing incentives and the provision of information). However, three clear elements can be seen: 1) the value and necessity of formulating a consistent vision and position at the national level, 2) the opportunities available for achieving better coordination at the regional level, and 3) the implementation of pricing strategies as an effective tool for initiating change processes. The implementation of these elements within national policy are summarised below.
Contemporary human environmental policy requires a consistent national government vision and position
The Dutch Government faces major challenges as far as the human environment is concerned. At the same time, it is aware of the limits to its control. The government may try to implement changes in the existing social systems, but should take into account that this opposes a number of vested interests and will result in some opposition. Therefore, it is important to facilitate and stimulate other stakeholders (other government authorities, businesses and the general public) in attempting to achieve public objectives. This requires a clear vision and role conception on the part of national government.
If the government is clear about what is necessary to achieve sustainable development, and if it consistently follows this vision, the result can be a greater willingness among public parties to take action and invest. Such a vision provides a basis for short-term decisions regarding the investments required for longer term sustainable improvements to the human environment. There is room for improvement in the following areas and ways:
• Energy. To achieve a low-carbon energy system by 2050, a coherent vision for this
system needs to be developed now, including corresponding long-term objectives and predictable, consistent policy. Only then can a suitable investment climate for clean growth develop. One of the reasons why many parties are currently reluctant to invest in the required innovation processes is that there is a lack of this kind of coherent vision. The vision could be based on the observation that there are four robust elements to such a low-carbon energy system in the Netherlands: 1) energy savings, 2) biomass, 3) low-carbon electricity generation, and 4) carbon capture and storage (CCS). The limited availability of sustainable biomass means that large-scale co-firing with biomass at power stations is not part of such a vision. Finally, the
strategies of neighbouring countries should also be taken into account in the development of this vision.
• Food. A clear and consistent government position on the direction and ambition for a
sustainable food system can encourage parties in the food supply chain to take action. The government position may be strengthened by proposing regulations with which all parties must comply. Parties not faced with uncertainty are likely to be more prepared to invest in sustainability as there would be less risk. It is crucial that any regulations are enforced, to ensure the trust of supply chain parties in government strategy.
• Accessibility. In addition to the current focus on the quality of connections (travel
speed), more attention is required for effecting change in the ‘proximity’ of points of departure and arrival and for limiting the demand for mobility. Pricing strategies could be an effective way of addressing the mobility issue.
• Spatial development. Strategic spatial visions help weigh up the competing spatial
claims of nature, water, agriculture, energy and accessibility. Such visions could be formulated at national or regional level and may considerably increase the
effectiveness and viability of sectoral policies on water quality, nature and agriculture. Regional approach allows complex problems to be tackled more effectively
National government is committed to decentralisation in various policy areas. Such a strategy provides many opportunities, as developing and implementing policy on a regional level enables the regional differences that exist within the Netherlands to be addressed. Regional parties are often in a better position to prioritise problems and solutions. A regional approach, however, does require that more attention is paid to the availability of specialist knowledge on the regional level, and it often takes longer. In theory, however, the result is a more effective and efficient approach than that of national policy, and one that enjoys more support due to the greater involvement of relevant parties.
National government may both facilitate the regional approach and ensure that supra-regional interests are taken into account; for example, by taking a coordinating role (within and between administrative layers, based on national visions), by making it clear which national and international frameworks apply, by implementing process
requirements, by supervising implementation, by monitoring the effects of policy and sharing this with regional parties, and by providing regional government authorities with sufficient knowledge and funding. National government must take a coordinating role if efficient solutions require action at a higher level (e.g. for the construction of infrastructure) or if supra-regional dynamics play a role (e.g. regarding urbanisation in the Randstad). By defining the framework, national government can ensure that there is a balance between the benefits of regional-level activities and the benefits of simplicity, transparency and the principle of equality.
National government may create the conditions for a successful regional approach through the reform of environmental law and by following through on the
decentralisation of spatial, nature and water policies. The following points, therefore, should be considered within the various areas of human environmental policy: • Decentralised nature policy provides the provinces with opportunities for taking a
leading role in tackling environmental problems and spatial planning issues. As national government remains responsible for ensuring that international nature and water quality obligations are met, guarantees are required that policy will be coordinated between provinces.
• The priority that national government currently gives agriculture seriously hinders the realisation of water and nature policy objectives. In areas in which ambitions for agriculture, water and nature cannot be reconciled, a specific choice must be made at the spatial development level either for agriculture or for nature and water in order to achieve the effective implementation of resources.
• National government has dropped its concentration policy as well as the national buffer zones, and this may endanger the protection of open landscapes; in particular, in areas under high pressure from urbanisation, such as the Randstad. Provinces have been made responsible for spatial policy, without having been given an explicit remit to protect landscapes. National government has also introduced the ‘Sustainable Urbanisation Ladder’, which stipulates that municipalities must first explore other urbanisation options before expanding the urban areas. In the Randstad, in particular, which lies in three different provinces, it is unclear whether the provinces will pay sufficient attention to the supra-regional importance of open landscapes (for recreation, the preservation of cultural heritage or as an establishment location factor for international businesses). National government should make it possible to intervene whenever urban expansion threatens to take place at the expense of valuable landscapes.
• In the case of urban area development, the current system of environmental
standards ensures that environmental interests are upheld and that municipalities are able to work efficiently and can be sure that their plans will stand up to legal
examination. Efficiency may be increased by tailoring the level of detail of the environmental impact assessment to the level of detail of the plans. In some specific cases, environmental standards actually prevent a better quality of the human environment from being achieved. As it turns out, the City and Environment Interim Act and the temporary Crisis and Recovery Act provide municipalities with sufficient jurisdiction to solve such problems. However, the Crisis and Recovery Act currently still lacks a legal guarantee for the measures required to meet environmental standards on time.
• The decentralisation of urbanisation policy allows provinces to better match construction activities to local requirements. However, this may be inconsistent with efficient investment in the national transport infrastructure and improvements to accessibility in the Netherlands. After all, accessibility depends just as much on the concentration and compaction of built-up areas as on the construction of extra infrastructure. The supra-regional coordination that is required is currently the
responsibility of the provinces and the MIRT (Multiannual Programme for
Infrastructure and Transport) consultation body. There are as yet no guarantees that such coordination is actually taking place.
• Water safety could be brought up to the required standard more efficiently. This could be done by basing it on a risk approach that takes more account of the regional differences in the consequences of flooding (in terms of victims and damage) than the current system. Efficiency would also be improved if investments were differentiated more in time and space, based on these regional differences in cost and required risk reduction.
Pricing stimulates socially desirable technologies and behaviour
Businesses are prepared to develop and introduce technologies that have a smaller environmental footprint, to use raw materials more efficiently and to improve the human environment. However, there must then be the prospect of an attractive return on their investments within the foreseeable future. Citizens would also be prepared to change their behaviour to improve the human environment if they would also benefit on a personal level.
Governments have various options available to make socially desirable technologies and behaviour economically attractive. Intergovernmental coordination is required on international markets, primarily to minimise the effect that government measures may have on the competitive positions of businesses. Examples are:
• The use of clean raw materials could be increased by coordinating or harmonising the sustainability requirements regarding the production and extraction of raw materials for food, energy generation (not just biomass) and industrial products (which could also be achieved by reducing existing indirect subsidies on fossil fuels).
• Changes to the regulations governing the European market of CO2 emission rights are required to stimulate the development of a low-carbon energy system. Many of the technologies required in such a system will only become profitable at a carbon price that is considerably higher than the current level of 6 to 7 euros per tonne. One effective tool for achieving price increases would be an accelerated lowering of the European emissions ceiling.
In the fields of water, transport and mobility, however, the Dutch Government could adapt some of its regulations without the need for international coordination. Examples are: • More pricing instruments in the agricultural sector; for example, following the
construction of new infrastructure for freshwater irrigation or following increases in nutrient emissions resulting from farm expansions. Pricing could also encourage the agricultural sector to look for production methods that reduce the pressure on the water system.
• Requiring road users to pay for mobility. This is a flexible alternative to the
construction of extra infrastructure as a tool to increase flow at the local level. Given the levelling off in the growth in car mobility and the uncertainty regarding the development of car mobility in the medium to long term, the construction of additional infrastructure is often not without risk.
In the Assessment of the Human Environment, the PBL Netherlands Environmental Assessment Agency evaluates national government policy for the physical human environment and presents operational options for making improvements to this policy. An indication is given of the extent to which environment, nature and spatial policy objectives have been met, and an assessment is made of what this means as far as public expectations of the quality of the human environment is concerned, now and in the future.
The State of the Human Environment
Introduction
The Assessment of the Human Environment evaluates the extent to which policy objectives, as set by the Dutch Cabinet, are being met in the fields that concern the human environment (the environment, nature and space). The human environment is determined by local surroundings and accessibility of the workplace, as well as by more abstract or globally felt factors, such as climate change and the use of natural resources, such as land, water and fertilisers for food production. Although these factors together form the physical human environment, they do not add up to a single quality standard for the human environment. The issues that provide the concept of the human
environment with concrete, relevant meaning are all separate, such as the quality of the local surroundings or global climate change.
These findings present the most prominent developments in relation to the status of the various factors that determine the quality of the human environment, and compare these with government objectives for the policy areas. In areas where objectives are unlikely to be achieved, suggestions for policy improvements have been provided. Developments around all environmental, nature and spatial objectives can be found in the digital assessment – the website that accompanies this Assessment of the Human
Assessment of the
Human Environment
2012
Environment (www.pbl.nl/balans2012; in Dutch). It should be noted that only a limited comparison of policy progress is possible between this assessment and the previous one (PBL, 2010). This is because the Rutte Cabinet has formulated some objectives differently (for mobility), lowered some objectives (for nature, landscape and climate and energy) and scrapped a number of concrete, measurable objectives (in particular in the fields of urban development and housing). In general, the quality of the
environment in the Netherlands has vastly improved, partly due to decades of consistent policy, with improvements primarily seen on local scales. That being said, there are still two major, persistent problems – climate change and biodiversity loss – for which no change in trend has yet been seen at the policy level. The imminent scarcity of raw materials is also already casting its shadow. On the basis of an analysis of six main systems, the starting points for addressing these policy tasks are indicated. Economic crisis affects quality of the human environment in various ways
The analyses in this Assessment of the Human Environment are greatly affected by the economic crisis. The economic crisis has a major effect on long-term and short-term developments in the human environment – effects that are not always easy to recognise (see www.pbl.nl/balans2012; in Dutch). The global credit crisis and associated
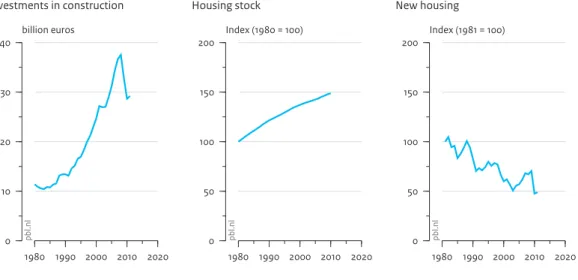
uncertainties regarding financing, affordability, risk and other institutional factors, as well as uncertainties regarding government policy, have resulted in high levels of uncertainty and little confidence among home owners and potential buyers. Institutional stakeholders in the housing market, including housing corporations, project developers, municipalities and banks, also have become more cautious (Haffner and Van Dam, 2011). The Netherlands, therefore, has experienced decreasing house prices, stagnating new-housing development, a decrease in the number of people moving house, reduced sales and an increase in risk for home owners. Investments in the construction sector in 2010 were almost 11% lower than in 2009 (see Figure 1), with a particular decrease in the number of completed new-build homes in 2010.
The drop in demand on the housing and real estate markets has also led to fewer investors in area development. This has resulted in less investment in infrastructure and public spaces. Some are attempting to solve this by finding new sources of investment – for certain things in urban area development for which there always remains a need, or for which the need even increases, such as energy infrastructure and care facilities (Peek and Van Remmen, 2012). A more fundamental question, however, is whether the strategy of linking spatial use functions in large-scale urban development plans at both the organisational and financial level is still a robust one. After all, urban development has often been based on tightly coupled systems, in which a complex calculation is made beforehand to be able to fund the land development. Loosely coupled systems, in which a problem in one part of a system does not necessarily result directly in problems in the system as a whole, are less vulnerable and, in times of uncertainty, possibly more robust (Buitelaar et al., 2012). The government should take this into account in its reform of the housing market, spatial policy and environmental law.
Because of the reduced levels of production and consumption, the economic recession has had an overall positive effect, in the short term, on the quality of the environment and nature and on spatial pressure and congestion. A potential positive effect for environmental policy is also that the reduced number of new-housing contracts are encouraging construction companies to look for other types of work and therefore have a greater focus on home improvements and energy savings in existing buildings. It is important that this focus is utilised now, and that it is maintained once the economy starts to show signs of improvement.
And finally, the crisis has also had less obvious effects on the environment. For example, the temporarily low CO2 emission levels of 2009 have had a more permanent effect on the price of CO2 emissions rights, as the unused emission rights from 2009 may be saved for use in laters years. Together with for example the decrease in the expected future demand for emission rights, this has resulted in a reduction in carbon price, down to the current level of less than 10 euros per tonne (see Figure 2). This negatively influences the outlook for the further development of electricity generation technologies –
technologies that will be crucial for significantly reducing greenhouse gas emissions. The crisis is also causing a general reduction in investments in efficient and clean technologies, which may therefore partly cancel out the beneficial short-term effects of the crisis on the quality of the human environment.
Figure 1 1980 1990 2000 2010 2020 0 10 20 30 40 billion euros pb l.n l Investments in construction
Investments and housing
1980 1990 2000 2010 2020 0 50 100 150 200 Index (1980 = 100) pb l.n l Housing stock 1980 1990 2000 2010 2020 0 50 100 150 200 Index (1981 = 100) pb l.n l New housing Source: CBS (2012) The crisis can be clearly seen in investments and in new-housing.
Human environment in the Netherlands showing significant improvements
Environment• Environmental pressure has decreased despite continuing economic growth. In general, environmental pressure in the Netherlands decreased significantly between 1990 and 2010, or, in the case of greenhouse gas emissions, remained more or less stable (see Figure 3). The emission of many substances to air, water and land were halved during this period. At the same time, gross domestic product (GDP) increased by over 50% during the same period. Up to now, therefore, the Netherlands has succeeded in uncoupling economic growth from environmental pressure. It should be noted however that part of the polluting production that used to take place in the Netherlands has moved to other countries.
• The emission of hazardous substances to the air has decreased significantly since 1990. As of
2010, EU countries must meet the European emission ceilings, implemented to substantially reduce air polluting emissions. The emission ceilings for sulphur dioxide, ammonia and volatile organic compounds are not being exceeded in the Netherlands. The emission of nitrogen oxides roughly equals the emission ceiling.
• European air quality standards achievable almost everywhere. Because of European
regulations, cars are becoming increasingly clean. Industrial emissions are also decreasing. As a result, European standards for particulates (PM10, PM2.5) and nitrogen dioxide will be met, on time, at many locations in the Netherlands. However, even if
Figure 2 2005 2007 2009 2011 2013 0 10 20 30 40
euros per tonne
pb
l.n
l
Price of CO2 emission rights
Source: Point Carbon (2012)
standards are being met, there are still considerable health effects due to poor air quality, particularly near busy roads.
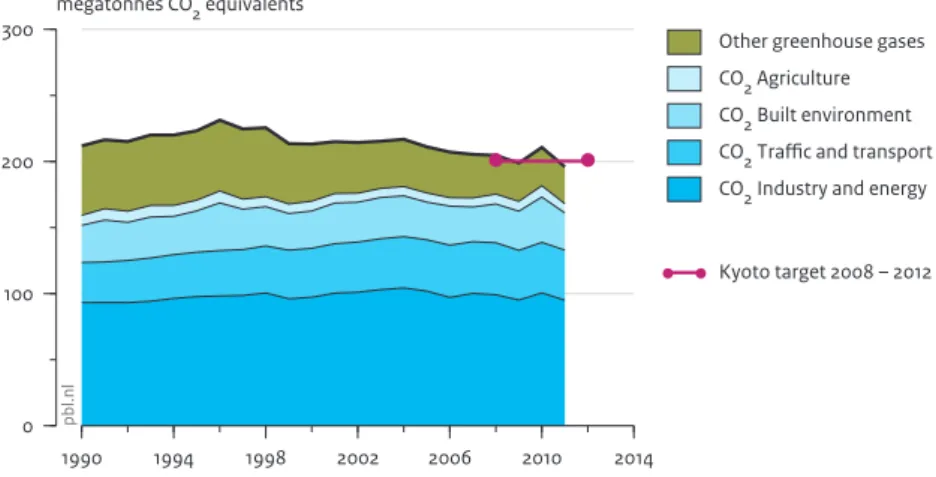
• The Netherlands adheres to its Kyoto commitment. Greenhouse gas emissions in 2011 in the
Netherlands were about 8% lower than 1990 levels. Compared with 1990, there was an increase in CO2 emissions and a decrease in emissions of non-CO2 greenhouse gases. The purchase of emission rights will contribute to the likelihood of the Netherlands achieving its Kyoto target, which is a reduction in greenhouse gas emissions of 6%, averaged over the 2008–2012 period, compared with 1990 levels (see Figure 4). The Netherlands is also on track to achieve its 2020 target for greenhouse gases that do not fall under the European Emissions Trading System (EU ETS).
• CO2 emissions from new cars have decreased considerably in recent years. On the other hand,
mobility growth between 1990 and 2011 has resulted in a 25% increase in CO2 emissions from traffic (see Figures 4 and 5).
Nature and biodiversity
• Global target to reduce biodiversity loss has been achieved in the Netherlands. The expansion
of nature areas and nature management have made it possible to halt biodiversity decline for many species groups. Recovery is even being seen in marsh areas, although biodiversity decline is still taking place in open dune areas and heathland. Outside the nature areas, however, biodiversity is still continuing to show strong
Figure 3 1990 1995 2000 2005 2010 2015 2020 0 50 100 150 200 Index (1990 = 100) pb l.n l
Gross Domestic Product (GDP) Climate Acidification Overfertilisation Waste disposal Targets Climate (Kyoto) Acidification Waste disposal Theme indicators
Source: PBL, CBS and Wageningen UR (2012)
Environmental pressure is not coupled to economic growth in the Netherlands and has continued to decrease in recent decades.
Figure 4 1990 1994 1998 2002 2006 2010 2014 0 100 200 300 megatonnes CO2 equivalents pb l.n l
Other greenhouse gases
CO2 Agriculture
CO2 Built environment
CO2 Traffic and transport
CO2 Industry and energy
Kyoto target 2008 – 2012
Greenhouse gas emissions per sector
Source: The Netherlands Pollutant Release and Transfer Register
Greenhouse gas emissions in the Netherlands in 2011 were about 8% lower than in 1990. There was an increase in CO2 emissions and a decrease in emissions of non-CO2 greenhouse gases. About 60% of other greenhouse gas emissions were produced by the agricultural sector in 2011. Figure 5 2002 2004 2006 2008 2010 2012 0 100 200 300 400 500 600 thousand vehicles pb l.n l G F E D C B A
Passenger vehicles sales according to energy label
Source: PBL, CBS and Wageningen UR (2012)
decline. Overall, therefore, biodiversity loss in the Netherlands has slowed, but not stopped. The Netherlands has achieved the global target (to slow down biodiversity loss) but has not met European and national targets (to halt biodiversity loss). Water safety and water management
• Taking a generic approach, considerable progress has been made in recent decades in various
water policy areas. The water safety policy of recent decades has meant that the
Netherlands is now much better protected against flooding: the human casualty risk is almost 20 times lower than it was in 1950. Surface water quality has also increased considerably since the 1970s, both chemically (nutrients, pesticides) and ecologically. There is sufficient fresh water available in normal and dry years for an adequate water supply to most users. Water drainage floods, swimming water and drinking water are also well-managed. Nevertheless, serious policy tasks remain regarding water security, water quality, aquatic nature and future freshwater supply.
Liveability in cities
• Urban liveability problems have been reduced. The number of people living in areas
affected by liveability problems decreased from 9% to 6% between 1998 and 2008. This concerns roughly half a million residents in neighbourhoods in which liveability has either improved or considerably improved. Neighbourhoods are considered to have liveability problems if people report being dissatisfied, very dissatisfied or only moderately satisfied with their immediate surroundings. In the subsequent period, from 2008 to 2010, little changed on average in the Netherlands, despite a slight increase in unemployment and other factors known to possibly negatively affect liveability. Some of the neighbourhoods that have shown an improvement in liveability have been renovated, resulting in improvements to the housing stock and public spaces. This is a possible indicator of successful physical policy (BZK, 2011). As well as physical improvements, redevelopment also results in changes in the population distribution within neighbourhoods (Van Dam et al., 2010). The social aspects of the local surroundings play a particularly important role in how neighbourhood liveability is perceived (VROM, 2004).
Traffic and accessibility
• Investments in roads have limited the increase in travel time losses. The number of vehicle
kilometres on the primary road network increased slowly but surely between 2001 and 2007, after which it levelled off at about 11% to 12% above the 2001 level. Concentration and compaction of residential and employment functions have contributed to the limited growth in mobility. However, the total loss in travel time on the primary road network in 2010 was over 25% higher than in 2001. There was a clear increase in travel time loss between 2002 and 2008, followed by a decrease (probably under the influence of the recession), after which it increased again slightly in 2010. Travel time loss is increasing more rapidly than total use of the primary road network (see Figure 6). This is because use of the road network is concentrated in certain areas
and at certain times. If no new roads and lanes had been built, the increase in travel time loss would have been about 10% more than it is today (KiM, 2011).
• Theoretical travel speed (along a straight line between two points) has been more or less stable.
The accessibility indicator introduced in the National Policy for Infrastructure and Spatial Planning (SVIR) focuses on this theoretical travel speed, with the objective of increasing it. In the 2004–2009 period, the theoretical travel speed for cars remained fairly stable, despite the growth in car mobility (Figure 7). Only in the periods just preceding and just following peak travel times was there a slight reduction in the average travel speed. This would indicate a broadening of peak travel times.
• Home and work located slightly closer together. There was a slight decrease in average
commuting distances over the last ten years. This is because the number of jobs and the population in urban areas have grown more than in rural areas. Increasing proximity (for example of homes and work locations) is an effective way of improving accessibility. Abolishing the mileage allowance and introducing a pricing policy would also contribute. Figure 6 2002 2004 2006 2008 2010 0 50 100 150 Index (2001 = 100) pb l.n l
Time losses due to traffic jams and delays Unreliability Average travel time Vehicle kilometres
Performance main roads network
Source: KiM (2012)
Points of consideration for policy: intensification or reform
Although significant improvements have been seen in a number of areas, some elements of the adopted and proposed policies on the human environment are insufficient to achieve certain policy objectives on time. In some cases, intensification would be enough to tailor resources to ambitions; in other cases, the chosen objectives or approach require fundamental changes to be made.
The most important targets that are not expected to be met on time are described below. A distinction is made between policy targets that are expected to be achieved if the current approach is intensified and those that require fundamental changes to be made both to the approach and the target itself. A detailed overview (in Dutch) is provided on this assessment’s website, showing the extent to which the operational policy targets are expected to be achieved on time. This is based on the policy targets set by the Rutte Cabinet. Where possible, points of agreement as documented in the most recent parliamentary agreement (Lenteakkoord) are also included.
Policy intensification
The policy targets could be achieved in the following areas of the human environment if the current approach were to be intensified:
Figure 7 2004 2005 2006 2007 2008 2009 0 50 100 150 Index (total 2004 = 100) pb l.n l Off-peak hours Time period just before and after rush hours Rush hours Total
Theoretical travel speed, by car, along a straight line between two points
Source: PBL (based on MON 2004–2009)
Environment
• The share of energy generated from renewable sources (biomass, wind, sun and water) is
increasing at an insufficient rate to meet the European target. Under current policy and
including the government agreement ‘Lenteakkoord’, the share of renewable energy will increase from 4% in 2011 to about 9% (bandwidth 7% to 10%) by 2020 (see Figure 8). If the proposed policy were to be implemented, this would increase to 11% (bandwidth 9% to 12%). The options for achieving the EU target of 14% by 2020 are to increase the financial incentive through the renewed sustainable energy incentive scheme (SDE+), to focus more on energy savings, to import renewable energy, or to put energy producers and suppliers under the obligation to focus on renewable energy. The disadvantage of this last option is that it would temporarily increase uncertainty for investors. There needs to be a greater focus on stimulating innovation in order to achieve targets in the long term.
Figure 8 1990 1995 2000 2005 2010 2015 0 4 8 12 16
% gross final energy consumption
pb
l.n
l
Realisation
Share of renewable energy
Adopted policy
Endorsed policy and 'Spring Agreement'
Endorsed and proposed policy 0 4 8 12 16 20
% gross final energy consumption
pb
l.n
l
Other types of renewable energy Heat Electricity Biomass Biofuels Heat Electricity Total Target Uncertainty of estimation Estimation, 2020
Source: CBS (2012); Verdonk and Wetzels (2012)
Under current policy and including the government agreement ‘Lenteakkoord’, the share of renewable energy will increase from 4% in 2011 to about 9% (bandwidth 7% to 10%) by 2020. If proposed policy is also followed the proportion will increase, but will still be insufficient to achieve the target for 2020 (14%).
• Noise levels from traffic and noise nuisance to residents remain too high. The target to reduce noise produced by road traffic by two decibels and noise from trains by seven decibels was not achieved in 2010. However, the number of problem areas along roads and railways is being reduced considerably through the recent introduction of noise ceilings and changes to the programme for the implementation of anti-noise measures. The target for 2020 is that there are no more problem areas. Although the noise targets could be achieved by accelerating the rate at which low-noise asphalt is laid, this is an expensive option. It would be much more cost-effective to introduce firmer restrictions at the European level regarding the amount of noise that lorries, cars and trains may produce. This is currently only done through a European directive on tyre noise limits. This tyre directive could result in a noise reduction of one decibel from 2020 onwards (TNO, 2011); a reduction that will be partly cancelled out by the recent increase in the speed limit to 130 kilometres an hour.
• The decrease in nitrate levels in groundwater in sandy areas is stagnating. The target of the
European Nitrates Directive (a maximum of 50 micrograms of nitrate per litre in the upper groundwater layer) has been achieved for clay and peat areas, but not for loess and sandy areas. New prognoses show that current policy is not expected to result in further decreases in nitrate levels in sandy areas. To achieve such decreases, the fertiliser standards for nitrogen need to be tightened and solutions found for the resulting growing manure surplus.
Nature and biodiversity
• Location of acquired land crucial in new National Ecological Network. In the agreement on the
decentralisation of nature areas (Onderhandelingsakkoord), the Dutch Government and the provinces have agreed on a newly defined, smaller National Ecological Network. National government has also implemented cutbacks in nature and landscape policy. Half of the cutbacks implemented by the Rutte Cabinet were cancelled as part of the latest parliamentary agreement (Lenteakkoord), which means that future investments in nature have been reduced by 30% compared with 2010. If the nature targets are to be achieved as much as possible, even though less land can be bought, the focus should be on acquiring land in the right places and on making more use of instruments such as expropriation and full compensation. Purchasing land for new nature areas will allow expansion of ecological areas that are currently too small, making it possible to effectively combat the desiccation of nature areas.
• Certification of supply chains proceeding slowly. The government stimulates the use of
sustainably produced raw materials and products to reduce the ecological footprint of the Netherlands (see Figure 9). Certificates must indicate that products have been made in compliance with sustainability criteria, and should thus stimulate the purchase of such products. No quantitative targets have been set for the sustainably produced market share of most raw materials and products. A quantitative target has been set for certified wood, at a market share of 50%. This target has been achieved for wood overall, but not for tropical wood. The Dutch market share of sustainable coffee is currently about 25% and for sustainable wood this is 50%. The market share of sustainable fish, however, is about 10% and sustainable soya is barely on the
market at all (data from 2008). The government could introduce more quantitative targets and set a good example through its own purchasing policy.
Traffic and accessibility
• Too little improvement in road safety. The number of road deaths decreased by 46%
between 2000 and 2010, to 640 deaths; in 2011 there was again a light increase in the number of road deaths. The number of serious road casualties increased by 16% in the 2000–2010 period. After an initial decrease, the number of serious road casualties increased between 2006 and 2010 by almost 25%, to 19,200 casualties. These developments mean that the targets for 2020 of a maximum of 500 road deaths and 10,600 serious road casualties will not be achieved.
Policy reform: a number of targets require a fundamentally different approach A more fundamental revision of current policy is required in the following areas of the human environment to be able to achieve related policy targets:
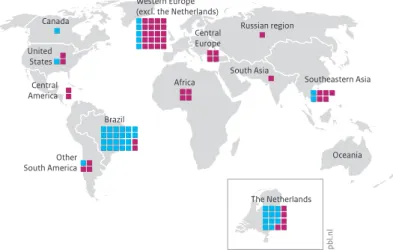
Figure 9 Africa Russian region Southeastern Asia United States South Asia Canada Brazil Western Europe (excl. the Netherlands)
Oceania Other South America Central America Central Europe
Global use of space due to Dutch consumption of agricultural products, 2005
= 50,000 ha Agricultural land used for fruit and vegetable production
Land used for the production of feed, meat, dairy and eggs
The Netherlands
pbl.nl
Source: PBL
Dutch food consumption requires almost 5 million hectares of land, about 20% of which located in the Netherlands and over 50% outside western Europe.
Environment
• Achieving a low-carbon economy in the long term requires additional impulses today. Current
policy provides few stimuli for the development of low-carbon energy systems. The price of CO2 emission rights is too low to make investments in CO2 mitigation attractive, and the current stimuli for renewable energy are not focused enough on the technologies required to achieve considerable emission reductions; technologies such as those related to energy savings, wind energy at sea, carbon storage and the gasification of woody biomass. Current policy will not achieve the required
fundamental transformations in the energy system on time. The cabinet is aiming for a low-carbon economy in the long term, as this is what is required to cost-effectively mitigate climate change by limiting the global temperature increase to 2˚C. This two-degree target requires that greenhouse gas emissions in rich countries, therefore also in the Netherlands, decrease by between 80% and 95% between 1990 and 2050. However, international negotiations regarding such emission reductions are
progressing extremely slowly.
Nature, biodiversity and water quality
• Global and national biodiversity loss not yet halted. The Dutch and European policy target
to halt biodiversity loss only seems to be achievable if more sustainable methods are introduced in fishery and the agricultural sector. Current policy focuses primarily on stimulating sustainable production methods, so that changes take place slowly. Furthermore, there is a lack of tools to help solve spatial issues around nature areas, and environmental policy is unable to achieve the required environmental conditions for nature.
• Environmental pressures on nature prevent targets from being achieved. Problems with water
stress and excessive use of fertiliser and plant protection products (in particular with respect to water) undermine the biodiversity of natural ecosystems (see Figure 10). The decrease in environmental pressure has levelled off, but even if emission targets would be achieved, this will still be insufficient to adequately protect nature. In the case of overfertilisation, there is a lack of economically feasible solutions to the manure surplus problem. In the case of water stress, the main problems consist of insufficient land acquisition, a lack of local support, insufficient financial resources and a lack of administrative drive.
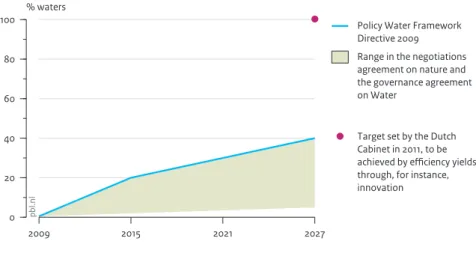
• Almost nowhere does the ecological quality of surface waters meet the objectives of the Water
Framework Directive. It is often impossible to achieve the water objectives and
corresponding nature objectives, given the criteria that the measures required must not result in extra costs for agriculture. In large areas of the Netherlands, land use is planned around agricultural use, which involves necessary unnatural drainage, unnatural water level management and unnatural flows, resulting in water stress in nature areas. In addition, as long as fertiliser levels remain too high, investments in land development measures will not be effective. In areas for which the objectives for water quality, nature and a healthy agriculture cannot be reconciled, a specific choice must be made at the spatial level between either agriculture or nature and water, in order to achieve the effective implementation of resources. Another possibility is to
change the Water Framework Directive (WFD) water quality objectives, although the European Union would require valid arguments before giving permission for such a change.
• Crop protection has become more sustainable but water quality and safety objectives have not yet
been achieved. Because of the efforts of growers, plant protection product
manufacturers, drinking water companies and the government, since 1998, crop protection in the Netherlands has become much safer for people, and the
environment. Less crop protection product residues are found in food and the quality of surface waters has also improved. Despite these improvements, however, the policy targets for safety and surface water quality have not been achieved (Van Eerdt et al., 2012). New policy is currently being drawn up and includes targets for 2027. In the short term, better prospects for water quality and safety could be achieved by improving compliance with obligatory emission reduction technologies, better matching the authorisation procedure to the practice setting, replacing the most polluting substances with those that are less polluting or with non-chemical
alternatives, and by improving safety instructions for employees. For the longer term, the focus should be on investment in more systems innovation and the development of more environmentally friendly resources and methods, such as organic pesticides.
Figure 10 1990 1994 1998 2002 2006 2010 2014 0 100 200 300
Index (level of sustainable nature conservation = 100)
pb
l.n
l
Desiccation
Freshwater eutrophication Salt water eutrophication Land acidification
(NOx en SO2)
Nitrogen deposition on land Level of sustainable nature conservation
Environmental pressure on water and nature areas
Source: PBL
The environmental pressure on nature has decreased considerably since 1990. Nevertheless, it is still not at the level required for sustainable nature conservation.
Water safety
• Flood risk management not yet at an acceptable level. Despite ongoing investment (see
Figure 11), one third of the primary dykes and one fifth of the coastal defences failed to meet official standards in 2011. Flood risk policy over the past decades, however, has contributed to the fact that the Netherlands is now much better protected against flooding. On the other hand, the water security policy task has increased, due to strong population growth and increased prosperity in high-risk areas, as well as climate change. Current water safety standards mainly relate to design issues concerning the height of dykes. However, not only the height of a dyke determines its strength. Recent knowledge about the ways in which dykes can collapse requires reconsideration of the flood protection requirements for dykes. Current standards are also based on a general assessment of the cost of investment set against the risk. The objective to also include the human casualty risk in the new standards will result in a change in priorities. New safety policy is therefore being developed within the Delta Programme. Figure 11 51 % 25 % 4 % 20 % pbl.n l National government Provinces Municipalities Water boards Total, 2011
Government expenditure on tasks related to water, 2011
2004 2006 2008 2010 2012
0 500 1000 1500
million euros per year (2011 price level)
pb
l.n
l
Water management Dykes and embankments
National government
Source: Ministry of IenM (2012)
Total government spending on water was 5.4 billion euros in 2011, of which 1.1 billion came from national government. Spending by national government has doubled since 2004, mainly due to increased spending on water safety.
Traffic and transport
• Desired travel time ratio between peak and off-peak traffic periods difficult to achieve. According
to current policy, a journey during peak travel hours on motorways between the major cities may take a maximum of one and a half times longer than the same journey at non-peak hours; on other sections of the primary road network it may take a maximum of twice as long. The number of sections of road that met this
requirement decreased from 89% to 80% between 2000 and 2008, after which it again increased to 83%, due to stabilising mobility and the construction of new roads and additional lanes (see Figure 12). Travel times during peak hours can be decreased by considerably expanding road capacity and by encouraging drivers to avoid travelling at these times. This first of these options requires a large amount of money for infrastructure – infrastructure that will only be used for a small part of the day. Furthermore, the effect is probably temporary as additional infrastructure also encourages more road use. The second option (avoiding peak travel times) can be stimulated through traffic management, by charging users when they drive at peak times or by abolishing or limiting the tax relief provided through the travel cost allowance. Figure 12 2000 2002 2004 2006 2008 2010 2012 0 20 40 60 80 100 % of routes pb l.n l Target Realisation
Routes with a desired rush-hour travel time
Source: RWS/DVS (2012)
The number of road sections on the primary road network that satisfy the required travel time during peak hours has decreased slightly since 2000.
Main policy tasks for human environment policy
Climate change and biodiversity damage: two persistent but urgent problems Global biodiversity has decreased by about a quarter, over the last 40 years, with most of the loss taking place in the tropics. Future population and income growth will require space for homes, offices and food production and will therefore continue to put biodiversity under pressure. Through trade and consumption, countries in the temperate zones also have an ecological footprint in tropical areas, and therefore contribute to the considerable biodiversity loss in those areas.Damage done to biodiversity is a threat to future fisheries and wood production, the regulatory function of the climate and the water cycles and the recovery ability of land and water systems. In developing countries, in particular, biodiversity loss results almost directly in loss of resources such as clean drinking water and fertile land. Although an agreement was made in 2002 to slow global biodiversity loss by 2010 and to halt it all together in Europe, neither of these objectives has been met. In 2010, the decision was taken at the global level to shift the objectives forwards to 2020, with partial biodiversity recovery also being added to the targets.
According to the IPCC, the earth could be between 1.1˚C and 6.4˚C warmer in 2100 than in 1990 (IPCC, 2007a), with developing countries being particularly vulnerable to such climate change. There is global political consensus that the global temperature increase must be limited to 2˚C (UNFCCC, 2009), and many studies show that this is technically and economically feasible. Nevertheless, the climate challenge can hardly be
exaggerated. The two-degree target can be achieved if a large group of countries agrees on a global reduction in greenhouse gas emissions of 50% between 1990 and 2050. For rich countries such as the Netherlands, which has relatively high greenhouse gas emissions, this means a reduction in emissions of 80% to 95% (IPCC, 2007b). In 2005, industrialised countries came to an agreement under the Kyoto Protocol to achieve a joint emission reduction of 4% between 1990 and the 2008–2012 period. This target will probably be achieved. However, the agreements that have now been made for the period up to 2020 mean that, at best, only half the reduction required to meet the two-degree target will be achieved.
The limited progress being made in addressing these problems reflects the considerable inertia in the social systems. This makes it even more urgent for these problems to be tackled now.
Resource scarcity again on the agenda
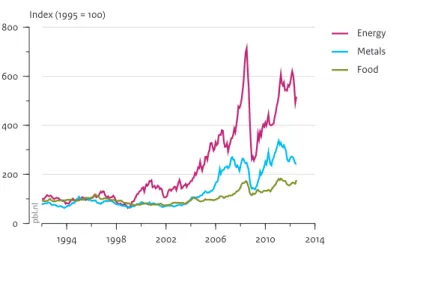
The explosive increase in the demand for raw materials has resulted in a strong increase in the price of raw materials in recent years (see Figure 14). This has completely reversed the price drops of the previous century. The high and volatile prices mean that resource scarcity is once more on the political agenda. Concerns about scarcity are further fuelled by our growing dependence on these materials. Although Europe needs to import many
of its raw materials, there are only a few suppliers and these suppliers use their monopoly positions to their economic or political advantage. There has also been a fundamental change in the geopolitical situation, with Europe and other rich countries (OECD countries) no longer determining the rules of the game. Upcoming economies are catching up with Europe and are creating their own frameworks and standards, feeding concerns about future supply security.
Concerns about scarcity will continue to play a role in the coming decades as a growing world population and increasing prosperity will continue to increase the demand for raw materials. It is becoming increasingly expensive to extract the raw materials and the market power of suppliers is increasing. Geopolitical risks will not disappear overnight, and a sufficient supply of certain raw materials in the longer term is uncertain.
Figure 13 2000 2050 2100 0 20 40 60 80 100
gigatonnes CO2 equivalents per year
pb l.n l Baseline scenario 450 ppm CO2 eq Target: 50% reduction by 2050, compared to 1990
Global greenhouse gas emissions
Climate change and biodiversity decline
1970 1980 1990 2000 2010 0 50 100 150 Index (1970 = 100) pb l.n l Temperate regions Tropical regions Average
Global terrestrial species
Source: PBL (2011a) (left) and WWF (2012)
The 2 °C target may have been accepted, but emission trends still strongly deviate from this target. To have a 50% chance of achieving the 2 °C target, long-term greenhouse gas concentrations of 400 to 450 ppm CO2 eq are
required. This means a halving of global greenhouse gas emissions compared with 1990, with a peak in about 2020. Global biodiversity has decreased by about a quarter since 1970. In the tropical areas, the decrease was almost twice as much in the same period.
Climate change, biodiversity preservation and resource scarcity result in policy dilemma
In addition to the scarcity issue, policymakers are also faced with other issues related to resource use. Climate change, biodiversity loss and air pollution are all a direct result of resource use. It is also the case that many environmental problems are due to the excessive use of raw materials, rather than their scarcity. In this respect, raw materials are actually too cheap, as the environmental costs are not sufficiently taken into account.
The government, therefore, is faced with a dilemma. From an environmental point of view, it would be better to make polluting raw materials more expensive, but from the point of view of scarcity they should be cheaper. Better resource efficiency would seem to be the solution to resource scarcity and the associated environmental pressure. A more efficient use of resources would ensure that limited supplies could be used for longer, and less use would result in less pollution. However, a complete decoupling between economic growth and resource use cannot be taken for granted. Improving efficiency means increasing resource productivity. This may result in additional growth and not necessarily reduce demand for the resource, because of the rebound effect.
Figure 14 1994 1998 2002 2006 2010 2014 0 200 400 600 800 Index (1995 = 100) pb l.n l Energy Metals Food
Global price of energy, food and metals
Source: IMF
System change – a new policy task: what national
government can do to effectively improve the quality
of the human environment
A description of the status of the human environment gives mixed signals. One the one hand, much has been achieved, while on the other there are still persistent problems that are insufficiently addressed by policy. In order to find policy strategy options, six crucial social ‘systems’ are analysed in this section. The analysis of these systems also shows who the players are; for example, supranational organisations, the European Union, businesses and interest groups, as well as regional governments and other regional parties. This presents a number of questions: How should national government respond to the various interests? Under which conditions will public actors come into action and be able to contribute to the required changes? The playing field is also made clear: supranational regulations, global markets and an articulate public largely determine and define the sphere of action of the government. What is – in such a situation – a suitable, efficient policy approach?
The six systems partly determine how successful climate and biodiversity policy will be. Resource scarcity will also be evident in these systems (e.g. energy and food). While each of the individual systems has a large impact on the physical human environment, together they represent a cross-section of the sphere of action available to the government. The relationships between stakeholders also vary greatly depending on the system. This clearly makes a future one-size-fits-all approach impossible. The six systems are:
1. climate and energy: stakeholders depend on one another for the production, transport and use of energy;
2. sustainable food supply: this concerns a global network of production chains (from farmer to consumer) in which the stakeholders are mutually dependent on each other for the conversion of raw materials into high quality and affordable food; 3. rural areas and nature: there are often competing spatial claims for agriculture,
nature, water, energy and infrastructure;
4. water security and water management: the different stakeholders are dependent on one another for achieving the required water quality, water management and water security;
5. accessibility: if the various accessibility targets are to be achieved, traffic infrastructure must be tailored to the current and future spatial distribution of businesses, homes and other locations;
6. urban area development: stakeholders must work together to achieve general environmental standards and to meet location-specific spatial requirements. A number of policy strategy options have been identified for each system.
National policy for climate and energy
Conflict exists In the fields of climate and energy, there is a certain tension between the policy that is required to achieve a clean, low-carbon economy in the longer term and the policy required to meet climate and energy targets for the year 2020.
• A long-term vision for a low-carbon energy system could increase the willingness of the parties involved to take action and invest. Such a vision should preferably take into account the strategies of neighbouring countries and build on four robust elements: energy savings, wind at sea, carbon capture and storage (CCS) and innovative biomass technologies.
• The current focus is primarily on achieving the target of 14% renewable energy by 2020, against the lowest possible cost. This focus possibly threatens innovative, currently expensive clean energy technologies – technologies that are crucial for achieving long-term targets.
• It is possible to improve the investment climate for such innovative clean technologies by placing more emphasis on innovation, combined with a better European emissions trading system. This requires an active role for the European Union.
The road to a low-carbon economy
The energy supply system requires radical reform over the coming decades. This is necessary not only to help limit global climate change, but also, although with slightly less urgency, to ensure sufficient, affordable energy for the future. Such reform presents a challenge for every country in the world – a challenge with specific elements for each country. Global greenhouse gas emissions must be drastically reduced if the global temperature increase is to be limited to 2 ˚C. In rich countries, this means a reduction of between 80% and 95% between 2010 and 2050. It is crucial that energy is used more efficiently if this is to be achieved; for example, by replacing fossil, high-carbon energy sources with renewable sources (biomass, sun, wind, hydropower and geothermal energy) and possibly nuclear energy, by capturing and storing CO2, and by reducing emissions of non-CO2 greenhouse gases. Scenario studies show that, in every case, the following will be required in 2050: 1) energy savings, 2) sustainable biomass, 3) low-carbon electricity, and 4) low-carbon storage (PBL and ECN, 2011).
Low-carbon energy based on innovative, clean technologies is currently much more expensive than fossil energy. This is due to the fact that clean technologies need to be developed further, and partly also because fossil-fuel prices do not fully take into account the environmental damage that they cause. The expected increase in energy demand is also projected to result in an increase in fossil-fuel prices. However, this price increase will not sufficiently stimulate the implementation of clean technologies to solve the climate problem on time. Governments could introduce a price correction for fossil fuels, but by doing so would be faced with the interests of producers and users of fossil energy as well as with the necessity of maintaining economic growth and employment. Some of the economic disadvantages could be overcome by coordinating price corrections at an international level. Such international coordination, however, is
not necessarily in keeping with current thinking regarding the liberalisation of world trade.
New technologies can only be made cheaper through further development and implementation. This begs the question of what wouldbe a suitable timeframe for a transfer to these clean technologies? Those who make the transfer too quickly pay a high price, damage their competitive position and lose turnover, income and employment. It is attractive for individual businesses to wait until innovative, clean technologies have become cheaper, but of course if everyone waits this will never happen. Innovators can only take a limited financial risk and therefore there needs to be a reasonable chance of their clean technologies turning a profit within the foreseeable future. After all, they cannot keep financing their innovations themselves forever. Governments could remove this dilemma by creating markets for clean, although still expensive, technologies.
That which applies to businesses, also applies to countries. Waiting is cheaper in the short term (less loss of competitive position) but does not solve the climate problem. This will only happen if countries work together and create international markets for clean technologies. If countries work together, then loss of competitive power is no longer an issue. It is also possible for countries, as well as businesses, to anticipate such cooperation and begin to invest in the development of clean technologies in the hope of profiting from them once a market has been created.
Dutch climate strategy seeks efficiency in the short term
The cooperation between countries described above, in the European Union, has taken the form of the current EU climate policy. About half of greenhouse gas emissions are regulated through the European emissions trading system (ETS), and Member States are also required by the European Union to reduce emissions that do not fall under the ETS. They are also required to obtain part of their energy from renewable sources.
It currently looks as though the Netherlands will achieve the non-ETS target for 2020, but not the renewable energy target (see Figure 8). The share of renewable energy is now 4% and would need to grow to 14% by 2020. Current policy will achieve a share of no more than 7% to 10%. Taking into account proposed policy, the share could increase to between 9% and 12%. This also takes into account the introduction of the so-called Green Deals, the co-firing of biomass in coal-fired power plants and the implementation of the national planning vision for wind energy on land (Structuurvisie windenergie op land). To achieve the 14% target by 2020, the Dutch Government could do more in terms of energy savings, increase its budget through, for example, the SDE+ scheme, import renewable energy, or oblige energy producers or suppliers to make more use of renewable energy sources. The last of these would require systemic change, which would initially result in uncertainty regarding the direction of government policy. In the long term, however, the focus must lie primarily on stimulating innovation.
Insufficient incentive for development of technologies that are needed by 2050 The European Union’s emissions trading system indirectly corrects the fossil-fuel price through the price that must be paid for CO2 emission rights. The more expensive these emission rights become, the more attractive low-carbon energy carriers will be. As a result of the recession, however, there has been a drop in demand for emission rights, and their price has decreased from over 20 euros per tonne of CO2 to less than 10 euros per tonne. This therefore means the loss of an important incentive to develop low-carbon technologies. The lack of credit available to innovative companies due to the credit crisis has reinforced the problem.
The Dutch Government, meanwhile, has changed its sustainable energy incentive scheme (SDE) into SDE+. Together with the old schemes (MEP and SDE), there will be more funding made available for the implementation of clean technologies over the next few years, but this funding will be distributed differently between the various technologies. Technologies that are ultimately needed but that are currently too expensive, such as wind at sea, carbon storage and the processing of woody biomass, are not included in the SDE+ scheme. The SDE+ funds are now primarily intended for technologies that contribute more per euro to the 2020 renewable energy targets, such as renewable heat and biogas from fermentation. These technologies help achieve a clean economy, but they do not contribute to cost reductions for a number of
technologies with large potential that will be needed to achieve the emission target for 2050.
For the production of low-carbon electricity, some of the potential of wind power on land remains unused, mainly because of the difficulties in incorporating wind turbines into the landscape and the opposition from local residents. There is also a large potential for wind power at sea, with corresponding opportunities for Dutch companies. However, the lack of a long-term strategy for wind power at sea in the Netherlands means that companies can only sell their products abroad.
In Europe, there is a lack of clear criteria and control mechanisms that are required to ensure that the production of biomass does not, directly or indirectly, result in the transformation of nature areas into agricultural land and, thus, in additional greenhouse gas emissions. The present use of biomass in electricity generation makes a substantial contribution to renewable energy production. However, the limited sustainable biomass supply could cause a conflict between this application and other uses (such as for vehicle fuel), for which there are far fewer clean alternatives. If coal-fired power plants were to be built today in anticipation of large amounts of biomass co-firing, this could result in an undesirable lock-in situation.
If carbon capture and storage (CCS) is to have a chance, pilot projects are required. These pilots could help reduce CCS costs (currently, between 80 and 100 euros per tonne). If carbon capture and storage is also to be economically feasible, the carbon price in the year 2025 needs to be considerably higher than the present price of less than
10 euros per tonne. As the prospect of this seems unlikely, the initiators of CCS projects are pulling out, not just in the Netherlands but all over Europe.
There is still much potential in the Netherlands for achieving energy savings, both in businesses and homes. The current regulations – requiring businesses to take savings measures that provide a return on investment within five years – are insufficiently monitored, as municipalities lack both capacity and knowledge. There is also a large potential for savings in existing homes, but the diversity of housing types and owners makes this difficult to achieve. The current focus of the government is on providing information and facilitating energy savings (for example using energy labels, the Meer-met-Minder (more with less) website and the ‘row-by-row’ approach (housing renovation per row of houses (Blok-voor-Blok)). This is useful policy, but it would be made more effective if it were supplemented with more powerful energy-saving incentives, such as linking taxation to energy labels, making the financing of energy-saving measures easier, increasing the transparency of the supply (certification), and including energy costs in the rental price, also in the case of commercial and industrial buildings and the private rental sector (so that landlords benefit financially from energy-saving
improvements). The recent decision taken at European level to oblige energy supply companies to take a role in energy savings may help.
Options for a more effective climate policy
Options are available to the Dutch Government to further stimulate a transition towards a low-carbon energy supply, even in these financially difficult times. For example, the government could provide the European Union with powerful support in creating a market for clean technologies. At the same time, it could support innovation at the national level by concentrating on those technologies that have a large potential in the longer term and that Dutch businesses could use in developing a competitive
advantage.
What does this mean in concrete terms?
The Dutch Government has the following options at the European level:
• encourage the European Union to set ambitious targets for greenhouse gas emission reductions;
• recommend changes be made to the ETS to enable businesses to better be able to invest in innovative technologies;
• take the lead in the development of a powerful sustainable biomass system. Within the national innovation programme, the government could do the following to reinforce the feedback between CO2 mitigation and economic stimulation in both the short and the long term:
• Develop a robust innovation strategy for wind power at sea, biomass gasification and fermentation and carbon capture and storage. Such a strategy should, at a minimum, contribute to a reduction in the costs of essential low-carbon technologies and provide opportunities for Dutch businesses in the long term.