Exploring post-Kyoto climate regimes
for differentiation of commitments to
stabilise greenhouse gas concentrations
M.G.J. den ElzenThis research was conducted for the Dutch Ministry of Environment as part of the Climate Change Policy Support Project (M/728001 Ondersteuning Klimaatbeleid)
Abstract
This report aims at exploring the implications of various international climate regimes for differentiating future commitments compatible with Article 2 of Climate Change Convention, i.e. stabilising the greenhouse gas concentration at a ‘non-dangerous’ level. Three climate regimes are explored: (1) the Multi-stage approach, gradual increase in the number of Parties involved and their level of commitment according to participation and differentiation rules, (2) the Convergence approach, with universal participation and a convergence of per capita emissions; (3) the Triptych approach, a sector and technology-oriented approach.
The FAIR (Framework to Assess International Regimes for the differentiation of commitments) model is used to explore the implications of these regimes on future emission allowances. It was not the objective to reach any conclusions about what type of regime would be preferred. The quantification analysis of each of the approaches shows that substantive reductions of Annex I emissions are needed for stabilising CO2
concentration at 450 ppmv by 2100, as well as timely participation of the non-Annex I countries in global emissions control. The schemes were also qualitatively evaluated according to criteria for environmental effectiveness, equity, flexibility and operational requirements. The Triptych approach scores high on most of these criteria, and
connects well to technological improvement and transition to a low-carbon economy, which may well appeal to both Annex I and non-Annex I Parties.
Acknowledgements
This study was conducted at the RIVM National Institute for Public Health and the Environment for the Dutch Ministry of Environment within the Climate Change Policy Support project (M/728001 Ondersteuning Klimaatbeleid). The authors would like to thank the participants of the COOL (Climate OptiOns for the Long-term) workshops for critical and useful comments, and ideas on the FAIR model and the issue of
international differentiation of future commitments. Furthermore, I would like to thank Heleen Groenenberg of the Utrecht University in the Netherlands for her input on the Triptych approach and her contributions to earlier drafts. Finally, I would like to thank Marcel Berk, Bert Metz and André de Moor for their comments and contributions and Ruth de Wijs for language-editing assistance.
This report represents a modified and extended version of the manuscript with the same title, submitted to Integrated Assessment in April 2002.
Contents
SAMENVATTING ... 5
1 INTRODUCTION... 6
2 THE FAIR MODEL ... 8
3 THE MODEL EVALUATION... 10
3.1 The Multi-stage approach ... 10
3.2 Per capita Convergence approach ... 14
3.3 Triptych approach ... 17
4 EVALUATION OF THE THREE CLIMATE REGIMES... 28
5 CONCLUSIONS ... 31
REFERENCES ... 33
APPENDIX I: PURCHASE POWER PARITY (PPP) ... 36
Samenvatting
Dit rapport beschrijft een analyse voor het (kwantitatief) verkennen van verschillende regimes voor internationale lastenverdeling voor het klimaatbeleid, in
overeenstemming met doelstellingen voor bescherming van het klimaat. Dit is gedaan op basis van de doelstelling, geformuleerd in Artikel 2 van het internationale
Klimaatverdrag UNFCCC, de stabilisatie van de concentraties van broeikasgassen op een ‘veilig’ niveau. Het FAIR model (Framework to Assess International Regimes for differentiation of commitments) is gebruikt voor de kwantitatieve analyse. Drie verschillende benaderingen voor internationale lastenverdeling-regimes zijn
geanalyseerd: 1. ‘Multi-stage’ (toenemende participatie): in deze benadering neemt het aantal landen en hun inspanningsniveau geleidelijk toe op basis van regels en criteria voor zowel deelname als bijdrage; 2. Convergentie: in deze benadering nemen alle partijen direct deel aan een emissierechtenregime, waarbij de toegestane emissieruimte in de tijd convergeert van het bestaande naar een gelijk hoofdelijk niveau; 3. Triptiek, een sector- en technologiegeoriënteerde benadering. De methode is gebaseerd op gedifferentieerde doelstellingen voor verschillende sectoren, en daarmee leidt de methode tot overdacht van technologie naar ontwikkelingslanden, almede de transitie naar een lage koolstof economie. Voor elk van de regimes worden voorbeelden gepresenteerd, die alle wijzen op vergaande reducties van de Annex I emissies na 2010. Voor het bereiken van de concentratie stabilisatie doelstelling is het strikt noodzakelijk dat ontwikkelingslanden voor 2030 gaan deelnemen aan het reductieregime. Verder zijn de drie regimes geëvalueerd op criteria voor milieueffectiviteit, gelijkheid, flexibiliteit en operationele eisen. De Triptiek benadering lijkt het beste te voldoen aan de gestelde criteria. Een dergelijke
lastenverdeling op basis van overdracht van technologie naar ontwikkelingslanden, almede de transitie naar een lage koolstof economie vormt een interessante benadering voor zowel de ontwikkelingslanden als de geïndustrialiseerde landen.
1 Introduction
The ultimate objective of the United Nations Framework Convention on Climate Change (UNFCCC) (Article 2) is to ‘stabilise greenhouse gas concentrations in the atmosphere at a level that would prevent dangerous anthropogenic interference with the climate system’ (UNFCCC, 1992). The UNFCCC has not yet quantified this objective. One of the most crucial issues for the development of an effective
international climate regime is the issue of the differentiation of future commitments1 for both Annex I and non-Annex I countries. While the greenhouse gas emissions of non-Annex I at present are smaller than the emissions of Annex I countries, it is expected that within a few decades these emissions will overtake those of Annex I countries. However, already in 1992, during the negotiations on the UNFCCC, non-Annex I countries stressed that given their historical emissions the non-Annex I countries would bear the primary responsibility for the climate change problem and should take the lead in climate change mitigation actions. This is formally recognised in the UNFCCC, which states that Annex I and non-Annex I countries have ‘Common but differentiated responsibilities’ (Article 3.1) (UNFCCC, 1992). It was re-acknowledged in the so-called Berlin Mandate (UNFCCC, 1995), in which additional commitments were limited to developed countries only. During COP-3 in 1997, the industrialised countries agreed in Kyoto (Japan) to reduce their GHG emissions in the 2008-2012 period by an average of 5.2%, compared to base-year levels (UNFCCC, 1997). At meetings in Bonn and Marrakech in 2001, the Parties agreed on a number of key implementation issues of the Kyoto Protocol, leading to the Marrakech Accords, notwithstanding the US decision to withdraw from the Kyoto Protocol earlier the same year. The Kyoto Protocol (KP) does not include new commitments for the non-Annex I regions for the first commitment period, but it will be a major issue in discussions about subsequent commitment periods.
In the light of the need for a broadening of the participation of developing country Parties in future emission control, the development of the international climate regime could take different directions (Berk and Den Elzen, 2001):
1. incremental regime evolution, i.e. a gradual expansion of the Annex I group of countries adopting binding quantified emission limitation or reduction objectives under the UNFCCC;
2. structural regime change, i.e. defining the evolution of emission allowances for all Parties over a longer period.
The first approach would mean a gradual extension of the present KP approach to
differentiate the obligations of various Parties under the Convention (sometimes referred to as ‘graduation’). It could be based on ad-hoc criteria, or on pre-defined rules for both participation and differentiation of commitments. An example of such an approach is the ‘increasing participation’ or ‘Multi-stage’ approach (Berk and Den Elzen, 2001; Den Elzen et al., 1999; Gupta, 1998). In this approach, the levels and the type of
commitments is differentiated among Parties on the basis of (alternative) participation
1 Although burden-sharing is a common concept in the literature, this debate is usually framed in terms
of ‘differentiation of (future) commitments’ according to the language in the UNFCCC. This term is preferred here instead of ‘burden-sharing’.
and burden sharing rules. This approach entails gradual extension of the climate regime to include non-Annex I regions with different types of obligations.
The second approach would be a major shift away from the present Protocol approach towards defining commitments for all Parties and their evolution over the long-term. A clear case of the latter is the so-called ‘Contraction & Convergence’ approach (Meyer, 2000), which defines emission permits on the basis of a convergence of per capita emissions under a contracting global emission profile. In such a Convergence regime all Parties participate in the climate regime with emission allowances converging to equal per capita levels over time.
A quite different approach would be a type of regime that is sector- and/or technology-oriented approach in differentiating commitments, such as the Triptych approach (Phylipsen et al., 1998). The Triptych approach is a sectoral approach taking into account national circumstances and, hence, is more bottom-up in character. Originally, the approach was used within the EU to help define its internal differentiation of targets for the KP (Blok et al., 1997; Phylipsen et al., 1998). It has been applied on a global level in two studies (Den Elzen et al., 1999; Groenenberg et al., 2001).
Both prior to the negotiations on the KP and afterwards there have been many proposals for differentiating mitigation commitments among countries, both from academic circles as well as from Parties to the UNFCCC (Depledge, 2000; Ringius et al., 1998;
Torvanger and Godal, 1999). This report focuses only on the three climate regimes of differentiation of future commitment: Multi-stage, Convergence and Triptych, to explore their compatibility with the UNFCCC’s ultimate objective of stabilising the greenhouse gas concentrations at non-dangerous levels. The report also presents an updated Triptych approach that deals with a number of shortcomings in two earlier global applications, based on recent work of Groenenberg (2002). The framework for the analysis is the decision-support model, FAIR (Framework to Assess International Regimes for differentiation of future commitments). This model is designed to quantitatively explore a range of alternative differentiation schemes of future commitments under the UNFCCC (post-Kyoto) in the context of stabilising
greenhouse gas concentrations (Den Elzen et al., 2001), as briefly described in section 2. For each of the three approaches an illustrative differentiation of commitments is put forward in section 3 that aims at meeting the relatively low atmospheric CO2
concentration stabilisation level of 450 ppmv (approximately 550 ppmv CO2
equivalent concentration) by 2100 (section 3).2 Section 4 will then proceed to evaluate the three approaches more qualitatively and describe how the approaches can ensure environmental effectiveness, and whether they do justice to varying notions of equity. This report ends with a number of conclusions (section 5).
2 Berk and Den Elzen (2001) have shown that to meet the climate target of limiting global temperature to
less than 2 degrees above pre-historical levels, global greenhouse gas concentrations need to be stabilised at a level of 550 ppmv CO2 equivalent, congruent to a stabilisation of CO2 concentrations at
2 The FAIR model
The FAIR model is designed to quantitatively explore a range of alternative climate regimes for differentiation of future commitments in international climate policy and link these to targets for climate protection (Den Elzen et al., 2001). The FAIR model is a simulation tool with a graphic interface allowing for changing and viewing model input and output in an interactive way.
Here, version 1.1 of FAIR is used, which differs from FAIR 1.0 (Den Elzen et al., 2001) in the inclusion of the climate model meta-IMAGE 2.2 (Den Elzen and
Schaeffer, 2002a), an updated methodology of the Triptych approach (as described in this paper) and the cost model (Den Elzen and Both, 2002). For the baseline emissions scenarios, the IMAGE 2.2 implementation of the IPCC SRES emissions (IMAGE-team, 2001) are implemented. Finally, the IMAGE 2.2 regional aggregation of 17 world regions is used.3
The FAIR model consists of an integration of three models: a simple integrated climate model, a burden-sharing model for calculating regional emission allowances or permits for various options for the differentiation of future commitments, and a cost model for the calculation of emissions trading and abatement costs. More specifically:
1. Scenario construction & evaluation: here the climate impacts in terms of greenhouse gas concentration, temperature increase, rate of temperature increase and sea level rise of pre-defined or self-constructed global emissions profiles for greenhouse gases can be calculated using the simple climate assessment model, the meta-IMAGE 2.2 model (Den Elzen and Schaeffer, 2002a). The meta-meta-IMAGE 2.2 model reproduces the IMAGE 2.2 projections of the global concentrations of greenhouse gases, temperature increase and sea-level rise.4 This climate assessment model is complemented with a climate ‘attribution’ module to calculate the regional contributions to various categories of emissions, concentrations of greenhouse gases, and temperature and sea-level rise (especially developed for the evaluation of the Brazilian Proposal) (Den Elzen and Schaeffer, 2002b).
2. Differentiation of future commitments: Next, the burden-sharing model calculates regional emission allowances or permits on the basis of the three different
commitment regime approaches, which will be described in more detail in the next chapter of this report (Berk and Den Elzen, 2001; Den Elzen et al., 2001):
a. Multi-stage approach, with a gradual increase in the number of Parties involved and their level of commitment according to participation and differentiation rules, such as per capita income, per capita emissions, or contribution to global warming (including the Brazilian Proposal) (Den Elzen et al., 1999).
b. Convergence approach, in which all Parties participate in the regime, with emission allowances converging to equal per capita levels over time. Three types of convergence methodologies are included: (i) per capita Convergence
3 The 17 IMAGE 2.2 world-regions are: Canada, USA, Central America, South America (SAM), Northern Africa,
Western Africa (WAF), Eastern Africa, Southern Africa, OECD Europe (WEUR), Eastern Europe, Former USSR (CIS), Middle East, South Asia (incl. India), East Asia (incl. China), South East Asia, Oceania and Japan.
4 The IMAGE 2.2 model aims at a more thorough description of the complex, long-term dynamics of the
biosphere-climate system at a geographically explicit level (0.5o x 0.5o latitude-longitude grid)
approach, convergence towards equal per capita emission allowances. (ii) Contraction & Convergence approach with basic sustainable emission rights as suggested by the Centre of Science and Environment (CSE) (CSE, 1998). (iii) Convergence of emission intensities of the economy (emissions per unit of economic activity expressed in GDP terms, or PPP-terms).
c. Triptych approach, a sector and technology-oriented approach in which overall emission allowances are determined by different differentiation rules applying to different sectors (e.g. convergence of per capita emissions in the domestic sector, efficiency and de-carbonisation targets for the industrial and the power
generation sector).
The calculated emissions allowances (without emissions trading) of a selected climate regime form the input for the cost module (Den Elzen and Both, 2002), i.e.:
3. Emissions trading and abatement costs: this model calculates the tradable emissions permits, international permit price and abatement costs for the first commitment period, i.e. 2008-2012, and the second and third commitment periods up to 2030, with or without emissions trading. Marginal Abatement Curves (MACs) are used to this end (Den Elzen and Both, 2002).5 The default calculations in the cost model make use of the properties of the permit supply and demand curves, derived from MAC curves, in order to compute the market equilibrium permit price under different regulation schemes in any emission trading market. These schemes could include constraints on imports and exports of emissions permits, non-competitive behaviour, transaction costs associated with the use of emissions trading and less than fully efficient supply (related to the operational availability of viable CDM projects). The analysis in the present study will only focus on emissions allowances (without emissions trading), and not include an economic evaluation, i.e. calculation of emissions trading and abatement costs.
5 A marginal abatement curve (MAC) reflects the additional costs of reducing the last unit of carbon and
3 The model evaluation
The following sections describe the methodology of the three regime approaches, Multi-stage, Convergence and Triptych, in more detail. In addition, an illustrative case is described for each of the three approaches, indicating how commitments may be differentiated if a long-term stabilisation of the CO2 concentration of 450 ppmv is to be
achieved. The global fossil fuel CO2 emissions ceiling aiming at 450 ppmv is described
by the IPCC global anthropogenic CO2 emissions profile leading to a 450 ppmv CO2
concentration stabilisation target (IPCC, 1996)6, adjusted with a global land-use emissions profile based on per capita convergence towards a zero-level by 2050. The analysis of differentiation of future commitments focuses on the fossil fuel CO2
emissions only.
Furthermore, the analysis focuses on the emission allowances for the post-Kyoto period (after the first commitment period) up to 2050. Till the middle of the first commitment period (2010) all three regimes assume similar regional emissions allowances. More specifically, all Annex I regions participating in the Kyoto Protocol (all Annex I regions except the US) start immediately (2000) to meet the Kyoto targets in 2010.7 The US emissions follow an emissions profile that differs only marginally (about -5%) from the baseline emissions (here, the A1B scenario), which is consistent with the greenhouse gas intensity target of the recent Bush Climate Change Initiative.8 The non-Annex I regions follow their baseline emissions.
3.1 The Multi-stage approach
In the Multi-stage approach the number of Parties involved and the level and type of commitments is differentiated amongst Parties on the basis of (alternative)
participation and burden-sharing rules (Den Elzen et al., 1999; Gupta, 1998). This results in a system that divides countries into groups with different levels of responsibility or commitments (stages). The aim of such a system is to ensure that countries with similar circumstances in economic, developmental and environmental terms have comparable responsibilities/ commitments under the climate regime. Moreover, the system defines when their level of responsibility/ commitment change as their circumstances change. The Multi-stage approach was originally developed as a global application of the Brazilian proposal to relate Parties’ relative contribution to emission control to their relative contribution to (realised) global temperature increase.
6 More specifically we refer to the IPCC-SAR delayed response curve in Figure 2.6 (Schimel et al.,
1995), which has not been updated in the IPCC-2001 Third Assessment Report (TAR).
7After the first session of COP 6 in The Hague, where no consensus was reached, the newly elected US
government declared the Kyoto Protocol ‘fatally flawed’ and stepped out of the negotiations on the Kyoto Protocol. This US withdrawal is of major influence in reducing the environmental effectiveness of the Kyoto Protocol, the international permit price and Annex I abatement costs (see Den Elzen et al. (2002)).
8 The IMAGE 2.2 implementation of the A1B scenario is the reference scenario (IMAGE-team, 2001).
This scenario reflects high economic growth with rapid introduction of new and more efficient
technologies. The historical regional CO2 emissions from fossil fuel combustion and cement production
Here, the Brazilian approach was combined with a threshold for participation (Berk and Den Elzen, 1998; Berk and Den Elzen, 2001; Den Elzen et al., 1999). Later, the approach was extended to a Multi-stage approach, following ideas from Gupta (1998).
Methodology
In its basic form the regime starts with the selection of a long-term emission profile, which aims at stabilising the CO2 concentration at target level (in the illustrative case
450 ppmv). For each 5-year time-period, the participation rules determine who should participate and when. After 2010 (post-Kyoto): all Annex I regions (including the US) enter the emissions reduction burden regime (stage 4). For the non-Annex I regions, the approach offers a four-stage regime to differentiate commitments among regions over time:
• Stage 1. No quantitative commitments: Non-Annex I regions first follow their baseline emissions until they meet a de-carbonisation threshold.
• Stage 2. Adoption of intensity targets: The Non-Annex I regions then enter a stage in which their allowable emissions are controlled by de-carbonisation targets, defined by the rate of reduction in the carbon intensity of their economy (CO2 emissions per unit
of economic activity expressed in PPP terms). Participation is based on income and/or emission thresholds, or by a selected starting year. A region moves to stage 3 when it reaches any of the selected participation thresholds.
• Stage 3. Stabilisation of emissions: The Non-Annex I regions enter an emissions stabilisation period, in which they stabilise their absolute or per capita emissions for a number of years before actually entering the emissions reduction regime. • Stage 4. Sharing in the efforts of absolute emissions reductions: In the emission
reduction regime the burden-sharing rules then determine the emission reductions for each of the participating regions (Annex I and non-Annex I). More specifically, the required emission reduction effort is determined by subtracting the sum of the emissions of non-participating regions in stage (1), (2) and (3) from the global emissions profile. The contribution of each participating region to the overall emission reduction effort is determined by the burden-sharing rule selected (e.g. contribution to CO2 emissions or CO2-induced temperature increase (Den Elzen et
al., 2001).
Illustrative case: Multi-stage regime for stabilising CO2 concentration at 450 ppmv Reference case - In the case of stringent climate goals, developing countries have to participate early (e.g., Berk and Den Elzen (2001)). To stimulate early participation, while leaving room for an increase in emissions for economic development, the following Multi-stage approach reference case is evaluated (Table 1):
• Annex I countries (including the US) share the efforts of limiting global emissions below the fossil fuel CO2 emissions ceiling for stabilising CO2 concentration at 450
ppmv on the basis of per capita emission levels (burden-sharing rule).
• Non-Annex I countries first adopt income-differentiated de-carbonisation targets targets. More specifically, for the high-income regions (more than 5000 (PPP-corrected) 1995 US$ per cap)9, a constant de-carbonisation target of 3% per year is assumed. The middle income regions (2500-5000 US$ per cap) start with a target
9 The Purchase Power Parity (PPP) is an alternative indicator for GDP per capita, based on relative
of 2% per year after 2010, which linear increases up to 3% per year by 2030. The low-income regions (less than 2500 US$ per cap) start with a target of 1% per year after 2010, which increases up to 3% per year by 2050. In the following sensitivity analysis we analyse the impact of these assumptions.
• Non-Annex I countries then start to stabilise their emissions for ten years (at least two commitment periods) when their per capita fossil fuel CO2 emissions reach the
average world level, before joining the Annex-I countries and entering the emissions reduction regime stage 4).
The choice for a participation threshold in the emissions reduction regime (stage 4) based on world average per capita fossil fuel emissions rewards both emission reductions by the industrialised regions, as well as efforts by developing countries to control the growth in their emissions (e.g. by improving their energy efficiencies). As a rule for the differentiation of emission reduction efforts the per capita (CO2) emissions
is selected. This case would imply that the non-Annex I regions, South & Central America, Middle East and South Africa, would have to stabilise their emissions after 2010, while China and North Africa would first be allowed to continue to increase their emissions (stage 2) until 2015, and India and South Africa even until 2030. East & West Africa even remain in stage 2 with only intensity target commitments. At the same time, the emission allowances for the EU, Japan and, in particular, the US would diminish sharply (Figure 1). The use of Kyoto Mechanisms (especially international emissions trading) would reduce the abatement costs associated with achieving these emissions targets. However, the emission profile and resulting allocation of emission space will not only demand substantial efforts from developed countries, but also from developing countries.
Figure 1. Regional absolute and per capita emission allowances for the reference case under a ‘Multi-stage’ regime with a CO2 emission profile for stabilising CO2
concentration at 450 ppmv; the participation threshold of world average per capita fossil-fuel CO2 emissions where burden-sharing is based on per capita
fossil-fuel CO2 emissions. Note: WEUR: Western Europe, SAM: South America
and WAF: West Africa.
fossil fuel CO2 emissions
0 0.5 1 1.5 2 2.5 3 1990 2010 2030 2050 time (years) GtC/yr USA WEUR SAM China India WAF
fossil fuel CO2 emissions per capita
0 1 2 3 4 5 6 7 1990 2010 2030 2050 time (years) tC/cap.yr USA WEUR SAM China India WAF World
Figure 2. Model parameter and choices with their impact on the percentage change relative to the 1990-level (shown at the line bar) compared to the reference case (shown at the broad bar) in the target year 2025 under a Multi-stage regime for stabilising CO2 concentration at 450 ppmv.
Table 1. Model parameters and a set of possible choices in the Multi-stage approach for the reference case, and the low case (favourable for Annex I) and high case (favourable for non-Annex I).
Model parameters and choices Reference case Low case High case
Scenario
Population
Economic growth (GDP) A1B scenarioA1B scenario A2 scenarioA2 scenario A1T scenarioA1T scenario
Stage 1 No quantitative commitments Follow baseline
trend till 2050
Stage 2 the adoption of intensity targets
Participation threshold 2010 2010 2050
Rate of de-carbonisation
High-income non-Annex I regions Middle-income non-Annex I regions Low-income non-Annex I regions
3% after 2010 2% 2010-3% 2030 1% 2010-3% 2050 4% after 2010 4% after 2010 4% after 2010 1% after 2050 1% after 2050 1% after 2050
Stage 3 Stabilisation of emissions
Participation threshold world average per
capita fossil emis. world averagep.c. fossil emis. 75% ‘90 Annex Iper cap. income
Stabilisation period 10 years 0 year 15 years
Stage 4 Sharing in the efforts of absolute emission reductions.
Annex I (incl. USA) enter Stage 4 2010
Burden-sharing key per capita fossil fuel
emissions emissionsFossil fuel per capita tem-perature increase
Sensitivity analysis – A sensitivity analysis is performed to assess the impact of the key assumptions for the model parameters and choices on the emissions allowances. The change compared to the 1990 level for the target year 2025 are therefore calculated for the reference case, and low and high cases (Table 1). The low case corresponds to parameter settings favourable for the Annex I regions in terms of allowable emissions
%-change compared to 1990-level
-100 -80 -60 -40 -20 0
USA Western Europe
%-change comp. 1990 0 100 200 300 400 500 South America %-change comp. 1990 0 50 100 150 200 China %-change compared to 1990-level
0 200 400 600 800 1000
India West Africa
scenario Decarbonisation Burden-sharing Participation Stabilisation
compared to the reference case, like the low A2 scenario or high de-carbonisation targets. The high case corresponds to parameter settings favourable for the non-Annex I regions, like the A1T scenario and low de-carbonisation targets. The level of the broad bar indicates the outcome of the reference case in Figure 2. The line bars in the figure indicate the range of outcomes resulting from the low and high cases. More specifically, the dots at the end of each line bar represent the outcome, in which the model is run by setting only the parameter associated with the line bar on its low value (low case) or high value (high case), fixing the other parameters at their central
estimates (value for the reference case).
The first bar in the figure represents the impacts of the choice of the scenario on the allowable emissions. When the emissions of non-Annex I regions up to 2025 grow less rapidly due to lower GDP developments as in the A2 scenario or due to high adopted de-carbonisation targets (4% after 2010), fewer emissions reduction efforts of the Annex I regions are needed to remain below the global emissions profile. Visa versa, high GDP growth or low de-carbonisation targets would lead to high emissions reduction efforts for the Annex I regions. Figure 2 shows that the emissions reduction efforts compared to the 1990 level vary from 0 to 55 per cent for the USA and from 10 to 40 per cent for Western Europe with the various scenario developments.
Furthermore, the increases in emission allowances for the non-Annex I vary
significantly for various baselines. Baseline scenarios can therefore be concluded to have a strong impact on the outcomes in the target year 2025. Lower baselines lead to lower Annex I emissions reductions. Our reference A1B scenario is found at the higher end of the range.
The de-carbonisation targets (stage 2) and the participation thresholds also have a strong impact on the outcomes, but in general, lead to the opposite situation of higher Annex I reductions. Participation based on 75% of 1990 Annex I per capita income (ca. US$10,800), would delay the participation of the major developing countries like China and India. These regions would only start participating after the middle of this century. This would result in non-Annex I CO2 emissions that are too high, and the
Annex B emissions allowances would go down to zero (Figure 2). Thus, major developing countries like China and India will have to participate within a number of decades at much lower levels of per capita income than for the average 1990 Annex B country (see also Berk and Den Elzen (2001)).
The impact of the stabilisation time period and the burden-sharing key is less important. These parameters affect the emission allowances of the regions participating in the reduction regime, the Annex I regions, as well as the middle- income non-Annex I regions participating in the stabilisation period, such as China and South America. Choices in the burden-sharing rule only affect the outcomes of the Annex I regions. Sharing the emissions reduction effort proportional to their fossil fuel emissions
contribution (burden–sharing key) would favour Annex I countries with high per capita emissions such as the US, whereas proportional to their per capita contribution to (CO2-induced) temperature increase (Brazilian Proposal) would have the opposite
effect.
3.2 Per capita Convergence approach
An alternative approach that would represent a major shift from the present Protocol approach is the so-called ‘Contraction & Convergence’ approach (Meyer, 2000). Instead of focusing on the question of how to share the emission reduction burden, it starts from the assumption that the atmosphere is a global common to which all are
equally entitled. It defines emissions rights on the basis of a convergence of per capita emissions under a contracting global emission profile. In the per capita Convergence approach all Parties immediately participate in the emissions-control regime (in the post-Kyoto period), with per capita emission rights/permits converging towards equal levels over time.
Methodology
The regime adheres to the following format. Similar as in the Multi-stage approach, first, a global atmospheric GHG concentration target is selected, which creates a long-term global emissions profile or global GHG emissions contraction budget (like the IPCC stabilisation scenarios). This budget is then allocated to the regions/countries so as to have the per-capita emissions converge from their diverse values to a global average (Meyer, 2000). More specifically, all shares converge from actual proportions in emissions to shares based on the distribution of population in the convergence year. The actual degree of convergence in per capita emission allocated in each year depends on the (potentially capped) population and the rate of convergence selected. The rate of convergence determines whether most of the per capita convergence takes place at the beginning or near the end of the convergence period. The reference case assumes a linear convergence, corresponding with an equal per capita convergence over time. The approach can be combined with the option of applying a cut-off year after which population growth is no longer accounted for.10
In our illustrative case, the approach is applied with no cut-off year, and the population projections of the baseline A1B scenario.
Illustrative case: Convergence regime for stabilising CO2 concentration at 450 ppmv Reference case - The FAIR model is used to analyse the regional distribution of
emission allowances resulting from a linear convergence of per capita CO2 between
2010 and 2050 with the 450 ppmv stabilisation profile (reference case) (Figure 3). Convergence in per capita emission allowances will imply a strong reduction in allowable emissions after the Kyoto Protocol for Annex I regions, in particular, for the US, Japan and Western Europe (around 60-65% compared to 1990 levels by 2040). At the same time, for stabilising at 450 ppmv, there is only limited space for Non-Annex I regions to increase their per capita emissions. In fact per capita emission allowances of Central & South America already decrease after 2010. China has to stabilise its per capita emissions in the second and third commitment period (up to 2020), after which it starts to decline. India is allowed to increase its per capita emissions, although these remain below the per capita baseline emissions. In some developing regions, i.e. East and West Africa, allowed emission levels exceed the baseline levels, resulting in excess emission permits (hot air).11
10 Note there is no assumption being made about what populations will or should be beyond the cut-off
year; merely that population growth after that year should not accrue additional emissions rights. It might be necessary to adopt some such cap criterion, as otherwise the system would give national governments a positive incentive to encourage their populations to grow to obtain an increasing share of emissions allowances.
11 Hot air is defined as the positive difference between the assigned and actual emissions under
Figure 3. Regional absolute and per capita emission allowances for the reference case under a Convergence regime between 2010 and 2050 and an emission profile for stabilising CO2 concentrations at 450 ppmv.
Sensitivity analysis – A similar sensitivity analysis as for the Multi-stage approach is conducted here for the Convergence regime to assess the impact of the key
assumptions for the model parameters (Table 2) on the emission allowances (see Figure 4). Figure 4 shows the outcome of the reference case with the broad bars, and the range of outcomes for the low and high cases with the line bars. Figure 4 presents the main factors of the emission allowances as the convergence year (duration of transition period) and the rate of convergence, showing the highest uncertainty ranges. A long transition period (late date of convergence) is favourable for the developing countries since it results in less (cumulative) emission permits over a defined period of time. Assuming international emission trading, it can be argued that the transition period may be rather short because real emissions can be adjusted over a longer period. However, a short period will result in the need for extensive emissions trading and large capital flows and may, thus, not be politically acceptable. The rate of
convergence, the other main factor, has a similar effect as the transition period. A non-linear convergence at a rate of three (high case) would imply that most of the
convergence takes places at the beginning of the convergence of the convergence period, leading to high emissions reductions for the USA and Western Europe. A linear convergence (low and reference case) or a non-linear convergence at a rate of more than five would lead to the opposite effect.
Accounting for a cap on population growth (population cut-off year) for the calculation of the emission allowances also affects the outcomes, especially those of the non-Annex I regions (Figure 4). The introductions of a population cap is a disadvantage for countries, which exhibit a fast-growing population over the period 2000-2025, such as the African regions, but is favourable for China and also the OECD regions.
fossil fuel CO2 emissions
0 0.5 1 1.5 2 2.5 3 1990 2010 2030 2050 time (years) GtC/yr USA WEUR SAM China India WAF
fossil fuel CO2 emissions per capita
0 1 2 3 4 5 6 7 1990 2010 2030 2050 time (years) tC/cap.yr USA WEUR SAM China India WAF World
Figure 4. Model parameter and choices with their impact on the percentage change relative to the 1990-level (shown at the line bar) compared to the reference case (shown at the broad bar) in the target year 2025 under a Convergence regime for stabilising CO2 concentration at 450 ppmv.
Table 2. Model parameters and a set of possible choices in the Convergence approach for the reference case, and the low case (favourable for Annex I) and high case (favourable for non-Annex I).
Model parameters and choices Reference case Low case High case
General
Population A1B scenario A2 scenario A1B scenario
Cut-off year population Not applied Cut-of (2000) Not applied
Convergence
Year of convergence 2050 2075 2030
Rate of convergence linear linear Non-linear
Rate = 3
3.3 Triptych approach
The Triptych approach is a sector- and technology-oriented approach to the
differentiation of future commitments, which allows different national circumstances to be taken into account. The approach has been used for supporting decision-making on internal target differentiation in the European Union both prior to and after Kyoto (COP-3) (Blok et al., 1997; Phylipsen et al., 1998). In principle, the Triptych approach is bottom-up in character, but it can also be combined with specific emission targets (as illustrated below). A global application of the Triptych approach has been explored in two studies (Groenenberg et al. (2001), Den Elzen et al. (1999)). Here an updated Triptych approach is presented, which deals with a number of shortcomings in both initial global applications. For example, the growth in industrial production now accounts for structural economic sector changes. In particular this updated approach tries to incorporate some widely supported notions in the climate debate; in particular
%-change compared to 1990-level
-60 -50 -40 -30 -20 -10 0
USA Western Europe
%-change comp. 1990 0 50 100 150 200 250 300 South America %-change compared to 1990-level
0 200 400 600 800 1000 1200
India West Africa
scenario conv. year Cap. pop. Rate conv. %-change comp. 1990 0 20 40 60 80 100 China
the necessity of technological improvement, the transition to low carbon energy and the desirability of narrowing per capita emissions differences. The design of the regime aims at defining criteria and rules for differentiation future commitments for all regions in a consistent and transparent way.
Methodology
In the Triptych approach three categories or sectors of emission sources are distinguished:
1. the internationally-oriented energy-intensive industry; 2. the domestic sectors;
3. the power-producing sector;
The selection of the Triptych categories is based two considerations: (i) different parts of national economies require different approaches to achieve a fair distribution of efforts, and (ii) national circumstances (standards of living, resources and economic structure) vary widely. Different criteria are used for each sector to calculate partial emission allowances. These add up to national emission allowances. In the following the three sectors in the Triptych approach are described in more detail, including baseline assumptions and criteria for the calculation of emissions allowances. 1. The internationally oriented energy-intensive industry
a. Description of the sector. The internationally oriented energy-intensive industry covers internationally oriented industries, where competitiveness is determined by the costs of energy and by energy efficiency. In the Triptych approach the sector covers the following sub-sectors: iron and steel, chemicals, pulp and paper, non-metallic minerals, non-ferrous metals. The energy transformation sector includes petroleum refining, manufacture of solid fuels, coal mining, oil and gas extraction and any energy transformation other than power production. Compared to other economic sectors, this part of industry, generally has a relatively high-energy use per value added and in most countries also high CO2 per value added ratio. Countries and regions with a high share
of heavy industry will therefore have relatively higher CO2 emissions/units of GDP
than countries that focus primarily on light industry and services. The international character of this sector implies that countries lacking sizeable energy-intensive industries themselves import goods from other countries and thus indirectly benefit from other countries’ efforts in this sector. Apart from international specialisation, the share of heavy industry in the overall economy is generally related to countries’ levels of development. Initially, at a low level of development its share is low, but with increasing development its share tends to increase at the expense of primary sectors (agriculture, mining). Only at later stages of development the share of energy-intensive industry in total economy tends to decrease again with the growth of the share of the service sector in the economy. For these reasons, countries should not necessarily be penalised for relatively high emissions from this sector.
b. Calculation of emissions allowances. The regional allowable CO2 emissions are
calculated on the basis of (i) a realistic growth of production in the energy-intensive industry, (ii) a convergence of energy intensity (energy used per unit of production) and (iii) an achievable reduction of carbon intensity of the energy consumption (carbon emissions per unit of energy use).
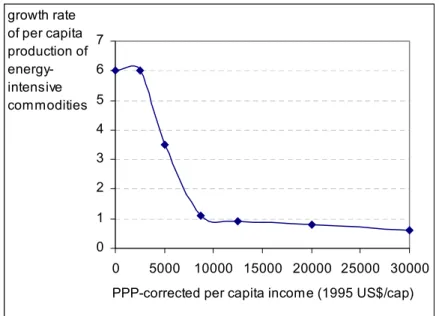
(i) Growth in production. Projections for future physical growth in the energy-intensive industry are estimated on the basis on a detailed study of recent (mid-1980s to mid-1990s) historical trends in per capita physical production in various countries (Groenenberg et al., 2002). Growth rates are differentiated amongst countries on the basis of five income groups. Based on these data a continuous curve is composed, which represents differentiated growth rates of per capita physical production in the energy-intensive industry as a function of per capita PPP income (in PPP-corrected 1995 US$ per cap, see Appendix I.1), as used here for the calculations (see Figure 5). Growth rates of per capita production in the energy-intensive industry are high for the low-income regions. For the middle income regions, the growth-rates show a
decreasing trend in future, when income increases. For the high-income regions, growth rates are already low, and these converge to even lower growth rates when income increases.
(ii) Energy intensity of production. For the energy-intensity levels it is assumed that there is a world-wide convergence in energy-efficiency levels of all regions over time. A convenient indicator for the energy efficiency is the Energy Efficiency Indicator (EEI) (Phylipsen et al., 1998). This index is defined as the ratio between the specific energy consumption (SEC) (energy consumption per tonne of product) for each region, divided by a reference SEC level. The reference SEC is equal to the SEC of the best present practices or the best available technologies. For example, an EEI of 105 in a region means that the SEC on average is 5% higher than the reference level, so that 5% of energy could be saved at the given sector structure12 by implementing the reference level technology. Here, instead of a single product, the SEC of a package of energy-intensive commodities is used. This leads to aggregated EEIs for all regions, each representing a relative measure of the average efficiency of the energy-intensive industry in that specific country/region (Groenenberg et al., 2002).
If aggregated EEIs for all regions converge to the same level, the required rate of energy efficiency improvement (eff) (in %/year) can be calculated from the regional actual EEI (EEIact), the convergence level of the EEI (EEIconv) and convergence
time-period (tpconv). In formulas:
[
tpconv]
act
conv EEI
EEI
eff =100.0*1.0−( / ) (1)
(iii) Carbon intensity of energy use. This indictor represents two different dimensions of a change in the energy supply side: the shift in the relative use of different fossil fuel types (coal, oil, natural gas), and the change in the share of non-fossil fuels (nuclear, hydro-power, wind, solar, biomass). Here, a constant de-carbonisation rate (reduction of carbon intensity of the energy consumption) is assumed, which is the same for all regions.
12 The sector structure can be defined as being determined by the mix of activities or products within a
sector. This mix may well influence the reference specific energy consumption level (Phylipsen et al., 1998).
Figure 5. The overall annual growth rates of per capita commodity production for the energy intensive industry as a function of the per capita income (1995 US$ PPP). 2. The domestic sector
a. Description of the sector. The domestic sector includes the residential sector (households), the commercial sector, transportation, light industry and agriculture. b. Calculation of emissions allowances. The allowable CO2 emissions in the domestic
sectors are assumed to be primarily related to population size, as they are determined by the number of people that live in dwellings, have a workplace and need transport, etc. Therefore a per capita convergence approach is assumed appropriate here. For the domestic sectors no baseline growth assumptions are made. Instead, the regional domestic CO2 emission allowance per capita converges to the world-wide average,
consistent with a specific stabilisation level. 3. The power-producing sector
a. Description of the sector. The power-producing sector is treated separately because specific CO2 emissions from power production vary to a large extent, due to large
differences in the share of nuclear power and renewables and in the fuel mix in fossil fuel fired power plants. The potential for cutting CO2 emissions emanating from this
sector differs accordingly. Therefore fuel mix in power generation is an important national circumstance to take account of in a differentiation of commitments. In the analysis this sector includes both centralised and decentralised electricity production. b. Calculation of emissions allowances. The allowable CO2 emissions from the power
sector are defined by (i) a realistic growth in the electricity consumption and (ii) a convergence in carbon intensity of energy consumption (CO2 emissions per unit of
energy consumption).
(i) Growth in energy consumption. Regarding the growth in the energy supply of the power sector it is assumed that this growth can be estimated by the weighted sum of the emissions growth in the energy-intensive industry and the domestic sectors. This assumption implies that domestic electricity consumption will converge to equal per capita levels world-wide. Furthermore, the share of the two sectors in power
0 1 2 3 4 5 6 7 0 5000 10000 15000 20000 25000 30000 PPP-corrected per capita income (1995 US$/cap) growth rate of per capita production of energy-intensive commodities
consumption is assumed to remain constant in future, and is based on their present (1995) shares in total final energy consumption (IEA, 1997a; IEA, 1997b). This is a rather simplistic assumptions, which possibly needs improvement.
(ii) Carbon intensity of energy consumption. For the change in the carbon intensity of electricity a convergence of carbon intensities of the electricity produced to low carbon intensity levels is assumed. This low intensity level is calculated based on the share of renewables and gas-based capacity with high conversion efficiency in total electricity production in the convergence year.
Illustrative case: Triptych regime for stabilising CO2 concentration at 450 ppmv Reference case - The FAIR 1.1 model is used to explore the implications of stabilising CO2 concentrations at 450 ppmv. Table 3 lists the parameter values for the reference
case as used in the quantitative illustration of the Triptych approach. A single convergence end-year, i.e. 2050 is used here for the three above-mentioned types of convergence, i.e. convergence in energy efficiency in energy-intensive industry, convergence in the per capita domestic emissions and convergence in carbon intensity of the power producing sector. The starting-year of convergence differs per region. For the Annex I regions (excluding the US) the convergence starts immediately in 2000, aiming at achieving the Kyoto targets, whereas for the non-Annex I regions and the US the convergence starts ten years later (2010). Until then they follow baseline trends for sectoral emissions.
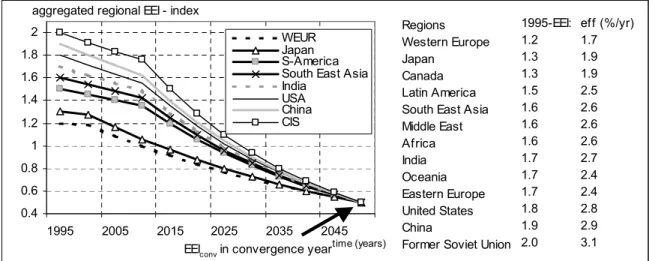
The energy-intensive industry – The illustrative calculations for the reference case assume that the aggregated EEI index of all regions ultimately converges at a level of 0.5 by the year 2050 (see Figure 6). This final convergence level means that energy-intensive commodities will be produced at half the current reference specific energy consumption levels (the energy consumption levels under best practices). Indications exist that for a set of energy-intensive commodities energy requirements theoretically13 could be lowered by almost two thirds (Groenenberg, 2002). The yearly rates of energy efficiency improvements (in %/year) over the convergence period are calculated based on Equation 1, as summarised in the legend of Figure 6. These improvement rates vary from 1.7-1.9% for Western Europe and Japan, about 2.5% for South America, India, Eastern Europe and the African regions up to 3% for China, the Former Soviet Union and US. In addition to this improvement in energy efficiency, a de-carbonisation rate of the industrial energy consumption of 0.25% per year for all regions is assumed here.
Table 3. Model parameters in the Triptych approach with a set of possible choices for the reference case, the low case (favourable for Annex I) and high case
(favourable for non-Annex I).
Model parameters and choices Reference case Low case High case
General Population Economic growth (GDP) A1B scenario A1B scenario A2 scenario A2 scenario A1B scen. A1B scen.
Energy-intensive industry sector
Growth rates of per capita production of energy-intensive commodities
See Figure 5 Figure 5 Figure 5
Year of convergence Energy Efficiency Index 2050 2075 2030
Level of convergence Energy Efficiency Index 0.5 0.7 0.3
Domestic sectors
Year of convergence of per capita emissions 2050 2075 2030
Power-producing sector
Year of convergence emissions intensity 2050 2075 2030
Level of convergence emissions intensity 31 gC/ kWh 100gC/kWh 15 gC/kWh
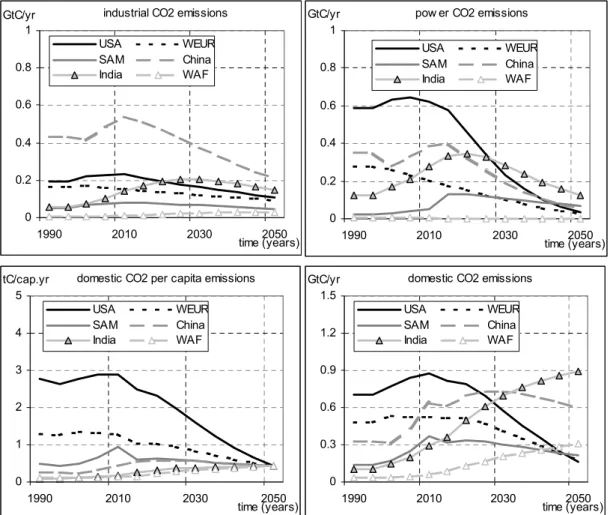
The resulting emissions in the energy-intensive industry show a decreasing trend in all Annex-I regions after 2000, mainly as a result of the technological convergence in the energy efficiency. For the non-Annex I regions the emissions first increase till 2020 (up to about 3-4 times 1995 emission levels), but then, these emissions also start to decline. This decline in the non-Annex I regions results from the decreasing per capita growth rates in the energy-intensive industry with increasing income, in combination with the high energy efficiency improvements after 2010.
Power producing sector – The convergence level of the carbon intensity in the power sector (CO2 emissions per unit of electricity production) is based on a 60% share of
renewables in power generation in the convergence year 2050 (like in projections by Johansson et al. (1993)), complemented with gas-based capacity with a high
conversion efficiency (i.e. 70%), or alternatively, an equivalent CO2 capture and
storage for fossil fuel powered electricity production. This leads to a final carbon intensity level of 31 gC/kWh in 2050. This convergence implies high yearly de-carbonisation rates of 3 to 4% in China, India and Southeast Asia, but also in the US (3%). Lower de-carbonisation rates are found in Western Europe, Japan (about 2%) and Canada (about 1%). In this sector emissions start to decline after 2000 for most of the Annex I regions, whereas for the non-Annex I regions this decrease starts 10 to 20 years later.
Figure 6. The convergence in the aggregated Energy Efficiency Indices (EEIs) by 2050 (reference case) to half of the current reference level. The legend shows the 1995 Aggregated Energy Efficiency Indices (EEIs) at the regional level (based on Groenenberg (2002)) and the calculated yearly energy efficiency improvements in %/year for the convergence period.
Domestic sectors – For this 450 ppmv case a linear convergence in the per capita domestic emissions between 2000 and 2050 (Annex I regions without the US), or 2010 and 2050 (non-Annex I regions and the US) is assumed. This is combined with a 50% reduction of the global domestic per capita emissions in the convergence year
compared to 2000 levels.
From bottom up to top down approach. The assumptions made for the three sectors result in total CO2 emissions that remain below the global CO2 emissions ceiling
leading to the 450 ppmv CO2 concentration target. Therefore, the bottom-up approach
for the domestic sector is adjusted here into a top-down approach. In this case the convergence in domestic per capita emissions by 2050 accommodates the emission space available for domestic emissions under the global domestic emission ceiling. This domestic emissions emission ceiling is equal to the difference between the ceiling for global CO2 emissions for stabilisation at 450ppmv and the sum of the emissions
allocated to the power and energy-intensive industry sector (see Figure 7). This top-down approach results in more domestic emissions allowances till 2030 compared to domestic allowances under the bottom-up approach. Furthermore, the top-down approach provides a better guarantee for environmental effectiveness (the total emissions are equal to the emissions ceiling aiming at the 450 ppmv target), and also enables us here to compare the results of the Triptych approach to the other top-down approaches.
aggregated regional EEI - index
0.4 0.6 0.8 1 1.2 1.4 1.6 1.8 2 1995 2005 2015 2025 2035 2045 time (years) WEUR Japan S-America South East Asia India
USA China CIS
EEIconv in convergence year
Regions Western Europe Japan
Canada Latin America South East Asia Middle East Africa India Oceania Eastern Europe United States China
Former Soviet Union
1995-EEI: 1.2 1.3 1.3 1.5 1.6 1.6 1.6 1.7 1.7 1.7 1.8 1.9 2.0 eff (%/yr) 1.7 1.9 1.9 2.5 2.6 2.6 2.6 2.7 2.4 2.4 2.8 2.9 3.1
industrial CO2 emissions 0 0.2 0.4 0.6 0.8 1 1990 2010 2030 2050 time (years) GtC/yr USA WEUR SAM China India WAF
pow er CO2 emissions
0 0.2 0.4 0.6 0.8 1 1990 2010 2030 2050 time (years) GtC/yr USA WEUR SAM China India WAF
domestic CO2 emissions
0 0.3 0.6 0.9 1.2 1.5 1990 2010 2030 2050 time (years) GtC/yr USA WEUR SAM China India WAF
domestic CO2 per capita emissions
0 1 2 3 4 5 1990 2010 2030 2050 time (years) tC/cap.yr USA WEUR SAM China India WAF
Figure 7. Regional sector emissions (domestic, industrial and power-producing sector) and the per capita domestic emissions for the reference case resulting from a Triptych approach aiming at stabilising CO2 concentrations at 450 ppmv (IPCC-1995 SAR 450
ppmv stabilisation profile).
Figure 8. Regional total and per capita CO2 emissions for the reference case resulting
from a Triptych approach aiming at stabilising CO2 concentrations at 450 ppmv. fossil fuel CO2 emissions
0 0.5 1 1.5 2 2.5 3 1990 2010 2030 2050 time (years) GtC/yr USA WEUR SAM China India WAF
fossil fuel CO2 emissions per capita
0 1 2 3 4 5 6 7 1990 2010 2030 2050 time (years) tC/cap.yr USA WEUR SAM China India WAF World
Concluding, comparison of the global emissions level in this quantitative illustration of the Triptych approach with the reference scenarios seems to indicate that strict
measures are needed to ultimately curb emissions to a sufficiently low level. The distribution of efforts over the sectors much depends on the precise specification of the parameters (see Table 3) in the approach. High (1.7 – 3%) but not unfeasible rates of energy efficiency improvement are required in the energy-intensive industry, together with strong decreases in the carbon intensity of electricity production (1-4%). These rates are comparable to what global energy models assume to be feasible (Nakicenovic et al., 2000; Van Vuuren and de Vries, 2001). Domestic per capita emission reduction required for a 450 ppmv stabilisation scenario is also significant (-50% by 2050 compared to present levels), but this order of magnitude is also achievable technically and economically according to existing model calculations (see also Van Vuuren and de Vries (2001)).
Sensitivity analysis – A sensitivity analysis is performed to assess the impact of model parameters and choices on the emissions allowances in terms of the percentage change relative to the 1990-level in the target-year 2025. The column bars show the outcome for the reference case, whereas the line bars (the dots at the end) indicate the range of outcomes resulting from varying one model parameter (associated with the line bar), at its low or high value (see Table 3). The other parameters are fixed at their central estimates (reference case). The methodology is similar as the one described in the sensitivity analysis of section 3.1. The Figure shows the sensitivity of the outcome for the various parameters. In particular column 2 in the Figure shows that the emissions allowances in the target year 2025 much depends on the assumptions with respect to the convergence year. The range of outcomes for the US for example varies from no emissions reduction compared to their 1990 levels (convergence year 2075), to an almost 50% reduction (convergence year 2030). A similar pattern is found for other OECD regions.
Figure 9. Model parameter and choices with their impact on the percentage change relative to the 1990-level (shown at the line bar) compared to the reference case (shown at the broad bar) in the target year 2025 under a Triptych regime for stabilising CO2 concentration at 450 ppmv.
%-change compared to 1990-level
-50 -40 -30 -20 -10 0
USA Western Europe
scenario conv. year CI elec conv EEI-conv %-change comp. 1990 0 50 100 150 200 250 300 South America %-change compared to 1990-level
0 200 400 600 800 1000
India West Africa
%-change com. 1990 0 20 40 60 80 100 China
Scenario assumptions other than the A1B scenario, like the A2 scenario in this analysis, also affect the outcomes, but its impact on the emissions allowances is less compared to the impact of the convergence year. Except for China, where a higher population growth and a lower economic growth as in the A2 scenario lead to higher industrial and power emission allowances.
The impact of the convergence level of the energy efficiency in the energy-intensive industry and the emissions intensity for the power sector on the emissions allowance in the target-year 2025 seems small compared to the impact of the
convergence year. Groenenberg (2002) will analyse the impact of various assumptions for these parameters on the emissions allowances in more detail.
Overview of all illustrative cases for stabilising CO2 concentration at 450 ppmv
Figure 10 summarises the emissions allowances as percentage change compared to the 1990 levels for the three approaches for the target year 2025. This figure presents the outcomes for the reference case in the bars. The uncertainty ranges resulting from the outcomes of the overall low and high cases (i.e. values for all choices or parameters are now set for the low and high cases) are indicated with line bars. In order to compare the results with the baseline developments, the figure also shows the change compared to the 1990 levels for these developments. Figure 10 is primarily meant to illustrate the methodologies. It is not the objective to reach any conclusions about what type of regime would be preferred for the various regions. The outcomes are dependent on the choice of the target year as 2025 (medium long-term) and the selected CO2
concentration stabilisation level of 450 ppmv (stringent climate target). Any conclusion draw in this section should therefore be seen in the context of these conditions.
Figure 10 clearly shows the broad range of possible outcomes for the three climate regimes as a consequence of the basic assumptions on model parameters and of the precise quantification of some more-or-less subjective choices in the approaches, such as convergence terms.
For the reference case, the Multi-stage approach shows the highest emissions reductions for the Annex I regions in 202, compared to the results of the other two regimes, and the lowest efforts for the non-Annex I regions to control their emissions. In the target year 2025 most of the non-Annex I regions only have de-carbonisation or stabilisation commitments (stage 2 or 3). This does not generally hold. For the low case, i.e. when the non-Annex I regions follow the low A2 baseline emissions and high adopted de-carbonisation targets, the Annex I emissions reductions could turn out even lower than the results of the other two regimes. For the high case, the non-Annex I regions have no quantitative commitments (stage 1) and follow their baseline emissions (low de-carbonisation targets). These regions participate in the emissions reduction regime upon reaching 75% of 1990 Annex I per capita income, which leads to high Annex I emissions reductions of 80-95% below 1990 levels. These extreme levels are not found at the high cases for the Convergence and Triptych approach. The Convergence approach is especially attractive for the least developed countries, i.e. West and East Africa, where allowed emission levels could exceed baseline emission levels, resulting in surplus emissions. However, the level of surplus allowances is dependent on baseline projections, with stringent stabilisation targets (e.g. 450 ppmv) likely to occur only for a limited time period. For the Triptych and Multi-stage approaches, these surplus emissions allowances will never occur as a result
of the basic assumptions underlying these approaches. For the reference case, the Convergence approach results in 20-35% emissions reduction compared to 1990 levels for the Annex I regions in the target year 2025, while non-Annex I regions can still increase their emissions.
The Triptych approach is favourable to the Annex I regions with relative low energy intensities, such as Japan and Western Europe, but leads to ‘moderate’ emission reductions (25-35% compared to 1990 level) for the economies in transition. For the non-Annex I regions, the Triptych approach results in somewhat smaller growth objectives, especially for the regions with high emission intensities such as China and East Asia.
Figure 10. Percentage change compared to the 1990 levels for the reference case and the uncertainty range for the three illustrative climate regimes: Multi-stage, Convergence and Triptych, as well as the baseline scenario for the target year 2025 for the Annex I, middle & high income non-Annex I and low income Annex I regions.
%-change compared to 1990-level
-100 -75 -50 -25 0 25 50 75 100
Canada USA W. Europe E. Europe FSU Oceania Japan Annex I
%-change compared to 1990-level
0 300 600 900 1200 1500
North Africa West Africa India East Asia
low-income non-Annex I %-change compared to 1990-level
0 100 200 300 400 500 600
Central America South America South Africa China E. Asia Multi-stage Convergence Triptych Baseline middle/high-income non-Annex I
4 Evaluation of the three climate regimes
This section describes a qualitatively evaluation of the three climate regimes on criteria of environmental effectiveness, economic efficiency, equity as well as criteria of flexibility, simplicity and operational requirements, to assess their employability as schemes in negotiations on future commitments (see Table 4) (e.g., Berk et al. (2002a; 2002b)).
Environmental effectiveness
Since the primary objective of the Climate Convention is stabilisation of
concentrations at a level and within a time frame to avoid dangerous interference with the climate system (Article 2) (UNFCCC, 1992) it is obvious that any approach to the differentiation of commitments should meet this objective. In principle, environmental effectiveness is best secured if a differentiation regime is based on a global emission ceiling and all countries participate in binding quantitative emission limitations, provided sufficient compliance is achieved. Therefore, the top-down approaches, Convergence and Multi-stage when combined with a global emission ceiling provide a better guarantee for environmental effectiveness than the bottom up Triptych approach. However, if the Triptych approach is used in combination with a predefined global emission, as illustrated here, all three climate regimes secure environmental
effectiveness.
For the Multi-stage approach there is, however, no full guarantee for
environmental effectiveness, since high economic growth in countries with only low de-carbonisation commitments or even no quantitative commitments may lead to overshooting a predefined global emission ceiling (see Berk and Den Elzen (2001)). Environmental effectiveness will depend on participation rules that secure a
sufficiently broadening and deepening of the developing country participation in global emission control.
Economic efficiency
The adoption of the Kyoto Mechanisms (KMs) in the Kyoto Protocol has drastically changed the context for discussing the economic efficiency of various regimes for burden sharing in global greenhouse gas control. In principle, their introduction would offer the possibility of attaining a high level of economic efficiency regardless of the differentiation arrangement. Even emission reduction options in countries without emission targets can then be used via the Clean Development Mechanism (Berk et al., 2002a). A per capita convergence regime offers the best opportunities to explore the cost-reducing options as all parties can fully participate in global emission trading. In a Multi-stage approach as well as in the Triptych approach countries adopting
de-carbonisation and or efficiency targets may also join emission trading as far as their improvements exceed their targets. For countries without any quantitative targets there remains the option of CDM projects. However, under a Multi-stage approach there may be leakage of greenhouse gas emissions to developing countries, and CDM increases transaction costs.
Equity
Apart from the principle of environmental effectiveness the Climate Convention demands that developed countries take the lead in climate mitigation and that national
priorities, objectives and circumstances be taken into account (Article 4.1), in
particular needs and circumstances of developing countries (Article 3.2). Here is where the debate on equity comes in. In the literature different categorisations of equity principles can be found (Banuri et al., 1996; Rose et al., 1998). In reviewing the most relevant elements for a widely accepted approach to burden differentiation in future international climate negotiations in recent studies, the most equity and fairness principles in distributing efforts are summarised as (Ringius et al., 2000):
• Guilt / responsibility14: costs should be distributed in proportion to a country’s
share of responsibility for causing the problem;
• Capacity: costs should be distributed in proportion to a country’s ability to pay; • Need: all individuals have equal rights to pollution permits, with a minimum to
secure basis human rights, including a reasonable standard of living.
The Multi-stage and Triptych approach are based on more than one equity principle. The main equity principle behind the Multi-stage approach is the responsibility principle, but by defining one or more thresholds for different levels of participation, the approach also accounts for the considerations of need (for development) and capacity to act. The Triptych approach is a mixed approach, which encompasses both the principle of capacity through its technological orientation and the principle of need by adopting a per capita convergence approach for domestic sector emissions. The Convergence approach is mainly based on the egalitarian equity/ need principle, although to some extent it also accounts somewhat for considerations of capacities by allowing for a transition period.
Table 4. Evaluation of different approaches to differentiation of future commitments (Berk et al., 2002a)
Dimensions Multi-stage Convergence Triptych
Environmental effectiveness +(++)* ++ - (++)*
Economic efficiency +/- ++ ++**
Coverage of equity principles + - +
Level of flexibility + - ++
Level of simplicity & operational requirements
+/- +
-Legend: ++ = very good; + = good, +/- = fair; - = moderate; -- = bad *) : ++ if used in combination with a global emission ceiling **) : if all countries participate immediately
Flexibility
Flexibility of a regime approach is important to take account of special circumstances of certain (groups of) countries. The Triptych approach offers the most flexibility, while the top-down per capita convergence approach offers the least flexibility (except for differences in per capita emissions levels). The flexibility of the Multi-Stage approach is based on the differentiation and participation rules. However the
approaches, Convergence and Multi-stage could also account for special circumstances by adding correction factors.
14 Ringius et al. (2000) use the term ‘guilt’. Since this is a highly moralistic term and the term