2
Summary
The scenario study Welfare, Prosperity and the Human Environment (WLO1) forecasts
long-term developments on four topics, climate being one of them. The study’s climate scenarios have been constructed taking into account various ways of international collaboration on the climate issue around the world. The WLO climate scenarios are characterised by a CO2
emission budget for the rest of the century and an associated CO2 emission reduction target.
Under the High reference scenario, the world prospers and manages to agree on a low CO2
emission budget and is able to achieve large CO2 emission reductions. Under the Low
reference scenario, far less CO2 emission reduction is achieved. In addition to these High and
Low scenarios, other WLO scenarios comprise an analysis of what happens to CO2 emission
reduction if the world manages to stay at or below a global temperature increase of two degrees Celsius. The way these scenarios have been constructed has implications for how the benefits of CO2 emission reductions are addressed and how they can be valued in
cost-benefit analysis (CBA).
To achieve the European share of the required CO2 emission reduction, under each of the
WLO climate scenarios, national and European climate policies have to be implemented. Within each scenario, climate policy is assumed to be as efficient as possible; the required emissions reduction is realised at the lowest possible cost to society, in a broad welfare economic sense. This involves a so-called efficient CO2 price. The assumption is that the
implemented national and European climate policies all have a positive CBA balance, given the efficient CO2 price. The CO2 price is determined in such a way that the resulting CO2
emission reduction is exactly what is needed, under the scenario. This implies that, under the High reference scenario, more policy measures will be taken than under the Low scenario, but fewer than under the Two degrees scenario.
The WLO study only presents the prices set in the EU Emissions Trading System (EU ETS), but these do not reflect the price level at which a reduction in CO2 emissions becomes
efficient. In this paper, we further examine the details of efficient CO2 prices. The information
is intended for use in CBAs and may help determine what an efficient climate policy means for decisions taken by the Dutch Government. In this regard, this paper complements the WLO scenarios.
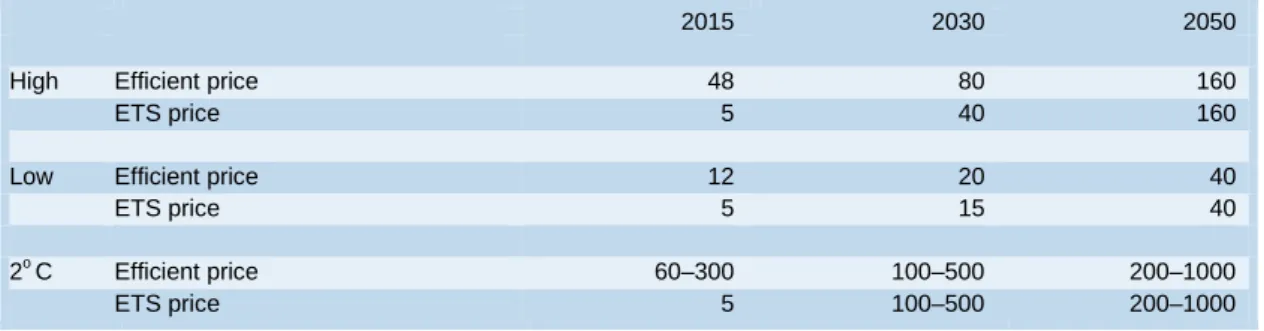
To determine a given measure’s CO2 benefits for use in CBAs, the efficient CO2 prices, listed in
Table S1, provide the relevant valuation. The development of the efficient price shows, for the period between now and 2050, the CO2 prices required to achieve the cumulative CO2
reduction in a scenario at the lowest possible cost. When using these WLO scenarios, it is not necessary to take any possible waterbed effects into account, provided efficient prices are used.
3
Table S1 Efficient prices and ETS prices of 1 tonne CO2 (in euros) used in the High and Low
scenarios and in the two-degree scenario.
2015 2030 2050
High Efficient price 48 80 160
ETS price 5 40 160
Low Efficient price 12 20 40
ETS price 5 15 40
2oC Efficient price 60–300 100–500 200–1000
ETS price 5 100–500 200–1000
The applicable CO2 prices and ways of dealing with the waterbed effect are important issues
in determining the effects of climate measures. However, the manner in which CBAs for climate and energy policies should be drawn up is beyond the scope of this paper. The guidelines of the General Guidance for cost-benefit analyses (Romijn and Renes, 2013; Ministry of Finance, 2013) need to be worked out in a sector specific handbook for climate and energy policies.
In addition, the WLO climate scenarios have been drawn up on the basis of the current air quality policy, of which further tightening is conceivable.2 A stricter air quality policy often
also reduces CO2 emissions, therefore leading to lower efficient CO2 prices. At the same time,
this implies higher prices for emissions of NOx, SO2 and particulates. As a result, in CBAs for
climate or energy policies where air quality is also important, sensitivity analyses need to make clear what the effects are of a stricter air quality policy..3 This too is beyond the scope
of this paper.
2 On 30 June 2016, the EU Member States reached an agreement on a new directive to lower national emission ceilings for
harmful substances.
3
To determine these prices, it is necessary to expand the WLO scenarios with air quality projections. As in the case of climate change, this involves setting feasible international targets in the context of the issue of international coordination. A thorough analysis is required for this, but is not available at the moment. In addition, determining the significance of the emission reduction targets and the related prices poses a problem similar to that of CO2 pricing: to what extent do
4
1
WLO climate scenarios and CBAs
To assess climate measures with a CBA, it is necessary to specify the exact way in which changes in greenhouse gas emissions should be determined and valued. The 2015 report by the Werkgroep Discontovoet (Discount Rate Task Force) states that this is to be based on the climate scenarios of the Future Exploration of Welfare, Prosperity and the Human
Environment (WLO: CPB and PBL, 2015a). These climate scenarios describe the future development of total greenhouse gas emissions in the Netherlands and the price of one tonne of emitted CO2 in the EU ETS.4 The two scenarios available for the assessment are the High
and Low reference scenarios. The CO2 prices in these scenarios are consistent with the
assumed CO2 emission reduction within the ETS.5
Table 1 CO2 emission reduction compared to 1990 levels; CO2 prices applied under EU ETS, in
the WLO reference scenarios
High Low
2030 2050 2030 2050
Emission reduction 40% 65% 30% 45%
CO2 price (euros/tonne) 40 160 15 40
The two reference scenarios are the background against which the CO2 prices are
determined that are to be used in all CBAs. This means that, in CBAs, a climate measure has to be assessed for both reference scenarios. This approach brings not only the efficiency of the measure into focus, but also any future uncertainty surrounding it.
In addition to the reference scenarios, a third scenario was developed in which global
temperature increase is limited to 2 °C (i.e. the Two degrees scenario). For that to be realised, CO2 emissions in 2050 need to be 80% below 1990 levels. This requires a CO2 price of 100–
500 euros per tonne for 2030 and 200–1000 euros per tonne for 2050, according to the model calculations made in the WLO study. It is recommended that CBAs dealing with climate measures include an assessment for the Two degrees scenario, in addition to the two reference scenarios.6
Achieving the emission reductions requires having policies in the Netherlands, in the EU and in all other parts of the world. The assumption within the scenarios is that those policies are as efficient as possible, meaning that climate policy has been formulated in such a way that
4
In addition to CO2, there are several other greenhouse gases such as methane (CH4), nitrous oxide (N2O or laughing gas)
and halogenated hydrocarbons (a group of gases containing fluorine, chlorine and bromine). These gases produce varying levels of greenhouse effects. For a given concentration, methane has a much stronger greenhouse effect than CO2. This
report applies the CO2 price to all greenhouse gases, and follows the general convention of converting the emissions of
various greenhouse gases to their CO2 equivalents, based on their greenhouse effect. 5
In the High scenario, the ETS is set to change into an economy-wide CO2 emissions trading system after 2030. 6
The background of the choices that led to the reference scenarios and the additional two-degree scenario analysis are described in CPB and PBL (2015a). The role played by the High and Low reference scenarios and the Two degrees scenario analysis in policy preparation and the role played by CBAs are described in CPB and PBL (2015b).
5
the emission reductions are achieved at the lowest possible cost to society. A CBA of a climate change measure reveals whether the measure makes an efficient contribution towards achieving the emission reduction under a certain scenario, given the efficient CO2
price. This will provide an answer to the question of whether the new project is ‘better’ than others already implicitly included in the scenario.
This paper details how WLO climate scenario results should be used in a CBA when the establishment of a measure’s CO2 emission reductions plays a role.7 Two issues are
important in this regard.
1. Which CO2 prices are to be used? The problem here is that the WLO scenarios apply EU
ETS-based CO2 prices while there are also policy measures which are implemented
outside the ETS. Therefore, the ETS prices for 2015 and 2030 do not reflect the price level for efficient CO2 emission reduction.
2. Determining the extent to which a measure reduces emissions and the role of the so-called waterbed effect. This refers to the effect that any emission reduction resulting from the measure, provides a greater margin for emissions elsewhere within the ETS or at a later point in time, because the ETS emission ceiling follows a predetermined path and allows for banking of emission credits. As a result, the measure produces no net emission reductions. We argue that the characteristics of the scenarios mean that the waterbed effect does not need to be taken into account.
The applicable CO2 prices and ways of dealing with the waterbed effect are important issues in
assessments of climate effects in the context of a CBA. This paper, however, does not cover the way in which CBAs of climate and energy policy, generally, should be conducted. The guidelines of the General Guidance for cost-benefit analyses (Romijn and Renes, 2013; Ministry of Finance, 2013) need to be worked out in a sector-specific handbook for climate and energy policies.
In Section 2, we discuss the question of what proper CO2 prices are, and in Section 3 we
explain why it is not necessary to take the waterbed effect into account, illustrating the assertion with an example of the electricity market.
7
The approach adopted in this paper can also be used to determine the value of variations in CO2 emissions brought about
by transport infrastructure projects. In actual practice, CBAs for such projects go into far less detail since they apply a fixed amount per vehicle kilometre to assess the external damage caused by CO2 and air pollutant emissions.
6
2
CO
2
prices in the WLO study
2.1
The efficient price: definition and calculation
The WLO scenarios envision a period of several decades during which a policy aimed at preventing emissions of CO2 and other greenhouse gases coexists with subsidies for clean
technologies. In the Low reference scenario, this continues almost up to 2050. However, in the High reference scenario, the support measures are set to be completely abandoned after 2030, leaving only a carbon tax or emissions trading system in operation. These then apply across the whole economy, and will lead to ETS prices that are much higher than they are today. To stimulate the development of low-carbon technologies, the optimal solution, from a social point of view, subsidies should be offered, in addition to carbon taxes or an emissions trading system. This is needed because innovation has a sub-optimal bias towards polluting technology. Subsidies will make sustainable energy technologies become profitable more quickly and eliminate the innovation bias. As a result, over time, subsidising innovation will become unnecessary.
Compared to a policy based exclusively on CO2 pricing, the two-track policy of CO2 pricing
and the promotion of low-carbon technologies prevents a sharp increase in carbon taxes (a strict ETS ceiling) during the first few decades, thus leading to higher levels of prosperity. An example of a more detailed, model-based justification can be found in Acemoglu et al. (2012). This impact is the result of two external effects. In addition to CO2 issues, deploying clean
technologies also produces non-internalisable learning effects and spill-over effects. To assess measures using a CBA, we apply the scenarios’ efficient CO2 price path. This price
path, for each year between now and 2050, represents the CO2 prices needed to achieve a
given scenario’s assumed cumulative reduction in CO2 emissions8 against the lowest possible
costs. The economy-wide efficient price equals the minimum marginal emission-abatement costs. In other words, any deviation from the set CO2 price path leads to an increase in the
cost of achieving the CO2 emission target. Use of other prices is therefore incompatible with
the welfare-economic principles of a CBA, which hold, among other things, that the benefits of an invested euro are to be compared with the most profitable alternative use. Here, this has to do with the law of one price, which states that in an efficiently running economy identical goods and services have the same price. This means that concurrent use of ETS prices and differing (implicit) non-ETS prices for CO2 reduction cannot serve as a starting
point for a CBA of climate-related energy measures. Therefore, the efficient CO2 price path
acts as a benchmark for the inspection of new climate-related energy measures and projects in a CBA.
8
In each scenario, the assumed reduction for 2050 is consistent with the corresponding CO2 budget for 2100 (see also
CPB and PBL, 2015a). It should be noted that in each scenario there are still major differences in the primary energy mix, resulting from the assumptions made about technological development. Even so, they have a negligible impact on the CO2
price path. Put differently, regardless of the various possible technological developments, the CO2 price path reflects the
7
The WLO study only provides EU ETS prices. A non-ETS price has not been established, in part because no explicit non-ETS price exists. The ETS price is efficient if all economic actors and, thereby, the full volume of greenhouse gas emissions are covered by the Emissions Trading System. In all the WLO scenarios, this is the case for the 2050 projection. The efficient CO2 price for the period between 2016 and 2050 can be determined by applying the
Hotelling rule9 and marking down the efficient price for 2050 with the appropriate discount
rate.
Therefore, there are three efficient price paths: one for the Low scenario, one for the High scenario and one for the Two degrees scenario. The efficient CO2 prices for 2050 are 160
euros for the High scenario, 40 euros for the Low scenario and between 200 and 1000 euros for the Two degrees scenario.10 Applying Hotelling’s rule, using a discount rate of 3.5%,
results in efficient prices, for 2015, of 48 euros for the High reference scenario, 12 euros for Low scenario and between 60 and 300 euros for the Two degrees scenario. Table 2 shows these ETS prices and the efficient prices.11 The WLO’s ETS prices for 2015 and 2030,
therefore, are not efficient prices because, for those years, the Emissions Trading System does not cover all economic operators. The Two degrees scenario forms the exception, as it does cover all actors operating under the scheme in 2030.
9 Hotelling (1931). The Hotelling rule states that in an optimal situation, the growth rate of the price of a non-renewable
resource is equal to the discount rate.
10
In the Low scenario, climate policy is not yet fully efficient by 2050, but is projected to be so, shortly thereafter. Nevertheless, the rounded efficient CO2 price for 2050, in the Low scenario, is the same as the EU ETS price (see Table
3.6 of the background document to the WLO climate scenarios; CPB and PBL, 2016). This is due to the fact that, under the ETS, mitigation costs are almost level across a wide range.
11In the past, the ETS price has almost always been lower than the efficient price. Acemoglu et al. (2012) assert that this is logical, given that the efficient price also corrects for complementary policies within the ETS. The complementary policies mainly have to do with innovation promotion, and, whether within or outside the ETS, they must be valued at the efficient CO2 price, regardless of the ETS price. This does not imply, however, that the historical ETS price up to the present has
been optimal or that additional policies have been designed optimally.
Market prices and efficient prices
When valuing the effects of measures in a CBA, the use of market prices is generally promoted. If there are no instances of market failure, market prices will achieve a balance between costs in terms of allocation of resources, and benefits in terms of consumer appreciation.
If market failure does occur, this balance becomes disrupted. If it is related to external effects on the production side, not all the production costs have been reflected in the price. For these cases, the General Guidance for Cost-Benefit Analysis recommends identifying the missing markets in which the external effects occur. The data on the effects occurring within these missing markets should be worked into a CBA.
An alternative approach is to refrain from using market prices in the CBA, and work with prices adjusted for the external effects, i.e. the welfare-economics efficient cost price of production. The use of efficient prices is therefore an alternative to an explicit interpretation of the missing market.
Which approach is most useful will vary from one case to another. In assessments of CO2 markets, the
use of efficient prices seems to be the preferred option. This has to do with the fact that, while estimates of efficient prices are available, there is also uncertainty about the level of the social cost of carbon (see Section 2.3).
8
Table 2 Efficient prices and ETS prices for 1 tonne of CO2, according to WLO (in euros)
2015 2030 2050
High Efficient price 48 80 160
ETS price 5 40 160
Low Efficient price 12 20 40
ETS price 5 15 40
2o C Efficient price 60–300 100–500 200–1000
ETS price 5 100–500 200–1000
These calculations are performed with a discount rate of 3.5%, the average value for Europe. It is somewhat higher than the 3% applicable in the Netherlands (see the Advice drawn up by the Task Force for discount rates, Ministry of Finance, 2015). The reason for this is that eastern and southern Europe are growing a bit faster than north-western Europe and the Netherlands. The Dutch economy is more highly developed than those of southern and eastern Europe, which can benefit from a period of catching up12. This makes it appropriate
to apply a slightly higher discount rate there than for the Netherlands.13
2.2
Assessing measures: determining CO
2benefits
To calculate benefits, CBAs use the efficient prices shown in Table 2. All measures under study must be assessed using the efficient CO2 price of both the High and Low scenarios.
Measures that are cost-effective at a CO2 price below the efficient CO2 price in either scenario
are socially beneficial within that scenario. Measures that only become cost-effective at CO2
price levels above the efficient CO2 price in either scenario are not socially beneficial. In
evaluations of climate-related energy measures, in addition, a sensitivity analysis is required for the Two degrees scenario.
Determining CO2 benefits on the basis of the ETS price is not the correct approach. We
demonstrate this by looking at the relationship between the efficient price on the one hand, and the ETS and non-ETS prices on the other. The relationship is shown in Figure 1. The graph on the left shows how the ETS price is determined by the ceiling established for
emissions within the ETS sector. Here, the emission reduction is qETS. The emission reduction
consistent with the long-term objective (under the Low and High reference scenarios and the Two degrees scenario) is determined by the efficient price. If policy measures exist both within and outside the ETS at the same time, an optimal emission reduction arises for both sectors, represented here by q*ETS and q*non-ETS.
12 In the long run, the rate of growth in eastern Europe is likely to decrease to the level of western Europe. The discount
rate will then decrease accordingly. This will probably only happen after 2050.
13
In CBAs of Dutch policies, the present value of CO2 benefits is calculated at a discount rate of 3%, which is lower than
the actual 3.5% increase in the efficient CO2 price. This means that a Dutch policy initiative that was to reduce CO2 for
years on end would have an infinite present value. However, flows of CO2 benefits brought about by climate policy
initiatives are not infinitely long, but last for a limited time. In climate and energy policies the period is often that of the lifespan of the investments made.
9
In the graph on the left we can see that the low emission reduction below the ETS ceiling and the related low ETS price bring about a reduction in emissions that is smaller than would be efficient. The efficient price is, after all, much higher. This may make it socially beneficial to take additional measures under the ETS, such as offering subsidies or formulating standards. Subsidising measures taken under the ETS is socially beneficial, provided the costs of the measures are lower than the benefits calculated on the basis of the efficient CO2 price.
Each of the three scenarios has a given cumulative emission budget. As this implies that the total emission reduction is also a given, more needs to be done outside the ETS sector, if no additional measures are taken within the ETS sector. The ceiling for the ETS sector,
therefore, entails a limit on emissions in the non-ETS sector. In the figure, this is represented by the equal values of q*ETS – qETS and qnon-ETS – q*non-ETS. The corresponding non-ETS price is
determined in the right graph of Figure 1. Consequently, if no additional measures are taken within the ETS, then too much must be done outside the ETS at a much higher price than the efficient CO2 price.
If CBA assessments of measures were to apply the ETS price and the non-ETS price (using an implicit value, since there is no explicit value), this would lead to too few measures being taken under the ETS and too many in the non-ETS sectors. This is avoided by using the efficient CO2 price and, therefore, there is no need for a distinction between ETS and non-ETS
10
2.3
Willingness to pay and prevention costs
All CO2 prices in the WLO study (ETS, the efficient price) are based on prevention costs. The
General Guidance for CBAs states that prevention costs are generally not a good measure of willingness to pay. Nevertheless, for the case at hand, we recommend making the
calculations using these prevention costs.
This has to do with the way the WLO scenarios are set up with regard to this issue. The figure below shows the global willingness to pay for CO2 emission reduction. It involves the
marginal benefits which are obtained by avoiding damage. The willingness to pay decreases as the reduction in emissions increases. The costs of achieving the CO2 emission reduction
are also shown. These prevention costs increase with the need for greater emission
reductions. At the intersection point of the lines for willingness to pay and prevention costs, the marginal costs of additional emission reductions are equal to the marginal willingness to pay. This is where the situation is optimal. The corresponding CO2 price is called the social
11
Determining the global willingness to pay for CO2 reduction is a complicated exercise
because of the distant time horizon and the considerable uncertainty regarding the effects of climate change (low probability, high impact). Therefore, the scientific literature presents a wide range of values when referring to the social cost of carbon.14 Moreover, achieving the
optimum emission reduction is not something that happens by itself. It requires international cooperation, which is being hampered by a coordination problem. This is because the more emissions are reduced abroad, the less willing a country, or its population, is to pay for domestic emission reductions. The more the rest of the world contributes to CO2
reduction, the less serious the damage you cause yourself and the less willing you are to adopt expensive measures yourself. Ideally, the rest of the world solves the problem and you do not need to do anything. But, if nobody takes action, a major problem arises. This is known as a prisoner’s dilemma.
The various WLO climate scenarios are based on the same global willingness to pay and the same prevention costs for the reduction in CO2 emissions. They differ in the degree of
readiness to cooperate internationally. In the High reference scenario, this readiness is high. As a result, it is relatively easy to settle the coordination problem and it is possible to achieve a relatively large reduction of CO2 emissions. In the Low reference scenario, it is less easy to
overcome the coordination problem and lower levels of CO2 emission reduction are achieved.
Although it is not exactly known what the optimal emission reduction is, Figure 2 assumes that the CO2 emission reductions in both High and Low are below optimal levels.
The figure also shows that this means that in the High reference scenario, the willingness to pay for CO2 emission reduction is (much) higher than the social cost of carbon identified at
the optimal situation. In Low, the willingness to pay is even higher. This implies that if we were to use willingness to pay as a criterion, we would be taking reduction measures which do not pay off in an optimal situation and which would not be considered there. This is the reason we do not use willingness to pay, but rather the (marginal) prevention costs. In the High reference scenario, the prevention costs are higher than in the Low scenario. Complemented with the sensitivity analysis for the two-degree target, which assumes even more extensive cooperation, this ranking of prices supports the idea that climate policies which are more ambitious are also more expensive. However, as Figure 2 reveals, the prevention costs in the Low and High reference scenarios — and probably also those for the two-degree target — are an underestimation of the willingness to pay in the optimal
14
Van den Bijgaart et al. (2016) produce an estimate for the (current) social cost of carbon. Their work gives a median estimate of 20 euros per ton and an average estimate of 48 euros per ton. They calculate there is a 10% probability of reaching an SCC of more than 100 euros per ton. These estimates are very sensitive to the combination of applied discount rate and assumptions about the pace at which CO2 disappears from the atmosphere through natural processes.
The coefficients of variation in the study (standard deviation and mean ratio) are between 1.5 and 2. The work therefore shows that, while it is possible to make an estimate, the uncertainty around it has a skewed distribution and covers a wide range. There are also other studies that calculate the cost of carbon-related damage. Tol (2009) has carried out a meta-analysis of a large number of these studies and calculated a median price of 26 euros per ton of CO2 (converted to 2012
prices) and an average price of 45 euros. The analysis gives a 1% probability of the social cost of carbon going above 500 euros per ton of CO2. Vollebergh et al. (2014, Section 5.3.1) quote a 2013 publication by the US government that also
refers to a price of 26 euros, at 2012 prices, which is based on damage costs. Pindyck (2013) argues that we do not really know anything about the social cost of carbon because the models used to make estimates of the social cost of carbon are based on arbitrary assumptions and are therefore not informative.
12
situation (the social cost of carbon). Since willingness to pay and social cost of carbon are not known, it is also impossible to establish the magnitude of the underestimation caused by using the marginal prevention costs. It also means that there is no good alternative to the use of marginal prevention costs.
To find out whether a measure makes an efficient contribution to achieving a given objective which is not necessarily economic welfare at equilibrium, prevention costs might be a better approach to evaluation than damage costs (willingness to pay). When determining whether the target is optimal, benefits are to be examined on the basis of willingness to pay.
3
No waterbed effect
Measures to reduce CO2 emissions under the ETS do not lead to a decrease in CO2 allowances
nor, therefore, to a reduction in the total amount of emitted CO2. This is because the
allowances can be used by other companies operating under the ETS. This is also known as the waterbed effect.
The design of the WLO, however, implies that the waterbed effect does not have to be taken into account in CBAs as long as they use efficient prices. First, the global emission reduction and the number of CO2 credits and their trajectories are given for each WLO scenario. Who
owns the allowances is irrelevant. Second, implicit assumptions have been made on
international policy measures in the scenarios, consistent with the corresponding required emission reductions.15 This emission reduction must go hand in hand with an efficient CO2
price path. Therefore, given the transition up to 2050 for several levels of emission reduction, the WLO scenarios can be used to assess climate measures for efficiency. This means that in CBAs a proposed measure is compared against policies which are already implicitly included in the scenario. This provides an answer to the question of whether the new project is better than the most costly projects implicitly assumed in the scenario. A CBA is therefore used to determine whether a measure makes an efficient contribution to the required CO2 reduction within the scenario. This implies that the calculations must be based
on the efficient CO2 price path that corresponds to the assumed emission reduction.
15
This implicit policy leads to the freeing up of allowances which are then used by others. That is exactly the objective. Companies for whom the reduction of CO2 emissions is not profitable at the efficient prices can take advantage of unused
13
3.1
The electricity market shows that the waterbed effect is not
relevant
What we assess then, is not the emission reduction as such, but rather, the direct effects of the range of investments and measures. A wind turbine generates electricity. A coal-fired power plant (operating without carbon capture and storage technology) produces electricity and CO2. From a welfare-economic point of view it is beneficial to erect a wind turbine if the
revenue from electricity is higher than the costs of generating it. A coal-fired power plant should be closed down if the costs of generation and emissions are higher than revenue from electricity production. Note that neither measure reduces CO2 emissions within scenarios,
because emission levels are set for each scenario. It is, however, possible to assess whether a measure contributes to the assumed emission reduction in a more efficient way.
Suppose that the closure of a coal-fired power plant would have a positive CBA balance. using efficient CO2 prices. This means that closing down the plant is a good idea. Companies
for whom the reduction of CO2 emissions is not profitable at the efficient prices can take over the unused allowances. The waterbed effect is therefore not relevant.
In CBA assessments of measures in the electricity market, it is therefore useful to perform the calculations with efficient electricity prices (see textbox on efficient prices in Section 2.1). These electricity prices are based on the efficient CO2 prices, assuming the markets to be
operating perfectly. Since the emission allowances are relatively expensive compared to production costs, the expectation is that investments in clean technologies will be more sizeable and be made more rapidly in the electricity market than in other sectors. This leads to relatively fast price increases which will also have to be reflected in the efficient electricity prices. In the WLO study these have been calculated with the use of MERGE (see Table 3.4 in the background document). Here, we present the figures in Table 3 below.16
Table 3 Efficient prices and wholesale prices of electricity in the WLO study
2030 2050
High Efficient price per MWh 110 88
Wholesale price 67 90
Low Efficient price per MWh 115 101
Wholesale price 90 100
2 °C Efficient price per MWh 113–116 102–104
Wholesale price 115 105
16Since the electricity market may well be decarbonised in the short term, particularly in the High scenario, model calculations will need to incorporate assumptions about the back-up of the electricity system, the level of energy savings, the role of demand side management, and supply security. These assumptions have also been factored in into the figures in Table 3.4 of the background document. The table shows average electricity prices and for specific technologies, such as wind turbines, profile effects must also be taken into account.
14
3.2
How does this compare to previous analyses?
In previous CBAs of climate policy, the waterbed effect of the current ETS has been
highlighted emphatically (see, for example, Verrips et al., 2013). Attention has been drawn especially to the fact that, due to the waterbed effect, additional wind turbine capacity does not deliver any benefits from saved CO2 emissions. The insights presented in this paper
relate to and affect this view. The matter has to do with the fact that the new WLO climate scenarios are structured differently from the older ones.
The old WLO scenarios which formed the basis for earlier analyses did not take into account international climate targets or their feasibility and did not apply any corresponding CO2
emission reduction targets and CO2 prices. Instead, it was assumed that there was a more or
less trend-based continuation of the EU policy on ETS emission ceilings. They lacked a vision of the extent to which CO2 was to be reduced, and no CO2 prices were in place to achieve a
reduction. A CBA was then performed to check whether a project would actually save CO2. In
fact, what was examined was whether it would be socially beneficial to move from an existing situation to another with less CO2 emissions. In such an approach, the properties of
the ETS and the static and dynamic waterbed effects are relevant. Each ton of CO2 emission
reduction will, therefore, either contribute to protecting the climate, or not, because of the waterbed effect.
The new WLO scenarios are based on our assumption that international climate policy is uncertain and that the European Union and the Netherlands will eventually adapt to this international reality. The uncertainty about international climate policy is expressed through the Low and High scenarios. The Low scenario, for example, assumes that the EU will abandon its CO2 emission reduction target around 2025. In assessing climate and energy
policies, a CBA examines whether a project contributes efficiently to the reductions assumed in the Low and High reference scenarios. It no longer investigates whether it is socially interesting to reduce CO2 emissions any further. Therefore, the waterbed effect is no longer
relevant and efficient prices need to be used.
This does not affect the fact that under the old WLO assumptions too, it was socially optimal to offer innovation subsidies for renewable energy in addition to ETS measures. According to Acemoglu et al. (2012), this is because private initiatives exhibit an innovation bias that is suboptimal from a welfare-economic point of view. By offering subsidies, sustainable energy technologies will become profitable more quickly, a development which also keeps the costs of the ETS low. The previous WLO scenarios probably did not appreciate the full value of these learning effects and therefore it was not taken into account properly. The new WLO scenarios are better equipped for this.
Finally, the former WLO scenarios implicitly assumed a CO2 price based on the expectations
of the time with regard to the ETS. It is now clear that this neither contributes to achieving a climate target, nor generates profit from climate measures. In the new scenarios this is the
15
other way round: a climate target is formulated and a CO2 price is applied which is consistent
with the policy objective in the scenario. The CO2 price is significantly higher than that
considered in the former scenarios. The related efficient electricity price is also significantly higher. This makes erecting wind turbines and closing down coal-fired power plants less unprofitable at the social level. However, wind turbines still do not generate any CO2
benefits, but for a CBA, the electricity they generate will have to be calculated against efficient electricity prices.
References
Acemoglu, D, P. Aghion, L. Bursztyn and D. Hemous, 2012, The environment and directed technical change, AER, vol. 102(1): 131-166.
Bijgaart, I van den, R. Gerlagh and M. Liski, 2016, A simple formula for the social cost of carbon, Journal of Environmental Economics and Management, vol. 77(C): 75-94.
Bollen J. and C. Brink, 2012, Air Pollution Policy in Europe: Quantifying the Interaction with Greenhouse Gases and Climate Change Policies, CPB Discussion Paper 220.
CPB and PBL, 2015a, Cahier Klimaat en energie: Toekomstverkenning Welvaart en leefomgeving [Climate and Energy Notebook. Future Exploration of Welfare, Prosperity and Quality of the Living Environment].
CPB and PBL, 2015b, Bijsluiter bij de WLO-scenario’s: Toekomstverkenning Welvaart en leefomgeving [Information Leaflet for the WLO scenarios, Future Exploration of Welfare, Prosperity and Quality of the Living Environment].
CPB and PBL, 2015c, Cahier Macro-economie: Toekomstverkenning Welvaart en leefomgeving [Macro-economy Notebook. Future Exploration of Welfare, Prosperity and Quality of the Living Environment].
CPB and PBL, 2016, Achtergronddocument Klimaat en energie: Toekomstverkenning Welvaart en leefomgeving [Background document Climate and Energy. Future Exploration of Welfare, Prosperity and Quality of the Living Environment].
Hotelling, H., 1931, The Economics of Exhaustible Resources, Journal of Political Economy, vol. 39(2): 137-175.
Ministerie van Financiën, 2013, Kabinetsbrief bij de algemene MKBA-leidraad [Government note accompanying the General Guidance on CBAs].
Ministerie van Financiën, 2015, Eindrapport werkgroep Discontovoet [Final Report of the Discount Rate Task Force]
16
Pindyck, R., 2013, Climate change policy: what do the models tell us?, Journal of Economic Literature, vol. 51(3): 860-872.
Romijn, G. and G. Renes, 2013, Algemene leidraad voor maatschappelijke kosten-batenanalyse. [General Guidance on Cost-Benefit Analyses]. CPB Netherlands Bureau for Economic Policy analysis, The Hague and PBL Netherlands Environmental Assessment Agency, The Hague.
Tol, R., 2009, The economic effects of climate change, Journal of Economic Perspectives, vol. 23(2): 29-51.
Verrips, A., R. Aalbers and F. Huizinga, 2013, KBA Structuurvisie 6000 MW Windenergie op land. [CBA on the Structural Vision for a 6,000 MW Terrestrial Wind Farm]. CPB Notitie. 14 June 2013.
Vollebergh, H., E. Drissen, H. Eerens and G. Geilenkirchen, 2014, Milieubelastingen en Groene Groei II, PBL Achtergrondstudie. [Environmental Taxes and Green Growth II, PBL Background study].