1
PBL WORKING PAPER 8
OCTOBER 2012
Evaluating regeneration policies for rundown industrial sites in the
Netherlands
HUUB PLOEGMAKERSa and PASCAL BECKERSb
a Institute for Management Research, Radboud University Nijmegen, P.O. Box 9108, 6500 HK Nijmegen, The Netherlands
b PBL Netherlands Environmental Assessment Agency, P.O. Box 30314, 2500 GH, The Hague, The Netherlands
Emails: p.beckers@fm.ru.nl and h.ploegmakers@fm.ru.nl Abstract
To date, systematic evaluations of regeneration policies and programs for industrial sites are scarce. This is particularly the case for evaluations that aim to examine whether policy objectives are actually achieved and to what extent this was due to the implementation of that policy or program. Regeneration policies and programs for these sites usually involve public provision of infrastructure, public spaces and serviced building land by local authorities. The main objectives of these policies are to promote economic development and to stimulate private investments in buildings.
To narrow this ‘evaluation gap’ in planning, this paper presents a conformance-based evaluation of regeneration policies for run-down industrial sites in the Netherlands over the 1997-2008 period. Pooled data from various sources provide us with information on regeneration initiatives, their duration and nature, as well as additional details on sites, location and regional characteristics for more than half of all sites in the country that existed in the 12-year period. Propensity score matching enables us to systematically compare outcomes related to regeneration policy objectives between sites that have been subjected to regeneration and those that have not. This in turn makes it possible to study the effects that regeneration initiatives have on these outcomes.
The findings of this study suggest that regeneration for industrial sites has a negligible effect on outcomes related to the most commonly stated policy objectives: the increase of employment, of firm numbers, of property values and of the intensity of land-use on these sites.
JEL classifications: O22, R33, R38, R42
Keywords: urban regeneration, policy evaluation, treatment effects, propensity score matching, industrial sites
2
1 Introduction
To date, systematic evaluations of regeneration policies and programs for deprived and run-down urban areas that examine whether policy objectives are actually achieved are scarce. This has especially been noted for regeneration policies and programs in the US and Canada (under the heading of brownfield redevelopment) (Dair & Williams, 2001; Simons & Jaouhari, 2001; Wernstedt, 2004; De Sousa, 2005; Bacot & O'Dell, 2006; De Sousa, Wu, & Westphal, 2009). Furthermore, Wernstedt (2004, p. 50), who reviews evaluations of brownfield redevelopment, concludes that none of the studies constitute a ‘true’ economic analysis in the sense that they address what would have happened in the absence of the brownfield policies. While regeneration activities have been evaluated more extensively in the UK, serious concerns have been raised as well with regard to the rigor and sophistication of these assessments (Hemphill, Berry, & McGreal, 2004). This observation is not restricted to these particular forms of planning activity. In general, conformance-based evaluations measuring the effectiveness of plans and policies are hard to find in the planning literature (Talen, 1996b, 1996a; Laurian et al., 2004; Brody & Highfield, 2005; Alexander, 2009; Laurian et al., 2010).
This paper aims to test the effectiveness of regeneration programs for run-down industrial sites in the Netherlands by means of a quantitative analysis. Despite the fact that such programs are in place since the end of the eighties the success of these programs has never been examined in a rigorous way (Van Duren & Smit, 2000; Pen & Geerdes, 2009). The few existing evaluations have focused on measuring policy outputs (that is, physical outputs such as the number of hectares that have gone through a process of regeneration) rather than outcomes, which are the impacts of policy outputs. Research commissioned by the Department of Economic Affairs (Ter Steege & Koning, 2009) therefore concludes that little is known about the impact of regeneration programs and that further investigation is indispensable (also see Anker, Geerdes, & Steverink, 2009). This issue is addressed by comparing the outcomes on industrial sites that have been subject to regeneration policies with similar areas where no regeneration policies have been put into place. In this study, only outcomes are addressed that are commonly identified in policy documents concerning regeneration of industrial sites.
This paper contributes to the planning literature in two distinct ways. First, it develops a comparative evaluation to assess for the first time the impact of regeneration policies on deprived and run-down industrial sites. Second, this study uses highly disaggregated data at the level of individual firms and properties making it possible to analyse changes within the physical boundaries of industrial sites that generally constitute small geographic areas. This paper is organized as follows. Section 2 discusses the literature on planning evaluation. In section 3 the most commonly stated regeneration goals in the Netherlands are identified. Section 4 introduces the propensity score approach used to conduct the comparative evaluation and Section 5 describes the data that is used. In Section 6 the results are presented. Finally, Section 7 contains the concluding remarks.
2 Evaluation in Planning
According to Alexander (2009), evaluation of planning has adopted one of three distinct approaches: conformance-based, performance-based, or utilitarian (or modified-utilitarian) evaluation. The conformance-based approach to evaluations assesses the degree to which final outcomes or impacts adhere to the stated goals and intentions expressed in a policy, program or plan (Faludi & Alexander, 1989, p. 135). According to Alexander (2009) conformance-based evaluations measure success or failure against one or both of the two the following sets of standards. First, to what extent final outcomes are in line with the
3
stated goals, and second, whether the planning measures deployed to implement a policy or plan have caused the conformance to the plan. Laurian et al. (2010) refer to the latter as the attribution question. Conformance-based approaches are particularly suited for evaluating project planning, whereby plans acts as blueprints of the intended end-state as well as the measures that have to be implemented in order to achieve that end-state (Mastop & Faludi, 1997; Faludi, 2000).
In contrast, performance-based evaluations focus on the usefulness of a plan or policy in guiding and informing subsequent decision making, regardless of whether the final outcomes fit with the goals and intensions expressed in the plans (Mastop & Faludi, 1997; see Mastop & Needham, 1997 for a review; Faludi, 2000). Whereas conformance based evaluations focus on project plans, performance evaluations are appropriate methods to evaluate strategic spatial plans, which serve as coordination devices for projects and other measures taken by a range of different actors. Strategic planning is predominantly used at the regional or national level and for situations that are characterised by a high degree of uncertainty and conflict (Mastop & Faludi, 1997; Faludi, 2000). Finally, utilitarian evaluations such as cost-benefit analysis and cost-effectiveness analysis are usually applied for a priori assessments of the expected future impacts of feasible alternatives (see Alexander, 2006). According to Talen (1996b) evaluation in planning has focused primarily on these methods at the cost of ex post evaluations which measure the observed effects and outcomes of plans, programs or projects.
Conformance-based evaluations of planning are relatively scarce (Talen, 1996b, 1996a; Laurian, et al., 2004; Brody & Highfield, 2005; Alexander, 2009; Laurian, et al., 2010). This is particularly the case for quantitative assessments. Laurian, et al. (2010) refer to this as the ‘evaluation gap’. According to Brody and Highfield (2005) this gap represents one of the greatest ones in current planning research. Among planning practitioners evaluation often seems to be the ‘forgotten stage’ in the planning process (Seasons, 2003, p. 431). The result is what Calkins ( 1979, cited in Talen, 1996b) termed the ‘new plan syndrome’ where new plans and policies are continually adopted without any attempt to measure the extent in which stated goals and intentions are actually achieved. This might also partly explain the observed preoccupation with a priori evaluations as these are particularly useful for generating new plans and policies.
According to Laurian et al. (2010) the observed evaluation gap in planning research is caused by the lack of a generally accepted methodology to address the ‘attribution problem’: the difficulty of attributing observed outcomes to planning activities (also see Talen, 1996b; 1997 who refers to this as the ‘problem of multicausality’). Given this problem, Talen even asserts that planning evaluation should be limited to an investigation of the degree to which outcomes match with the intended goals: ‘[e]xplanatory chains are not vital because the question to be addressed is more black and white: did the plan achieve its goals or not?’ (1997, p. 580). Methods to tackle these issues are, however, well developed in the literature on policy implementation analysis and program evaluation. In this regard, this paper can particularly draw on the evaluation literature of local economic development policies, which sometimes explicitly incorporates geographically targeted programs at distressed areas (i.e. Enterprise zones, tax increment financing and brownfield redevelopment) (see Fisher & Peters, 1998; Bartik, 2004; Peters & Fisher, 2004). Here the attribution problem is generally addressed by comparing areas that are subject to a certain policy (the ‘treatment’ group) with comparison groups of areas that are not targeted by the policy or program. A variety of statistical approaches can be used to perform such a comparative evaluation. In this analysis, sites that were targeted by regeneration polices are compared to sites that were not subject to these polices using a propensity score matching methodology. This methodology will be explained in more detail in section four. In the absence of the regeneration policies we can expect the outcome variables to develop in ways similar to the matched sites over time.
4
3 Regeneration of industrial sites in the Netherlands
3.1 Introduction
In the US, regeneration of industrial sites is typically discussed in terms of redevelopment of brownfield sites. This term is usually limited to contaminated land. In Europe, and especially the UK, a brownfield site is one which has previously been developed, but it is not necessarily contaminated. These sites include both vacant land and land which is still in use. In the latter case, the land has to have potential to be redeveloped for other purposes in order to be considered as a brownfield (see Adams, De Sousa, & Tiesdell, 2010). It should be noted that these sites are not always industrial sites. In the Netherlands, however, regeneration often takes place on industrial sites which are still in use, without its use being changed. Although still utilized by firms, these sites are characterized by obsolete and deteriorated properties, high crime rates and outmoded infrastructure and they might suffer from contamination issues (also see section 4). Of course, parts of a site can be redeveloped to other purposes. In the remainder of this paper the focus will be on sites that have been regenerated without its industrial land-use being changed1.
Regeneration policies for deprived and run-down industrial sites can include a range of measures such as environmental and planning regulations, public investments in infrastructure and public spaces, direct public provision of land and buildings and financial incentives to stimulate private redevelopment of properties (see Adams et al., 2002; Wernstedt, Meyer, & Alberini, 2006). Financial incentives can be differentiated between grant-based and fiscal-based approaches (Adair, Berry, & McGreal, 2003). In the Netherlands, and the UK as well, financial assistance is usually given in the form of grants, which take the form of subsidies to bridge the gap between the costs of the redevelopment and the value of the scheme on completion (referred to as gap funding). Often these grants are supported by public provision of infrastructure and improvements of public spaces. In the Netherlands, several national programs are in place that can be used to finance regeneration of industrial sites. These programs range between broad urban renewal programs to grant funds that are specially targeted towards run-down industrial sites (e.g. StiREA, TIPP, Topper) and in case of contamination, grants to finance soil remediation. At the provincial level, grant programs for regeneration of industrial sites are also available. Since the majority of regeneration projects in the Netherlands are carried out by municipalities, these grants are usually not targeted towards private firms, but are awarded to municipalities. As municipalities take on the role of redeveloping obsolete industrial properties themselves as part of the regeneration strategy, these grants can take the form of gap funding. In this case, municipalities acquire the land, demolish the buildings, service it to the necessary standards, provide the necessary infrastructure and then offer the building plots to interested parties who will construct the buildings. In case of contamination, this strategy also involves site remediation and clean-up measures. Municipalities also rely on grant programs to finance infrastructure improvements and relocations of undesired activities on the site (i.e. uses that cause a nuisance to other firms). In fact, a common held view is that the majority of regeneration projects involve investments in infrastructure and public spaces only (see e.g. Olden, 2007; Louw et al., 2009).
1The analysis only addresses land on ‘formal’ industrial estates: sites that, according to the local land-use plan
(bestemmingsplan), are designated as being suitable for firms operating in manufacturing and transport industries, as well as commercial and financial services. However, sites that are designated exclusively for offices are not covered.
5
3.2 Regeneration goals
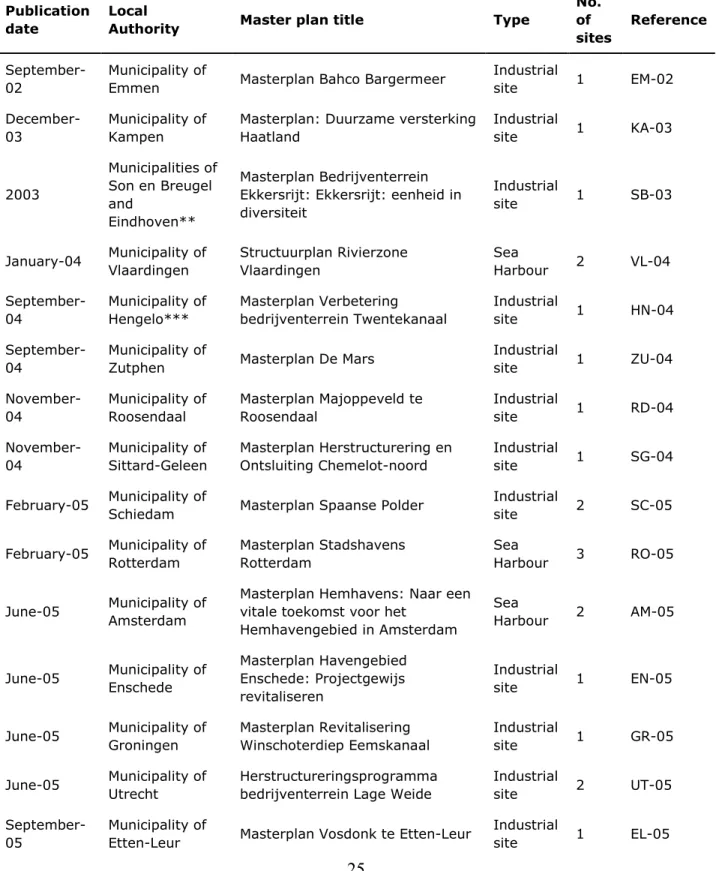
Any planning evaluation has to start with the question ‘what the policy means to achieve’, or stated differently, ‘what is this planning for?’ (Alexander, 2009). This paper aims to address this issue by analysing the content of municipal master plans for regeneration of industrial sites. Specifically, the analysis focuses on all the sites for which municipalities submitted a formal application to the grant program for regeneration of the Department of Economic Affairs (referred to as ‘Topper’). A distinctive feature of the Topper program as compared to prior regeneration programs was the upfront requirement to write a master plan to qualify for national funding. These type of policy documents were chosen for two main reasons. First, the various national programs for regeneration do not contain explicit policy goals. For instance, the main aim of the Topper program is that in five years time, 3,500 hectares of land on industrial sites have to be targeted by regeneration. The program is, however, quite vague about the beneficial effects of those regeneration efforts. Anker et al. (2009) have previously commented that regeneration of industrial sites is often regarded as an ‘end’ in and of itself rather than a mean towards an end. A second reason to study master plans submitted for the Topper program is that these reflect the goals that are deemed important at both the local and the national level. It was assumed that in order to be selected for program participation, the intentions expressed in the master plans had to be in line with national policy goals of regeneration. Moreover, it seems that the goals stated in the master plans for the Topper program are also important in other regeneration projects since they were among the most commonly mentioned anticipated effects in previous studies in which municipal officials were interviewed (Van Duren & Smit, 2000; Van der Mark, Kort, & Pen, 2004).
Some 34 master plans published between September 2002 and March 2008 were identified (see Table A1 in the appendix for a list of the documents studied), which covered a total of 60 industrial sites. The primary aim of the analysis is to identify what constitutes the goals and objectives for regeneration. For this purpose, the goal and vision statements in the master plans were coded into several categories. These categories were not pre-determined, but instead, the categories were derived directly from the texts. In the final step the frequency of specific categories in the various master plans was counted.
It is recognized here that this type of goal driven evaluations can be criticized for assuming erroneously that goals are always well-defined and that there is a clear distinction between problems and solutions (Seasons, 2003; Laurian, et al., 2010). However, this occurs in planning policy making no less than elsewhere (see Lindblom, 1959; Cohen, March, & Olsen, 1972; Kingdon, 1984; Stone, 2002). It appears that all industrial sites included in the master plans are confronted with more or less identical problems. This raises suspicion that problems might have been invented for a solution that already existed. Sometimes the relation between problems and solutions is even more ambiguous as the following quote outlining the motives by the city of Tilburg to submit an application for three industrial sites clearly illustrates:
Discussions with firms and municipal officers and on-site analysis reveal that these three industrial sites perform well on average, which does not imply that nothing has to be done in the short-term. The sites are functional and as a rule the spatial quality is satisfactory (…) This master plan therefore is not about solving pressing problems, but rather about exploiting opportunities. (TI-08: p. 8: translation by authors)
According to Anker et al. (2009, p. 10), many municipal project leaders regard securing grants, whenever possible from various sources, as their key business. They cynically note that it has become a profession in itself.
6
Table 1 presents the most frequently cited goals in the municipal master plans2. Among the most commonly stated goals are several ones with a clear focus on local economic development. One of these goals includes the ‘attraction and retention of firms’. For 33 sites the attraction of new establishments is an explicit policy concern, whereas the retention of establishments already operating in the area is identified for 23 sites. In several master plans the attraction of new firms as well as the retention of existing firms is advocated. Policy statements that emphasize improvements to the business climate for existing and new firms are also subsumed under the aim of attracting and retaining firms. A second frequently expressed goal in the context of local economic development is the creation of jobs. In addition, goals in the master plans are primarily inclined to intensification of use, environmental protection and improvement of the quality of public spaces and buildings. According to Pellenbarg (2004), intensification of use (also referred to as ‘careful land use’) has come to replace the concept of sustainability in policy documents for both regeneration and industrial greenfield development. Nonetheless, the realization of a sustainable industrial site is an aim that is cited frequently in the master plans that were investigated. The apparent importance attached to the intensification goal is somewhat surprising, because the Department of Economic Affairs itself explicitly states that this is certainly not the primary goal:
A very large part of the total demand for (industrial) space can only be accommodated by developing new industrial sites. Experience has revealed that only a small part of demand for industrial space can be absorbed by regeneration3. Therefore, reducing land consumption is not the primary objective of regeneration. The main objectives are preventing a loss of quality and contributing to a vital urban economy. Yet regeneration may partially reduce demand for new industrial sites (2004, p. 24 translation by authors).
The expressed goals have not been converted into measurable objectives in the majority of plans. Actual figures about the increase in land use due to intensification are provided for just 16 sites. Similarly, specific figures on the number of jobs to be created are found in the master plans of only 12 sites.
The master plans contain a great deal of variation in the expressed goals. These goals might even be partially conflicting. For instance, improvements to the quality of public spaces and buildings might actually result in lower density levels. Interestingly, all but two master plans that aim to improve the quality of the site also contain goals related to intensification of use. A similar pattern emerges with regard to the attraction and retention of firms (only one master plan that addresses quality improvements does not refer to the attraction or retention of firms). It can therefore be concluded that the variation in expressed goals emerges not so much from different projects, but that most projects contain a range of goals that are potentially conflicting. This is also recognized in one of the master plans: “Regeneration has to lead to a more efficient and effective use of land, but this should not result in firms underperforming or impinge upon the quality of public and private spaces” (HA-06: p. 25, translation by authors). A trade-off is therefore likely to exist between the achievement of the various goals. This might be a possible explanation why regeneration fails to have a significant impact on job or firm growth, although these are very frequently stated goals.
2 Most master plans contain one or more goals that can be seen as means to other end goals, such as the
improvement of accessibility, management and maintenance and the lay-out of the site. These are not presented here.
3 According to Olden (2007), the amount of land that is in actual use has increased by 5 to 10 per cent on
industrial sites that have gone through a process of regeneration (also see Heidemij Advies, 1996; Arcadic, 1999; OTB, 1999 Schuur, 2001, p. 17).
7
Some of the variation in the goals might nonetheless stem from a variety in projects as they involve different implementation measures. At the majority of sites included in the master plans, municipalities become directly involved in redevelopment of obsolete properties and re-use of other areas on the site such as old harbours and vacant land, apart from carrying out measures to improve infrastructure and public spaces4, It is the latter measures that will probably induce stronger churning of economic activity – arrival of new firms, expansion and closing of existing firms – on the site. Municipalities appear to share this view in their master plans as they primarily emphasize the retention of existing firms on sites that will be targeted by investments in infrastructure and public spaces only. Nevertheless for most of these sites an intensification of use is still propagated. This is to be achieved by encouraging the take-up of vacant or unused land and buildings by private actors. It is not uncommon for privately owned sites to be underused because firms usually acquire more land than they actually need at that moment, so as to have a reserve for possible expansion later. On sites where municipalities are actively involved in redevelopment of properties, encouraging private take-up of vacant land and building also forms an additional but important strategy for intensification of use.
Table 1 Commonly cited goals in municipal master plans
Goals Number of times mentioned in
documents
Attraction and retention of firms 57
Intensification of land use 54
Improving quality of public spaces and
buildings 39
Job Creation 36
Sustainable development 37
Changing industrial composition 35
Environmental protection 26
3.3 Choice of desirable outcome indicators
The impact of regeneration will be measured on total employment and the total number of firms since they are two of the most commonly stated goals. To analyse whether the impact of regeneration is concentrated in a specific industry5, a distinction will also be made between employment and firms in specific industries. Secondly, the impact of regeneration on the number of hectares occupied by firms and the employment-to-land ratio (i.e. the number of workplaces per hectare) will be analysed to find out whether regeneration has resulted in a further intensification of use on the site. Finally, the effect of regeneration on commercial property values is considered. The reason for including the effect on property values is twofold. Firstly, it is an indicator that the regeneration activities have succeeded in making the industrial site more attractive, partly as a result of the improvement of the accessibility and the enhanced quality of public spaces and buildings. This should raise the
4 On 44 sites municipalities become involved in redevelopment of properties.
5 Most master plans aim to change or to reinforce the industrial composition of the site by means of clustering and
8
value of the properties located on the site. Secondly, raising property values was expressed as an explicit goal several times in the master plans.
4 Propensity score matching
4.1 Introduction
The propensity score matching approach to evaluation has been developed by Rosenbaum and Rubin (1983, 1984) for data that is non-random and non-experimental in nature and has been adopted in a number of evaluation studies of so-called Enterprise Zones (Bondonio & Engberg, 2000; O'Keefe, 2004; Bondonio & Greenbaum, 2007). Propensity score methods have also recently been applied to an examination of the effectiveness of renewal polices for pre- and early post-war residential neighbourhoods in the Netherlands (see Wittebrood & van Dijk, 2007; Wittebrood & Permentier, 2011). The propensity score approach involves two steps. In the first step, the conditional probability of an industrial site being targeted by regeneration is estimated as a function of a variety of observed pre-intervention characteristics, referred to as the propensity score. By estimating propensity scores, systematic differences between targeted and non-targeted sites that might affect the desirable outcome variables are controlled for by matching industrial sites that are as similar as possible in their estimated propensity score.
In the second step, targeted sites are assigned to control sites on the basis of their propensity scores. Different matching techniques can be used to match regeneration sites to non-regeneration sites. These techniques differ in the way weights for the matching are calculated. The choice of a particular matching technique may affect the impact estimates through the weights assigned. In this study, regeneration sites have been matched to similar areas with the closest propensity scores. To avoid poor matches (i.e. large differences between regenerated sites and their closest non-regenerated neighbour) a threshold on the maximum propensity score distance, the ‘radius’, was imposed. Therefore, this matching technique is also called radius matching. Matching occurs among all propensity scores within a radius of 0.01. A single site may be matched to more than once to a regeneration site. According to Dehejia and Wahba (1998) matching with replacement yields better impact estimates. They have also shown that the estimate of the treatment effect can be improved by limiting the sample to the area of ‘common support’: observations with propensity scores for which both treatment and comparison observations exist (also see Heckman et al., 1997). Therefore, regeneration sites with a propensity score higher than the maximum or less than the minimum of the control observations were excluded.
An advantage of matching with propensity scores is that it reduces the challenge of matching on multiple characteristics. Of course, observable characteristics could also be included directly in an regression equation that predicts the outcome variables of interest. However, in order to do this the functional form by which the observed characteristics affect economic outcomes has to be known. Since this paper sets out to measure the impact of regeneration on several outcome variables it is unlikely that this assumption will not be violated.
4.2 The probability of regeneration measures
The ‘Topper’ program was the first program at the national level that adopted a variety of formal criteria to select the sites that would be eligible for program grants6. Besides the
6 The program’s predecessor TIPP (2000-2003) only requested that grants were used for gap funding (referred to
9
mandatory submission of master plans (see section 3), these included minimal thresholds concerning the size, environmental, health and safety impact, the number and size of obsolete sites and the availability of land on new industrial sites in the region. The selection of sites within the Topper program would thus depend on the size of the industrial area and the type of firms located on the site (i.e. more polluting industries). However, these criteria are not sufficient to construct a model of the probability that a site will be targeted by regeneration. Firstly, the focus of this paper is on all industrial sites on which municipalities have carried out regeneration measures, and secondly, even at the industrial sites designated by the Topper program additional criteria have played a role in the decision to regenerate as can be seen from Table 2. A recent study has shed more light on the factors that drive regeneration activity (Netherlands Environmental Assessment Agency (PBL), 2009, chapter 3). This research, which addressed all existing industrial sites in the Netherlands in 2007, estimated the probability that a site would be targeted by regeneration policies as a function of a number of pre-intervention characteristics of the site. This study deviated from the analysis in this paper in that it estimated the probability that an industrial site would be regenerated in the future. Furthermore, the focus was on the probabilities of occurrence of three distinct categories of plans for regeneration (a multinomial logit model was used). Two of these categories addressed redevelopment to a residential or a non-residential urban use category respectively and fall beyond the scope of this paper.
The characteristics included in the model by the PBL capture most of the criteria mentioned in the master plans that were analysed for the purpose of this study. Since they also emerged during interviews with municipal officials (see Heidemij-Advies, 1996; PBL, 2009, chapter 4), it is very likely that the variables cover all the important factors that drive municipal decisions to regenerate an industrial site. It should be noted that not for all these characteristics measurable indicator could be obtained, for instance no information was available on vacancy levels, availability of parking space and crime rates. Therefore, this study starts out with the same pre-intervention characteristics to estimate the propensity score as the ones used in the PBL study (2009).
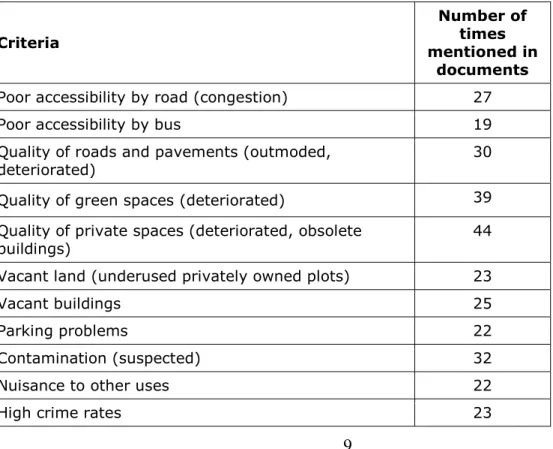
Table 2 Commonly stated criteria for regeneration in municipal master plans Criteria
Number of times mentioned in
documents
Poor accessibility by road (congestion) 27
Poor accessibility by bus 19
Quality of roads and pavements (outmoded,
deteriorated) 30
Quality of green spaces (deteriorated) 39
Quality of private spaces (deteriorated, obsolete
buildings) 44
Vacant land (underused privately owned plots) 23
Vacant buildings 25
Parking problems 22
Contamination (suspected) 32
Nuisance to other uses 22
10
PBL (2009) estimated the probability that each site would be regenerated as a function of four categories of characteristics: characteristics of the site itself, accessibility, location characteristics and regional characteristics. Besides the size of the area and the type of firms7, which were already mentioned above, site characteristics included the age of the site, the amount of land allocated for public spaces and the share of large firms on the site. Age controls for a number of influences that have followed specific trends over time. Due to changes in occupier demand requirements, buildings and site facilities may have become obsolete over time. Furthermore, as time advances, buildings and public spaces will be increasingly confronted by physical deterioration. A high share of public spaces was assumed to provide opportunities for further intensification of use through regeneration. Since large firms have a strong bargaining position in negations with the municipality, it was expected that sites with a high proportion of large firms (more than 50 employees) would be regenerated more often. Only age and the share of large firms significantly contributed to the probability that a site would be regenerated in the future in the PBL study.
Some of the explanatory variables representing the accessibility of the site included in the PBL model related to the accessibility by different transport modes. The authors hypothesized that good accessibility by road, rail or water have a positive effect on the decision to make a plan for regeneration. For instance, sites easily visible from motorways that face problems of obsolescence and deterioration stand a higher chance of being regenerated, as problems on these sites are noticed sooner. Furthermore, as accessibility is an important location factor for firms, good accessibility was assumed to improve the likelihood that a location would be regenerated (it would be kept as a firm location). According to the study, for sites in close proximity to motorways, water and railways8 the probability that they were regenerated was significantly higher. The contrary might also be the case: the master plans reviewed for this study reveal that sites are regenerated just because they are poorly accessible due to for example problems with traffic congestion (also see Heidemij-Advies, 1996; PBL, 2009, chapter 4).
The location of the site in relation to the urban area was also considered. The assumption was that increasing encroachment by residential areas would necessitate redevelopment to other uses, whereas sites near the boundary of the urban area would not be targeted by regeneration at all (PBL, 2009). Indeed we find this reasoning likely as the latter sites do not cause a nuisance to other land uses in terms of pollution and noise. In addition, the likelihood that these sites experience accessibility problems is negligible, which furthermore reduces their probability for regeneration. The PBL results indicated that the location of the site did not have a significant effect on regeneration plans. Finally, industrial sites were grouped into three geographical regions: the Randstad core region, the Intermediate zone and the Periphery (Van Oort, 2004). The was done as prior research has shown that characteristics of the site as well as market conditions differ by region, which in its turn is expected to also affect the probability of regeneration. However, in the PBL study no significant influence was found.
In addition to the variables included in the PBL study, a number of additional explanatory variables are included in the analyses. These variables include the number of firms on the site, the number of workers per hectare, the type of industrial site, the proximity to a bus stop and the size of the municipality in which the site is located. First, the
7 For this purpose, the shares of employees working in five broad industries were calculated: consumer services,
financial services, logistics, manufacturing and the public sector.
8 Proximity to railways is not included in our analysis because reliable and suitable data is lacking. However, it is
known that in particular, sites that were developed in the period 1950 and 1980 have direct connections to railways and waterways (the so-called ‘third-generation’ industrial sites; see Olden, 2010). Since the oldest age band in the PBL study covered all industrial sites that were developed before 1990, the railway variable probably captured an age effect. To remedy this shortcoming, the current analysis of this paper uses more precise age bands.
11
number of firms was added as a proxy of the importance of the site for the local economy. Second, in addition to the amount of land reserved for public spaces, the number of employees per hectare was included because low densities might also spur efforts to stimulate further intensification of use through regeneration. Third, the extent to which firms on the site are located close to a bus stop was measured because poor accessibility by public transport was frequently identified as a motive for regeneration in the master plans. Third, since larger municipalities might have more financial resources available for regeneration, a distinction is made between municipalities that constitute a metropolitan area (stedelijke agglomeratie), those in the surrounding areas which are still focused on the metropolitan area (stadsgewest) and those located elsewhere. Finally, a distinction was made between types of industrial sites, because our analysis of master plans indicated that predominantly mixed use sites are targeted by regeneration. Section five provides further details on how the pre-intervention characteristics relevant for regeneration are measured. The probit regression used to calculate the propensity scores takes the following form:
γ
α
β
β
β
= = ==
= Φ
+
∑
+
∑
+
∑
1 1 1ˆ
ˆ
ˆ
(
1)
(
ˆ
N a1
i N b2
i N c3 )
i a b cP
X
X
X
where:γ = 1 if the site has been targeted by regeneration in the period between 1997 and 2008 1
X = a matrix of characteristics of the site (i) itself 2
X = a matrix of location characteristics and accessibility if the site (i)
3
X = a matrix of regional characteristics of site (i) αˆ,
β
ˆa,β
ˆb,β
ˆc = regression parametersSince outcome data are available before and after the intervention, we have combined the propensity score matching method with a difference-in-difference estimator (or double-difference, DD). The DD approach compares treatment and comparison groups in terms of outcome changes over time, relative to the outcomes observed prior to the intervention. By taking the differences in outcomes over time, the calculation accounts for unobserved characteristics which are time-invariant and are thus constant over time. We adopt a two-period, site-specific setting for this analysis, in other words, the measurement moments before and after the intervention are defined on the basis of the start and ending dates of the intervention on the site. While in all analyses, the measurement moment before intervention is one year prior to the start of regeneration, the measurement moment after intervention varies between analyses as explained further below. The DD estimate for each regenerated site is calculated as follows:
ω
∈
=( , − , )−
∑
( , )( , − , )i i after i before j after j before j C
DD Y Y i j Y Y ,
where ω( , )i j , is the weight given to the j th control site matched to the sites that have been targeted by regeneration,i , on the basis of their propensity scores.
5 Description of the data
Outcomes are examined on regenerated and matched sites for the period 1997 to 2008. Industrial areas have been targeted by regeneration since the late 1980s, but this analysis only concerns sites where implementation measures were initiated from January 1998 until
12
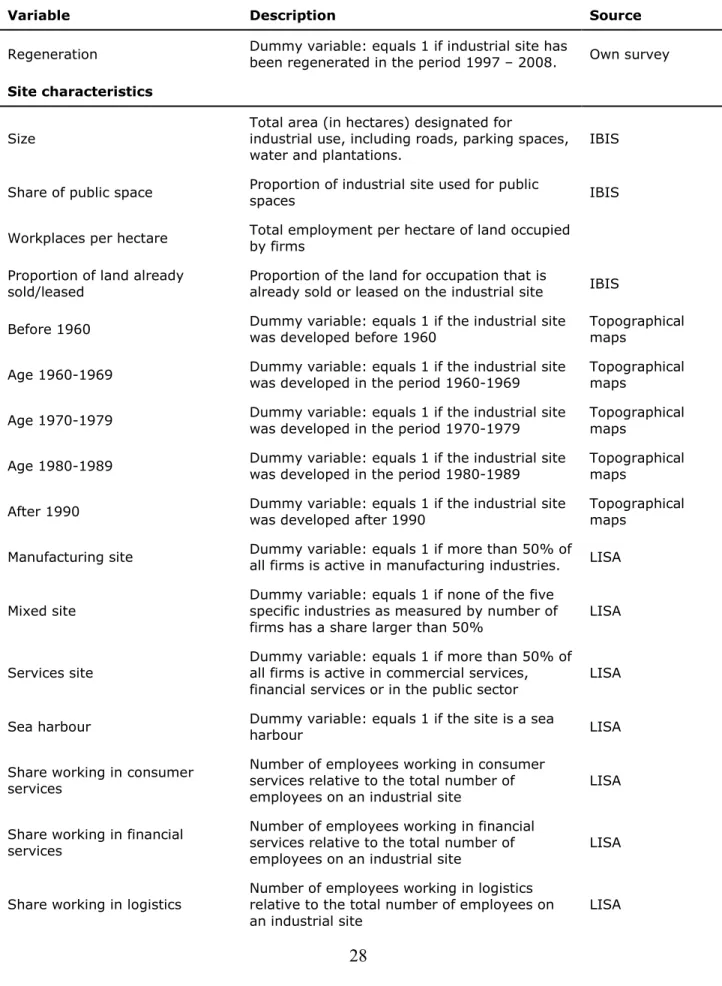
December 2006.9 This procedure ensures that the regenerated sites that are considered in the analysis have not been affected by regeneration efforts prior to the period of analysis. This assumption is referred to as the conditional independence assumption (Rosenbaum & Rubin, 1983), which is a necessary condition for applying propensity score matching methodology. The data that are used in this paper were collected from a variety of sources (see Table A2 in the appendix for a list of all variables and their sources). There is no standard for reporting information associated with regeneration, a matter which complicates data gathering. Recently, information on regeneration activity has been added to a national database (IBIS), which annually registers for all existing industrial sites in the Netherlands, among other things, their geometry, their size, the amount of land occupied by firms and the type of firms that are allowed on the site. However, this survey is primarily intended for tracking down the extent of the problem of obsolescence and whether regeneration plans for these obsolete sites are in place. To complement this information, a questionnaire was send to local economic development officials of all municipalities with at least one industrial site located within their boundaries. Information about the occurrence of interventions, the regeneration period10, project features (types of measures, financial value) was obtained for the sites that were included in IBIS in 2008. Data were retrieved for 54% (1456) of all industrial sites that existed in the period between 1997 and 200811. Regeneration is not confined to the sites that were designated by the Topper program, but in principle entails every industrial site on which municipalities carried out regeneration measures in the period of interest. This involves projects financed by other grant programs available at the national level, programs at the provincial level and even, although unlikely, projects for which no grant funds were obtained by the municipalities. The projects financed by the Topper program constitute 15% of all sites that were targeted by regeneration in the period 1997-2008 included in our survey12.
In order to analyse changes in employment and firm numbers this analysis makes use of the LISA-database, which incorporates firm level micro-data. This annual survey contains information regarding the number of jobs, industry type (NACE-codes) and the physical address of all firms in the Netherlands. A distinction is made between five broad industry categories based on their NACE-codes. These five categories are: consumer services, financial services, logistics, manufacturing and the public sector. Using GIS software, firms were geocoded to industrial sites by determining which six-digit postal codes fell within the geographical boundaries of sites included in IBIS (also see Knoben & Weterings, 2010). These data were also used to calculate several independent variables for the probit regression, including the share of workers in a specific industry and the industrial site type. The latter variable was measured as follows: when more than 50% of all firms located on a site were active in a specific industry, the site was considered as a site primarily dedicated for this use. So, a site where more than 50% of all firms was active in manufacturing industries was identified as an manufacturing site. In the case that none of the five specific industries was dominant, the site was considered as a mixed use site.
Outcome data on property values for each year were derived from a database on taxation values for tax purposes from Netherlands Statistics (CBS)13. These taxation values
9 Site on which regeneration was started before 1997 or in 2007 were excluded from the analysis.
10 Some municipal respondents were not able to provide the year that regeneration measures were started. In this
case, the first year measures were taken was determined by using information from municipal or provincial policy documents or media coverage. Sites for which no such information could be found were excluded from the analysis.
11 Some 181 municipalities responded to the questionnaire: a 42 per cent response rate.
12 Not all sites eligible for the Topper grant could be included in this figure since several municipalities that did
receive Topper finance did not respond to our questionnaire (this concerns 20 of the 60 sites).
13 Our calculations are based on a micro-database provided by Netherlands Statistics (CBS) and referred to as
13
provide a reliable estimate of property values as they have to represent transaction prices in the open market (see Beekmans & Beckers, 2012 for a more detailed description of these data). Again, individual properties are assigned to industrial sites using their six-digit postal codes.
The age of industrial sites is measured by applying optical overlay to determine in which era sites have become occupied by industrial uses. For this purpose the geometry of industrial sites has been projected on topographical maps for the period 1950-1980 appearing with 10 years intervals14. The result is an age variable, which is categorized into five age bands. The ease of accessibility is calculated by averaging the Euclidean distance, which is measured in meters, from all firms located on an industrial site to the nearest motorway junction and bus stop. In addition, a variable was created that measures whether the geometry of an industrial site intersects with a motorway (using a 100 meter buffer). This was done to indicate sites that are visible from the motorway. The encroachment by other land-uses was measured by averaging the number of grid cells (measuring 10 x 10 meter) allocated to this particular land-use within a 500 meter radius for all LISA firms on the site. These calculations were performed for the land-uses of housing, water and other non urban uses15 (e.g. nature, wetlands, forests, agriculture). Analogous to the research by PBL (2009), regional differences are accounted for by using the three regions Randstad, Intermediate zone and Periphery as distinguished by Van Oort (2004). In addition, data from CBS have been used to determine whether an industrial site is located in a metropolitan agglomeration, or in the surrounding area.
6 Empirical results
6.1 Probit results
Before the final model was estimated, a variety of alternative specifications were tested. These specifications added a range of alternative explanatory variables to the model, including the amount of land occupied by firms, employment, distance from the settlement boundary, degree of urbanization, distance to waterways and distance from the town centre. In several cases, these variables replaced the original variables due to problems of multicollinearity (e.g. employment with number of firms and the amount of land in use to total size). These variables were not included in the final model because they yielded estimates with smaller significance levels or the outcomes were found to be less reliable. Probabilities are estimated for two groups of outcome variables. The first group includes employment, number of firms and the intensity of use. In the second group the impact on property values is considered. For the last group, the probit specification also adds the average value of commercial properties located on the site. Given the large number of missing values for the property value variable, we prefer to estimate the additional effect of this variable in a separate regression.
Table 3 reports the results from the two probit regressions. As expected, the age of the industrial site significantly affects the probability of occurrence of regeneration on an industrial site in both regressions. Regeneration tends to particularly take place on sites that were developed in or before the 1960s. Also, as property values are lower on older sites, it is not surprising that we find a negative relationship between average property values and the chance for regeneration. Moreover, mixed sites are most likely to be subjected to regeneration. Other site characteristics including the number of firms and the share of large firms also have a significant effect on the probability of regeneration. While sites with more
14 For sites developed after the 1980s, the IBIS database was used to calculate age bands.
15 The following land-uses were included: single day recreation, stay tourism, greenhouse farming, other farming
14
firms are more likely to be regenerated, those with high shares of large firms are less likely. These findings seem intuitive: private regeneration initiatives on run-down sites are likely more difficult to get off the ground on sites with more dispersed ownership, so public intervention is more likely to become necessary. Industrial sites with a bus stop, water or a large share of houses and non-urban uses nearby have a lower change to be regenerated than other sites. Finally, sites that are located in a metropolitan area or in the immediate vicinity of this area are regenerated more often. Thus, regeneration, seems to take place primarily in the most urbanized areas of the Netherlands. Contrary to the findings of PBL (2009), access to motorways does not significantly contribute to the occurrence of regeneration. Possibly, this effect has been subsumed by the prior urban location variables.
15
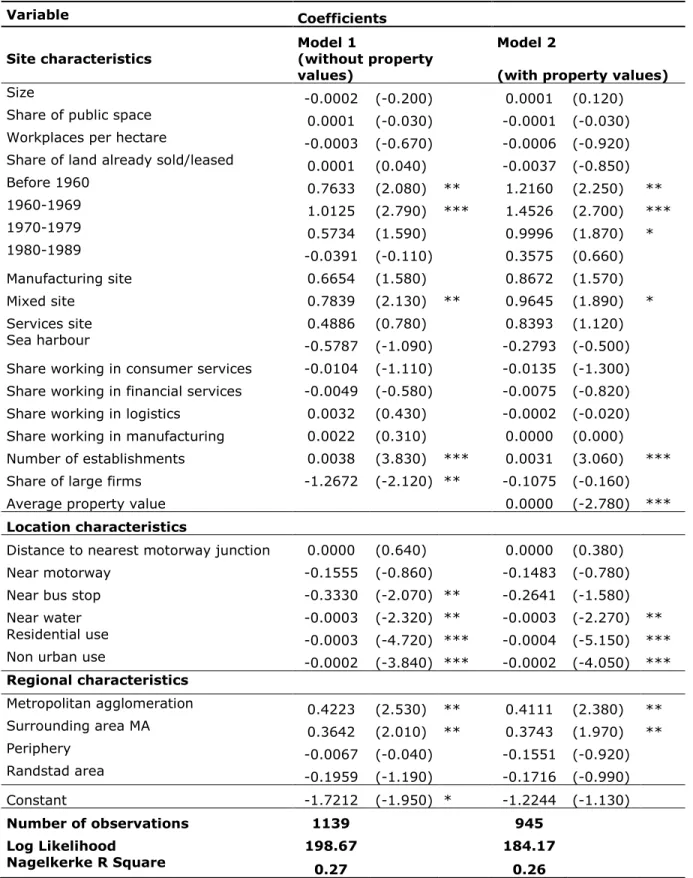
Table 3: Probit regression results
Variable Coefficients
Model 1 Model 2 Site characteristics (without property
values) (with property values)
Size -0.0002 (-0.200) 0.0001 (0.120)
Share of public space 0.0001 (-0.030) -0.0001 (-0.030) Workplaces per hectare -0.0003 (-0.670) -0.0006 (-0.920) Share of land already sold/leased 0.0001 (0.040) -0.0037 (-0.850) Before 1960 0.7633 (2.080) ** 1.2160 (2.250) ** 1960-1969 1.0125 (2.790) *** 1.4526 (2.700) *** 1970-1979 0.5734 (1.590) 0.9996 (1.870) * 1980-1989 -0.0391 (-0.110) 0.3575 (0.660) Manufacturing site 0.6654 (1.580) 0.8672 (1.570) Mixed site 0.7839 (2.130) ** 0.9645 (1.890) * Services site 0.4886 (0.780) 0.8393 (1.120) Sea harbour -0.5787 (-1.090) -0.2793 (-0.500) Share working in consumer services -0.0104 (-1.110) -0.0135 (-1.300) Share working in financial services -0.0049 (-0.580) -0.0075 (-0.820) Share working in logistics 0.0032 (0.430) -0.0002 (-0.020) Share working in manufacturing 0.0022 (0.310) 0.0000 (0.000) Number of establishments 0.0038 (3.830) *** 0.0031 (3.060) *** Share of large firms -1.2672 (-2.120) ** -0.1075 (-0.160) Average property value 0.0000 (-2.780) ***
Location characteristics Distance to nearest motorway junction 0.0000 (0.640) 0.0000 (0.380) Near motorway -0.1555 (-0.860) -0.1483 (-0.780) Near bus stop -0.3330 (-2.070) ** -0.2641 (-1.580) Near water -0.0003 (-2.320) ** -0.0003 (-2.270) ** Residential use -0.0003 (-4.720) *** -0.0004 (-5.150) *** Non urban use -0.0002 (-3.840) *** -0.0002 (-4.050) ***
Regional characteristics Metropolitan agglomeration 0.4223 (2.530) ** 0.4111 (2.380) ** Surrounding area MA 0.3642 (2.010) ** 0.3743 (1.970) ** Periphery -0.0067 (-0.040) -0.1551 (-0.920) Randstad area -0.1959 (-1.190) -0.1716 (-0.990) Constant -1.7212 (-1.950) * -1.2244 (-1.130) Number of observations 1139 945 Log Likelihood 198.67 184.17 Nagelkerke R Square 0.27 0.26
Notes: Z-values are given in parentheses; *** Significant at the 1% level; ** Significant at the 5% level; * Significant at the 10% level.
16
6.2 Comparison of regeneration sites and matched sites
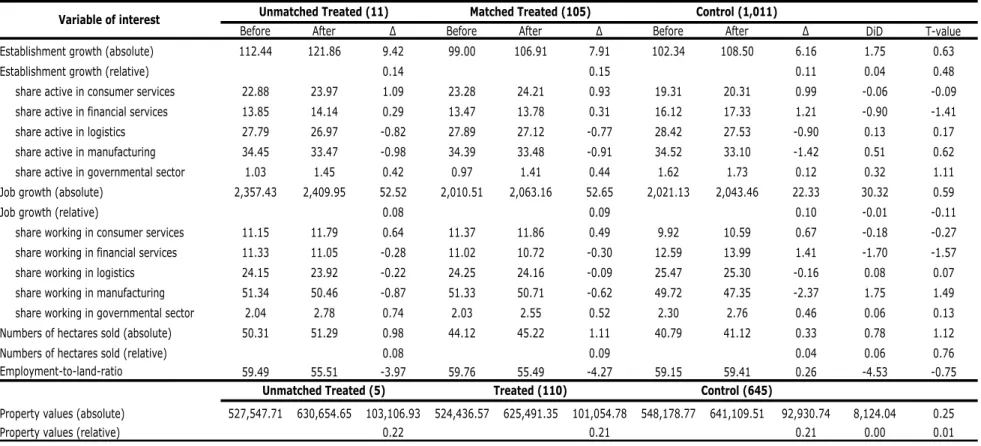
Table 4 presents the results of the comparison between regenerated sites and matched sites16 for the outcome variables of interest: growth in employment, number of firms, intensity of land use and property values. The right panel of the table reports information for regenerated sites and their matched counterparts; the left panel considers sites that have been regenerated but for which no control sites could be found. These latter figures are included to demonstrate that there are no notable differences in the outcomes between matched and unmatched regenerated sites. For each of the three groups information is displayed in the following way: columns one, four and seven contain the average values one year before the regeneration measures were started, columns two, five and eight contain the average values two years after the regeneration measures were started, and finally columns three, six and nine present the first difference between these two measurement points. To ensure proper matching of time periods between regeneration and control sites, the measurement moments before and after are equal for each matched pair. On the far right hand of the table, the ‘difference-in-differences’ estimates (DD) are presented. The final column shows the respective t-values for the difference-in-differences.
As can be seen in Table 4, none of the difference-in-differences coefficients of the regenerated sites significantly deviate from the control sites at the 10% level. Thus, the findings do not provide supportive evidence that any of the perceived positive effects identified in the municipal master plans has materialized. The robustness of the results is examined by replicating the analysis with two different matching procedures (nearest neighbour matching with a 0.01 radius and kernel matching). The results of the sensitivity analysis show that the zero-impact estimates remain stable when different matching criteria are used to assign targeted sites to non-targeted sites using the propensity scores. As the propensity score method accounts for the attribution or counterfactual question – what would the outcome have been had there been no regeneration – the findings indicate that, on average, the outcomes on regenerated sites would have been the same had there been no intervention. That is, in the absence of the regeneration efforts these sites would not have been worse off.
One possible explanation for these findings is that different types of regeneration measures have opposing impacts on the outcome variables that, when considered jointly, balance out to near zero. To test this proposition, we focus specifically on the effects of regeneration projects that involve redevelopment of obsolete properties, as these projects are thought to have a more substantial impact on the outcome measures.
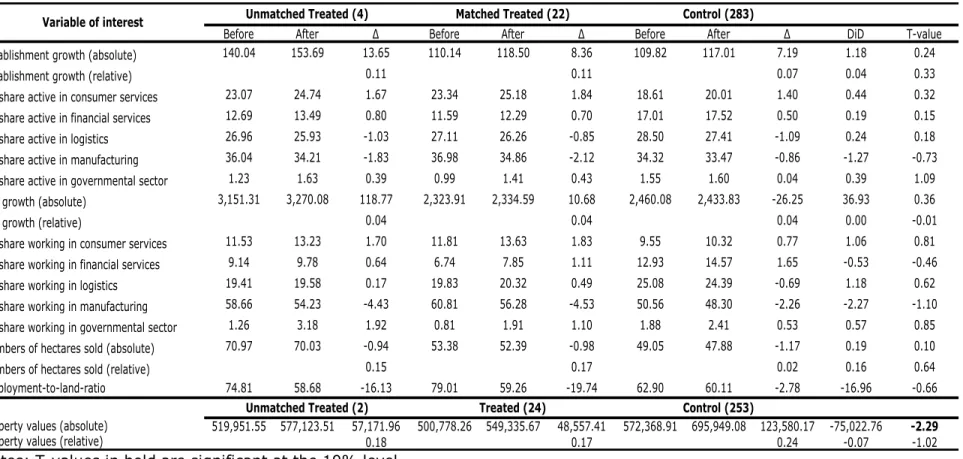
Table 5 presents the results of the outcome comparison between regenerated sites with redevelopment of properties and matched sites. For the sake of comparison, Table 6 shows the results for regenerated sites without redevelopment of properties. In the latter regeneration projects municipalities have only invested in infrastructure and public spaces. The tables are structured in the same way as Table 4 and the measurement moments are equivalent to the ones in the prior analysis. As the results in Table 5 show, the only significant effect that regeneration involving redevelopment of properties has had on the outcome variables is that it lowered the increase in mean property values. The mean increase of regenerated sites was Euro 48,557 while it was Euro 123,580 for the control sites. It seems that larger buildings have been (partially) replaced by smaller buildings, which results in a reduction of the mean property values on the sites. A shortcoming of the analysis presented in Table 5 is that the number of matched regenerated sites with redevelopment of properties is rather small (n=22), which limits the usefulness of the analysis. An interesting finding from the analysis on regenerated sites with municipal
16 A test for the equality of means was conducted to assess the comparability of the regeneration sites and the
matched sites one year prior to regeneration. The results are presented in Table A3 in the appendix and indicate that there are no systematic differences in the observed characteristics between these two groups.
17
investments in infrastructure and public spaces (Table 6) is that regeneration seems to have a minor effect on the sector composition on these sites. The table shows a significant negative effect of regeneration on the share of establishments in financial services and a significant positive effect on the share of jobs in manufacturing. While the share of establishments in financial services on regenerated sites has grown less strongly than on comparable other sites (0.2% vs. 1.4%), on the contrary, regeneration has reversed the decline in the share of jobs in manufacturing (0.4% vs. -2.4%). In other words, economic activities in the manufacturing sector seem to have benefitted from regeneration at the cost of those in financial services. Overall, apart from the minor effects above, we find little evidence in support of the proposition that the effects of different types of regeneration measures balance out to near zero. Instead, it rather appears as if none of the measures studied has much effect on the outcomes.
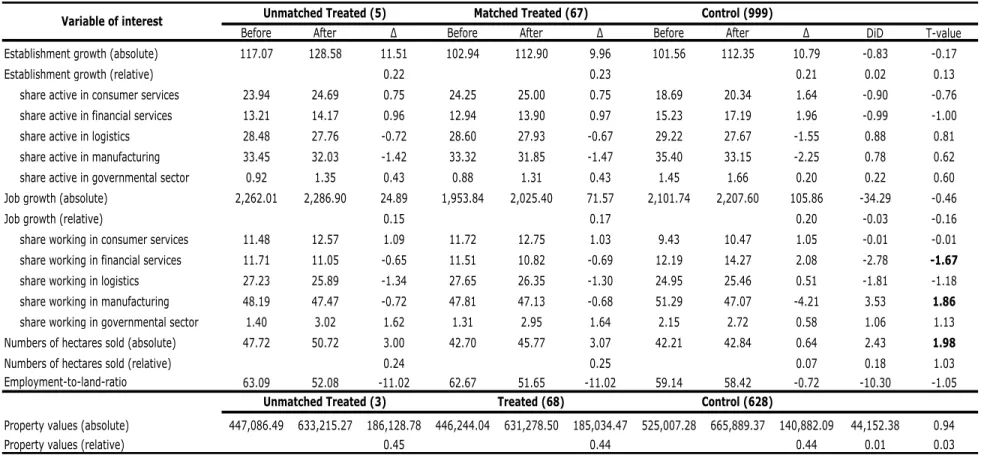
Another possible explanation why we do not find any significant effects of regeneration might be that the time period considered in the analysis is too short for these measures to show any effect. It is rather plausible that effectiveness changes over time and that regeneration only shows measurable effects in the medium to long-term. Also, not all regeneration projects included in the prior analyses were finished before 2008. However, as regeneration usually involves the implementation of a range of projects that are phased differently over time, it is assumed that regeneration is (at least partially) finished on these sites. Although, we must acknowledge that we do not have data for a long-enough period to study longer-term effects thoroughly, we carry out two additional analyses to gain further insight in this matter. In the first analysis presented in Table 7, we change the measurement moments for the before and after assessments to one year prior and four years after the regeneration measures were started (the latter was two years after the start in the analyses above). In the second analysis presented in Table 8, we change the measurement moments to one year before the start of the measures and two years after the finish of the measures.17
Table 7 does indeed suggest that effects of regeneration tend to increase if we consider a longer time period. Nonetheless, significant differences remain by and large confined to sector compositional changes on sites. On average, regeneration reduces the share of establishments in the financial services sector by 2.8% (decline by 0.7% as compared to growth of 2.1% for control sites). This decline benefits the manufacturing sector, which sees its share declining far less than were the case without regeneration (-0.7% vs. -4.2%). Finally, an interesting effect of regeneration is observed with regard to the hectares of land sold on the sites. We observe that regeneration results in a 2.4 hectares increase of land sold (3.1 hectares increase for regenerated sites vs. 0.6 hectares increase for control sites). Given that the mean level of land sold in the year prior to regeneration is about 42 hectares, this increase is rather sizeable (about 5-6%). However, the latter effect vanishes in the final analysis presented in Table 8, which undermines the before proposition that regeneration effects increase over time. In Table 8, the only significant effect is found with regard to the share of establishments in the logistics sector. Due to regeneration this share increases with 1.1% while it would have declined by 1.3% without these measures.
17As before, to ensure proper matching of time periods between regeneration and control sites, the measurement moments before and after are equal for each matched pair.
18
Table 4 Mean impacts for outcome variables across regenerated sites and matched areas
(measurement moments: before= year prior to start regeneration, after=two years after start regeneration)
Before After ∆ Before After ∆ Before After ∆ DiD T-value Establishment growth (absolute) 112.44 121.86 9.42 99.00 106.91 7.91 102.34 108.50 6.16 1.75 0.63
Establishment growth (relative) 0.14 0.15 0.11 0.04 0.48
share active in consumer services 22.88 23.97 1.09 23.28 24.21 0.93 19.31 20.31 0.99 -0.06 -0.09 share active in financial services 13.85 14.14 0.29 13.47 13.78 0.31 16.12 17.33 1.21 -0.90 -1.41 share active in logistics 27.79 26.97 -0.82 27.89 27.12 -0.77 28.42 27.53 -0.90 0.13 0.17 share active in manufacturing 34.45 33.47 -0.98 34.39 33.48 -0.91 34.52 33.10 -1.42 0.51 0.62 share active in governmental sector 1.03 1.45 0.42 0.97 1.41 0.44 1.62 1.73 0.12 0.32 1.11 Job growth (absolute) 2,357.43 2,409.95 52.52 2,010.51 2,063.16 52.65 2,021.13 2,043.46 22.33 30.32 0.59
Job growth (relative) 0.08 0.09 0.10 -0.01 -0.11
share working in consumer services 11.15 11.79 0.64 11.37 11.86 0.49 9.92 10.59 0.67 -0.18 -0.27 share working in financial services 11.33 11.05 -0.28 11.02 10.72 -0.30 12.59 13.99 1.41 -1.70 -1.57 share working in logistics 24.15 23.92 -0.22 24.25 24.16 -0.09 25.47 25.30 -0.16 0.08 0.07 share working in manufacturing 51.34 50.46 -0.87 51.33 50.71 -0.62 49.72 47.35 -2.37 1.75 1.49 share working in governmental sector 2.04 2.78 0.74 2.03 2.55 0.52 2.30 2.76 0.46 0.06 0.13 Numbers of hectares sold (absolute) 50.31 51.29 0.98 44.12 45.22 1.11 40.79 41.12 0.33 0.78 1.12
Numbers of hectares sold (relative) 0.08 0.09 0.04 0.06 0.76
Employment-to-land-ratio 59.49 55.51 -3.97 59.76 55.49 -4.27 59.15 59.41 0.26 -4.53 -0.75 Property values (absolute) 527,547.71 630,654.65 103,106.93 524,436.57 625,491.35 101,054.78 548,178.77 641,109.51 92,930.74 8,124.04 0.25
Property values (relative) 0.22 0.21 0.21 0.00 0.01
Control (645)
Variable of interest Unmatched Treated (11) Matched Treated (105) Control (1,011)
Unmatched Treated (5) Treated (110)
19
Table 5 Mean impacts for outcome variables across regenerated sites and matched areas, redevelopment of properties (measurement moments: before= year prior to start regeneration, after=two years after start regeneration)
Before After ∆ Before After ∆ Before After ∆ DiD T-value Establishment growth (absolute) 140.04 153.69 13.65 110.14 118.50 8.36 109.82 117.01 7.19 1.18 0.24
Establishment growth (relative) 0.11 0.11 0.07 0.04 0.33
share active in consumer services 23.07 24.74 1.67 23.34 25.18 1.84 18.61 20.01 1.40 0.44 0.32 share active in financial services 12.69 13.49 0.80 11.59 12.29 0.70 17.01 17.52 0.50 0.19 0.15 share active in logistics 26.96 25.93 -1.03 27.11 26.26 -0.85 28.50 27.41 -1.09 0.24 0.18 share active in manufacturing 36.04 34.21 -1.83 36.98 34.86 -2.12 34.32 33.47 -0.86 -1.27 -0.73 share active in governmental sector 1.23 1.63 0.39 0.99 1.41 0.43 1.55 1.60 0.04 0.39 1.09 Job growth (absolute) 3,151.31 3,270.08 118.77 2,323.91 2,334.59 10.68 2,460.08 2,433.83 -26.25 36.93 0.36
Job growth (relative) 0.04 0.04 0.04 0.00 -0.01
share working in consumer services 11.53 13.23 1.70 11.81 13.63 1.83 9.55 10.32 0.77 1.06 0.81 share working in financial services 9.14 9.78 0.64 6.74 7.85 1.11 12.93 14.57 1.65 -0.53 -0.46 share working in logistics 19.41 19.58 0.17 19.83 20.32 0.49 25.08 24.39 -0.69 1.18 0.62 share working in manufacturing 58.66 54.23 -4.43 60.81 56.28 -4.53 50.56 48.30 -2.26 -2.27 -1.10 share working in governmental sector 1.26 3.18 1.92 0.81 1.91 1.10 1.88 2.41 0.53 0.57 0.85 Numbers of hectares sold (absolute) 70.97 70.03 -0.94 53.38 52.39 -0.98 49.05 47.88 -1.17 0.19 0.10
Numbers of hectares sold (relative) 0.15 0.17 0.02 0.16 0.64
Employment-to-land-ratio 74.81 58.68 -16.13 79.01 59.26 -19.74 62.90 60.11 -2.78 -16.96 -0.66 Property values (absolute) 519,951.55 577,123.51 57,171.96 500,778.26 549,335.67 48,557.41 572,368.91 695,949.08 123,580.17 -75,022.76 -2.29
Property values (relative) 0.18 0.17 0.24 -0.07 -1.02
Variable of interest Unmatched Treated (4) Matched Treated (22) Control (283)
Unmatched Treated (2) Treated (24) Control (253)
20
Table 6 Mean impacts for outcome variables across regenerated sites and matched areas, no redevelopment of properties (measurement moments: before= year prior to start regeneration, after=two years after start regeneration)
Before After ∆ Before After ∆ Before After ∆ DiD T-value Establishment growth (absolute) 104.47 112.67 8.20 96.05 103.84 7.80 100.36 106.25 5.89 1.90 0.58
Establishment growth (relative) 0.15 0.16 0.12 0.04 0.42
share active in consumer services 22.82 23.75 0.92 23.26 23.95 0.69 19.50 20.38 0.89 -0.19 -0.27 share active in financial services 14.19 14.33 0.14 13.97 14.18 0.21 15.89 17.28 1.39 -1.18 -1.72 share active in logistics 28.03 27.26 -0.76 28.09 27.34 -0.75 28.40 27.56 -0.85 0.10 0.12 share active in manufacturing 33.99 33.26 -0.73 33.71 33.12 -0.59 34.57 33.01 -1.57 0.97 1.11 share active in governmental sector 0.97 1.40 0.43 0.97 1.41 0.44 1.63 1.77 0.13 0.31 0.92 Job growth (absolute) 2,128.09 2,161.47 33.38 1,927.45 1,991.22 63.77 1,904.78 1,939.98 35.20 28.57 0.49
Job growth (relative) 0.09 0.10 0.11 -0.01 -0.13
share working in consumer services 11.04 11.37 0.33 11.26 11.39 0.13 10.02 10.66 0.64 -0.51 -0.71 share working in financial services 11.96 11.42 -0.54 12.15 11.48 -0.67 12.50 13.84 1.34 -2.01 -1.54 share working in logistics 25.52 25.18 -0.34 25.42 25.18 -0.24 25.57 25.55 -0.03 -0.22 -0.19 share working in manufacturing 49.22 49.37 0.15 48.81 49.23 0.42 49.50 47.10 -2.40 2.82 2.14 share working in governmental sector 2.27 2.66 0.39 2.35 2.72 0.37 2.41 2.85 0.44 -0.08 -0.16 Numbers of hectares sold (absolute) 44.34 45.88 1.54 41.66 43.32 1.66 38.61 39.33 0.73 0.93 1.24
Numbers of hectares sold (relative) 0.07 0.07 0.04 0.03 0.49
Employment-to-land-ratio 55.06 54.60 -0.46 54.66 54.49 -0.17 58.16 59.23 1.07 -1.24 -0.39 Property values (absolute) 529,766.82 646,292.96 116,526.14 531,038.89 646,744.10 115,705.20 541,428.03 625,805.44 84,377.41 31,327.80 -0.23
Property values (relative) 0.23 0.22 0.20 0.02 0.31
Variable of interest Unmatched Treated (7) Matched Treated (83) Control (1,003)
Unmatched Treated (3) Treated (86) Control (638)
21
Table 7 Mean impacts for outcome variables across regenerated sites and matched areas
(measurement moments: before= year prior to start regeneration, after=four years after start regeneration)
Before After ∆ Before After ∆ Before After ∆ DiD T-value Establishment growth (absolute) 117.07 128.58 11.51 102.94 112.90 9.96 101.56 112.35 10.79 -0.83 -0.17
Establishment growth (relative) 0.22 0.23 0.21 0.02 0.13
share active in consumer services 23.94 24.69 0.75 24.25 25.00 0.75 18.69 20.34 1.64 -0.90 -0.76 share active in financial services 13.21 14.17 0.96 12.94 13.90 0.97 15.23 17.19 1.96 -0.99 -1.00 share active in logistics 28.48 27.76 -0.72 28.60 27.93 -0.67 29.22 27.67 -1.55 0.88 0.81 share active in manufacturing 33.45 32.03 -1.42 33.32 31.85 -1.47 35.40 33.15 -2.25 0.78 0.62 share active in governmental sector 0.92 1.35 0.43 0.88 1.31 0.43 1.45 1.66 0.20 0.22 0.60 Job growth (absolute) 2,262.01 2,286.90 24.89 1,953.84 2,025.40 71.57 2,101.74 2,207.60 105.86 -34.29 -0.46
Job growth (relative) 0.15 0.17 0.20 -0.03 -0.16
share working in consumer services 11.48 12.57 1.09 11.72 12.75 1.03 9.43 10.47 1.05 -0.01 -0.01 share working in financial services 11.71 11.05 -0.65 11.51 10.82 -0.69 12.19 14.27 2.08 -2.78 -1.67 share working in logistics 27.23 25.89 -1.34 27.65 26.35 -1.30 24.95 25.46 0.51 -1.81 -1.18 share working in manufacturing 48.19 47.47 -0.72 47.81 47.13 -0.68 51.29 47.07 -4.21 3.53 1.86 share working in governmental sector 1.40 3.02 1.62 1.31 2.95 1.64 2.15 2.72 0.58 1.06 1.13 Numbers of hectares sold (absolute) 47.72 50.72 3.00 42.70 45.77 3.07 42.21 42.84 0.64 2.43 1.98
Numbers of hectares sold (relative) 0.24 0.25 0.07 0.18 1.03
Employment-to-land-ratio 63.09 52.08 -11.02 62.67 51.65 -11.02 59.14 58.42 -0.72 -10.30 -1.05 Property values (absolute) 447,086.49 633,215.27 186,128.78 446,244.04 631,278.50 185,034.47 525,007.28 665,889.37 140,882.09 44,152.38 0.94
Property values (relative) 0.45 0.44 0.44 0.01 0.03
Variable of interest Unmatched Treated (5) Matched Treated (67) Control (999)
Unmatched Treated (3) Treated (68) Control (628)
22
Table 8 Mean impacts for outcome variables across regenerated sites and matched areas
(measurement moments: before= year prior to start regeneration, after=two years after finish regeneration)
Before After ∆ Before After ∆ Before After ∆ DiD T-value Establishment growth (absolute) 95.43 105.58 10.15 84.68 94.50 9.82 97.86 106.65 8.78 1.04 0.21
Establishment growth (relative) 0.37 0.39 0.21 0.18 0.90
share active in consumer services 25.22 25.71 0.49 25.44 26.02 0.58 18.98 20.51 1.53 -0.94 -0.61 share active in financial services 12.55 13.68 1.12 12.26 13.36 1.10 15.30 16.82 1.52 -0.43 -0.41 share active in logistics 26.95 28.03 1.08 27.09 28.22 1.12 29.01 27.68 -1.33 2.46 1.94 share active in manufacturing 34.48 31.39 -3.09 34.47 31.27 -3.20 35.18 33.21 -1.97 -1.22 -0.77 share active in governmental sector 0.80 1.19 0.40 0.74 1.13 0.39 1.53 1.79 0.25 0.14 0.29 Job growth (absolute) 1,934.00 1,963.08 29.08 1,665.16 1,715.38 50.22 1,915.27 1,991.33 76.06 -25.84 -0.41
Job growth (relative) 0.19 0.20 0.19 0.01 0.06
share working in consumer services 11.27 12.48 1.20 11.47 12.69 1.22 9.83 10.80 0.96 0.26 0.24 share working in financial services 11.50 10.32 -1.18 11.18 9.96 -1.23 12.74 14.10 1.36 -2.58 -1.42 share working in logistics 26.94 27.24 0.30 27.47 27.87 0.40 26.04 26.17 0.13 0.27 0.15 share working in manufacturing 48.99 47.83 -1.16 48.74 47.60 -1.14 49.25 46.11 -3.14 2.00 0.91 share working in governmental sector 1.30 2.14 0.84 1.13 1.88 0.75 2.13 2.83 0.69 0.05 0.08 Numbers of hectares sold (absolute) 38.67 41.83 3.16 36.50 39.49 2.99 38.18 39.57 1.39 1.60 1.12
Numbers of hectares sold (relative) 0.12 0.13 0.07 0.06 0.63
Employment-to-land-ratio 54.52 51.31 -3.21 52.72 50.03 -2.69 59.69 61.38 1.69 -4.38 -1.33 Property values (absolute) 437,831.13 610,535.76 172,704.63 436,116.28 609,444.04 173,327.76 523,469.20 675,957.11 152,487.92 20,839.84 0.41
Property values (relative) 0.46 0.47 0.38 0.09 0.65
Variable of interest Unmatched Treated (3) Matched Treated (50) Control (991)
Unmatched Treated (1) Treated (51) Control (602)