Published by:
National Institute for Public Health and the Environment
P.O. Box 1 | 3720 Ba Bilthoven The Netherlands
www.rivm.com
Detection of Coxiella burnetii DNA in animal
and environmental matrices on non-dairy
sheep farms
RIVM letter report 330071001/2011
B.J. van Rotterdam
Detection of Coxiella burnetii DNA in
animal and environmental matrices on
non-dairy sheep farms
RIVM Letter report 330071001/2011
© RIVM 2011
Parts of this publication may be reproduced, provided acknowledgement is given to the 'National Institute for Public Health and the Environment', along with the title and year of publication.
Arnout de Bruin (Researcher), National Institute for Public Health
and the Environment
Rozemarijn van der Plaats (Research Technician), National Institute
for Public Health and the Environment
Bart van Rotterdam (Project Leader), National Institute for Public
Health and the Environment
Contact:
Bart van Rotterdam
Laboratory for Zoonoses and Environmental Microbiology
bart.van.rotterdam@rivm.nl
This investigation has been performed by order and for the account of the Food and Consumer Product Safety Authority (nVWA), within the framework of Livestock-borne Zoonoses, project 9.2.3.D: Coxiella
Abstract
Detection of Coxiella burnetii DNA in animal and environmental matrices on non-dairy sheep farms
During the spring and summer of 2007, 2008 and 2009, large Q fever outbreaks occurred in the Netherlands affecting a rural area in the southeast of the country. Prior to and during these outbreaks Q fever related abortion waves were reported on several dairy goat farms in the same region. As a result, primarily commercial dairy goat farms were implicated as potential sources for the emerging human Q fever cases in the Netherlands. However, in 2008 and 2009 a number of (non-dairy) sheep farms were identified where C. burnetii DNA was detected in both animal (vaginal swabs) and environmental (surface area swabs) matrices. In addition, in two epidemiological studies non-dairy sheep farms were implicated as the primary source for an emerging cluster of human Q fever cases in their near vicinity. Therefore, although less important in the recent epidemic, non-dairy sheep farms cannot be ruled out as potential source for human Q fever.
In the current study, we describe the presence of C. burnetii DNA in animal and environmental matrices obtained from two non-dairy sheep farms. We show that
C. burnetii DNA content in surface area swabs from fences and drinking buckets
and udder swabs from animals was consistently higher on farm B in comparison to farm A. This may be explained by the geographical locations of the farms, since farm B is located in a highly Q fever affected area (Noord-Brabant), while farm A is located in an area not affected by Q fever (Noord-Holland).
How these results are related to shedding of C. burnetii by the non-dairy sheep on these farms is not clear. No positive relationship was found between C.
burnetii content in vaginal swabs and udder swabs. Coxiella burnetii
contamination of sheep udders may be a result from excrements from the same animal, direct contact with other animals (or other contaminated surfaces), or a combination of these.
Keywords:
Coxiella burnetii, Q fever, Molecular detection, Sheep
Trefwoorden:
Contents
1 Potential sources for human Q fever in the Netherlands—7 1.1 Dairy goat farms as potential source for human Q fever—7 1.2 Non-dairy sheep farms as potential source for human Q fever—7
2 Material and Methods—9
2.1 Selection of non-dairy sheep farms—9
2.2 Sampling procedures for animal and environmental matrices—9 2.3 Sample processing and DNA extraction procedures—10
2.4 Detection of C. burnetii DNA by multiplex real time PCR (qPCR)—10 2.5 Quantification of C. burnetii DNA—10
3 Detection of C. burnetii DNA on non-dairy sheep farms—13 3.1 Comparing C. burnetii DNA content in matrices between farms—13 3.2 Comparing C. burnetii DNA content in matrices within farms—15
4 Discussion—17
5 Conclusions—19
6 Recommendations—21
7 Appendix—23
7.1 Results of individual animals for two non-dairy sheep farms—23 7.2 Detection & quantification of C. burnetii by multiplex qPCR—25 7.2.1 PCR assays for the detection of C. burnetii DNA—25
7.2.2 Multiplex qPCR and assessment of C. burnetii DNA content—26 7.2.3 Qualitative assessment of C. burnetii DNA—26
7.2.4 Quantitative assessment of C. burnetii DNA—26
7.3 Important aspects for quantitative assessment of C. burnetii DNA—27
1
Potential sources for human Q fever in the Netherlands
1.1 Dairy goat farms as potential source for human Q fever
During the spring and summer of 2007, 2008 and 2009, large Q fever outbreaks occurred in the Netherlands, which affected a rural area in the southeast of the country. Prior to and during these outbreaks, abortion waves were reported on several dairy goat farms in the same region (32). Since most animals show no clinical symptoms of infection by Coxiella burnetii, aborting animals were tested using serology and were often diagnosed with Q fever. In addition, Q fever source-finding investigations conducted in 2008 and 2009 revealed that C.
burnetii DNA was found on many commercial dairy goat farms (8, 13). As a
result of these experimental findings, amongst many other indications, commercial dairy goat farms were primarily implicated as sources for the emerging human Q fever cases in the Netherlands (16, 27, 32).
In several studies, conducted primarily on dairy goat farms during outbreaks in 2008 and 2009, we showed that C. burnetii (DNA) is present in relatively high concentrations on dust accumulating horizontal surface areas when compared to vaginal swabs obtained from animals in the same stables (8, 11, 13).
Vaginal swabs obtained from animals provide information on shedding of the C.
burnetii bacterium at the moment of sampling only, since it is well known that C. burnetii shedding by animals may vary over time (2, 3). In contrast, C. burnetii
contaminated dust may accumulate over longer periods of time and can be transported out of the stable during normal farming procedures. Moreover, C.
burnetii in the environment probably will remain infectious for months up to
years. This supports the hypothesis that the major route of transmission of C.
burnetii occurs via aerosolized contaminated dust particles (20, 24), which is
also supported by epidemiological studies (16, 27, 30).
1.2 Non-dairy sheep farms as potential source for human Q fever
The main focus during the source-finding investigations in 2008 and 2009 was on dairy goat farms. In 2008, however, five out of 29 farms screened for C.
burnetii presence were (non-dairy) sheep farms and on three of the farms C. burnetii DNA was present (10). One non-dairy sheep farm in the East of the
country was thought to be involved in the emergence of a cluster of human Q fever cases in its near vicinity (36). In 2009, twelve out of 56 farms selected during source-finding investigations were non-dairy sheep farms, and on ten of these farms C. burnetii DNA was present (9). One of these non-dairy sheep farms in the South-east of the country was implicated as the primary source for an emerging cluster of human Q fever cases in its near vicinity in 2009 (33). Farming procedures on (non-dairy) sheep farms differ in a number of ways from procedures on dairy goat farms. For instance, non-dairy sheep are generally kept outdoors on meadows, while dairy goats are mainly kept indoors.
In stables of dairy goat farms, the high concentration of goats, the accumulation of C. burnetii, and the more frequent occurrence of abortions are thought to play an important role in transmission of C. burnetii to humans. The major mode of transmission of C. burnetii from non-dairy sheep to humans in the Netherlands is not clear.
In the current study, we describe the presence of C. burnetii in animal and environmental matrices obtained from two non-dairy sheep farms.
2
Material and Methods
2.1 Selection of non-dairy sheep farms
The two non-dairy sheep farms investigated in this study are included in a larger human-veterinary integrated Q fever study (Q-VIVE), which is funded by ZonMw (Netherlands Organisation for Health Research and Development), VWS (Ministry of Health, Welfare and Sport), EL&I (Ministry of Economic Affairs, Agriculture and Innovation), and the Food and Consumer Product Safety Authority (nVWA). In this larger project, epidemiological aspects of Q fever are investigated in both humans and animals on goat, sheep and cattle farms. The two selected non-dairy sheep farms were visited by an employee of the Food and Consumer Product Safety Authority (nVWA) on 20-09-2010 (farm A) and 27-09-2010 (Farm B) to collect samples from several animal and environmental matrices.
Farm A is located in the province of Noord-Holland in a part of the Netherlands not affected by Q fever. Sheep are kept on meadows nearby the farm, except during lambing season (March-June) when they are kept indoors in stables. Based on data from bulk milk (tank) monitoring, the nearest Q fever affected (goat) farm is located on about 5.5 km distance from this farm.
Farm B is located in Noord-Brabant in the area in the Netherlands most affected by Q fever during the epidemics in 2007, 2008, and 2009. Sheep are kept outdoors on meadows nearby the farm from April to December and are kept the rest of the year indoors in stables. The nearest Q fever affected (goat) farm is located on about 8.5 km distance from this farm.
2.2 Sampling procedures for animal and environmental matrices
On both farms, samples were obtained from both animal and environmental matrices. Animal samples were obtained from a subset of the sheep population. From 30 animals, both vaginal and udder swabs were obtained, and 5 manure droppings were collected from the meadow. In addition, environmental matrices were represented by surface area swabs and aerosols. Ten surface area swabs were obtained from drinking buckets and fences. Two aerosol samples were obtained from within the herd and four aerosol samples were collected on 500 m distance from the herd in all four wind directions (North, East, South, and West). Surface area swabs and vaginal swabs and udder swabs of animals were taken using sterile cotton swabs (VWR International, the Netherlands). Manure samples were collected by adding sheep droppings to Phosphate-buffered Saline (PBS) in 50 ml Greiner tubes (Greiner Bio-one, the Netherlands), using a 1:2 ratio of manure and PBS. Aerosol samples were collected by using a Sartorius MD8 Airport. Aerosols were captured on nitrate-cellulose filters (pore size 8 µm), by sampling 500L of air using the pre-installed program of 10 minutes sampling with an air flow of 50L per minute. After collection, all obtained environmental and animal samples were transported to the laboratory, and stored at -20 ºC.
2.3 Sample processing and DNA extraction procedures
Animal and environmental samples were processed and DNA was extracted using the NucliSENS Magnetic Extraction kit (Biomerieux, France).
Small modifications were made to the manufacturer’s guidelines for DNA extraction from animal and environmental matrices. Surface area swabs and vaginal swabs were added to 10 ml of NucliSens lysisbuffer, vortexed for 10 sec, incubated for 10 minutes and then removed. Manure samples (suspension of 1:2 ratio of manure and PBS) were homogenized for about 2 hours on a rotating tube holder at 10 rpm. Greiner tubes were centrifuged (Varifuge 3.2RS, Heraeus) at 2000 rpm for 10 minutes. The supernatant was transferred to a new Greiner tube, and 1 ml of supernatant was added to 10 ml of NucliSens lysisbuffer. Cellulose Nitrate filters, used in aerosol sample collection, were placed in petri dishes and submerged in 10 ml NucliSens lysisbuffer. Petri-dishes were then placed on a horizontal shaker for 2 hours at 50 rpm, after which the filters were removed. The lysisbuffer was transferred from the Petri dishes to 15 ml Greiner tubes.
As internal control, 50 µl of a B. thuringiensis spore suspension (1.2 x 10⁵
spores) was added to each sample. All samples were placed at room temperature for one hour to complete lysis. From this point onwards, DNA isolation procedures were carried out according to the manufacturer’s protocol. 2.4 Detection of C. burnetii DNA by multiplex real time PCR (qPCR)
The set-up of a modified multiplex real time PCR assay (qPCR) for C. burnetii was described elsewhere (12). One single copy target (icd) was removed from the assay since one single copy target (com1) proved to be sufficient for screening purposes. For target sequences of com1 and IS1111, new primers and new (hydrolysis) probes were designed using software package Visual OMP 6. The qPCR assays were carried out on a LightCycler 480 Instrument (Roche Diagnostics Nederland B.V, Almere, the Netherlands). For all qPCR experiments we included positive and negative (no template) controls and each sample was tested undiluted, and in 10-fold and 100-fold diluted samples. All dilutions were tested in triplicate. Analysis of the data was performed on the software provided by Roche (LightCycler 480 Software release 1.5.0. SP3).
2.5 Quantification of C. burnetii DNA
The aspects regarding the quantification of C. burnetii (DNA) are described extensively in the appendix.
Due to its presence in multiple copies within the C. burnetii genome (17), amplification of target IS1111 is expected to occur before amplification of the single copy target com1. This leads to a very sensitive detection of C. burnetii DNA in comparison to detection using single copy genes like com1. However, it is unknown how many IS1111 copies are present in the genome of the different
C. burnetii types circulating in the Netherlands. The number of IS1111 copies
has been reported to range between 7 and 110 copies per isolate (17), which complicates the quantification of the number of organisms when based on this target sequence only.
Therefore, to make a qualitative distinction between low and high levels of C.
burnetii DNA, samples are scored as IS1111-positive (low C. burnetii DNA
Samples were scored as negative when none of the two C. burnetii targets showed a positive signal, whereas the internal control cry1 showed a positive result.
This way, the amplified single copy (com1) and multicopy (IS1111) targets were used not only to confirm C. burnetii presence, but also to qualitatively estimate the C. burnetii DNA content when calibration curves for quantification in complex matrices are not available.
In addition, within the classes of low and high levels of C. burnetii DNA content, the level of C. burnetii DNA content is indicated by Cq values for targets com1 and IS1111. Cq values represent the PCR cycles at which amplified DNA of targets com1 and IS1111 is detected. Therefore, samples with high C. burnetii DNA load show lower Cq values for targets com1 and IS1111 than samples with low C. burnetii DNA content.
Since information on Cq values for single copy target com1 is very limited, the assessment of C. burnetii DNA is based primarily on Cq values for target
IS1111, with the above mentioned reservations on copy numbers per C. burnetii
strain taken into account. Therefore, the quantity of C. burnetii DNA is indicated by Cq values for each matrix, and is not expressed as the number of C. burnetii organisms present. A more extensive discussion on the aspects of C. burnetii quantification is described in appendix 7.2.
3
Detection of C. burnetii DNA on non-dairy sheep farms
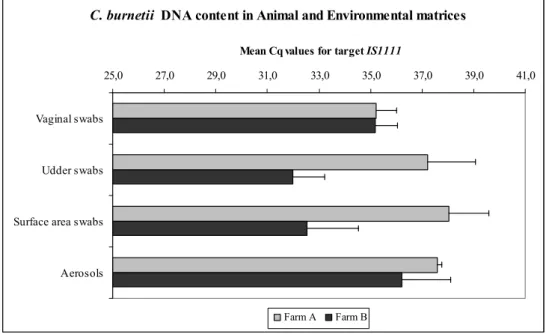
The presence of C. burnetii DNA in vaginal swabs, udder swabs, manure, surface area swabs, and aerosols obtained from 2 non-dairy sheep farms (A & B) is summarised in Table 1, and visualized in Figures 1 & 2. The results for vaginal swabs and udder swabs of individual animals for both farms are given in supplemental Tables 2 & 3 in Appendix 7.1.
3.1 Comparing C. burnetii DNA content in matrices between farms
Overall, on farm A, 32 samples (41%) were found positive for C. burnetii DNA and on farm B 72 samples (92%). The highest C. burnetii DNA content, based on the Cq values for target IS1111, was found on farm A in DNA extracts from vaginal swabs, and on farm B in DNA extracts from udder swabs. The lowest C.
burnetii DNA content (highest Cq values) were found on farm A in DNA extracts
obtained from surface area swabs, and on farm B in DNA extracts from aerosol samples.
Between farms, C. burnetii DNA content in udder swabs and surface area swabs was significantly higher on farm B than on farm A (p<0.011). C. burnetii DNA
content in vaginal swabs (p= 0.8871) and aerosol samples (p= 0.8001) was not
significantly different between the two farms.
C. burnetii DNA content in Animal and Environmental matrices
25,0 27,0 29,0 31,0 33,0 35,0 37,0 39,0 41,0
Vaginal swabs
Udder swabs
Surface area swabs
Aerosols
Mean Cq values for target IS1111
Farm A Farm B
Figure 1. Between farm comparisons of C. burnetii DNA content in four different matrices obtained from two non-dairy sheep farms. High Cq values for target
IS1111 indicate low C. burnetii DNA content. 1 Non-parametric Mann-Whitney U test
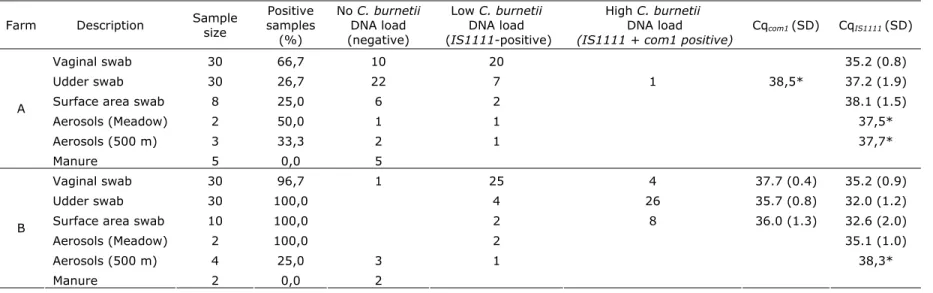
Table 1. C. burnetii DNA content in various animal and environmental matrices on two non-dairy sheep farms.
Farm Description Sample size samples Positive (%) No C. burnetii DNA load (negative) Low C. burnetii DNA load (IS1111-positive) High C. burnetii DNA load
(IS1111 + com1 positive) Cqcom1 (SD) CqIS1111 (SD)
Vaginal swab 30 66,7 10 20 35.2 (0.8)
Udder swab 30 26,7 22 7 1 38,5* 37.2 (1.9)
Surface area swab 8 25,0 6 2 38.1 (1.5)
Aerosols (Meadow) 2 50,0 1 1 37,5* Aerosols (500 m) 3 33,3 2 1 37,7* A Manure 5 0,0 5 Vaginal swab 30 96,7 1 25 4 37.7 (0.4) 35.2 (0.9) Udder swab 30 100,0 4 26 35.7 (0.8) 32.0 (1.2)
Surface area swab 10 100,0 2 8 36.0 (1.3) 32.6 (2.0)
Aerosols (Meadow) 2 100,0 2 35.1 (1.0)
Aerosols (500 m) 4 25,0 3 1 38,3*
B
Manure 2 0,0 2
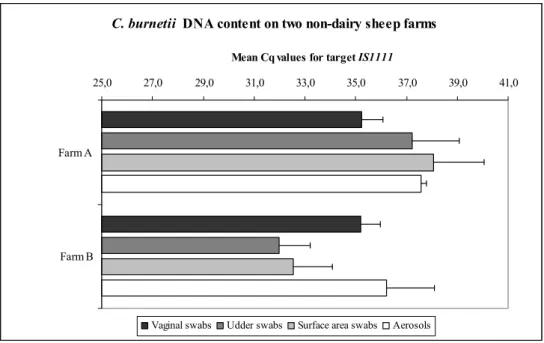
3.2 Comparing C. burnetii DNA content in matrices within farms
Within farms, a number of matrices differed significantly in C. burnetii DNA content. On farm A, C. burnetii DNA content in vaginal swabs was significantly higher than in surface area swabs (p<0.011). On farm B this pattern was
reversed, with a significantly higher C. burnetii DNA content in surface areas swabs compared to vaginal swabs (p<0.011). In addition, C. burnetii DNA
content in udder swabs was significantly higher than in vaginal swabs on farm B (p<0.012). On farm A, no significant difference was found between udder swabs
and vaginal swabs (p=0.3452).
Finally, we tested whether there was a positive relationship between C. burnetii DNA content in vaginal swabs and udder swabs. On both farms no positive correlation was found between C. burnetii content in vaginal swabs and udder swabs (p=0.2853 and p=0.6753 for farms A and B respectively).
C. burnetii DNA content on two non-dairy sheep farms
25,0 27,0 29,0 31,0 33,0 35,0 37,0 39,0 41,0
Farm A
Farm B
Mean Cq values for target IS1111
Vaginal swabs Udder swabs Surface area swabs Aerosols
Figure 2. Within farm comparison of C. burnetii DNA content on two non-dairy sheep farms, obtained from four different matrices. High Cq values for target
IS1111 indicate low C. burnetii DNA content.
2 Non-parametric Wilcoxon signed rank tests 3 Speaman’s rank order correlation
4
Discussion
The results of this study on two non-dairy sheep farms show that C. burnetii DNA is present in both animals and environmental matrices within the sheep herd and in the direct surroundings of the herd. C. burnetii DNA content in surface area swabs and udder swabs was found consistently higher on farm B in comparison to farm A. This may be explained by the geographical location of the two farms. Farm B is located in a highly Q fever affected area (Noord-Brabant), while farm A is located in an area not affected by Q fever (Noord-Holland). How these results are related to shedding of C. burnetii by the non-dairy sheep on these farms is not clear. On both farms, no positive relationship was found between C. burnetii content in vaginal swabs and udder swabs. This result may be explained by the difference of the matrices examined and/or the moment of sampling. Vaginal swabs provide information on shedding of C. burnetii by animals at the moment of sampling only. Udder swabs may provide information on shedding over a longer period of time. Coxiella burnetii excreted via vaginal mucus, manure, and urine may contaminate and accumulate on udders over prolonged periods of time. On farm A, no significant difference in C. burnetii DNA content was found between vaginal swabs and udder swabs. This indicates that at the moment of sampling the sheep were shedding C. burnetii (20 out of 30 animal samples), and contamination of udders is therefore very likely.
On farm B, however, C. burnetii DNA content in udder swabs is consistently higher than in vaginal swabs. This may indicate that at the moment of sampling, excretion of C. burnetii by the animals was very low. This may explain the lack of a positive correlation between C. burnetii DNA content in vaginal swabs and udder swabs on both farms A and B.
Coxiella burnetii contamination of sheep udders is most probably a result from
excrements from the same animal. However, other possibilities, like direct contact with other animals or other contaminated surfaces, or a combination thereof cannot be ruled out.
5
Conclusions
• C. burnetii DNA is present on the selected non-dairy sheep farms. • The number of positive samples on farm B is higher than on farm A.
• C. burnetii DNA content in surface area swabs and udder swabs was significantly higher on farm B than on farm A.
• On farm A, C. burnetii DNA content in vaginal swabs was significantly higher than in surface area swabs.
• On farm B, C. burnetii DNA content in udder swabs and surface area swabs was significantly higher than in vaginal swabs.
• On both farms, no clear relationship was found in C. burnetii DNA content between vaginal swabs and udder swabs.
6
Recommendations
To obtain a better understanding of the relationship between animal and environmental matrices concerning the C. burnetii DNA content, we propose time series analyses of C. burnetii DNA content in vaginal swabs and udder swabs of the same animals, and surface area swabs obtained from the direct surroundings of the herd.
In addition, the viability of C. burnetii organisms present in animal and environmental matrices cannot be assessed using the current qPCR assay. We propose that the assessment of viability of C. burnetii organisms will be an important aspect of the ‘VWA kennisvraag’ Coxiella in 2012. We propose the setup of a relatively new approach to distinguish between viable and dead C.
burnetii organisms using a technique referred to as viability PCR.
Finally, we have added a document in the appendix in which we describe the different aspects for the quantification of C. burnetii DNA in general and by using our multiplex qPCR for C. burnetii in particular. These aspects have to be addressed before an accurate quantification of the number of C. burnetii organisms in animal and environmental matrices can be achieved.
Acknowledgements
We would like to thank veterinarian Roel Paauwe of the Food and Consumer Product Safety Authority for his efforts in sampling of the farms, and the sheep farmers for their cooperation.
RIVM Letter report 330071001
7
Appendix
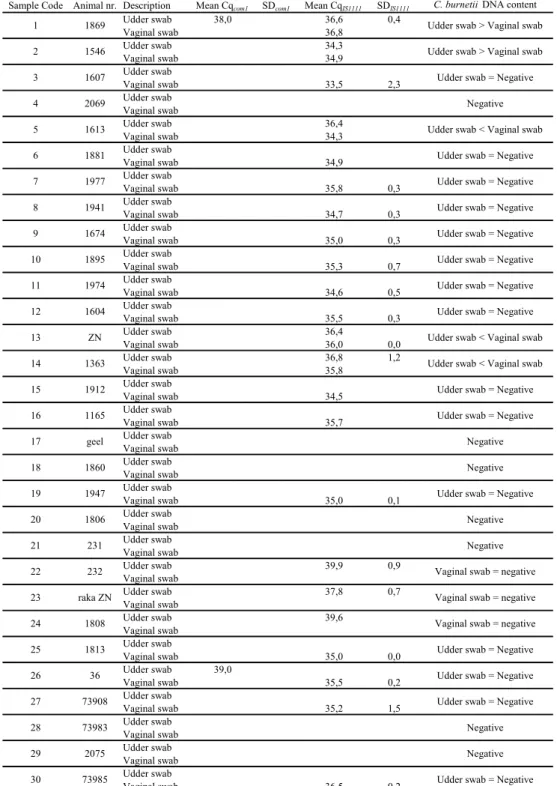
7.1 Results of individual animals for two non-dairy sheep farms
Table 2. Results for vaginal and udder swabs for individual animals of farm A.
Sample Code Animal nr. Description Mean Cqcom1 SDcom1 Mean CqIS1111 SDIS1111 C. burnetii DNA content
Udder swab 38,0 36,6 0,4 Vaginal swab 36,8 Udder swab 34,3 Vaginal swab 34,9 Udder swab Vaginal swab 33,5 2,3 Udder swab Vaginal swab Udder swab 36,4 Vaginal swab 34,3 Udder swab Vaginal swab 34,9 Udder swab Vaginal swab 35,8 0,3 Udder swab Vaginal swab 34,7 0,3 Udder swab Vaginal swab 35,0 0,3 Udder swab Vaginal swab 35,3 0,7 Udder swab Vaginal swab 34,6 0,5 Udder swab Vaginal swab 35,5 0,3 Udder swab 36,4 Vaginal swab 36,0 0,0 Udder swab 36,8 1,2 Vaginal swab 35,8 Udder swab Vaginal swab 34,5 Udder swab Vaginal swab 35,7 Udder swab Vaginal swab Udder swab Vaginal swab Udder swab Vaginal swab 35,0 0,1 Udder swab Vaginal swab Udder swab Vaginal swab Udder swab 39,9 0,9 Vaginal swab Udder swab 37,8 0,7 Vaginal swab Udder swab 39,6 Vaginal swab Udder swab Vaginal swab 35,0 0,0 Udder swab 39,0 Vaginal swab 35,5 0,2 Udder swab Vaginal swab 35,2 1,5 Udder swab Vaginal swab Udder swab Vaginal swab Udder swab Vaginal swab 36,5 0,2
Udder swab > Vaginal swab Udder swab > Vaginal swab
Udder swab = Negative Negative Negative Udder swab = Negative Udder swab = Negative Udder swab = Negative Vaginal swab = negative Vaginal swab = negative Udder swab = Negative Udder swab = Negative Udder swab = Negative Udder swab = Negative Udder swab = Negative Udder swab < Vaginal swab
Negative Udder swab = Negative
Negative Negative Udder swab = Negative Udder swab = Negative Udder swab < Vaginal swab Udder swab < Vaginal swab Udder swab = Negative Udder swab = Negative 1869 73985 2075 73983 73908 36 ZN 1604 1974 1895
Vaginal swab = negative Negative Negative Udder swab = Negative
1813 1808 raka ZN 232 1607 1546 1674 1941 1977 1881 1613 2069 231 1806 1947 1860 geel 1165 1912 1363 26 25 9 8 13 12 11 10 17 16 30 29 28 27 1 3 2 7 6 5 4 15 14 18 24 23 22 21 20 19
RIVM Letter report 330071001
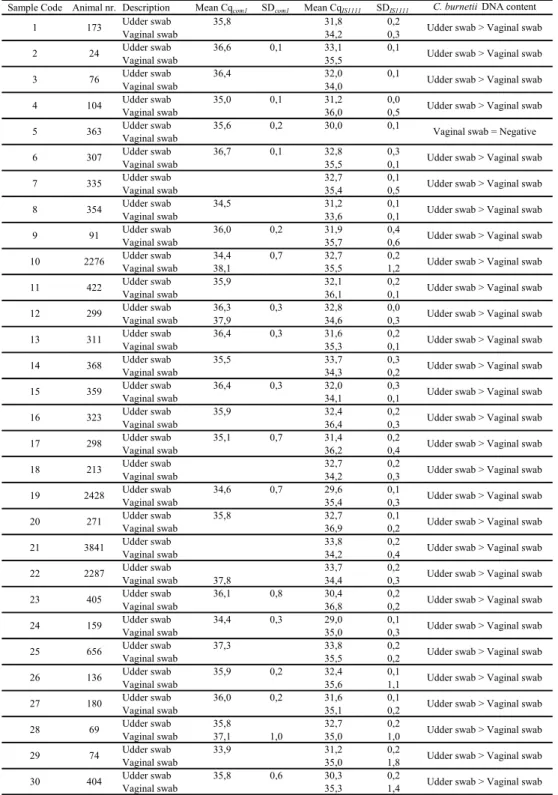
Table 3. Results for vaginal and udder swabs for individual animals of farm B.
Sample Code Animal nr. Description Mean Cqcom1 SDcom1 Mean CqIS1111 SDIS1111 C. burnetii DNA content
Udder swab 35,8 31,8 0,2 Vaginal swab 34,2 0,3 Udder swab 36,6 0,1 33,1 0,1 Vaginal swab 35,5 Udder swab 36,4 32,0 0,1 Vaginal swab 34,0 Udder swab 35,0 0,1 31,2 0,0 Vaginal swab 36,0 0,5 Udder swab 35,6 0,2 30,0 0,1 Vaginal swab Udder swab 36,7 0,1 32,8 0,3 Vaginal swab 35,5 0,1 Udder swab 32,7 0,1 Vaginal swab 35,4 0,5 Udder swab 34,5 31,2 0,1 Vaginal swab 33,6 0,1 Udder swab 36,0 0,2 31,9 0,4 Vaginal swab 35,7 0,6 Udder swab 34,4 0,7 32,7 0,2 Vaginal swab 38,1 35,5 1,2 Udder swab 35,9 32,1 0,2 Vaginal swab 36,1 0,1 Udder swab 36,3 0,3 32,8 0,0 Vaginal swab 37,9 34,6 0,3 Udder swab 36,4 0,3 31,6 0,2 Vaginal swab 35,3 0,1 Udder swab 35,5 33,7 0,3 Vaginal swab 34,3 0,2 Udder swab 36,4 0,3 32,0 0,3 Vaginal swab 34,1 0,1 Udder swab 35,9 32,4 0,2 Vaginal swab 36,4 0,3 Udder swab 35,1 0,7 31,4 0,2 Vaginal swab 36,2 0,4 Udder swab 32,7 0,2 Vaginal swab 34,2 0,3 Udder swab 34,6 0,7 29,6 0,1 Vaginal swab 35,4 0,3 Udder swab 35,8 32,7 0,1 Vaginal swab 36,9 0,2 Udder swab 33,8 0,2 Vaginal swab 34,2 0,4 Udder swab 33,7 0,2 Vaginal swab 37,8 34,4 0,3 Udder swab 36,1 0,8 30,4 0,2 Vaginal swab 36,8 0,2 Udder swab 34,4 0,3 29,0 0,1 Vaginal swab 35,0 0,3 Udder swab 37,3 33,8 0,2 Vaginal swab 35,5 0,2 Udder swab 35,9 0,2 32,4 0,1 Vaginal swab 35,6 1,1 Udder swab 36,0 0,2 31,6 0,1 Vaginal swab 35,1 0,2 Udder swab 35,8 32,7 0,2 Vaginal swab 37,1 1,0 35,0 1,0 Udder swab 33,9 31,2 0,2 Vaginal swab 35,0 1,8 Udder swab 35,8 0,6 30,3 0,2 Vaginal swab 35,3 1,4
Udder swab > Vaginal swab Udder swab > Vaginal swab Udder swab > Vaginal swab Udder swab > Vaginal swab Udder swab > Vaginal swab Udder swab > Vaginal swab Udder swab > Vaginal swab Udder swab > Vaginal swab Udder swab > Vaginal swab Udder swab > Vaginal swab Udder swab > Vaginal swab Udder swab > Vaginal swab Udder swab > Vaginal swab Udder swab > Vaginal swab Udder swab > Vaginal swab Udder swab > Vaginal swab Udder swab > Vaginal swab Udder swab > Vaginal swab 1 2 3 4 5 6 7 8 9 10 11 12 13 14 15 16 17 18 19 20 21 22 23 24 25 26 27 28 29 30 2276 91 422 271 2428 213 298 323 354 335 307 363 104 76 24 173 359 368 311 299 404 74 69 180 136 656 159 405 2287 3841
Udder swab > Vaginal swab Udder swab > Vaginal swab Udder swab > Vaginal swab Udder swab > Vaginal swab Vaginal swab = Negative Udder swab > Vaginal swab Udder swab > Vaginal swab Udder swab > Vaginal swab Udder swab > Vaginal swab Udder swab > Vaginal swab Udder swab > Vaginal swab Udder swab > Vaginal swab
7.2 Detection & quantification of C. burnetii by multiplex qPCR
7.2.1 PCR assays for the detection of C. burnetii DNA
Several PCR based diagnostic assays have been developed for the detection of
C. burnetii DNA and have been used primarily for clinical samples (21, 29, 34).
More recently, other types of PCR assays, like nested PCR (31, 35), and qPCR (4, 6, 17) have been developed, sometimes in combination with high-throughput capabilities (23). PCR based methods target one or more specific sequences in the genome, most often in separate (singleplex) assays. Signature sequences most commonly used for the detection of C. burnetii DNA are plasmid sequences (QpH1 or QpRS), or chromosomal genes such as the isocitrate-dehydrogenase gene (icd), the outer membrane protein coding gene com1, the superoxide dismutase gene (sod), or the transposase gene in insertion element IS1111. The latter target is a preferred target for PCR assays due to its presence in multiple copies within the genome, thereby enhancing sensitivity of detection (17, 28). However, since the number of IS1111 copies in the C. burnetii genome varies between strains, direct quantification of the number of organisms within a sample using this target is more complicated (8, 17). A reliable PCR based method for detection and quantification of C. burnetii DNA should therefore include at least one single copy marker for quantification and a multi-copy target (e.g. IS1111) for enhancing sensitivity of detection, preferentially in multiplex format and including an internal control. Most C. burnetii PCR assays have been designed as singleplex assays. Multiplexing PCR detection offers several advantages, including reduction of sample volume and handling time (reducing the analysis time, cost and opportunities for lab contamination). Also, false-negative results can be reduced through co-amplification of internal controls in each sample, and using multiple redundant genetic markers for each organism reduces the chance that strain variants are missed. For instance, there has been a debate on the existence of C. burnetii strains missing the IS1111 repetitive element (22, 26). Amplification of multiple signature sequences per organism will also reduce false-positive results in complex samples. False positives can be an issue if detection relies on single targets due to the presence of homologous sequences in related organisms, or unknown sources when analyzing environmental samples (18, 19).
Within the ‘VWA Kennisvraag’ for 2011, part 9.2.3D-6 is reserved for a comparison of the available qPCR assays for C. burnetii (both in theory and practice). This study will be a combination of peer reviewed literature and data obtained from national and international ring trials for C. burnetii detection using (q)PCR assays. The results of this study will be reported in a RIVM report in December of 2011, and together with this document will be the basis for an inventory on knowledge gaps in the quantification of C. burnetii DNA in animal and environmental matrices.
In the next paragraphs, the current methods used by RIVM for qualitative and quantitative assessment of C. burnetii DNA will be outlined. In addition, a number of important aspects will be discussed, which may be the basis for further research.
RIVM Letter report 330071001
7.2.2 Multiplex qPCR and assessment of C. burnetii DNA content
The design and performance of a novel multiplex real time PCR assay (qPCR) for detection of C. burnetii DNA in animal and environmental matrices is described elsewhere (7). This assay was modified by removing one single copy target (icd), as one single copy target (com1) proved to be sufficient for screening purposes. In addition, the sensitivity of the assay was improved, by the development of new primers and (hydrolysis) probes for targets com1 and
IS1111, using software package Visual OMP 6 (12). The design and qPCR
performance was guided by the MIQE guidelines (7) and tested in both international and national ring trials for the detection of C. burnetii in animal and environmental samples. The first ring trial was facilitated by the Veterinary Laboratories Agency, Weybridge, Addlestone, Surrey, United Kingdom (VLA), and results were published (15). The second ring trial was facilitated by RIVM-LZO and results were published in a RIVM report (5).
7.2.3 Qualitative assessment of C. burnetii DNA
Due to its presence of multiple copies within the C. burnetii genome, amplification of target IS1111 is expected to occur before amplification of the single copy target com1.
This leads to a very sensitive detection of C. burnetii DNA in comparison to detection using single copy genes like com1. However, it is unknown how many
IS1111 copies are present in the genome of the different C. burnetii types
circulating in the Netherlands. The number of IS1111 copies has been reported to range between 7 and 110 copies per isolate, which complicates the quantification of the number of organisms when based on this target sequence only (17). However, a qualitative distinction between low and high levels of C.
burnetii DNA can be made using the presence of different targets. Samples can
be categorised as low in C. burnetii DNA content, when only target IS1111 shows positive results. Samples can be categorised as high in C. burnetii content, when both targets com1 and IS1111 show positive results. Subsequently, samples can be scored as negative when none of both C. burnetii targets showed a positive signal, whereas the internal control cry1 showed a positive result. This way, the amplified single copy (com1) and multicopy (IS1111) targets were used not only to confirm C. burnetii presence, but also to qualitatively estimate the C. burnetii DNA content when calibration curves for quantification in complex matrices are not available.
7.2.4 Quantitative assessment of C. burnetii DNA
The quantification of C. burnetii DNA can be complicated not only by the target of choice, but also by a phenomenon referred to as qPCR inhibition. Various environmental and animal matrices are known to inhibit PCR assays, which may lead to underestimation of pathogens present in these matrices (1, 14, 25). For
C. burnetii, a method often used to correct for qPCR inhibition is to obtain
standard curves from potentially qPCR inhibiting matrices. For instance, known concentrations of C. burnetii DNA are spiked into goat milk and the Cq values obtained are compared to Cq values obtained from standard curves containing only C. burnetii DNA. (Personal communication by Piet Vellema, Animal Health Service). This way, the level of qPCR inhibition can be assessed for a particular matrix, in this case goat milk. An important assumption using this method is that in further quantification of C. burnetii DNA qPCR inhibition is the same for each sample and is constant over time for that particular matrix.
In our experience, however, qPCR inhibition can vary significantly between samples of the same matrix.
In an EL&I funded project in 2010, and in collaboration with the Central Veterinary Institute, we used a method in which qPCR inhibition was assessed in individual manure samples on basis of an internal control. As internal control for DNA extraction and qPCR amplification we use Bacillus thuringiensis spores, which are among the most resistant of microbial structures. DNA extraction from
B. thuringiensis spores can therefore be considered as a reliable indicator for
successful DNA extraction from other microbes, such as C. burnetii. In addition, the severity of qPCR inhibition can be assessed using the internal control by comparison of Cq values obtained from inhibiting environmental samples (Cq cry1
sample) to Cq values obtained from a positive control containing only B. thuringiensis DNA (Cq cry1 p.c)). This can be achieved using the following formula:
ΔCq cry1 = Cq cry1 sample – Cq cry1 p.c
The ΔCq cry1 is a measure for the level of qPCR inhibition in a particular sample.
The value of ΔCq cry1 can be subtracted from the Cq values obtained for C.
burnetii target sequences com1 (Cq com1 sample) and IS1111 (Cq IS1111 sample). This
way, a correction in Cq values can be obtained for qPCR inhibition. However, an important assumption using this method is that qPCR inhibition affects all three targets, (com1, IS1111, and cry1) to the same extent.
In addition, to investigate the impact of qPCR inhibition on both the internal control target cry1 and C. burnetii targets com1 and IS1111 targets amplified during multiplex qPCR, DNA extraction was performed on a sample previously tested negative for C. burnetii DNA, but which showed strong qPCR inhibition (8). Genomic DNA of C. burnetii and of the B. thuringiensis internal control were spiked into a dilution series of the PCR inhibiting DNA extract obtained from that sample. After qPCR, differences in PCR inhibition were assessed by comparing Cq values for all three targets in the dilutions. Results were not conclusive and minor differences were observed between Cq values for the internal control (cry
1) and C. burnetii targets (com1 and IS1111). The effect of qPCR inhibiting
substances on both the C. burnetii targets com1 and IS1111 and internal control target cry1 have to be studies in more detail, before it can be used to screen for presence for C. burnetii DNA in animal and environmental matrices known to inhibit qPCR.
7.3 Important aspects for quantitative assessment of C. burnetii DNA
As described above, current methods have different assumptions, which may affect the accuracy of the quantification of C. burnetii DNA. The first method, using standard curves spiked with potentially qPCR inhibiting matrices, has the assumption that each sample shows the same level of qPCR inhibition. However, in our experience this is often not the case.
The second method, in which the internal control target cry1 is used as correction for qPCR inhibition in each individual sample has the assumption that each target is affected by qPCR inhibition to the same extent.
Furthermore, quantification of C. burnetii DNA within samples is most accurately assessed using single copy genes, like com1. The com1 gene is present in a single copy within the C. burnetii genome, and can be related to a single organism of C. burnetii (1 copy of target com1 = 1 C. burnetii genome = 1 organism). This in contrast to the multicopy insertion element IS1111, which can be present in multiple copies within the C. burnetii genome (17).
RIVM Letter report 330071001
Quantification using only this C. burnetii target is not very accurate. First, the number of IS1111 copies within the genome of the C. burnetii strains circulating in the Netherlands is unknown. In addition, even when this last information can be obtained, an assumption has to be made that each IS1111 copy is amplified with the same efficiency for accurate quantification.
8
Literature
1. Abolmaaty, A., W. Gu, R. Witkowsky, and R. E. Levin. 2007. The use of activated charcoal for the removal of PCR inhibitors from oyster samples. J Microbiol Methods 68:349-352.
2. Astobiza, I., J. F. Barandika, A. Hurtado, R. A. Juste, and A. L. Garcia-Perez. 2010. Kinetics of Coxiella burnetii excretion in a commercial dairy sheep flock after treatment with oxytetracycline. Vet J 184:172-175.
3. Astobiza, I., J. F. Barandika, F. Ruiz-Fons, A. Hurtado, I. Povedano, R. A. Juste, and A. L. Garcia-Perez. 2010. Coxiella burnetii shedding and environmental contamination at lambing in two highly naturally-infected dairy sheep flocks after vaccination. Res Vet Sci.
4. Boulos, A., J. M. Rolain, M. Maurin, and D. Raoult. 2004.
Measurement of the antibiotic susceptibility of Coxiella burnetii using real time PCR. Int J Antimicrob Agents 23:169-174.
5. Braks, M., Koopmans, M., Havelaar, A., Langelaar, M., Notermans, D., Schimmer, B., Ransz, W., Van der Giessen, J., Van Duynhoven, Y., van Rotterdam, B. 2010. Emerging Zoonoses: Early warning and surveillance in the Netherlands. RIVM report 330214002.
6. Brennan, R. E., and J. E. Samuel. 2003. Evaluation of Coxiella burnetii antibiotic susceptibilities by real-time PCR assay. J Clin Microbiol 41:1869-1874.
7. Bustin, S. A., V. Benes, J. A. Garson, J. Hellemans, J. Huggett, M. Kubista, R. Mueller, T. Nolan, M. W. Pfaffl, G. L. Shipley, J. Vandesompele, and C. T. Wittwer. 2009. The MIQE guidelines: minimum information for publication of quantitative real-time PCR experiments. Clin Chem 55:611-622.
8. de Bruin, A., A. de Groot, L. de Heer, J. Bok, P. R. Wielinga, M. Hamans, B. J. van Rotterdam, and I. Janse. 2011. Detection of Coxiella burnetii in Complex Matrices by Using Multiplex Quantitative PCR during a Major Q Fever Outbreak in The Netherlands. Appl Environ Microbiol 77:6516-6523.
9. de Bruin A, J., I., Rotterdam, B.J. 2009. Molecular detection and typing of Coxiella burnetii. RIVM Report 330291002.
10. de Bruin A, , de Heer DN, Paauwe R, Schimmer B, Vellema PR, van Rotterdam BJ, van Duynhoven, Y. 2011. Detection of Coxiella burnetii on small ruminant farms during a Q fever outbreak in the Netherlands. Applied and Environmental Microbiology Submitted.
11. de Bruin A, van Rotterdam, B.J. 2009. Environmental sources for Coxiella burnetii infection and their role in transmission of Q fever. RIVM report 330291001.
12. de Bruin A, van Rotterdam, B.J. 2010. Q fever: the answer is blowing in the wind. RIVM Report 330291005.
13. de Bruin A., van Rotterdam, B.J. 2009. A Query for Coxiella in veterinary and environmental matrices. RIVM Report 330291003.
14. Huggett, J. F., T. Novak, J. A. Garson, C. Green, S. D. Morris-Jones, R. F. Miller, and A. Zumla. 2008. Differential susceptibility of PCR reactions to inhibitors: an important and unrecognised phenomenon. BMC Res Notes 1:70.
RIVM Letter report 330071001
15. Jones, R. M., S. Hertwig, J. Pitman, R. Vipond, A. Aspan, G. Bolske, C. McCaughey, J. P. McKenna, B. J. van Rotterdam, A. de Bruin, R. Ruuls, R. Buijs, H. J. Roest, and J. Sawyer. 2011. Interlaboratory comparison of real-time polymerase chain reaction methods to detect Coxiella burnetii, the causative agent of Q fever. J Vet Diagn Invest 23:108-111.
16. Karagiannis, I., B. Schimmer, A. Van Lier, A. Timen, P.
Schneeberger, B. Van Rotterdam, A. De Bruin, C. Wijkmans, A. Rietveld, and Y. Van Duynhoven. 2009. Investigation of a Q fever outbreak in a rural area of The Netherlands. Epidemiol Infect 137:1283-1294.
17. Klee, S. R., J. Tyczka, H. Ellerbrok, T. Franz, S. Linke, G. Baljer, and B. Appel. 2006. Highly sensitive real-time PCR for specific detection and quantification of Coxiella burnetii. BMC Microbiol 6:2. 18. Kuske, C. R., S. M. Barns, C. C. Grow, L. Merrill, and J. Dunbar.
2006. Environmental survey for four pathogenic bacteria and closely related species using phylogenetic and functional genes. J Forensic Sci 51:548-558.
19. Luna, V. A., D. S. King, K. K. Peak, F. Reeves, L. Heberlein-Larson, W. Veguilla, L. Heller, K. E. Duncan, A. C. Cannons, P. Amuso, and J. Cattani. 2006. Bacillus anthracis virulent plasmid pX02 genes found in large plasmids of two other Bacillus species. J Clin Microbiol 44:2367-2377.
20. Madariaga, M. G., K. Rezai, G. M. Trenholme, and R. A. Weinstein. 2003. Q fever: a biological weapon in your backyard. Lancet Infect Dis 3:709-721.
21. Mallavia, L. P., L. L. Whiting, M. F. Minnick, R. Heinzen, D. Reschke, M. Foreman, O. G. Baca, and M. E. Frazier. 1990. Strategy for detection and differentiation of Coxiella burnetii strains using the polymerase chain reaction. Ann N Y Acad Sci 590:572-581.
22. Marmion, B. P., P. A. Storm, J. G. Ayres, L. Semendric, L. Mathews, W. Winslow, M. Turra, and R. J. Harris. 2005. Long-term persistence of Coxiella burnetii after acute primary Q fever. QJM 98:7-20.
23. Panning, M., J. Kilwinski, S. Greiner-Fischer, M. Peters, S. Kramme, D. Frangoulidis, H. Meyer, K. Henning, and C. Drosten. 2008. High throughput detection of Coxiella burnetii by real-time PCR with internal control system and automated DNA preparation. BMC Microbiol 8:77.
24. Parker, N. R., J. H. Barralet, and A. M. Bell. 2006. Q fever. Lancet 367:679-688.
25. Ramirez, N. E., and S. Sreevatsan. 2006. Development of a sensitive detection system for Cryptosporidium in environmental samples. Vet Parasitol 136:201-213.
26. Rolain, J. M., and D. Raoult. 2005. Molecular detection of Coxiella burnetii in blood and sera during Q fever. QJM 98:615-617; author reply 617-620.
27. Schimmer, B., R. Ter Schegget, M. Wegdam, L. Zuchner, A. de Bruin, P. M. Schneeberger, T. Veenstra, P. Vellema, and W. van der Hoek. 2010. The use of a geographic information system to identify a dairy goat farm as the most likely source of an urban Q-fever outbreak. BMC Infect Dis 10:69.
28. Seshadri, R., I. T. Paulsen, J. A. Eisen, T. D. Read, K. E. Nelson, W. C. Nelson, N. L. Ward, H. Tettelin, T. M. Davidsen, M. J. Beanan, R. T. Deboy, S. C. Daugherty, L. M. Brinkac, R. Madupu, R. J. Dodson, H. M. Khouri, K. H. Lee, H. A. Carty, D. Scanlan, R. A. Heinzen, H. A. Thompson, J. E. Samuel, C. M. Fraser, and J. F. Heidelberg. 2003. Complete genome sequence of the Q-fever pathogen Coxiella burnetii. Proc Natl Acad Sci U S A 100:5455-5460.
29. Stein, A., and D. Raoult. 1992. Detection of Coxiella burnetti by DNA amplification using polymerase chain reaction. J Clin Microbiol 30:2462-2466.
30. Tissot-Dupont, H., M. A. Amadei, M. Nezri, and D. Raoult. 2004. Wind in November, Q fever in December. Emerg Infect Dis 10:1264-1269.
31. To, H., N. Kako, G. Q. Zhang, H. Otsuka, M. Ogawa, O. Ochiai, S. V. Nguyen, T. Yamaguchi, H. Fukushi, N. Nagaoka, M. Akiyama, K. Amano, and K. Hirai. 1996. Q fever pneumonia in children in Japan. J Clin Microbiol 34:647-651.
32. Van Steenbergen, J. E., G. Morroy, C. A. Groot, F. G. Ruikes, J. H. Marcelis, and P. Speelman. 2007. [An outbreak of Q fever in The Netherlands--possible link to goats]. Ned Tijdschr Geneeskd 151:1998-2003.
33. Whelan, J., B. Schimmer, A. De Bruin, M. Van Beest Holle, W. Van Der Hoek, and R. Ter Schegget. 2011. Visits on 'lamb-viewing days' at a sheep farm open to the public was a risk factor for Q fever in 2009. Epidemiol Infect:1-7.
34. Willems, H., D. Thiele, R. Frolich-Ritter, and H. Krauss. 1994. Detection of Coxiella burnetii in cow's milk using the polymerase chain reaction (PCR). Zentralbl Veterinarmed B 41:580-587.
35. Zhang, G. Q., S. V. Nguyen, H. To, M. Ogawa, A. Hotta, T. Yamaguchi, H. J. Kim, H. Fukushi, and K. Hirai. 1998. Clinical evaluation of a new PCR assay for detection of Coxiella burnetii in human serum samples. J Clin Microbiol 36:77-80.
36 Koene, R. P., B. Schimmer, H. Rensen, M. Biesheuvel, A. de Bruin, A. Lohuis, A. Horrevorts, F. V. Lunel, C. E. Delsing, and J. L. Hautvast. 2011. A Q fever outbreak in a psychiatric care institution in The Netherlands. Epidemiol Infect 139:13-18.
Published by:
National Institute for Public Health and the Environment
P.O. Box 1 | 3720 Ba Bilthoven The Netherlands
www.rivm.com