FAIR 1.0 (Framework to Assess International Regimes for differentiation of commitments): An interactive model to explore options for differentiation of future commitments in international climate policy making. User documentation | RIVM
107
0
0
Hele tekst
(2) Page 2 of 107. RIVM Report 728001013. Department for Environmental Information Systems (CIM) and Department for Environmental Assessment (MNV) National Institute of Public Health and the Environment (RIVM) P.O. Box 1, 3720 BA Bilthoven The Netherlands Telephone : +31 30 2743584 Fax: : +31 30 2744427 E-mail : Michel.den.Elzen@rivm.nl Internet : http://www.rivm.nl/fair/ to download the free FAIR software.
(3) RIVM Report 728001013. Page 3 of 107. FOREWORD One of the most contentious issues in international climate policy development is the issue of (international) burden sharing, or as we prefer to name it, differentiation of (future) commitments: who should contribute when and how much to mitigate global climate change? It is an issue related to both technical capabilities, economic costs, as well as normative aspects such as responsibility and equity. This report presents a new decision-support tool, developed with the aim of assisting policy makers in evaluating different options for differentiation of future commitments. It is called FAIR (Framework to Asses International Regimes for differentiation of commitments) and was developed at the National Institute of Public Health and the Environment (RIVM), in The Netherlands. FAIR is an interactive - scanner-type - computer model that can be used to explore a range of alternative options for international differentiation of commitments in a quantitative way and link these to targets for global climate protection. The first results of the FAIR model, focussing on an evaluation of the so-called Brazilian proposal were presented at the UNFCCC/COP-4 conference in Buenos Aires (Argentina, November 1998), and have been reported before (den Elzen et al., 1999). Since then we have presented FAIR model results at various occasions, such as (inter-) national conferences and workshops. The FAIR model has also been used in the science-policy dialogue setting as part of the COOL (Climate OptiOns for the Long term). Over time, we have received very useful comments and suggestions that have enhanced the usefulness of the model. Now, we feel we should make the present version model available to a wider audience via the Internet. This requires the availability of proper model documentation and user instructions, which is the main purpose this report intends to serve. This report also forms the basis of our website: http://www.rivm.nl/fair/, where you can download the free FAIR software. Since we plan to continue with the development of the FAIR model, we would be very happy to also receive your comments and suggestions for improvements on the FAIR model as well as this report and our website. In this way we hope the FAIR model can play a constructive role in the many discussions to come on a fair differentiation of future commitments under the United Nations Framework Convention on Climate Change (UNFCCC). The Authors Bilthoven, December 2000.
(4) Page 4 of 107. RIVM Report 728001013. ACKNOWLEDGEMENTS The development of the FAIR model took place at the National Institute of Public Health and the Environment (RIVM) between June 1998 and April 1999 with the support of the National Research Programme on Global Air Pollution and Climate Change (NRP), the Dutch Ministry of Housing, Spatial Planning and the Environment (VROM) and RIVM under projects MAP-728001 and MAP490200, and the NRP-project-954285. We like to thank the NRP, VROM and RIVM for their continued support of the development of the FAIR model. The FAIR model was presented at the Seventh International Dialogue Workshop in Kassel (Germany, September 1998), the National Research Programme Climate conference in Garderen (The Netherlands, October 1998), the UNFCCC/COP-4 conference in Buenos Aires (Argentina, November 1998), the EFIEA policy workshop in Milan (Italy, March 1999) and the Expert meeting on the Brazilian Proposal in Cachoeira (Brazil, May, 1999) and other (inter-) national conferences and informal presentations. In 2000, the FAIR model was also presented at the World Resource Institute (WRI) (Washington) and the International Energy Agency (IEA) (Paris). Presently, the model is especially used in the context of the COOL (Climate OptiOns for the Long-term) Global Dialogue project, an integrated assessment project of the Dutch National Research Programme on Climate Change. We owe a vote of thanks to the participants of these meetings and presentations for their participation in fruitful scientific discussions on this study and the FAIR model, and for their suggestions for improvements and/or alternative approaches. In particular, we would like to thank Ian Enting and Chris Mitchel (Australia), Luiz Gylvan Meira Filho, Jose Domingos Gonzales Miquez, Jose Goldemberg and Luiz Rosa (Brazil), Atiq Rahman (Bangkadesh), Art Jacques, John Drexhage and Henry Hengeveld (Canada), Liu Deshun, Xuedu Lu, Ye Ruquui and Shuguang Zhou (China), Jesper Gunderman, Lasse Ringius, Arild Underdal(Denmark), Jean-Jacques Becker and Jonathan Pershing (France), Bill Hare, Dennis Tirpak and Rolf Sartorius (Germany), Tibor Farago (Hungary), Anial Agarwal and P. Shukla (India), Yvo de Boer, Joyeeta Gupta, Jaap Jansen, Marcel Kok, Leo Meyer, Maressa Oosterman, Dian Phylipsen, Jos Sijm, Remco Ybema and Zhong Xiang Zhang (the Netherlands), Asbjorn Torvanger and Harold Dovland (Norway), Igor Bashmakov (Russian Federation), Geoff Jenkins, Michael Jefferson, Benito Muller, Aidan Murphy and David Warrilow (United Kingdom), Patricia Itturregui (Peru), Clare Breidenisch, Eileen Claussen, Abraham Haspel, Nancy Keete, Daniel Lashof, Bill Moomaw, Raymond Prince, Daniel Reifsnyder and Adam Rose (USA) and many others for their contributions. Invaluable contributions, as well as on-line assistance, came from the developers of the simulation language ‘M’, Pascal de Vink and Arthur Beusen. This simulation language, developed at the RIVM, allows for easy visualisation in the development and presentations of simulation models, representing the secret of the RIVM interactive scanners’ success, e.g. the FAIR model and others. Finally, we are grateful to the whole IMAGE team and other colleagues at the RIVM, in particular, Kees Klein-Goldewijk, Erik Kreileman, Rik Leemans, Bert Metz, Jelle van Minnen, Jos Olivier, Michiel Schaeffer, Bert de Vries and Detlef van Vuuren..
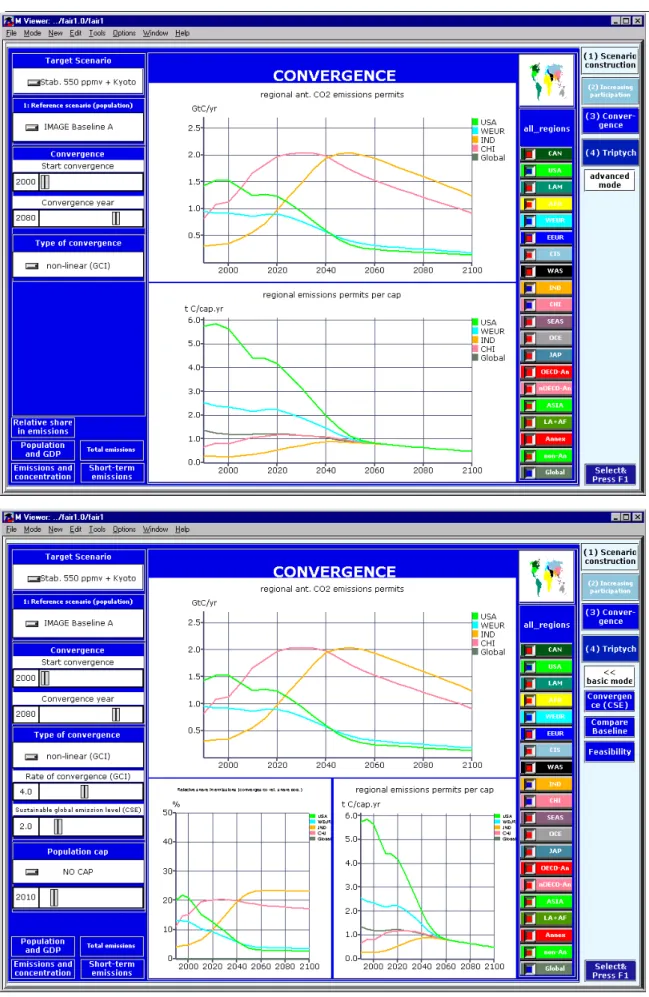
(5) RIVM Report 728001013. Page 5 of 107. ABSTRACT This report describes the model documentation and user instructions of the FAIR model (Framework to Assess International Regimes for differentiation of commitments). FAIR is an interactive - scanner-type - computer model to quantitatively explore a range of alternative climate policy options for international differentiation of future commitments in interbational climate policy making and link these to targets for global climate protection. The model includes three different approaches for evaluating international commitment regimes: 1. Increasing participation: the number of Parties involved in this mode and their level of commitment gradually increase according to participation and differentiation rules, such as percapita income, per capita emissions, or contribution to global warming. 2. Convergence: in this mode all Parties participate in the regime, with emission allowances converging to equal per capita levels over time. There are three types of convergence methodologies: (i) non-linear convergence towards equal emission allowances, according to the Contraction & Convergence approach; (ii) linear convergence towards equal emission allowances. (iii) CSE convergence approach in which convergence is combined with the distribution of basic sustainable emission rights. 3. Triptych: different differentiation of future commitments rules are applied to different sectors (e.g. convergence of per capita emissions in the domestic sector, efficiency and decarbonisation targets for the industrial and the power generation sector) The first two modes are representatives of top-down methodologies, starting from global emission ceilings and translating these to regional emission budgets, whereas the triptych approach is more bottom-up in character, not starting from a specified global emission ceiling. In order to construct and evaluate global emission profiles, the FAIR model also has the mode: 4. Scenario construction. In this mode the impacts in terms of the main climate indicators can be scanned of a constructed or well-defined global emissions profile. Keywords: Climate change, Burden sharing, FAIR model, Differentiation of future commitments, Convergence, Triptych approach, Brazilian proposal.
(6) Page 6 of 107. RIVM Report 728001013. SAMENVATTING Dit rapport bevat de model documentatie en gebruikershandleiding van het FAIR model (Framework to Assess International Regimes for differentiation of commitments). FAIR is een interactief computer model voor het (kwantitatief) verkennen van verschillende beleidsopties voor internationale lastenverdeling voor het internationale klimaatbeleid, gekoppeld aan doelstellingen voor bescherming van het klimaat. De huidige versie van FAIR bevat drie verschillende benaderingen voor internationale lastenverdeling-regimes: 1. Increasing participation (toenemende participatie): in deze benadering neemt het aantal landen en hun inspanningsniveau geleidelijk toe op basis van regels en criteria voor zowel deelname als bijdrage (bijvoorbeeld op basis van hoofdelijk inkomen, hoofdelijke emissies of bijdrage aan temperatuurstijging (Braziliaans voorstel); 2. Convergentie: in deze benadering nemen alle partijen direct deel aan een emissierechtenregime, waarbij de toegestane emissieruimte in de tijd convergeert van het bestaande naar een gelijk hoofdelijk niveau; 3. Triptych (triptiek): De methode is gebaseerd op gedifferentieerde doelstellingen voor verschillene sectoren: energie-efficiëntie en de-carbonisatiedoelstellingen voor de electriciteitsen internationaal georienteerde zware industriële sectoren en internationale convergentie in per capita emissieruimte voor de binnenlandse sectoren. De eerste twee modes zijn top-down methodologen, ende triptych methode is een bottom-up methode. FAIR bevat ook een optie om eigen emissie scenario’s te ontwikkelen, alsmede de klimaatseffecten hiervan te evalueren (scenario constructie). Trefwoorden: Klimaatveanderingen, FAIR model, internationale lastenverdeling, convergentie, triptych benadering en Braziliaans voorstel.
(7) RIVM Report 728001013. Page 7 of 107. CONTENTS 1. INTRODUCTION....................................................................................................................................... 9. 2. BACKGROUND ....................................................................................................................................... 11 2.1 INTRODUCTION ........................................................................................................................................ 11 2.2 DIMENSIONS OF INTERNATIONAL REGIMES FOR DIFFERENTIATION OF COMMITMENTS ........................... 11 2.3 DIMENSIONS OF REGIMES AND MODES IN FAIR ...................................................................................... 14. 3. METHODOLOGY ................................................................................................................................... 17 3.1 3.2 3.3 3.4 3.5. 4. INTRODUCTION ........................................................................................................................................ 17 SCENARIO CONSTRUCTION ...................................................................................................................... 17 INCREASING PARTICIPATION .................................................................................................................... 18 CONVERGENCE ........................................................................................................................................ 21 TRIPTYCH ................................................................................................................................................ 23. MODELS & DATA................................................................................................................................... 29 4.1 META-IMAGE ........................................................................................................................................ 29 4.2 IMAGE 2.1 ............................................................................................................................................. 31 4.3 IMAGE 2.1 BASELINE SCENARIOS ......................................................................................................... 34 4.3.1 Introduction ................................................................................................................................... 34 4.3.2 Primary Driving Forces: population and economic growth ........................................................ 34 4.4 ANTHROPOGENIC GREENHOUSE GAS EMISSIONS ..................................................................................... 36 4.4.1 Energy consumption ...................................................................................................................... 36 4.4.2 Change in Agricultural Production and the land use related emissions...................................... 38 4.4.3 Overall greenhouse gases emissions............................................................................................ 39 4.5 HISTORICAL DATABASES ......................................................................................................................... 40 4.5.1 Introduction ................................................................................................................................... 40 4.5.2 Anthropogenic emissions of greenhouse gases............................................................................. 40 4.5.3 Land use changes and its associated CO2 emissions.................................................................... 40 4.6 REGIONS .................................................................................................................................................. 41. 5. MANUAL................................................................................................................................................... 43 5.1 INTRODUCTION ........................................................................................................................................ 43 5.2 HOW TO USE THE FAIR INTERFACE......................................................................................................... 45 5.3 SCENARIO CONSTRUCTION ...................................................................................................................... 49 5.3.1 Scenario construction basic mode main view............................................................................... 49 5.3.2 Scenario construction in the advanced mode ............................................................................... 52 5.3.3 Model uncertainty.......................................................................................................................... 52 5.3.4 Fossil CO2 emissions view............................................................................................................. 53 5.3.5 Land-use CO2 emissions view ....................................................................................................... 54 5.3.6 Anthropogenic CH4 emissions view .............................................................................................. 55 5.3.7 Anthropogenic N2O emissions view .............................................................................................. 56 5.3.8 SO2 emissions view ........................................................................................................................ 56 5.3.9 All GHG emissions view................................................................................................................ 57 5.3.10 Kyoto Protocol view.................................................................................................................. 57 5.4 INCREASING PARTICIPATION VIEW ........................................................................................................... 58 5.4.1 Increasing participation basic mode main view ........................................................................... 58 5.4.2 Increasing participation in the advanced mode ........................................................................... 62 5.4.3 The Brazilian Proposal.................................................................................................................. 63 5.4.4 Reference scenario and Kaya indicators view.............................................................................. 64 5.4.5 De-carbonisation view................................................................................................................... 64 5.4.6 Burden sharing indicators view .................................................................................................... 66.
(8) Page 8 of 107. RIVM Report 728001013. 5.4.7 ‘Feasibility of the emissions permits’-view in the ‘increasing participation’-mode.................... 67 5.4.8 Compare Baseline-view in the ‘increasing participation’-mode ................................................. 67 5.5 CONVERGENCE VIEW ............................................................................................................................... 68 5.5.1 Convergence basic mode main-view............................................................................................. 68 Convergence advanced mode main-view ................................................................................................... 71 5.5.2 Convergence (CSE) main view...................................................................................................... 72 5.5.3 Compare Baseline-view in the ‘convergence-mode’ .................................................................... 72 5.5.4 Feasibility reductions-view in the ‘convergence-mode’............................................................... 73 5.6 TRIPTYCH ................................................................................................................................................ 73 5.6.1 Triptych basic mode main view..................................................................................................... 73 5.6.2 Triptych advanced mode main-view ............................................................................................. 78 5.6.3 ‘Compare permits with baseline’ -view ........................................................................................ 78 5.6.4 Feasibility view.............................................................................................................................. 79 5.7 FREQUENTLY ASKED QUESTIONS (FAQS) .............................................................................................. 79 6. GUIDED TOUR OF FAIR....................................................................................................................... 81. REFERENCES ................................................................................................................................................... 97 Appendix A.1 Appendix A.2. The Framework of International Scanners....................................................... 101 The UNFCC Emissions data ............................................................................... 103.
(9) RIVM Report 728001013. 1. Page 9 of 107. INTRODUCTION. Introduction Over the years, many approaches for burden sharing / differentiation of (future) commitments in international climate policy making have been proposed, both in academic and policy circles. The FAIR model presented in this report does not intend to promote any particular approach to international burden sharing. Instead it aims at providing some menu for choice to support policy makers in evaluating options for differentiation of (future) commitments (den Elzen et al., 1999). FAIR is a decision-support tool (a so-called ‘scanner’), which allows the user to interactively evaluate the implications of different approaches and criteria for international burden sharing, in terms of the allocations of allowed emissions (emission permits). Allowed emissions are calculated on a regional basis for 2 (Annex I and non-Annex I), 4 (OECD Annex I, non-OECD Annex I, Asia and other developing regions), or 13 world regions, as well as a number of selected countries1. By including a simple climate model, called meta-IMAGE 2.1 (den Elzen, 1998), based on the integrated climate change assessment model IMAGE 2.1 (Alcamo et al., 1998), the FAIR model enables users to relate burden sharing schemes to global climate protection targets, such as global mean surface temperature change and sea-level rise. Four basic modes of FAIR FAIR consists of four basic model modes: 1. Scenario construction: in this mode the climate impacts of pre-defined or own-constructed global emissions profiles for greenhouse gases can be scanned. 2. Increasing participation: in this mode the number of parties involved and their level of commitment gradually increase according to participation and differentiation rules, such as percapita income, per capita emissions, or contribution to global warming. 3. Convergence: in this mode all parties participate in the burden-sharing regime, with emission rights converging to equal per capita levels over time. 4. Triptych: different burden sharing rules are applied for different sectors (e.g. convergence of per capita emissions in the domestic sector, efficiency and de-carbonisation targets for the industry sector and the power generation sector). Organisation of the report This report is foremost meant as documentation on the FAIR model and a manual for users. It does not provide an extensive description and evaluation of the literature on international burden sharing /differentiation of commitments in the field of climate change. Nevertheless, in chapter 2 we will give a short overview over various dimensions of international burden sharing / differentiation of commitments that are relevant for understanding the approaches within the FAIR model and the models’ limitations. Moreover, we will describe the background of the development of the model. Next, in Chapter 3 we will describe in more detail the methodology of the scenario-construction part of the model, as well as the three main regime approaches included in the model. Chapters 4 and 5 contain the core of the report: the model documentation and manual. Chapter 4 provides detailed background information on the (climate) model, historical data and scenario assumptions used. Chapter 5 describes and explains the design and user options of the various basic and advanced views of the FAIR user interface. A paragraph of this Chapter also consists of a technical manual that describes how the FAIR model can be operated, and some 1. IMAGE 2.1 regions consist of Canada, USA, Latin America, Africa, OECD-Europe, Eastern Europe, CIS, Middle East, India + South Asia, China + centrally planned Asia, West Asia, Oceania, and Japan; selected countries presently consist of Australia, Germany, Japan, The Netherlands, USA, Brazil, China, India, Mexico and South Africa..
(10) Page 10 of 107. RIVM Report 728001013. special features of the M-modelling language used for construction of both the model and its interface. Finally, in Chapter 6, we present a “guided tour“ through the model to illustrate the some of its features and insights that can be gained from the model..
(11) RIVM Report 728001013. 2 2.1. Page 11 of 107. BACKGROUND Introduction. One of the key policy issues in the evolution of the Framework Convention on Climate Change (FCCC) is the involvement of developing country parties (non-Annex-1). While their emissions presently constitute only a minor part of global green house gas (GHG) emissions, it is expected that within a number of decades their emissions will outgrow those of the industrialised countries (Annex-1). However, already during the negotiations on the FCCC developing countries stressed that given their historical emissions the industrialised countries bear the primary responsibility for the climate problem and should be the first to act. This was formally recognised in the FCCC (1992) which states that developed and developing countries have “common but differentiated responsibilities” (article 3.1). It was again re-acknowledged in the so-called Berlin Mandate (UNFCCC, 1995), in which additional commitments were limited to developed countries only. Nevertheless, during the negotiations on the Kyoto Protocol the (future) involvement of developing countries in global emission control became an issue again, especially due to the USA demand for “meaningful participation of key developing countries". In 1997, during the third Conference of Parties (CoP-3) the industrialised countries agreed in Kyoto (Japan) to reduce their greenhouse gas emissions by on average 5.2 % by 2008-20012 from 1990 levels (UNFCCC, 1998). The protocol does not include new commitments for developing country parties, but the issue of developing country participation has gained attention ever since, because it is expected that the USA will not ratify the Protocol without the “meaningful participation by key developing countries”. Moreover, the debate has been fuelled by the announcements of some developing countries to voluntarily take up the new commitments (notably Argentina and Kazakhstan during CoP-5 in Buenos Aires).. 2.2. Dimensions of International regimes for differentiation of commitments. In the past, the issue of international burden sharing in global climate change policy has received much attention, especially in the run up to the signing of the Framework Convention on Climate Change in Rio de Janeiro in 1992 (see e.g. Grubb, 1989, Krause et al., 1989, Agarwal, 1991, Grubb et al., 1992, den Elzen et al., 1992, Grübler and Nakicenovic, 1994, Rose, 1992). After the adoption of the Berlin Mandate during the first Conference of Parties in 1995 the focus of analysis shifted to burden sharing within the group of Annex-1 (see e.g. Torvanger et al., 1996, Kawashima, 1996, Reiner and Jacoby, 1997, Blok et al., 1997, Metz, 2000). With the adoption of the Kyoto Protocol, a renewed interest in global burden sharing can be expected. Although, in the literature burden sharing is a common concept, this debate is likely to be framed in terms of “differentiation of (future) commitments” given the language in the FCCC. Therefore, we prefer to use this term in stead of burden sharing. A key issue in this debate on “differentiation of future commitments” will be equity or fairness. Equity usually relates to principles. However, as we will elaborate below, there are more dimensions of regimes for differentiation of future commitments than equity principles only. All these dimensions need attention in discussing possible regimes for differentiation of future commitments. Nevertheless, equity principles, either explicitly or implicitly, are at the heart of those regimes. Here, we will first give a short overview of various equity principles in the literature on international burden sharing in climate change policy making..
(12) Page 12 of 107. RIVM Report 728001013. Equity Principles There is no common accepted definition of equity. Equity principles refer to more general notions or concepts of distributive justice or fairness (Rose, 1992). Rose et al. (1997) distinguish three types of alternative equity criteria for global warming regimes: 1. allocation based criteria, defining equitable burden sharing in terms of principles for the distribution of emission rights or the allocation of emission burdens; 2. outcome based criteria, defining equitable burden sharing in terms of its outcomes, in particular the distribution of economic effects; and 3. process based criteria, defining equitable burden sharing in terms of the process for arriving at a distribution of emission burdens. This distinction is important for understanding the approach adopted in the FAIR model, because the model only incorporates allocation based criteria for the differentiation of future commitments. Outcome based criteria usually refer to the distribution of costs (and benefits) (in terms of either investment costs or welfare effects) resulting from any distribution of commitments. The economic modelling framework needed for this is not part of the (present) FAIR model. A general problem with such an approach, though, is the dependence on complex economic models, the outcomes of which are usually little transparent to policy makers. However, since costs and economic impacts of options for differentiation of future commitments are important policy considerations, we plan to include at least cost functions in future versions of the model. Ringius et al. (1998) use another typology based on the type of equity principles relevant in the context of climate change. They distinguish five equity principles: 1. egalitarian: people have equal rights to use the atmosphere; 2. sovereignty: current emissions constitute a status quo right now; 3. horizontal: actors under similar (economic) conditions have similar emission rights and burden sharing responsibilities; 4. vertical: the greater the capacity to act/ability to pay the greater the (economic) burden; 5. polluter pays: the greater the contribution to the problem the greater the burden. They note that in practise proposals for burden sharing often use formulas that relate to different equity principles and use multiple criteria relating to both economic and environmental dimensions of climate change regimes (see e.g. Kawashima, 1996, Ringius et al., 1998). In their view, the principle of horizontal equity has been dominant during the negotiations on the Kyoto protocol. In the FCCC as well as the Kyoto Protocol the relations between the developed and developing countries are much more described in terms that refer to vertical equity and the polluter pays principle. In a more recent studies, focusing on the most relevant elements for a widely accepted approach to burden differentiation in future international climate negotiations, Ringius et al. (Ringius et al., 2000, Torvanger et al., 2000) simplify their typology of equity principles or “principles for distributive fairness” to three key principles: 1. Guilt: costs should be distributed in proportion to a party’s share of responsibility for causing the problem; 2. Capacity: costs should be distributed in proportion to ability to pay; 3. Need: all individuals have equal rights to pollution permits, with a minimum to secure basic human rights, including a decent standard of living. The interesting aspect of the simplified typology is that it resembles notions on fairness in the FCCC itself, in particularly article 3.1, which states:.
(13) RIVM Report 728001013. Page 13 of 107. “The parties should protect the climate system for the benefit of present and future generations, on the basis of equity and in accordance with their common but differentiated responsibilities and respective capabilities, …”. For this reason, we will follow their terminology, with the exception that we will use the term responsibility instead of guilt, like in the FCCC. Compared to their previous typology, the principle of sovereignty seems no longer covered. In their view it seems that this principle, which is behind the rule of equal obligations (e.g. flat rate reductions), and a default option in international negotiations, does no longer have sufficient legitimacy in a situation of large inequality amongst the parties involved. However, the principle seems to be still relevant, as illustrated in the case of the convergence approach (see below). Other regime dimensions Many discussions on international burden sharing in the field of climate change focus on principles for distributional fairness or equity. There are a number of other important dimensions of international regimes that can be distinguished (see e.g. Pershing, 1999): 1. Sharing of costs or also benefits. A first dimension is related to the question whether the burden-sharing regime should account for not only the distribution of costs, but also of the benefits of climate change. In a typical cost-benefit approach the distribution of emission reduction/control efforts should account for the distribution of benefits as well since some parties may be asked to limit their emissions, while they may actually benefit from climate change. At the same time, the distribution of emission reduction / control efforts should also account for the distribution of damage. The application of a cost-benefit approach to international burden sharing in the field of climate change is, however, very much hampered by the large uncertainties about the impacts of climate change and therefore not very practical. In fact, the present approach in the FCCC and the Kyoto Protocol seems to be to create separate collective mechanisms to help (vulnerable) countries adapt to the impacts of climate change (see the Kyoto Protocol, art. 12, sub 8). 2. Problem definition. A second dimension is related to the question whether the climate change problem is defined as a pollution problem or as a common good issue. In the first case, the question is one of finding an equitable distribution of the emission reduction burden; in the latter case, the question is to find a fair distribution of the sustainable use of the atmosphere. These different approaches have implications for the design of burden sharing regimes. In the first approach, the burden sharing will focus on defining who should reduce his pollution how much; in the second approach the burden sharing will focus on who has what emission rights. The acceptance of the flexible mechanisms like emission trading in international climate policy making has made burden sharing on the basis of the allocation of rights much more viable than before because actual emission levels no longer need to be the same as allowed emission levels. At the same time, the introduction of concepts such as “assigned amount” has given rise to discussion on emission rights. Many developing countries have the view that the introduction of emission trading and "assigned" amounts should not be separated from the discussion on an equitable distribution of welfare (statements of Indian delegation during Kyoto and Buenos Aires rights, Centre for Science and Environment (CSE), 1998). 3. Emission limit. A third dimension concerns the way the burden is defined. One can define the burden top-down by defining the globally allowed emissions and applying certain participation and burden sharing rules for allocating the overall reduction effort needed, or instead in a bottom-up way allocate emission control efforts among parties, without a predefined overall emission reduction effort. 4. Participation. A fourth dimension is that of participation: who should participate when? Discussions on burden sharing sometimes seem to assume that all parties participate. This is not necessarily the case, as illustrated by the Kyoto Protocol, which does not contain obligations for.
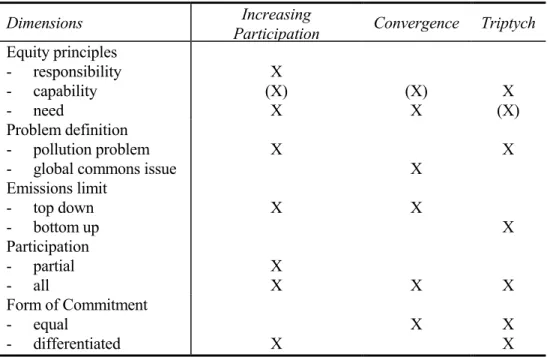
(14) Page 14 of 107. RIVM Report 728001013. the non-Annex-B countries.2 Regimes for the differentiation of future commitments not only concern rules for burden sharing, but also for participation. 5. Form of commitment. A fifth dimension is that of the form of the burden or commitment. This needs not necessarily be the same for all parties. It is well conceivable that future commitments of non-Annex-1 countries may be of a different nature than the present ones for the Annex-1 (see e.g. Baumert et al., 1999; Claussen et al., 1998).. 2.3. Dimensions of regimes and modes in FAIR. The FAIR model was designed to allow for the evaluation of the consequences of different approaches to the differentiation of future commitments. The three modes in FAIR combine both different principles of equity as well as most of the other dimensions of regimes discussed above3 (see table 2.1) For selecting the modes and options to be included in the present version of FAIR there were both pragmatic and theoretical considerations. A major pragmatic consideration was to include approaches that have (already) gained serious policy attention, e.g. the Brazilian proposal4 (den Elzen et al., 1999). A more theoretical consideration relates to the possible evaluation of the international climate regime. For the evolution of the FCCC two concepts are thinkable: 1. a gradual extension of the group of Annex-B countries, taking up binding commitments under the Convention, or 2. the development of a comprehensive regime, defining the rights and duties of all parties. The first kind of regime would mean a gradual extension of the present Protocol approach to differentiate the obligations of various parties under the Convention and involve discussions on both rules for participation and on burden sharing on the basis of predominantly incremental decision making. This type of regime we call ‘Increasing participation‘. The second regime would be a major shift away from the protocol approach and have a long-term perspective with respect to the distribution of rights and duties and their evolution over time. A clear case of the latter is the socalled "contraction and convergence" of the Global Commons Institute5 which defines emission permits on the basis of a convergence of per capita emissions under a contracting global emission profile. Since there are different variants possible, such as the one proposed by CSE to account for basic emission rights, we call this approach simply ‘Convergence’. As an alternative development, there could be a shift in focus from the level of the nation state towards the level of sectoral policies, which could be applied to a limited set of parties to the FCCC, but also be fully international in nature, such as in the case of industries dominated by a limited number of key multinational companies (steel industry, car industry, petrochemical industry etc.). Such a shift would fit in with a more bottom-up approach for defining commitments. A simple example of a bottom up approach, would be the global application of the Triptych approach. The Triptych approach (Blok et al., 1997) is included as a totally different alternative to the two other approaches in the model, with a bottom-up, sector oriented character. This approach was successfully used in the EU before Kyoto to help defining an internal burden sharing agreement, and is in the literature on burden sharing considered as an attractive approach to define future commitments (see Ringius, 1998 and 2000; Torvanger, 2000). In the FAIR model, a somewhat 2. Annex B: Australia, Austria, Belgium, Bulgaria, Canada, Croatia, Czech Republic, Denmark, Estonia, European Community, Finland, France, Germany, Greece, Hungary, Iceland, Ireland, Italy, Japan, Latvia, Liechtenstein, Lithuania, Luxembourg, Monaco, Netherlands, New Zealand, Norway, Poland, Portugal, Romania, Russian Federation, Slovakia, Slovenia, Spain, Sweden, Switzerland, Ukraine, United Kingdom, United States of America. Annex-I countries are almost identical to the Annex B countries from the Kyoto Protocol, excluding Croatia, Liechtenstein, Slovenia and Ukraine. 3 As indicated before the present version of the FAIR model does not include an economic model. Thus, not only outcome based, but also a cost-benefit approach to burden sharing is not included in the model. 4 During the negotiations on the Kyoto Protocol Brazil made a proposal for linking Annex-1 contributions to emission control to their relative contribution to global warming (UNFCCC, 1997). 5 Their web site can be found on the Internet through: http://www.gci.org.uk..
(15) RIVM Report 728001013. Page 15 of 107. simplified version of the original triptych approach has been included in order to be able to apply the approach on a global scale and consistent with the (scenario) data used in the other two modes. The three different modes are described in more detail in the next chapter. The three different modes are described in more detail in the next chapter. Table 2.1. The three modes of FAIR and different dimensions of international burden sharing Dimensions Equity principles - responsibility - capability - need Problem definition - pollution problem - global commons issue Emissions limit - top down - bottom up Participation - partial - all Form of Commitment - equal - differentiated. Increasing Participation X (X) X. Convergence. Triptych. (X) X. X (X). X. X X. X. X X. X X X. X. X. X. X X.
(16) Page 16 of 107. RIVM Report 728001013.
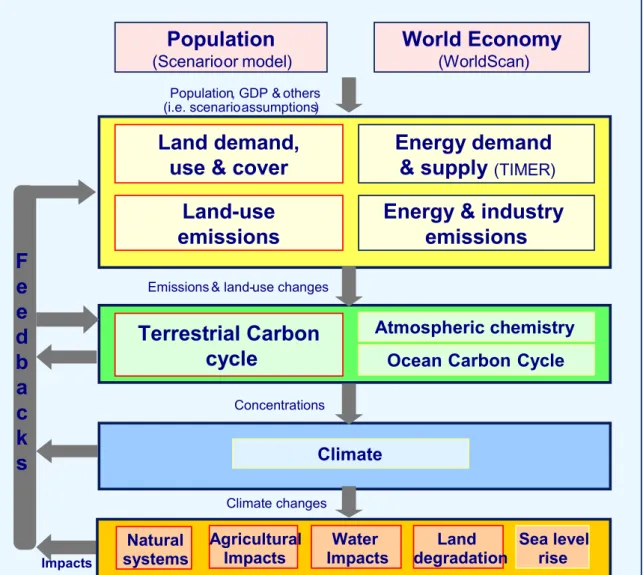
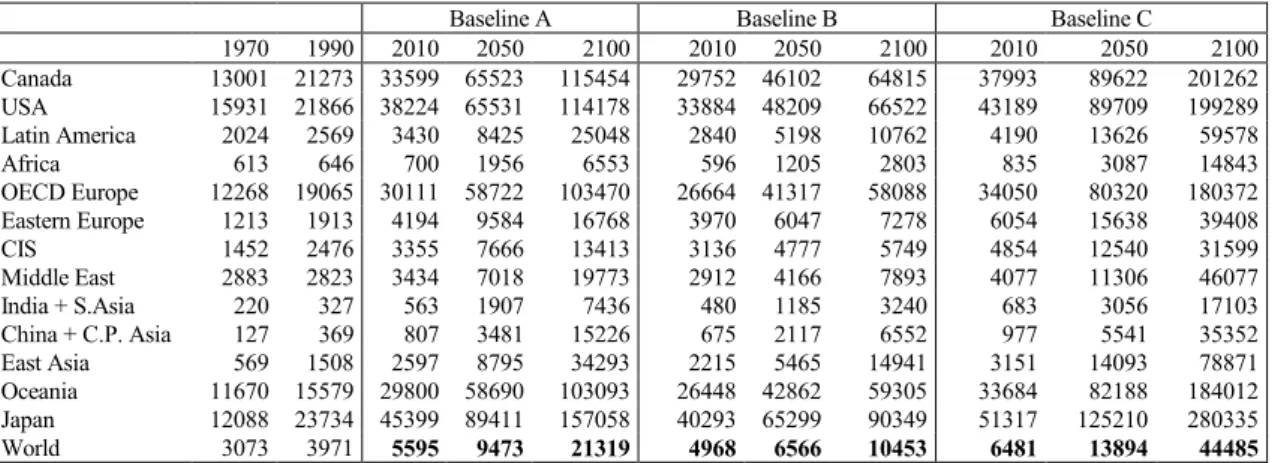
(17) RIVM Report 728001013. 3 3.1. Page 17 of 107. METHODOLOGY Introduction. We developed the FAIR model to evaluate the implications of different initial allocations of emission rights. This model is designed in such a way that many different criteria for burden sharing can be used, so as to support policy makers in evaluating options for international burden sharing and can be used interactively. The model relates burden sharing schemes to global climate protection targets and calculates the respective regional emission permits. The climate calculations are done by the simple climate assessment model meta-IMAGE. The FAIR model can calculate the implications of various burden-sharing approaches under various global emission profiles for 2 (Annex I and non-Annex I), 4 (OECD Annex I, non-OECD Annex I, Asia and other developing regions), or 13 world regions (under IMAGE 2.0) and a number of selected countries6. Three different approaches of defining burden-sharing schemes are included in the model: 1. Increasing participation. In this mode the number of parties involved and their level of commitment gradually increase according to participation and differentiation rules, such as percapita income, per capita emissions, or contribution to global warming. 2. Convergence. In this mode all parties participate in the burden-sharing regime, with emission rights converging to equal per capita levels over time. 3. Triptych. Different burden sharing rules are applied for different sectors (e.g. convergence of per capita emissions in the domestic sector, efficiency and de-carbonisation targets for the industry sector and the power generation sector). The first two modes are representatives of top-down methodologies, so from global emission ceilings to regional emission budgets, whereas the triptych approach is more bottom-up in character, although it can be combined with specific emission targets (as illustrated in the case of the EU). In order to construct and evaluate global emission profiles, the FAIR model also has the mode: 4. Scenario construction. In this mode the impacts in terms of the main climate indicators can be scanned of a constructed or well-defined global emissions profile.. 3.2. Scenario construction. The Scenario-construction mode of FAIR allows the user to interactively define own global emission scenarios, or to select one of the pre-defined global emission scenario, and evaluate the climate impacts of the scenario in terms of the global climate indicators: global-mean-surface temperature change, rate of global temperature change and global-mean sea level rise. Methodology For the evaluation of the emission scenarios we made use of the global integrated simple climate assessment model meta-IMAGE 2.1 (hereafter to be referred to as meta-IMAGE) (Elzen, 1998; Elzen et al., 1997), which itself forms an integral part of the FAIR modelling framework. MetaIMAGE is a simplified version of the more complex climate assessment model IMAGE 2. The latter aims at a more thorough description of the complex, long-term dynamics of the biosphere6. IMAGE regions consist of Canada, USA, Latin America, Africa, OECD-Europe, Eastern Europe, CIS, Middle East, India + South-east Asia, China + centrally planned Asia, Western Asia (Middle East), Oceania, Japan; selected countries presently consist of Australia, Germany, Japan, the Netherlands, USA, Brazil, China, India, Mexico and South Africa..
(18) Page 18 of 107. RIVM Report 728001013. climate system at a geographically explicit level (0.5o x 0.5o latitude-longitude grid) (Alcamo, 1994; Alcamo et al., 1996; 1998). Meta-IMAGE is a so-called meta-model7 with a short run-time, i.e. a more flexible, transparent and interactive simulation tool, that on a global scale adequately reproduces the IMAGE-2.1 projections of concentrations of greenhouse gases, the global-mean temperature increase and sea-level rise for the various IMAGE 2.1 emission scenarios. MetaIMAGE consists of an integration of a global carbon cycle model (den Elzen et al., 1997), an atmospheric chemistry model (Krol and van der Woerd, 1994), and a climate model (upwellingdiffusion energy balance box model of Wigley and Schlesinger (1985) and Wigley and Raper (1992)). Meta-IMAGE was recently complemented with the following new elements: (i) the revised Brazilian model (Filho and Miquez, 1998) and (ii) global temperature impulse response functions (IRFs, see e.g. Hasselmann, 1993) based on simulation experiments with various AtmosphereOcean General Circulation Models (AOGCMs) for alternative temperature increase calculations (den Elzen and Schaeffer, 2001). Its set-up also allows for assuming different climate sensitivities and global sulphur emissions (see paragraph 5.1).. 3.3. Increasing participation. In the Increasing participation approach (mode) the number of parties involved and the level of involvement in the burden sharing gradually increases over time according to participation and burden sharing rules, such as per capita emissions, or the contribution to global warming (Brazilian Proposal) (UNFCC, 1998). In essence, the approach is based on the polluter pays principle, but adjusted for considerations of need (for development) and capacity to act. Berk and den Elzen (1998) and den Elzen et al. (1999) first introduced this approach at the fourth Conference of the Parties (COP-4). Later, the approach was extended by more stages of participation into what can be called a ‘multi-stages’ approach (see below). In its basic form the procedure is as follows. First, a long-term target emission scenario (a concentration stabilisation scenario, including or excluding the Kyoto Protocol) is selected. For each 5-year time step, the following participation rules determine who should participate and when. More specifically: • • •. All Annex-I countries participate immediately (2000), or after the Kyoto period (2013), depending on whether the target emission scenarios exclude or include the Kyoto Protocol. Non-participating parties (non-Annex-I) follow their baseline emission scenario (reference scenario) until they meet a participation threshold. Participation thresholds are based on income and/or emission levels, or on a selected starting year.. Next, the Burden sharing rules determine who gets what part of the burden. Various options of burden sharing rules are available in the FAIR model.. 7. A meta-model is a highly aggregated, simplified representation of an original model that is more detailed and referred to as the expert model. This means that it has to fulfill the following two requirements: (i) it should be a flexible, transparent and rapid simulation tool; (ii) its model structure and outcomes should be validated extensively against the original, expert model and empirical data..
(19) RIVM Report 728001013. Page 19 of 107. Methodology In the ‘increasing participation’ mode the FAIR model calculates allowed emissions (emission permits) for regions/countries as follows: 1. For each 5-year time step, the model evaluates if regions/countries satisfy any of the selected participation rules. When regions/countries satisfy one or more of these rules, they start sharing the emission reduction burden during the next time step. Other regions follow their Baseline emission scenario. 2. The required emission reduction effort (yellow block in Figure 3.1) is determined by subtracting the baseline emissions of non-participating regions/countries from the global emissions allowed in the next target year. 3. The share of each participating region/country in the burden-sharing key (e.g. contribution to CO2 emissions or CO2-induced temperature increase) then determines its share in the emission reduction effort. Over time, the share of regions/countries in the emission reduction efforts changes, both because of reductions in their emissions and because other regions/countries start participating in the burden sharing. % share in burden sharing key. Emission burden. Participating parties. Allowable emissions participating parties. CAN:4 Allowable global emissions. Participating parties. OCEANIA: 5 JAP: 8 EEUR:7 CIS:15. Nonparticipatin g parties. (t). Baseline emissions Nonparticipating parties. WEUR:25 Nonparticipatin g parties USA:37. (t+1). Example: USA emissions (t) Emission burden (t+1). = 1.7 GtC; = 0.5 GtC;. USA share in burden sharing key. = 37%. Allowable emissions USA at (t+1). = 1.7 - (0.37 *0.5) = 1.52GtC. Figure 3.1 Calculating regional emission permits with FAIR in the "Increasing participation" mode.
(20) Page 20 of 107. RIVM Report 728001013. Multi-stage The increasing participation approach can be refined by the introduction of two additional stages: stabilisation of emissions and de-carbonisation targets. 1. Stabilisation of emissions. In this case, a region/country that meets any of the selected participation thresholds first stabilises its absolute or per capita emissions for a user-defined number of years before it actually enters the burden-sharing regime. 2. De-carbonisation targets. In this case, an additional set of emission and/or income-based thresholds (‘decarbonisation thresholds’) is used which define when a region/country enters a stage in which its allowable emissions are controlled by de-carbonisation targets. These decarbonisation targets define the rate of reduction in the carbon-intensity of the economy (CO2 emissions per unit of Gross Domestic Product (GDP) or per unit of Purchasing Power Parity (PPP)). A region/country leaves this stage when it meets any of the selected participation thresholds for the stabilisation of emissions and/or burden sharing stages. These two additional stages were introduced to prevent sharp changes in a region/country’s allowable emissions when it meets any of the burden sharing thresholds. Ideally, the decarbonisation stage results in a reduction of the increase in allowable emissions. The stabilisation stage, then, acts as an intermediate stage between an increase and subsequent decrease in allowable emissions. All together, the increasing participation mode offers a 4-stage regime to differentiate commitments among parties over time, which is summarised as follows: • •. • •. Stage 1: Reference scenario: Non-participating parties (non-Annex I) first follow their baseline emission scenario (reference scenario) until they meet a decarbonisation threshold Stage 2: Decarbonisation targets. Then, they enter a stage in which their allowable emissions are controlled by de-carbonisation targets, defined by the rate of reduction in the carbonintensity of their economy. A region leaves this stage when it meets any of the selected participation thresholds. Stage 3: Stabilisation of emissions: Then, they enter an emissions stabilisation period, in which they stabilise their absolute or per capita emissions for a user-defined number of years before they actually enter the burden sharing regime. Stage 4: Emission burden sharing regime: Then, burden sharing rules determine the emission reductions for each of the participating regions..
(21) RIVM Report 728001013. Box 3.1. Page 21 of 107. Purchase Power Parity (PPP). The Purchase Power Parity (PPP) is an alternative indicator for GDP/capita, based on relative purchase power of individuals in various regions, that is the value of a dollar in any country, i.e. the amount of dollars needed to buy a set of goods, compared to the amount needed to buy the same set of goods in the United States. More specifically, for international comparison it is also necessary to convert local currencies into some common denominator - mostly US$. However, in doing so several problems occur. One of the most important is that exchange rates (normally used to convert currencies into US$) are not a good representative of price levels of countries. A dollar can purchase more in some countries than in others. It is possible to adjust for such differences in purchasing power - although this requires a vast amount of data (and assumptions with regard to possibility to compare quality of different goods in different countries). Several organisations among which the ICP (International Comparison Programme) collect data on prices paid for a large set of comparable items in more than 100 countries. Purchasing Power Parities (PPP) computed from these data allow comparison of prices and real GDP estimates across countries. For the PPP-GDP data used within the IMAGEframework and for FAIR data from the World Bank Development Indicators (1999) have been aggregated to regional levels - and used for historic trends. For future trends, we have assumed convergence in PPP-values based on regression analysis between PPP-values and GDP per capita.. 3.4. Convergence. In the Convergence approach all parties immediately participate in the burden-sharing regime (after the first commitment period), with per capita emission rights/permits converging towards equal levels over time. The convergence approach is a combination of status quo rights and the egalitarian equity principle. It leaves aside differences in historical contributions to the problem. The Global Commons Institute (GCI) first introduced the approach as ‘Contraction and Convergence’. Early results of the approach were published to good effect at the Second Conference of the Parties (COP2) and have been distributed widely since then. The procedure is as follows. First ‘contraction’, a global atmospheric greenhouse gas concentration target (like the 450 ppmv CO2 concentration target) is selected, which creates a long-term global emissions profile or global greenhouse gas emissions contraction budget (like the IPCC S450 ppmv stabilisation scenario). Then this budget is allocated by the regions/countries in a way that the percapita emissions converge from their present diverse values to a global average world value, to be the same for each country in a convergence year (GCI, 1997). The ‘Contraction and Convergence’ concept has been adopted by a global group of parliamentarians, called ‘Global Legislators for a Balanced environment’ (GLOBE). The idea of convergence of the per-capita emissions has also been included in a proposal by France and to a lesser explicitly defined extent by proposals of Switzerland and the European Community (Torvanger and Godal, 1999). The concept gained substantial support in developing countries. The Centre of Science and Environment in India also supports the convergence concept (CSE, 1998) but has suggested a variant in which the concept is combined with basic sustainable emission rights, related to both the idea of survival emissions as well as the idea of commons as natural sink for CO2 (in particular the oceans). This variant has been included in FAIR as a separate option (see below)..
(22) Page 22 of 107. RIVM Report 728001013. Methodology The present version of FAIR includes three types of convergence: 1) non-linear convergence towards equal emission rights, according to the ‘contraction and convergence’ approach of GCI; 2) linear convergence towards equal emission rights, and 3) the CSE convergence approach in which convergence is combined with the distribution of basic sustainable emission rights. 1. Non-linear convergence (GCI) This non-linear convergence method of the GCI uses the following algorithm for the allocation of the shares of global emissions in terms of percentage: 1. It starts out with ‘actual’ shares, as derived by the methods described above; 2. It converges all shares from actual proportions in emissions to shares based on the distribution of global population in the convergence year; 3. The actual degree of convergence in per capita emission allocated in each year depends on the (potentially capped) population and the rate of convergence selected. The rate of convergence determines whether most of the per capita convergence takes place at the beginning or near the end of the convergence period. The formula used for this convergence: S E ( r , t )=. S E ( r , t - 1 ) - [ S E ( r , t - 1) -. t*. (t - t start ) (t conv - t start ). =. S pop ( r , t )]. .e(- a (1 - t*)). (3.1). where SE(r,t) is the emissions share of a region r at time t, Spop(r,t) is its share of the global population at time t, t* is the fractional time elapsed between 2000 and the target year (t=0 for 2000 and t=1 at the convergence year), and a is an arbitrary parameter that determines the rate of convergence. 2. Linear convergence Another methodology assumes a linear convergence of an allocation based on shares in global emissions in the starting year to an allocation based on the share in global population in the convergence year. In formula: S E (r,t ). = S E ( r, t start ). (1 − t* ) − S pop ( r , t ) . t*. (3.2). The actual total anthropogenic CO2 emissions allocations are then made by multiplying the global total allowed emissions by each country's shares derived from the convergence process. 3. convergence with basic sustainable emissions (CSE) The idea of convergence with Basic sustainable emissions was suggested by CSE (Agarwal et al., 1991; CSE, 1998; Agarwal, 1999). Its starts from the concept of basic emission right per world citizen, which is linked to a so-called global ‘sustainable’ emission level. This level is determined by the amount of CO2 that can be emitted into the atmosphere without resulting to an increase in the atmospheric concentration of CO2 ; that is the ultimate level for stabilisation CO2 concentrations, as referred to in article 2 of the UNFCC (1998). This global ‘sustainable emission level’ (GSEL in GtC) is now allocated among the world population, as a common goal using the equity principle: every human being in future has a basic emission quotum irrespective of the country he or she lives in. Given a future population.
(23) RIVM Report 728001013. Page 23 of 107. development, this basic emission quotum changes in time, and is simply calculated as the global ‘sustainable’ emissions level divided by the population size. In formula: GSEL / popgl(t). Besides this basic emission quotum, each human being has a remaining emission quotum, which is calculated using the linear convergence methodology (as described above), but now using a “remaining” global emission profile. This remaining global emissions profile is determined by the global target emission profile minus the global ‘sustainable’ emission level (see also CSE, 1998). Cap on population growth In the methodology of the GCI, there is also an option to set a cap on population growth for the purposes of allocation of emissions rights. This was done by notional freezing populations for years beyond a ‘population cut-off year’ at the values for that year. Note there is no assumption being made about what populations will or should be beyond the cut-off year; merely that population growth after that year should not accrue additional emissions rights. The GCI recommends the year 2020. In their report they say: “One could make an ethical case for it being the year of the agreement, optimistically 1997, but it seems better to allow an adjustment period, as one could also make an ethical case for allowing rights based on family sizes - in effect allowing more rights to countries with an above-replacement proportion of females of reproductive age or below. It might be necessary to adopt some such cap criterion, as otherwise the system would give national governments a positive incentive to encourage their populations to grow to obtain an increasing share of emissions rights. Clearly this would be undesirable“. This cap methodology is also implemented in the present version of FAIR (see below) for all three convergence methodologies.. 3.5. Triptych. A quite different approach to international burden sharing is offered by the Triptych approach (Phylipsen et al., 1998). This is a sector-oriented approach that has been used for supporting decision-making on burden sharing in the European Union (EU) prior to Kyoto (COP-3) (Blok et al., 1997). In contrast to the ‘Increasing participation’ mode, which follows a typical top-down approach (from global emission ceilings to regional emission budgets), the Triptych approach is more bottom-up in character, although it can be combined with specific emission targets (as illustrated in the case of the EU). The Triptych method is a sector approach to burden sharing, which allows for taking into account different national circumstances. The approach embraces considerations of fairness related to both equity, capability and need (Torvanger, 2000; see table 1, Chapter 2). In the triptych approach three categories or sectors of emission sources are distinguished: 1. domestic sectors; 2. internationally-oriented energy-intensive industry; 3. power-producing sector. Emission allowances are calculated by applying specific rules to each of these sectors. The triptych approach was developed for the EU-15, but has here been adapted for using it on world region level. A more extensive description of the (original) methodology and its background can be found in Phylipsen et al. (1998)..
(24) Page 24 of 107. RIVM Report 728001013. Three categories or sectors The selection of the triptych categories is based on the main issues encountered in negotiations on international burden sharing in emission control: differences in standard of living, fuel mix, economic structure and the competitiveness of internationally-oriented industries. Different criteria are used for each of the categories to calculate the emission allowances. How stringent the absolute emission allowances are, depends on the overall ambition level. The sectors can be characterised as follows: 1. Domestic sectors: comprise the residential sector, the commercial sector, and sectors for transportation, light industry and agriculture. In these sectors emission reductions can be achieved by means of national measures; emissions here are assumed to be fairly, directly correlated with population size. 2. Industrial sectors: comprise internationally oriented industries, where competitiveness is determined by the costs of energy and of energy efficiency measures. These are heavy industry, which comprises the building materials industry, and the chemical, iron & steel industry, nonferrous metals, and pulp & paper industries; also included are refineries, coke ovens, gasworks and other energy transformation industries (excluding electricity generation). Compared to other economic sectors, industry, especially heavy industry, generally has a relatively high energy value added and in most countries also high CO2 per value added ratio. Countries and regions with a high share of heavy industry will therefore have relatively higher CO2 emissions/units of GDP than countries that focus primarily on light industry and services. Setting CO2 emission targets on a per capita basis would be to the disadvantage of the competitiveness of industries in countries with a high share of such industries. Specific rules for this sector could take these considerations into account. 3. Electricity generation sectors: show great differences between regions and countries in their share of power production techniques like nuclear power and renewables, and in the (fossil)fuel mix. The potential for renewable energy is different for each region, just like the public acceptance of nuclear energy. Methodology The 1990 CO2 emissions from the EDGAR-HYDE database (Olivier et al., 1996; 1999) are used as starting and reference values. Projections for population growth, Industrial Added Value (IVA) rates and Gross Domestic Product (GDP) (describing the sectoral growth rates) are based on the assumptions in the reference scenarios (IMAGE 2.1 Baseline scenarios and the IMAGE 2.1 IPCC/SRES scenarios8). Domestic sectors The allowable CO2 emissions in the domestic sectors are assumed to be primarily related to population size. Therefore a per capita approach seems appropriate here. Differences in development are taken into account by allowing convergence of per capita CO2 emissions over time. Here, we assume that the regional domestic CO2 emissions per capita converges linear (using a constant yearly reduction factor) between 1990 and the convergence year to the world-wide average allowed emissions per capita level. The latter is derived from the allowed total domestic CO2 emissions and the total population in the convergence year. The dynamics of the convergence can be described in formulas as follows: 8. The IMAGE 2.1 IPCC/SRES A1 and B1 emission scenarios are the IMAGE 2.1 implementation of the IPCC SRES A1 and B1 emission scenarios (Nakicenovic et al., 2000). The IMAGE 2.1 implementattion of the IPCC SRES B1 emission scenario was also the marker of the family of IPCC SRES B1 emission scenarios (Nakicenovic et al., 2000), and therefore corresponds with the IPCC SRES B1 emission scenario. This scenario is extensively described in de Vries et al. (2000)..
(25) RIVM Report 728001013. E. dom , pc. (r,t ). éE ( gl , t ) dom , pc conv ( r, t −1).ê = E êE ( r , 1990) dom , pc ë dom , pc. Page 25 of 107. − 1990 ) ù1 / (t conv ú ú û. (3.3). where Edom,pc(r,t) is the regional domestic CO2 emissions per capita for region r and at time t (the 1990 values are based on EDGAR-HYDE data), and Edom,pc(gl,t) is the global domestic CO2 emissions per capita at time t. The decision parameters are the convergence year tconv and the global domestic CO2 emissions reduction factor, i.e. the %-reduction of the total domestic CO2 emissions in the convergence year. The latter describes the domestic CO2 emissions per capita at are the convergence year (Edom,pc(gl, tcon)). From the convergence year to 2100 (end of the simulation period), the allowance of CO2 emissions per capita remains equal which implies that the total domestic CO2 emissions can increase after the convergence year due to an increasing population. Industrial sectors The development of the emissions in the industrial sectors from 1990 to 2100 depends on the industrial growth rate, the projected energy efficiency improvement and the de-carbonization improvements, using the so-called Kaya identity (Kaya, 1989)): CO2 = P * Y/P * E/Y * CO2/E where CO2 represents the fossil CO2 emissions, P the population of the region, Y the Gross Regional Product (such that Y/P represents the average income), E stands for (primary) energy use (such that E/Y represents energy intensity of Y) and CO2/E is the carbon intensity of (primary) energy use. Energy intensity of the economy (E/Y): this indicator represent two different dimensions of the energy demand side: (1) (the change in) the energy intensity of the industrial economy due to (a structural change in) its composition (e.g. from heavy to light industries) and (2) the (general tendency of an improvement of) technical efficiencies of processes (which is assumed to have an autonomous component, apart from any price-induced component). Note that energy intensity is here defined for primary energy use. Thus, also energy conversion efficiencies (e.g. to produce electricity from coal) are included in this parameter. - Carbon intensity of energy use (CO2 /E): this indicator represents two different dimensions of (a change in) the energy supply side: (1) (the shift in) the relative use of different fossil fuel types (coal, oil, natural gas), and (2) (the change in) the share of non-fossil fuels (nuclear, hydro-power, wind, solar, biomass). For calculating the future emissions in the industrial sector (Emind) the Kaya identities of the industry sector based on EDGAR-HYDE data in 1990 are taken as a starting point. Industry Value Added (IVA) represents the share of industry in the economy (in 1990 dollars). Industrial energy intensity is than defined by Enind/IVA, with Enind the industrial primary energy use. The carbon intensity of the Industrial sector is defined by the carbon intensity of industrial primary energy use, i.e. Emind/ Enind. The regional industrial CO2 emissions for region r and at time t (t = 1990, …, 2100) (Emind(r,t)) can now be described as follows:. éEn (r,t) Emind (r,t) ù Emind ( r , t ) = IVA(r,t) .ê ind . ú Enind (r,t) û ë IVA(r,t). (3.4).
(26) Page 26 of 107. RIVM Report 728001013. This can also be translated into growth trajectories of the industrial value added, energy efficiency of the industrial production and the de-carbonisation improvements of the industrial energy consumption:. [. ]. [. ][. ]. Emind ( r , t ) = Em ind ( r, t - 1) 1+gr ind ( r ,t ) 1 _ ef ind ( r,t ) 1 _ dec ind ( r ,t ). (3.5). The three last factors represent (i) the growth index of IVA in the reference scenario compared to the 1990 values (grind(r,t) in %/year); (ii) the index value of the energy intensity (based on the yearly rate of energy efficiency improvements (efind(r,t) in %/year)), and (iii) the index value of the carbon intensity (based on the yearly rate of decarbonisation (decind(r) in %/year)). The growth of the IVA is described by the simulated pathway of the reference scenario. The yearly efficiency improvement of the industrial sector, and the de-carbonisation rate for the industrial sector are decision parameters in the FAIR model. Electricity production sector The CO2 emissions from the Power sector can be defined as: Em pow ( r , t ) = EDpow ( r, t ) .. En pow ( r, t ) Em pow ( r, t ) . EDpow ( r, t ) En pow ( r, t ). (3.6). where ED pow(r,t) represent secondary energy (electricity) demand for region r and time t (t = 1990, …, 2100), Enpow(r,t) is the primary energy use of the power sector, Enpow(r,t)/ED pow(r,t) represents the convergence efficiency of the power sector and Empow(r,t)/ Enpow(r,t) the carbon intensity of the power sector. The calculations of the emissions in the power sector again start in 1990, using the EDGAR-HYDE emissions data in 1990 initial data. The carbon intensity of the Power sector is defined by two factors: (1) the share of CO2-free sources in the primary energy use (i.e. by use of renewables and nuclear) and (2) the carbon intensity of the fossil fuel based share in primary energy use, related to the fossil fuel mix. In formulas: Em pow ( r, t ) = En pow ( r, t ). EnFossil pow ( r, t ) Em pow ( r, t ) En pow ( r, t ) EnFossil pow ( r, t ). (3.7). with EnFossilpow(r,t) is the fossil fuel based primary energy use of the power sector. Historical evidence shows that the growth of electricity consumption is highly related to the growth of GDP. Therefore, the growth in electricity demand is linked to the growth of GDP according to the reference scenario. This justifies a higher growth rate in electricity consumption in the countries that are entitled to a higher economic growth. The growth in electricity production is affected by the end-use energy efficiency improvement, improvements by de-carbonization and CO2-free electricity, i.e.: éEn pow ( r, t) EnFossil pow ( r, t) Em pow ( r, t) ù . ú Em pow ( r , t ) = GDP ( r, t) .ê En pow ( r, t) EnFossil pow ( r, t)ûú ëê GDP ( r, t). with: GDP(r,t) is total Gross Domestic Production.. (3.8).
(27) RIVM Report 728001013. Page 27 of 107. This can also be translated into growth of the Gross Domestic Production, energy efficiency of the power sector (converge efficiency) and the de-carbonisation improvements of the primary energy use of the power sector, i.e. increasing share of CO2-free sources in the primary energy use and decarbonisation improvements of the fossil fuel-based share in primary energy use: Empow(r , t +1) = Empow(r , t ). [ 1 + grpow( r ,t )] [ 1 _ efpow( r ) ] [1 _ co2freepow(r ) ][1 _ decpow( r )]. (3.9). The four factors represent (i) the growth index of the Gross Domestic Production in the reference scenario compared to the 1990 values (grpow(r,t) in %/year); (ii) the change in the index value of the converge efficiency (based on the yearly rate of energy efficiency improvements (efpow(r) in %/year)), and (iii) the change in index value of the CO2-free share in electricity production (CO2 freepow(r) in %/year)), and (iv) the change in index value of the carbon intensity (based on the yearly rate of de-carbonisation of the fossil fuel-based share in primary energy use (decpow (r) in %/year))..
(28) Page 28 of 107. RIVM Report 728001013.
Afbeelding


+7


GERELATEERDE DOCUMENTEN
Variables predictive of a good outcome were idiopathic epilepsy of all types, cause unknown focal epilepsy, small number of seizures before initiation of AED, later age at onset
In the final chapter of this thesis, the multiple imputation algorithm for missing data in longitudinal networks introduced in Chapter 4 is further extended in three ways, (1)
Betoogd wordt daarnaast dat een register voor bezitloze zekerheidsrechten zeer beperkt de dorst naar informatie bij kredietgevers zou weten te lessen, omdat allerlei andere aspecten
Kwaliteit van schoolleiders en bestuurlijk handelen zijn voor de meeste inspecteurs geen onbekende begrippen, zeker voor degenen die met zwakke en zeer zwakke scholen te maken
Onder auspiciën van CRWO/VSNU en de di- visie Hoger Onderwijs van de VOR wordt in dit cursusjaar voor de derde keer een onder- wijskundig colloquium opgezet ter professio-
Ondertussen hebben regionale overheden, zoals provincies, waterschappen en gemeentes, juist behoefte aan kennis om de voortgang van de circulaire economie in hun regio op een
1,2 In one case, a malignant melanoma of the breast originating in the nipple was responsible for the gross tissue destruction, 1 the breast progressively atrophying
Während große Städte im Hinblick auf eine Klimaanpassung schon re- lativ gut aufgestellt sind, fehlt kleinen und mittelgroßen Städten oft die Kapazität, um einen stra- tegischen
