Contact:
EEMM van Kempen
Centre for Environmental Health Research elise.van.kempen@rivm.nl
RIVM report 630400001/2005
Selection and evaluation of exposure-effect-relationships for health impact assessment in the field of noise and health
EEMM van Kempen, BAM Staatsen, I van Kamp
This investigation has been performed by order and for the account of the Environment Assessment Agency (MNP), within the framework of project I/630400/01/GH
(MNP/50029/LA), Exposure-effect relationships for health impact assessment.
Abstract
Selection and evaluation of exposure-effect-relationships for health impact assessment in the field of noise and health
This report is a background document that can be used to assess the health impact attributable to noise in the Netherlands. To this end the available exposure-effect-relationships in the field of noise and health are reviewed and evaluated, using data published in the epidemiological literature as well as previous reviews. Their applicability for assessment in the Netherlands was demonstrated in case-studies.
Only the relationships describing the association between noise and annoyance, sleep disturbance and cardiovascular disease are considered to be suitable for health impact assessment purposes. Only the relationships for which the evidence for an association between exposure and effect was considered sufficient and which were derived either by means of a quantitative summary of published data or a re-analysis of individual data based on primary studies, were selected. Finally, recommendations were made for the applicability of these exposure-effect-relationships regarding the health impact of noise exposure.
Key words: noise, health, annoyance, sleep disturbance, cardiovascular disease, exposure-effect-relationships
Rapport in het kort
Selectie en evaluatie van blootstelling-effect relaties voor gezondheidseffectschattingen op het gebied van geluid en gezondheid.
In dit achtergrondrapport wordt de laatste stand van zaken weergegeven met betrekking tot blootstelling-effect relaties op het gebied van geluid en gezondheid en hun toepasbaarheid voor de inschatting van de effecten van geluid in Nederland.
Voor een aantal relevante gezondheidseffecten worden de beschikbare blootstelling-effect relaties besproken. Aan de hand van een aantal case-studies wordt de bruikbaarheid van de verschillende relaties voor gezondheidseffectschatting (GES) geanalyseerd. Alleen de relaties die de invloed van geluid op effecten beschrijven waarvoor bewijs was en die zijn afgeleid door middel van een meta-analyse of gepoolde analyse worden uiteindelijk bruikbaar bevonden. Het resultaat is een set van relaties en aanbevelingen die ingezet kunnen worden voor de inschatting van de effecten van geluid in Nederland. Niet alleen in termen van risico’s, maar ook in termen van aantallen getroffenen.
Contents
1 INTRODUCTION... 7
1.1 AIMS AND OBJECTIVES... 7
1.2 NOISE AND HEALTH... 7
2 METHODS ... 11
2.1 IDENTIFICATION OF EFFECTS... 11
2.2 SELECTION OF EFFECTS... 11
2.3 SELECTION AND EVALUATION OF EXPOSURE-EFFECT RELATIONSHIPS... 12
3 RESULTS ... 15
3.1 ANNOYANCE... 15
3.1.1 Studies investigating annoyance ... 15
3.1.2 Factors affecting the association with noise... 15
3.1.3 Annoyance measured in specific groups: children ... 16
3.1.4 Available exposure-effect-relationships... 16
3.1.5 Approaches to assess the number of annoyed people in the Netherlands... 19
3.2 EFFECTS ON SLEEP... 22
3.2.1 Studies investigating the effects on sleep ... 23
3.2.2 Factors affecting the association with sleep disturbance ... 24
3.2.3 Effects in specific groups: children and the elderly... 24
3.2.4 Available exposure-effect-relationships... 24
3.2.5 Approaches to assess the number of sleep disturbed people in the Netherlands ... 27
3.3 EFFECTS ON THE CARDIOVASCULAR SYSTEM... 29
3.3.1 Studies investigating the effects on the cardiovascular system... 29
3.3.2 Factors affecting the association with noise... 30
3.3.3 Specific groups: children ... 30
3.3.4 Available exposure-effect-relationships... 31
3.3.5 An approach to estimate cardiovascular disease attributable to noise ... 32
3.4 COGNITION... 34
3.4.1 Studies investigating the effects on cognition ... 34
3.4.2 Factors affecting the association with cognition ... 35
3.4.3 Available exposure-effect-relationships... 36
3.4.4 Approaches to assess the number of children with impaired cognitive functioning attributable to noise... 37
4 DISCUSSION ... 39
4.1 ANNOYANCE... 39
4.2 SLEEP DISTURBANCE... 40
4.3 CARDIOVASCULAR SYSTEM... 41
4.4 LIMITATIONS OF THE UNDERLYING STUDIES... 42
4.4.1 Exposure-characterization... 42
4.4.2 Statistics... 43
4.5 GENERALIZABILITY/TRANSFERABILITY... 44
4.6 CHILDREN VERSUS ADULTS... 46
CONCLUSIONS AND RECOMMENDATIONS... 47
REFERENCES ... 49
APPENDIX I. NOISE EXPOSURE IN STUDIES INVESTIGATING THE EFFECTS OF NOISE EXPOSURE ON HEALTH AND WELL-BEING... 59
APPENDIX II. OPERATIONALISATION OF EFFECTS IN STUDIES INVESTIGATING THE EFFECTS OF NOISE EXPOSURE ON HEALTH AND WELL-BEING. ... 62
APPENDIX IV. AVAILABLE EXPOSURE-EFFECT RELATIONSHIPS FOR THE EFFECTS OF NOISE ON SLEEP ... 68 APPENDIX V. AVAILABLE EXPOSURE-EFFECT RELATIONSHIPS FOR THE EFFECT OF NOISE EXPOSURE ON THE CARDIOVASCULAR SYSTEM... 72 APPENDIX VI. CHARACTERISTICS OF THE STUDIES INVESTIGATING THE ASSOCIATION BETWEEN NOISE EXPOSURE AND BLOOD PRESSURE IN CHILDREN... 74
1 Introduction
1.1 Aims and objectives
At the moment, environmental health risk assessment is increasingly being used in the development of environmental policies, public health decision making, the establishment of environmental regulations and the planning of research. This not only involves the identification of environmental hazards, but also the quantification of the expected health burden: health impact assessment (WHO-Working Group, 2000). After selecting a set of endpoints for which there is sufficient evidence for an association with the risk factor under study (sometimes called hazard identification), the expected health burden due to an environmental exposure in a specific population can be quantified by combining data on population density with exposure distributions on the exposure (exposure assessment) and information on exposure-effect-relationships1. Exposure-effect-relationships are not only useful for estimating the number of people that is affected, but they can also be used to inform the public and to increase the public and political awareness. Furthermore, they are important when determining threshold and/or guideline values and they can play a role in monitoring.
This report is a background document that can be used when assessing the health impact attributable to noise in the Netherlands. To this end the relevant exposure-effect-relationships in the field of noise and health are evaluated. Finally, some recommendations are given for the applicability of these exposure-effect-relationships regarding the assessment of health impact of noise exposure. The contents of this report is a more extensive treatment of work based on material presented already in Staatsen et al (2004), a book chapter dealing with noise and health (Van Kamp et al., 2004) and the minutes of the WHO-Working group on noise and health indicators (WHO, 2002) (WHO, 2003).
1.2 Noise and health
In most of the industrial world, noise is a pollutant that is persistent and inescapable. One of the most important sources of community noise is caused by transport, comprising road and rail traffic, aviation and shipping (Schafer, 1971). It has been estimated that approximately 30% of the European Union's population are exposed to levels of road traffic noise of more
1 Alternative phrasings are: dose-effect-relationship, dose-response-relationship, exposure-response-relationship. However, dose refers to an accumulated dose that stays in the body after exposure; response refers to the number of people affected (Briggs, 2003).
than 55 dB(A), and that 20% of the population of the European Union experiences noise levels that are considered unacceptable (Berglund et al., 1999). During the last decades, exposure to high noise levels has decreased substantially in some countries due to technological measures (e.g. reduction of emissions, change of road surfaces) and spatial measures such as noise barriers and spatial separation of transport and residential functions. However, due to the enormous growth in traffic and the 24-hour economy, noise will remain a major problem: Because the noise emission per vehicle has decreased during the last decades, the transport-related noise levels have declined slightly in the recent years (RIVM, 2002). But due to the ongoing growth of traffic the noise levels are expected to rise again in the next decades (Staatsen et al., 2004).
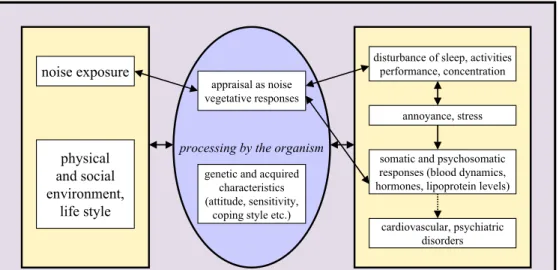
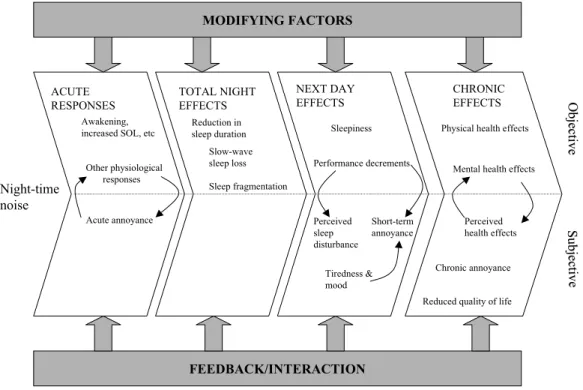
Long term noise exposure is associated with a number of effects on health and well-being. These include community responses such as annoyance, sleep disturbance, disturbance of daily activities and performance, and physiological effects such as hearing loss, hypertension and ischemic heart disease (Berglund et al., 1999). Although there is much discussion about how noise can affect human health, it is hypothesised that stress plays an important role. A model of the Dutch Health Council points out the complexity between noise and health (HCN, 1999) (Figure 1). The model assumes that health status is determined by a combination of endogenous and exogenous factors such as the physical and social environment and life style. Noise exposure is only one of these exogenous factors. This process may be modified by personal characteristics such as attitude and coping style. Noise exposure induces disturbance of sleep and daily activities, annoyance and stress, which may lead to all sorts of intermediate responses, such as hypertension. In turn, these may affect the risk on cardiovascular disease or psychiatric disorders.
Figure 1. Conceptual model on noise and health (Source: HCN, 1999). dynamic demographic, social, cultural, technological and economic environment
noise exposure
physical and social environment,
life style
processing by the organism
disturbance of sleep, activities performance, concentration
annoyance, stress appraisal as noise
vegetative responses
genetic and acquired characteristics (attitude, sensitivity,
coping style etc.)
somatic and psychosomatic responses (blood dynamics, hormones, lipoprotein levels)
cardiovascular, psychiatric disorders
In the end this report provides guidance for the assessment of the impacts of noise exposure on public health. Section 2 addresses which exposure-effect-relationships are relevant to evaluate: exposure-effect-relationships for which the evidence for an association with noise was at least ‘limited’ and that were derived by means of meta-analytic techniques. These relationships will be presented and evaluated in section 3. Their applicability for health impact assessment is demonstrated in case-studies. After a discussion, some key messages and recommendations will be presented in section 4.
2 Methods
2.1 Identification of effects
Based on recent overviews regarding the effects of environmental noise, a set of health
endpoints that are reported in relation to noise exposure, were identified (HCN, 1994), (Porter et al., 1998), (HCN, 1999), (Van Kempen et al., 2002), (Staatsen et al., 2004) (Van Kamp et al., 2004):
• direct masking effects (e.g. speech interference);
• behavioural responses such as coping strategies (e.g. closing of windows) and complaints;
• ‘social’ responses such as annoyance or perceived sleep disturbance;
• acute physiological responses (endocrine and neurophysiological reactions, such as transient blood pressure increases and sleep stage changes);
• cognitive responses such as task interference, effects on children’s learning; • chronic physiological responses e.g. hypertension;
• clinical morbidity e.g. mental health, cardiovascular diseases, immune system deficiencies, teratogenic effects and hearing loss.
2.2 Selection of effects
Some reviews have focused on the evidence provided by the results of epidemiological environmental noise studies. In order to assess the degree of certainty concerning the
relationship between exposure to noise and a particular effect, the available evidence in these overviews was rated in terms of the categories proposed by the International Agency of the Research on Cancer (IARC) as ‘sufficient’, ‘limited’, ‘inadequate’ or ‘lacking’2. For this report we were only interested in the effects for which the evidence for an association with community noise exposure is ‘sufficient’ according to recent reviews (HCN, 1994) (Porter et al., 1998) (Staatsen et al., 2004) (Van Kamp et al., 2004) and which are likely to occur at typical levels of community noise. According to these overviews there is sufficient evidence that noise causes annoyance and sleep disturbance in adults and has impacts on children’s learning. The evidence for an association between noise exposure and cardiovascular impacts is inconclusive. Some reviewers claimed that there is ‘sufficient’ evidence for: (i) the
relationship between noise and hypertension (HCN, 1994); (ii) a causal association between
2 ‘Sufficient’: a relationship has been observed between noise exposure and a specific health effect, chance, bias, and confounding factors can be ruled out with reasonable confidence; ‘Limited’: an association has been observed between noise exposure and a specific health effect, chance, bias, and confounding factors cannot be ruled out with reasonable confidence; ‘Inadequate’: the available studies are of insufficient quality, lack the consistency or statistical power to permit a conclusion regarding the presence of absence of a causal
relationship; ‘Lacking’: several adequate studies are mutually consistent in not showing a positive association between exposure and health effect.
noise exposure and ischemic heart disease (Porter et al., 1998); (iii) an association between ambient noise and ischemic heart disease (Porter et al., 1998). Others state that there is ‘limited’ evidence for associations between noise and blood pressure changes, hypertension, angina pectoris and myocardial infarction (Staatsen et al., 2004). Because several reviewers indicated the evidence as ‘sufficient’ we decided to include cardiovascular disease effects into our evaluation.
Although there is ‘sufficient’ evidence for an effect on hearing, it is unlikely that hearing damage occurs at typical levels of community noise exposure. Therefore the effects on hearing were not dealt with in this report.
2.3 Selection and evaluation of exposure-effect relationships
For each of the selected effects we tried to identify the exposure-effect-relationships that are known up to today, using data published in the epidemiological literature. Exposure-effect-relationships can be derived either from single studies, a quantitative summary of published data (meta-analysis), a re-analysis of individual data based on primary studies (a pooled analysis) or a prospectively planned, pooled analysis of several studies, where pooling is already part of the protocol (Blettner et al., 1999). For this report we were only interested in the exposure-effect-relationships that were derived either by means of a quantitative summary of published data or an analysis of individual data based on primary studies (afterwards or prospectively planned). In case of good study quality, the exposure-effect-relationships of single studies were also evaluated.We evaluated the exposure-effect relationships in a more or less systematic way. The following factors were evaluated: how were the relationships derived, what were the characteristics of the underlying data (design, when and where were the data collected, population characteristics, exposure characterisation, outcome), which statistics were applied and can be said something about the shape. The applicability of the curves was demonstrated by means of case-studies. Where relevant, we presented the curves derived from single studies.
Evaluation of exposure-effect-relationships is only one of the aspects that can be used to answer questions regarding causality (‘is there any other way of explaining the set of facts before us; is there any other answer equally or more likely than cause and effect’). Next to exposure-effect-relationships, the evidence on the strength of the association, its temporality, biological plausibility, coherence, consistency are also important for causality and thus for the assessment of the validity of epidemiological studies for purposes of health impact assessment. In order to get a better feeling of the other causality criteria, we evaluated the causality of the relationships by looking at the underlying studies that assess the impact of noise exposure on the different effects. We looked at the design used (e.g. cross-sectional studies, ecological studies), the characterisation and metric of exposure, the operationalisation of the outcome, the populations under study, alternative explanations for the observed associations in the studies (chance, bias and confounding). As part of this we
also looked at the biologic plausibility. How does the exposure-effect relationship relate to what is known about the biological mechanism ?
3 Results
Before evaluating the relationships between noise and health, we evaluated the causality of the relationships by looking at the underlying studies that assess the impact of noise exposure on the different effects. Subsequently, the exposure-effect relationships were evaluated. The applicability of these curves in health impact assessment were demonstrated by means of case-studies.
More information regarding the operationalisation of the exposure and effect metrics can be found in appendix I and II. Characteristics and formulas of the exposure-effect relationships of the selected effects are presented in appendix III to V.
3.1 Annoyance
It is generally accepted that annoyance is the major effect of environmental noise. Annoyance is a negative evaluation of environmental conditions and can be defined as ‘A feeling of displeasure associated with any agent or condition, known or believed by an individual or group to adversely affect them’ or ‘a feeling of resentment, displeasure, discomfort, dissatisfaction or offence which occurs when noise interferes with someone’s thoughts, feelings or daily activities’ ((Lindvall and Radford, 1973) (Koelega, 1987) (in: WHO, 2000)) (ISO, 2001).
3.1.1 Studies investigating annoyance
The association between noise exposure and annoyance is usually investigated by means of surveys or cross-sectional studies: estimated, yearly averaged noise levels from several sources (air traffic, road traffic, rail traffic, industry) are linked with the annoyance people perceive during a certain period. Sometimes researchers are able to investigate the effect of a new runway or highway or noise abatement measures on peoples’ annoyance in before-after studies (‘natural experiments’). Most studies investigate the effects in adults (older than 18 yrs); in some cases the participants are children (see also section 3.1.3). The results of these studies are rather consistent; most studies find a positive association between noise and annoyance.
3.1.2 Factors affecting the association with noise
The annoyance literature shows that the degree of annoyance caused by noise exposure depends on several characteristics, such as sound level, spectral characteristics and varies with time of the day or season. Based on the results of surveys it has been observed that noise
exposure explains about 25-30% of the observed variance in annoyance. Non-acoustical factors also play a major role (Guski, 1999) (Job, 1999) (Stallen, 1999) (Van Kamp et al., 2004). Examples of non-acoustical factors are individual noise sensitivity, fear with respect to the source, attitude towards the source, perceived control over the situation, and perceived economic or societal advantages of noise generating activity. It appears that these personal, social, and cultural factors explain about one third of the observed variance. From these, anxiety (fear of the noise source) and noise sensitivity are the most important non-acoustical factors of influence on exposure-response relationships (Fields, 1993) (Miedema and Vos, 1998) (Guski, 1999) (Job, 1999) (Stallen, 1999).
3.1.3 Annoyance measured in specific groups: children
While annoyance is one of the most frequently studied noise effects in adults, children’s annoyance with noise sources appears to be an under researched area. Until now, only a few studies looked at it: the Munich Airport study (Evans et al., 1995) (Evans et al., 1998) (Hygge et al., 2002), the Heathrow studies (Haines et al., 2001a) (Haines et al., 2001b) (Haines et al., 2001c), the Tyrol study (Lercher et al., 2000) (Lercher et al., 2002) and the RANCH-study (Van Kamp et al., 2003) (Stansfeld et al., 2005). In these studies children were consistently found to be annoyed by chronic noise exposure. Most studies focus on aircraft noise.
A recent study (Haines et al., 2003) found indications that child noise annoyance is the same construct as adult noise annoyance: the emotional response of children to describing the annoyance reaction was consistent with adult reactions. Some see it as an affective response that points to a chronic decline in well being. For both parents and teachers steeper exposure-response curves were observed than for children (Van Kamp et al., 2003) (Lercher, 2002). Recently, Boman and Enmarker found that teachers were more annoyed than their pupils. It appeared that the teachers perceived the noise to be more unpredictable than the pupils (Boman and Enmarker, 2004).
3.1.4 Available exposure-effect-relationships
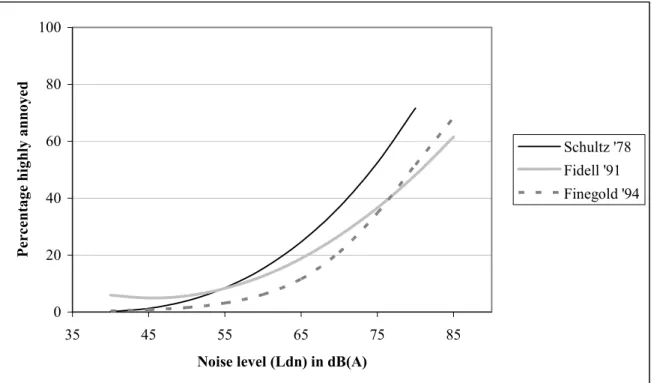
The first generalised exposure-effect-relationship for annoyance was published by Schultz (1978). To this end the data of 11 studies from the UK, France, Germany, Sweden, Switzerland and the USA, published between 1961 and 1972, investigating the effects of road, rail and air traffic noise were pooled. For this analysis, studies were only included in case it was possible a) to translate the reported noise levels into day-night average
A-weighted sound levels (LDN) in a reliable way and b) to make a consistent choice to who were ‘highly annoyed’. In this way 161 data-points were generated, on which a curve was fitted by means of the least-squares procedure. The resulting curve had the shape of a third order polynomial (see Figure 2). It is important to note that the relationship does not apply to prediction of annoyance from high energy impulsive noise exposure and that the function should not be used outside of the range 45 dB(A) < LDN < 85 dB(A).
In 1991, Fidell et al presented an update of the Schultz-curve. Since the publication of this curve, some 15 new studies were published. In order to increase the uniformity/homogeneity,
the participating studies had to meet the following criteria: a) at least one questionnaire item had to inquire directly about long-term annoyance per se, rather than activity interference or other noise effects from which annoyance might arguably be inferred; b) the noise source under study had to be a transportation noise source, and actual acoustic measurements of noise exposure were strongly preferred; c) the reported noise levels, if not reported in units of day-night (LDN) average sound level, had to be convertible into such units with reasonable confidence; d) sample sizes had to be adequate for estimating the prevalence of annoyance with reasonable precision; and e) the scale used for quantification of annoyance had to permit numbers of respondents describing themselves as ‘highly annoyed’ (Fidell et al., 1991). Eventually 27 studies (453 data-points) were included resulting in a quadratic curve (see figure 2). Like Schultz, Fidell used the least-squares procedure to fit the data-points (Fidell et al., 1991).
In 1994, Finegold and colleagues decided to re-analyse the data-set of Fidell. Additional to the five inclusion criteria that Fidell used, they applied an extra criterion: whether or not a significant correlation exists between the day-night average sound levels and the related population annoyance ratings (Finegold et al., 1994). As a consequence they decided to exclude 6 datasets (53 data-points) that did not find a significant association between LDN and annoyance. Again the least-squares procedure was used to fit the data-points. The curve of Finegold was adopted by the U.S. Federal Interagency Committee on Noise for use by federal agencies in aircraft noise-related environmental impact analyses and was recommended for predicting the effects of general transportation noise on people.
0 20 40 60 80 100 35 45 55 65 75 85
Noise level (Ldn) in dB(A)
P ercen ta ge h igh ly an n oyed Schultz '78 Fidell '91 Finegold '94
Figure 2. Exposure-effect-relationships for the relation between noise exposure and annoyance derived by Schultz (1978), Fidell (1991) and Finegold (1994).
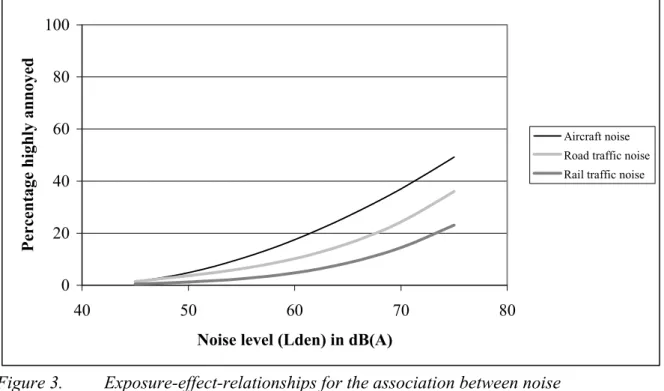
Contrary to the curves that were presented until that time, Miedema and Vos (1998) decided to present source-specific curves. Kryter (1982) already showed that noise from urban street
and road traffic caused less annoyance than the noise from aircrafts with both equal level of LDN. For the relationship between air traffic noise (LDN) and severe annoyance by air traffic noise, Miedema and Vos (1998) made use of the data of 20 surveys
(including 34,214 respondents) published between 1965 and 1992 from different European countries, Australia, USA and Canada; for road traffic noise 21,228 data-points, derived from 26 studies (period 1971-1994 from different European countries and Canada) were available. For railway noise only 9 studies were available. These were published in France, Germany, the Netherlands, Sweden and the UK between 1972 and 1993. To be included into the analyses, acceptable LDN and percentage highly annoyed had to be derived. Because there was no practical need for information concerning the annoyance at extreme levels
(LDN < 45 dB(A) or LDN > 75 dB(A)), these were excluded from the analyses. At these levels the assessment of noise exposure and/or annoyance is relatively inaccurate (Miedema and Vos, 1998). In order to derive exposure-effect-relationships, the authors made use of both the ordinary least squares regression and multilevel procedure. Later, Miedema and Oudshoorn (2001) re-analysed the data, using a model of the relationship between exposure and annoyance that was more sophisticated and better suited for the data. Almost the same data were included: For aircraft noise 19 studies (27,081 data points), for road traffic noise 26 studies (19,172 data points) and for railway traffic 8 studies (7,632 points). Again, the multilevel procedure was used. In addition to the relationships between LDN and annoyance, relationships that use another noise metric (the Lden) and other degrees of annoyance (% annoyed and the % a little annoyed) were presented.
0 20 40 60 80 100 40 50 60 70 80
Noise level (Lden) in dB(A)
Percentage highly
annoyed
Aircraft noise Road traffic noise Rail traffic noise
Figure 3. Exposure-effect-relationships for the association between noise (expressed as Lden) from different sources and annoyance derived by Miedema and
Oudshoorn (2001).
Miedema and Oudshoorn were also the first to present 95% confidence intervals. Although no simple formulas are available, in their article they clearly explained how these intervals
can be derived (Miedema and Oudshoorn, 2001). The exact formulas for the relationships that have been found, involved the formula for a normal distribution. Unfortunately, the covariance matrices, which are essential for calculating the intervals, were not presented. However, one has to keep in mind that the 95% confidence interval that was presented in the article of Miedema and Oudshoorn describes the uncertainty in the line (2001). This is different from the uncertainty in the underlying model.3
Although the Miedema-curves have been derived from probably the most extensive international database currently available, methodological differences in the original studies may have influenced the observed relationships. For example: the selected studies did not adjust for possible modifiers such as insulation, noise sensitivity and situational factors. Although we already know how some of these factors affect the association between noise and annoyance, the influence of some of these factors needs closer examination through additional research. Furthermore, some of the studies included in the Miedema curves were rather outdated.
Another comment is that rather broad inclusion criteria were applied: studies were only included if the reported noise levels could be translated into day-night average A-weighted sound levels in a reliable way and if a consistent choice about the percentage of ‘highly annoyed’ could be made. More specific inclusion and exclusion criteria would be desirable and not only with respect to exposure and outcome, but also with respect to the context of the study. When comparing the analyses of Schultz, Fidell and Miedema, it appeared that 13 data sets were excluded from Miedemas' analyses that were originally included in the Schultz and Fidell analyses, without explanation.
3.1.5 Approaches to assess the number of annoyed people in the
Netherlands
At the moment the fraction of annoyed people in the Netherlands is assessed in two ways: (i) directly, on the basis of survey data, or (ii) on the basis of generalised exposure-effect relationships.
Ad (i). The fraction of (severely) annoyed people is assessed directly by means of national or local surveys. In 1977, 1987, 1993, 1998 and 2003 TNO and RIVM carried out national face-to-face interviews on a representative sample of the Dutch population (persons of 18-16 years and older). The results of 1998 showed that 27% was severely annoyed by road traffic noise. For a population of 20 years and older, this means that about 3.2 million people is severely annoyed by noise of road traffic (RIVM, 2000). In 2003 it appeared that 3.7 million people of 16 years and older were severely annoyed by road traffic noise (29%) (Franssen et al., 2004). Ad (ii). The fraction of (severely) annoyed people can also be estimated using generalised exposure-effect-relationships for the association between air-, road-, and rail traffic noise and
3 In their article, Miedema and Oudshoorn (2001) presented a model of the distribution of noise annoyance with the mean, varying as a function of noise exposure. The confidence interval was only related to the variation of the mean, which is different from the uncertainty in the underlying modelled annoyance distribution.
annoyance, such as the curves derived by Miedema and Oudshoorn (2001) (see appendix III for the corresponding formulas of these relationships). These can be utilized for strategic assessments, in order to estimate the effects of noise on populations on annoyance. The curves have been derived for adults; they are not recommended for specific sources such as helicopters, military low-flying aircraft, train shunting noise, shipping noise or aircraft noise on the ground (EU, 2002). Furthermore, they are not applicable to local, complaint-type situations, or to the assessment of the short-term effects of a change of noise climate.
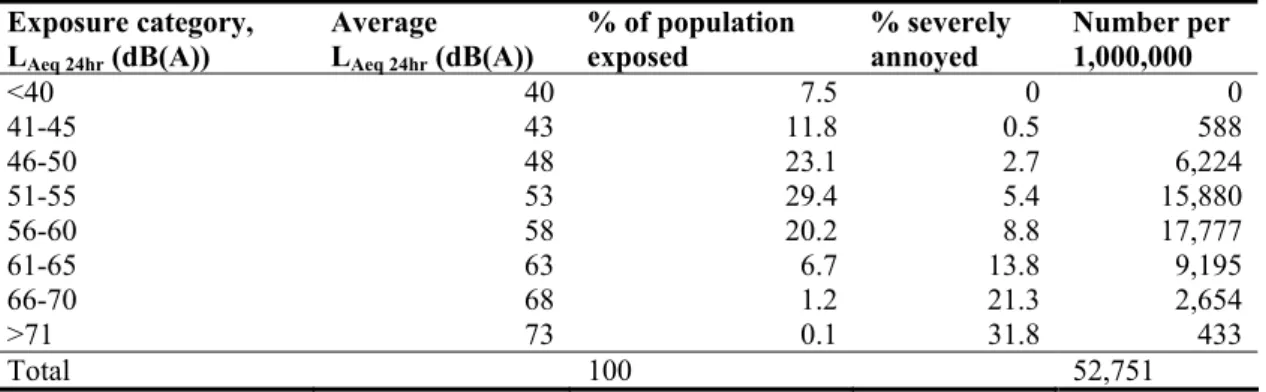
Table 1 illustrates how the Miedema-relationships can be used to assess the number of annoyed people in the Netherlands. Because the relationships are only valid in the range between 45-75 (LDN), people exposed to LDN < 45 dB(A) or LDN > 75 dB(A) were not included. First it is necessary to obtain information on the population exposure distribution for the Netherlands. In this case this was generated by means of EMPARA: a GIS-based noise-propagation model, combining source information with population and built environment data (Dassen et al., 2001). The exposure data were combined with demographic data. Subsequently, the exposure information was combined with the corresponding relationship in the way as is shown in Table 1. In this way it was estimated that 1.8 million people are annoyed by road traffic noise and about 600,000 (500,000 – 850,000) people are severely annoyed by road traffic (Table 1).
Table 1. The percentage of people exposed to and severely annoyed by road traffic noise in the Netherlands (adults only).
Exposure category, LAeq 24hr (dB(A))
Average LAeq 24hr (dB(A))
% of population
exposed % severely annoyed Number per 1,000,000
<40 40 7.5 0 0 41-45 43 11.8 0.5 588 46-50 48 23.1 2.7 6,224 51-55 53 29.4 5.4 15,880 56-60 58 20.2 8.8 17,777 61-65 63 6.7 13.8 9,195 66-70 68 1.2 21.3 2,654 >71 73 0.1 31.8 433 Total 100 52,751
(Sources: Staatsen et al., 2004 and Knol et al., 2005)
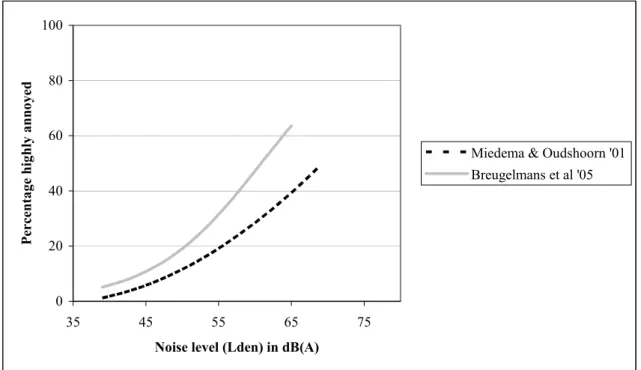
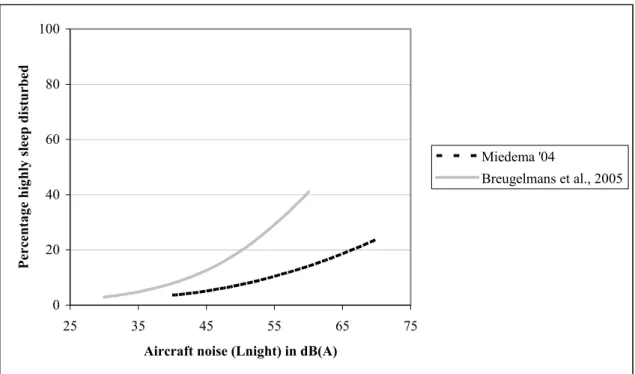
The Miedema-relationships have to be applied with great care on local situations. This becomes clear when comparing the percentage of severely annoyed people due to aircraft noise estimated using the Miedema-curve with the percentage of severely annoyed people due to aircraft noise estimated using the results of a survey around Schiphol carried out in 2002 (Breugelmans et al., 2005). This survey was executed among approximately 6,000 persons of 18 years and older living in an area of 25 x 25 km around the airport. Annoyance was measured as part of a questionnaire, using an eleven-point scale (Breugelmans et al., 2005). Persons that scored 8, 9 or 10 were defined as severely annoyed. Using the results of this survey, it was estimated that the percentage severely annoyed persons in 2002 was 13%. This was higher than can be expected on the base of the Miedema-relationship (see also Figure 4). The formula, based on the results of the survey of 2002 can be found in the appendix.
0 20 40 60 80 100 35 45 55 65 75
Noise level (Lden) in dB(A)
P ercenta ge hig h ly anno ye d
Miedema & Oudshoorn '01 Breugelmans et al '05
Figure 4. Comparison between the exposure-effect relationships derived in a survey around Schiphol Airport (Breugelmans et al., 2005) and the Miedema-curve (2001) for aircraft noise annoyance.
3.2 Effects on sleep
Sleep is an active physiological process and defined ‘as a state of the brain and body governed neural systems and characterized by periodic, reversible loss of consciousness; reduced sensory and motor functions linking the brain with the environment; internally generated rhythmicity; homeostatic regulation; and a restorative quality that cannot be duplicated by food, drink or drug.’(Aldrich, 1999). Several reviews have shown that night-time noise can affect people’s sleep (Lukas, 1975) (HCN, 1994) (Carter, 1996) (Porter et al., 2000). These effects may manifest itself in various ways: in the sleeping behaviour (e.g. increasing the time awake during the night), in the structure of the sleep (as measured by an Electroencephalogram, EEG), as physiological responses or as effects in the period after sleep (Van Dormolen et al., 1988). Several effects of noise on sleep, varying in severity (and evidence burden), have been measured:
• primary effects like difficulties falling asleep, awakenings, sleep stage changes and instantaneous arousal effects during the sleep (temporary increase in blood pressure, heart rate, vasoconstriction, release of stress hormones in the blood, increased motility);
• secondary or ‘after effects’ measured the next day: decrease of perceived sleep quality, increased fatigue and decrease in mood and performance;
• long-term effects on well being: increased medication use, or chronic annoyance. In Figure 5, a model for the different causes and effects of night-time noise exposure on sleep is presented. It shows that the relationship between community noise, sleep, behaviour and health is a rather complex one. Several research teams have tried to get more insight into this matter. The general picture of these attempts is that sleep disturbance is seen as an intermediate effect: It is assumed to be an initiator of diseases and/or it aggravates existing disease. Whether this will happen depends on the person’s vulnerability and/or sensitivity (Cohen et al., 1986) (Berglund et al., 1999) (Van Kamp et al., 2004) (Staatsen et al., 2004).
Figure 5. The potential impact of night-time noise: a model framework (Porter et al., 2000).
3.2.1 Studies investigating the effects on sleep
The effect of noise exposure on people’s sleep is mainly investigated in laboratory studies. Field studies were carried out to a lesser degree and involved cross-sectional studies and intervention studies (investigating the effect of noise reductions or increases in noise). These studies were primarily focussed on the effects of transport related sources (air, road –and rail traffic). Little research has been conducted into sleep disturbance from localised sources such as factories, firing ranges, shunting yards, wind turbines, climate control systems, building or demolition work (HCN, 2004). Roughly, we can distinguish three types of studies (see also Figure 5):
● studies (primarily laboratory studies) investigating the reactions on noise events (e.g. an over-flight);
● studies (both field and laboratory studies) investigating the effects before, during and after a night of sleep of mainly road -and air traffic noise. These studies investigate how night-time noise during a sleep period affects the duration of the different sleep stages, sleep quality, awakening and getting to sleep, and the mood and performance the next day;
● field studies investigating the effects of long-term noise exposure on health and well-being: decreased sleep quality, sleep disturbance, health complaints, the use of sleeping pills and sleepiness.
More details can be found in the Appendices (I and II).
Night-time noise MODIFYING FACTORS FEEDBACK/INTERACTION ACUTE RESPONSES TOTAL NIGHT EFFECTS NEXT DAY EFFECTS CHRONIC EFFECTS Awakening, increased SOL, etc
Other physiological responses Acute annoyance Reduction in sleep duration Slow-wave sleep loss Sleep fragmentation Sleepiness Performance decrements Short-term annoyance Perceived sleep disturbance Tiredness & mood
Physical health effects
Mental health effects
Reduced quality of life Chronic annoyance Perceived health effects ObjectiveO bjecti ve Su bje cti ve Su bje cti ve
In most cases the study population consisted of adults; some studies investigated the effects on elderly (> 60 yrs) and children.
3.2.2 Factors affecting the association with sleep disturbance
Age, sex, season, annoyance from other environmental factors, medical condition and medication are important factors of influence with regard to the level of sleep disturbance (Staatsen et al., 2004). Personal factors of assumed importance are anxiety and noise sensitivity. Social factors that play a role are the attitude and expectancies regarding possible changes of the source (e.g. growth of the airport, or increase of noise levels, number of flights) (Job, 1999) (Stallen, 1999).
3.2.3 Effects in specific groups: children and the elderly
Until 1991 only 5 studies were carried out investigating the effects in elderly (> 65 yrs) (Hoffman, 1994). Effects under investigation were sleep latency, awakenings, sleep stage changes, sleep structure, heart rate, sleep quality, mood and sleep disturbance.
A recent report of the Dutch Health Council showed that the number of studies among children regarding the relation between noise and sleep is limited (HCN, 2004). To our knowledge there are only three studies available investigating the effects of night-time noise on children’s EEG. These laboratory studies involved only a small number of respondents (Muzet et al., 1980) (Busby and Pivik, 1985) (Eberhardt, 1990). From these studies it can be concluded that children seem to have better perceived sleep quality than adults. Sleep impairment in children seems to start at higher noise levels than in adults (Öhrström et al., 2003). On the one hand young children are less prone to awakenings due to noise than adults (Lukas, 1972), but on the other hand the autonomic nerve system of children is more easily activated during their sleep (Semczuk, 1967) and children seem to have higher cardiovascular responses than adults (Muzet et al., 1980).
3.2.4 Available exposure-effect-relationships
For several combinations of exposures (expressed in several metrics) and outcomes, exposure-effect-relationships have been derived. In most cases, laboratory studies were included. In comparison to field studies, these find a stronger association with noise. One of the possible explanations for this difference is habituation, which cannot be accounted for in the laboratory (Berglund et al. 1999). Inside both the group of field and laboratory studies there are large discrepancies which account for a very large variability of the results. Because the aim of this report is to select exposure-effect-relationships that can be used in health impact assessment, only the most recent curves based on field studies are presented here. An overview of all the available exposure-effect-relationships is presented in Appendix IV. Analogue to the exposure-effect-relationships derived for the association between road, rail and air traffic noise and annoyance, Miedema et al. (2003) carried out a re-analysis of individual data for sleep disturbance. Included were: (i) studies where Lnight was included in
the data-set or the probability to calculate/estimate this metric on the basis of information regarding the included sites; and (ii) studies using questions regarding waking up or being disturbed by noise during the night. Studies using questions regarding disturbance of sleep or resting were excluded. In the opinion of Miedema and colleagues (2003), resting is different from sleeping and does not need to take place during the night only. Furthermore, low exposure levels (Lnight < 45 dB(A)) were excluded from the analyses because, according to Miedema et al. (2003), in general, the assessment of those noise levels is relatively inaccurate and in situations with these low levels, other sources may be more important. High exposure levels (Lnight > 65 dB(A)) were also excluded, because in areas with very high exposure levels there is a relatively high risk of self-selection of persons not bothered by noise. However, data dealing with this hypothesis are lacking. Eventually, 11 European studies, 2 Canadian and a Japanese study from the period 1975 – 2001 (8,459 subjects) for road traffic noise and 6 European studies and a Japanese study (period 1983-2001) (4,098 subjects) for rail traffic noise were included in the analysis. In order to derive exposure-effect-relationships for sleep disturbance, the same statistical model was used that was already developed for the analysis of the relationship between noise exposure and noise annoyance (Miedema and Oudshoorn, 2001). The relationships give the percentage highly sleep disturbed (%HSD), sleep disturbed (%SD), and (at least) a little sleep disturbed (%LSD) by road and railway noise as a function of the outdoor Lnight at the most exposed façade (Miedema et al., 2003). Because the
estimated variance of the normal distribution of the sleep disturbance scores was very high for aircraft, no exposure-effect-relationships for aircraft noise were presented. In a follow-up analysis, Miedema and Oudshoorn (2004) investigated whether there were reasons not to include particular data-sets used in the earlier analysis. As a result the researchers decided to include an American and a British study (DORA, 1967) (Hazard, 1971) that were not used in the earlier analysis. Two new studies with data on Lnight and self-reported sleep disturbance were also included (DORA, 1980) (Wirth et al., 2004). A total of 8 studies (one American and 7 European studies) from the period 1967 to 2004 were now included for the analysis. Eventually, two curves were presented: a curve with and a curve without study effect. Because, this has also been included in the analyses for road traffic and railways, the researchers recommended to use the model that incorporated a study effect.
When using the exposure-effect-relationships for sleep disturbance, we have to take into account that these curves are not adjusted for other factors. Therefore, further verification of these relationships is needed with attention to the construction of dwellings (insulation, position of the bedroom) and other use of windows. The 95% confidence interval describing the uncertainty of the line can be estimated in a way similar to the exposure-effect-relationships for annoyance. Because Miedema (2003) worked with distributions, no simple formulas were available.
Figure 6. Exposure-effect-relationships between night-time noise exposure (Lnight , outside at
most exposed façade) and self-reported sleep disturbance for exposure to road, rail, and air traffic noise, derived by Miedema et al. (2003) and Miedema and Oudshoorn (2004).
Apart from sleep disturbance, the Working Group on Health and Socio-Economic Aspects (WGHSEA) also recommended relationships for a) awakenings and b) instantaneous and mean motility (Passchier-Vermeer, 2002) (Miedema et al., 2003) (Passchier-Vermeer, 2003) (WGHSEA, 2003).
Ad a) The relationship describing the association between aircraft noise events during the night and behavioural awakenings was derived by means of a meta-analysis. To this end 110 aggregated data points, derived from eight field studies were pooled by means of a regression analysis. The participating studies were carried out in Europe (France, the United Kingdom and the Netherlands) and in the USA between 1973 – 2002 (Passchier-Vermeer, 2003). According to Passchier this relationship is applicable to the general population exposed to commercial aircraft noise events during night-time. However, a few comments can be made: Whether a person awakes from an aircraft noise event depends on the noise level of that event. A Lnight can be calculated by combining the SELs of the noise events that took place in the period between 23 and 7 hr. This means that many noise events with a low noise level can lead to the same value for Lnight as a few very loud noise events. At a given value for Lnight a person awakes more often in the case of many noise events with low Sound Exposure Levels compared to as situation with only a few noise events with high sound exposure levels. Furthermore, one should take into account that people awake spontaneously: According to the Dutch Health Council this 1.5 to 2 times a night (average); next to this, the level of consciousness can be so high that an aircraft event can be heard (this happens about 10-12 times a night) (HCN, 2004). When more noise events occur during the night, the chance that a person hears such an event when he/she is awake is higher. A complicating factor is that until now, studies only investigated the effects at individual level. At a certain level of Lnight the individual chance that a person awakes due to aircraft noise events is smaller in case there
0 20 40 60 80 100 35 45 55 65 75
Noise level (Lnight) in dB(A)
Percentage hi g h ly sl eep dist u rbe d
Road traffic noise Rail traffic noise Air traffic noise, with study effect
Air traffic noise, without study effect
are only a few events with high sound levels. It is unknown how this works on population level. This makes that the relationship is not applicable yet. A recent German study does an attempt to quantify the effect on population level (Basner et al., 2004) (Fast, 2004).
Ad b) The relationships describing the association between noise and motility were based on actimetry4 data of a Dutch study that was carried out around Schiphol Airport. Participants were 418 subjects (aged 18-81 years), who were measured during 11 nights (63242 aircraft noise events). The probability of motility has been considered at the 15-s interval at which the maximal indoor equivalent sound level in a 1-sec interval during an aircraft noise event occurs. Using the data of this study, relationships between aircraft noise-induced increase in probability of motility and indoor Lmax and indoor SEL of aircraft noise events were obtained by using a random effects logistic regression model with a random subject factor.
With regard to the applicability of these motility-curves the following can be said: Since the study has sufficient power and because several shortcomings of earlier studies have been accounted for, the derived relations are applicable for the indoor situation for Lmax indoor -values up to 70 dB(A) or SELindoor values up to 80 dB(A). With the exclusion of children, persons with night-time shifts, severely diseased people and persons who recently started to use sleep medication, the curves are generally applicable. The relationships can not be applied in situations where the difference between night-time aircraft noise levels (Lnight) and the equivalent aircraft noise levels for the 24hrs period differ from the differences found in the study of Passchier-Vermeer (2002). She showed that the equivalent aircraft noise levels for a period of 24 hrs affected the relationship between night-time noise exposure and motility (Passchier, 2003). An important factor influencing this relationship is the individual long-term aircraft noise exposure during sleep. As the aircraft noise levels become higher, the probability of instantaneous aircraft-noise related increase in motility is much lower (Passchier-Vermeer, 2002).
3.2.5 Approaches to assess the number of sleep disturbed people in the
Netherlands
Despite the large number of available exposure-effect-relationships, only the relationships between air, road, -and rail traffic noise and sleep disturbance from Miedema (2003, 2004) are in use to assess the impact of noise exposure on people’s sleep in the Netherlands. These were also recommended by the Working Group on Health and Socio-Economic Aspects to be incorporated into the European Noise Directive (END) (WGHSEA, 2003).
An example: The calculation of the fraction of sleep disturbed people was similar to the calculation of the fraction of annoyed people, applying the exposure-effect-relationships on a given population noise exposure distribution (derived by means of EMPARA). Because the relationship is only applicable for the range 45 – 65 dB(A) (Lnight), persons outside this range
4 Actimitry is carried out by means of a device (a kind of watch) that the respondent has to ware around his/her wrist: the actimeter which detects body movements (motoric activity, motility). Per time interval (e.g. 15 seconds) they register the time and a value that gives an indication for the strenght of the body movements during the time interval.
were not included in the calculation. Again, only adults were included. By doing this, it was estimated that 300,000 (200,000 – 450,000) (2%) people may experience severe sleep disturbance due to road traffic noise in 2000 (Staatsen et al., 2004) (Knol et al., 2005).
Similar to annoyance, the fraction of (severely) sleep disturbed people can also be assessed directly. The results of the survey of TNO/RIVM among a representative sample of the Dutch population showed that in 2003 about 1.5 million Dutch people of 16 years and older (12%) were severely sleep disturbed by road traffic noise. In 1998 8% was severely disturbed. Furthermore, it was estimated that in 2003 about 890,000 persons were severely sleep disturbed by moped noise (Franssen et al., 2004)
Like annoyance, the application of the sleep disturbance curves on local situations has to be done with great care. In the surveys around Schiphol that were mentioned already in section 3.1.5, sleep disturbance was also measured, using an eleven point scale. Persons that scored 8, 9 or 10 were defined as severely sleep disturbed (Breugelmans et al., 2005). On the base of the results of the survey carried out in 1996, it was estimated that approximately 7% (about 190,000 persons) were severely sleep disturbed. In 2002, this decreased to 5% (about 130,000) persons). In both situations, the estimated percentages were higher than was expected on the base of the curve derived by Miedema (2004) but similar to what was found on the base of the national surveys of TNO/RIVM. In 2003 and 1998 3% of the respondents were severely sleep disturbed. For 1998 it was estimated that about 180,000 persons in the Netherlands were severely sleep disturbed due to air traffic noise from Schiphol (Fast, 2004) (Breugelmans et al., 2005).
3.3 Effects on the cardiovascular system
Several literature reviews have suggested that noise exposure is associated with blood pressure changes and ischemic heart disease risk (HCN, 1994) (Morrell et al., 1997) (Babisch, 1998) (Porter et al., 1998) (Van Kempen et al., 2002). A broad range of effects on the cardiovascular system related to exposure to noise, have been reported: (i) systolic and diastolic blood pressure differences (expressed in mmHg); (ii) changes in the occurrence (prevalence, incidence) of hypertension, myocardial infarction and angina pectoris, and (iii) changes in the number of hospital admissions and/or mortality due to cardiovascular disease. Usually the effects that were found are small; transient stress-related hemodynamic responses that are harmless on an individual level may result in slight shifts in blood pressure on population level. In a smaller, susceptible proportion of the population this may lead to increases in hypertension and, eventually, prevalence of ischemic heart disease, including angina pectoris and myocardial Infarction.
Although very complex, the biologic mechanism of noise exposure leading to cardiovascular effects seems plausible. The literature has suggested that noise-induced cardiovascular effects must be seen as the consequence of stress, which can arise in several ways in relation to noise. In experimental studies, investigating the short-term of noise exposure, acute biochemical, physiologic, and cardiovascular changes have been found, which mark a common physiologic stress reaction of short duration that occurs as a consequence of the activation of the autonomous nervous system and hormone system. Another possibility is that the effect of noise on the auditory system is transmitted to the Reticular Arousal System (RAS) and the hypothalamus, where both neuronal and hormonal activity may be activated. Stress can also be the consequence of noise appraisal (Van Kempen et al., 2002).
3.3.1 Studies investigating the effects on the cardiovascular system
The field studies investigating the impact of noise on the cardiovascular system were mainly cross-sectional. We can distinguish studies investigating the effects of occupational noise exposure and studies investigating the effects of community noise exposure (road, rail and air traffic noise). The occupational studies were performed among a great variety of industries throughout the world within a broad exposure range. Most studies were carried out among adults (Van Kempen et al., 2002). For more information see also Appendix II and III.3.3.2 Factors affecting the association with noise
When investigating chronic diseases in cross-sectional studies there is the problem of self-selection in community studies and the healthy worker effect in occupational studies. In community studies, somewhat sensitive subjects may move out of the polluted areas, diluting the effect of interest. In occupational studies, subjects may leave the job because of cardiovascular disease due to noise or because of the noise itself. These effects tend to diminish the magnitude of the effects found in studies (Babisch, 1998).
It might be possible that physiological effects as blood pressure, are not the result of the noise exposure itself, but that psychological factors might also play a role. This assumption is not new: Until now several studies have looked into the impact of variables on the relation between noise and health, that are assumed to be connected with the processes that determine whether environmental sounds are noise. The basic assumption of these studies were stress models assuming that the presence of noise is not always enough to explain the occurrence of health effects. The appraisal of the noise by the individual is also important. This process of appraisal could have affected the occurrence of health effects as blood pressure elevations and symptoms.
Another explanation for the weak association between noise exposure and health might be that the effects of noise exposure especially appear in risk groups. Indications for this assumption come from some recent studies: In a study among adults, investigating the effects of road traffic noise on ischemic heart disease, Babisch and colleagues found that the association between road traffic noise exposure and ischemic heart disease was modified by pre-existent disease (Babisch et al., 2000).
3.3.3 Specific groups: children
Only a few studies investigated the effects of (military) air traffic, road traffic and rail traffic noise on blood pressure and heart rate in children aged 3-17 years. These included mainly cross-sectional studies, and 2 follow-up studies with sample sizes varying from
approximately 100 to 1,500 children. More characteristics of these studies are presented in Appendix VI. Until the Eighties the results of the studies that have investigated the effects of aircraft, road traffic and rail traffic noise exposure on systolic and diastolic blood pressure and heart rate in children are difficult to interpret, since limited quantitative data were presented. In these studies, very crude data regarding more blood pressure abnormalities in children living in the vicinity of airports or attending schools in areas with high noise exposure, were reported. The results of the later studies were rather inconsistent: although often an association with systolic blood pressure was found, the results for diastolic blood pressure and heart rate were contradictory. The conclusions that can be drawn from these studies are limited, because of a number of methodological problems (e.g. small differences in noise levels between the exposure groups, potential selection bias, a lack of control for socio-economic status factors, insulation and parental history of high blood pressure).
3.3.4 Available exposure-effect-relationships
In 1993, Passchier-Vermeer published the results of a systematic review evaluating
21 occupational studies and some community noise studies. After analysing the data, increases of the mean systolic and diastolic blood pressure of 3.9 and 1.7 mmHg, respectively, were observed for persons in exposed groups compared to persons in reference groups. Also a significant increase in the risk of hypertension was found: a relative risk (RR) of 1.7 for noise levels exceeding 85 dB(A). The observation threshold for hypertension was estimated to correspond to an LDN value of 70 dB(A) for environmental noise exposure (Passchier-Vermeer and Passchier, 2000).
The second meta-analysis was carried out by Duncan et al. (1993). They found an increase in the odds of developing hypertension as a function of increasing noise levels above 20 KE. However, in this meta-analysis the effect of different exposure sources were combined.
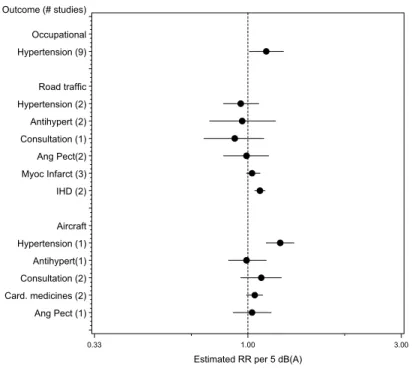
To gain more insight into the potential health impact of noise exposure, a meta-analysis of 43 epidemiological studies published between 1970-1999 and investigating the relation between noise exposure (both occupational and community), blood pressure and/or ischemic heart disease (ICD-9: 410-414) was conducted in 2000. A wide range of effects, varying from blood pressure changes to a myocardial infarction, was studied. Quantitative summaries were obtained by means of a random effects model. Only estimates from studies adjusting for at least age and gender were included into the analysis. Because it was not possible to indicate the shape of the curve and a threshold value on the base on the available data, it was decided to use two models for the meta-analysis: an exponential and an additive model. The latter assumes that the increase in prevalence per unit of noise is constant, while the first assumes a constant relative risk (RR) per unit of noise (in other words the relation between the exposure and the prevalence of the effect concerned is exponential). Eventually, both models seemed to fit the data (Van Kempen et al., 2002). With respect to the association between noise exposure and blood pressure, small blood pressure differences were noticed. A significant association for both occupational noise exposure and air traffic noise exposure and hypertension was recorded: RRs of 1.14 (1.01 – 1.29) and 1.26 (1.14 – 1.39) per 5 dB(A) noise increase were estimated, respectively. Air traffic noise exposure was positively associated with the consultation of a GP or specialist, the use of cardiovascular medicines and angina pectoris. In cross-sectional studies, road traffic noise exposure increases the risk of myocardial infarction and total ischemic heart disease (see also Table 1 of Appendix V) (see also Figure 7).
The study of Van Kempen included studies carried out in the period 1970-1999. However, in the period 2000 until now the results of new community noise studies investigating the effects of road traffic, air traffic and rail traffic noise on cardiovascular disease have come out. The conclusions from these studies did not really differ from what is already found in the published reviews on this topic. New is that now also the effect of night-time noise exposure was investigated and that the effects of air pollution were also taken into account. The results of the Spandauer Gesundheits Survey showed that night-time noise exposure was stronger associated with medical treatment for hypertension than day-time noise exposure (Maschke, 2003). A time-series analysis of hospital admission data in Madrid in the period 1995-1997
showed a clear association between emergency admissions for all and specific (circulatory, respiratory) causes and environmental noise levels (61-72 dB(A)). Other explanatory factors such as air pollution levels were controlled for in the models. About 5% of all emergency admissions could be attributed to high noise levels (Tobias et al., 2001).
Outcome (# studies) Ang Pect (1) Card. medicines (2) Consultation (2) Antihypert(1) Hypertension (1) Aircraft IHD (2) Myoc Infarct (3) Ang Pect(2) Consultation (1) Antihypert (2) Hypertension (2) Road traffic Hypertension (9) Occupational
Estimated RR per 5 dB(A)
0.33 1.00 3.00
Figure 7. Summary estimates, expressed as relative risks (RR) per 5 dB(A), for the association between noise exposure, hypertension, and ischemic heart diseases, adjusted for gender and age. The black circle and the horizontal line correspond to the estimated RR5 dB(A)
and 95% confidence interval. The dotted vertical line corresponds to no effect of noise exposure (Source: Van Kempen et al., 2002).
3.3.5 An approach to estimate cardiovascular disease attributable to
noise
On the ground of the relationships derived by Van Kempen, some estimates were available for the risk on cardiovascular disease attributable to noise from air- and road traffic among adults (Staatsen et al., 2004) (Knol et al., 2005). When doing this, it was assumed that noise exposure may have a small effect on cardiovascular disease progression. Looking at studies investigating the effects on the cardiovascular system a range of endpoints that is consistent with known cardiovascular disease progression can be observed (Van Kempen et al., 2002). Following the reasoning of Dutch Health Council model (see Section 1), it was assumed that the risk elevations associated with noise exposure for the several endpoints are an indication of a small contribution to total disease prevalence. From this worst-case perspective, the annual hypertension mortality that may be attributed to noise exposure (population attributable risk or PAR) was calculated. No distinction was made between aircraft, road or rail traffic noise, although these different noise types may be processed in different ways. The
calculation consisted of three steps: First, PARs were calculated by combining the exposure population distribution with quantitative exposure-effect information, applying equations 1 and 2: 1) 5 *β ) (
e
RR
i Li Lcut off − − = 2)∑
∑
≥ >∗
∗
−
=
0 0 /)
1
(
i i i i i i noise on hypertensip
RR
p
RR
PAR
3) PARmortality/noise =PARmortality/hypertensionxPARhypertension/noise
in which:
PAR = Population Attributable Risk RRi = relative risk in exposure class i,
Li = exposure level in class i, expressed in dB(A),
Lcut-off = cut-off or reference level,
β = the risk function estimate (per 5 dB(A)) pi = exposure probability in class i.
The exposure-effect-relationship used, was derived from Van Kempen et al. (2002). A β of 0.23 was chosen (95% CI 0.13 - 0.33) or a relative risk per 5 dB(A) of 1.26 (95% CI 1.14 - 1.39). It was assumed that the relation between noise exposure and the prevalence of hypertension is exponential. Because, the studies investigated the effects on the cardiovascular system were carried out in the range between 50 – 75 dB(A), only these were included; a cut-off point of 50 dB(A) was used.
After applying equations 1 and 2, a population attributable risk of 0.06 for noise-induced hypertension was found. This means that a maximum of 200,000 cases of hypertension could be attributable to road traffic noise exposure. Since most people suffering from hypertension don't experience problems in their daily functioning, this health state is normally not incorporated in the calculation of the burden of disease. Therefore the fraction of noise-related mortality attributable to hypertension (0.0043) was estimated. This was done by multiplying the PAR for noise-induced hypertension (0.06) with the population attributable risk for hypertension-induced mortality (0.073) (equation 3). By multiplying this PAR with annual mortality data, obtained from Dutch health statistics it was estimated that maximum 1,100 people may die annually due to noise attributive hypertension (Staatsen et al., 2004) (Knol et al., 2005).
3.4 Cognition
Although it has been documented in several studies that noise adversely affects cognitive performance, this paragraph is entirely focussed on children.
In children, the possible effects of noise on cognitive functioning were studied the most. In studies investigating the effects of chronic noise- exposure to air-, rail-, and road traffic, effects were found on reading, attention, problem solving and memory. In summary, the following results have been found in children exposed to high levels of environmental noise, compared to children in quieter schools: (a) deficits in sustained attention and visual attention; (b) difficulties in concentration; (c) poorer auditory discrimination and speech perception; (d) memory impairment for tasks that require high processing demands; and (e) poorer reading ability and school performance on national standardised tests (Stansfeld et al., 2000) (Stansfeld and Haines, 2002). The general finding was that mainly performance on the complex tasks is affected.
With regard to cognition, not much is known about the underlying mechanisms. Only some hypotheses are known (Stansfeld et al., 2000) (François and Vallet, 2001).
One hypothesis is that at least in the school context, noise affects the intelligibility of speech communication. This can lead to difficulties in written and spoken language, and adverse effects on language development and the acquisition of reading skills. As a consequence children’s reading may be impaired and their vocabulary is reduced. Disturbed speech communication may have serious repercussions on the education and intellectual development of young people. If a message is degraded, they cannot reconstitute the fragments that may be masked by the noise. Due to noise there is a loss of meaning in the content of teachers’ instruction, children may have problems with the intelligibility of letters, words and even entire sentences. It has been shown that, in a noisy environment, children confuse certain consonants and that sound distortion makes certain parts of words (particularly endings) unintelligible. A hypothesis that is related to this, is the tuning out response: children may adapt to noise interference during activities by filtering out the unwanted noise stimuli. However, researchers think that this strategy may ‘over-generalise’ to situations where noise is not present, such that children tune out stimuli indiscriminately. It is hypothesised that mechanisms as auditory discrimination and speech perception are important mediators of the possible association between noise and performance.
3.4.1 Studies investigating the effects on cognition
Most research on noise and cognition has been carried out in primary school children, aged 5 to 12 years. The effects of mainly aircraft noise were investigated by means of cross-sectional studies or laboratory studies. Detailed information can be found in Appendix I and II. Tables 2 and 3 give an overview of the most recent studies investigating the effects of noise exposure on children’s cognition. For reading ability consistent results were observed,