RIVM report 601501016/2005
Environmental Risk Limits for alcohols, glycols, and some other relatively soluble and/or volatile compounds
1. Ecotoxicological evaluation
E.M.J. Verbruggen, T.P. Traas, R.H.L.J. Fleuren, S. Ciarelli, R. Posthumus, J.H. Vos,
J.W.A. Scheepmaker, P.L.A. van Vlaardingen
This investigation has been performed for the account Directorate-General for Environmental Protection, Directorate for Chemicals, Waste and Radiation, in the context of the project ‘International and National Environmental Quality Standards for Substances in the Netherlands’, RIVM-project no. 601501.
Contact:
E.M.J. Verbruggen
Expert Centre for Substances E-mail: eric.verbruggen@rivm.nl
National Institute for Public Health and the Environment, PO Box 1, 3720 BA Bilthoven, the Netherlands. Tel. 31-30-2749111, fax. 31-30-2742971
Rapport in het kort
Milieurisicogrenzen voor alcoholen, glycolen en enkele andere relatief oplosbare en/of vluchtige verbindingen 1. Ecotoxicologische evaluatie
In dit rapport zijn maximaal toelaatbaar risiconiveaus (MTR), verwaarloosbaar risiconiveaus (VR) en ernstig risiconiveaus (EReco, Engelse afkorting SRCeco) afgeleid voor 1-butanol,
2-butanol, n-butylacetaat, cyclohexylamine, diethyleenglycol, ethyleenglycol, ethylacetaat, methanol, methylethylketon, tribroommethaan en triethanolamine. Deze milieurisicogrenzen zijn afgeleid voor de compartimenten water, bodem en sediment en zijn gebaseerd op
milieuchemische gegevens en ecotoxicologische gegevens voor met name het aquatische milieu. De risiconiveaus vormen de basis voor een schatting van het potentiële risico van stoffen voor een ecosysteem. Dit rapport heeft een bijbehorend deel van Traas en Bontje, gepubliceerd in 2005, waarin het blootstellingsmodel Humanex wordt gebruikt om MTRs voor de mens te berekenen, met als doel om milieurisicogrenzen af te leiden, die beschermend zijn voor zowel de mens als ecosystemen.
Trefwoorden: milieurisicogrenzen; alcoholen, glycolen, maximaal toelaatbaar risiconiveau, verwaarloosbaar risiconiveau, ernstig risiconiveau
Abstract
Environmental Risk Limits for alcohols, glycols, and some other relatively soluble and/or volatile compounds 1. Ecotoxicological evaluation
In this report, maximum permissible concentrations (MPC), negligible concentrations (NC) and serious risk concentrations (SRCeco) are derived for the following compounds: 1-butanol,
2-butanol, n-butyl acetate, cyclohexylamine, diethylene glycol, ethyl acetate, ethylene glycol, methanol, methyl ethyl ketone, tribromomethane and triethanolamine. These environmental risk limits are derived for the water, soil and sediment compartments and are based on
environmental chemistry data and data on ecotoxicology, mainly for the aquatic environment. These risk limits serve as the basis for an estimation of the potential risks of substances to an ecosystem. This report has a companion report by Traas and Bontje, published in 2005, in which the exposure model Humanex is used to calculate maximum permissible concentrations for humans, to derive risk limits that protect both humans and ecosystems.
Keywords: environmental risk limits, alcohols, glycols, maximum permissible concentration, negligible concentration, serious risk concentration
Contents
Samenvatting ____________________________________________________________________________ 9 Summary ______________________________________________________________________________ 11 1. Introduction _______________________________________________________________________ 13 2. Substance properties and use _________________________________________________________ 17
2.1 Physicochemical properties _______________________________________________________ 17 2.2 Properties and use ______________________________________________________________ 22
2.2.1 1-Butanol___________________________________________________________________ 22 2.2.2 2-Butanol___________________________________________________________________ 22 2.2.3 n-Butyl acetate ______________________________________________________________ 22 2.2.4 Cyclohexylamine _____________________________________________________________ 22 2.2.5 Diethylene glycol_____________________________________________________________ 22 2.2.6 Ethyl acetate ________________________________________________________________ 22 2.2.7 Ethylene glycol ______________________________________________________________ 22 2.2.8 Methanol ___________________________________________________________________ 23 2.2.9 Methyl ethyl ketone (MEK) _____________________________________________________ 23 2.2.10 Tribromomethane __________________________________________________________ 23 2.2.11 Triethanolamine ___________________________________________________________ 23 3. Methods __________________________________________________________________________ 25
3.1 Data Search and selection ________________________________________________________ 25 3.2 Derivation of ERLs _____________________________________________________________ 25
3.2.1 Maximum Permissible Concentration _____________________________________________ 25 3.2.2 Derivation of the SRCeco ______________________________________________________ 26 3.2.3 Derivation of negligible concentrations (NCs) ______________________________________ 26 3.2.4 Equilibrium partitioning _______________________________________________________ 26 4. Toxicity data and derivation of ERLs for water __________________________________________ 29
4.1 Derivation of SRCeco and MPC for water ____________________________________________ 29 4.1.1 1-Butanol___________________________________________________________________ 29 4.1.2 2-Butanol___________________________________________________________________ 30 4.1.3 n-Butyl acetate ______________________________________________________________ 31 4.1.4 Cyclohexylamine _____________________________________________________________ 32 4.1.5 Diethylene glycol_____________________________________________________________ 33 4.1.6 Ethyl acetate ________________________________________________________________ 34 4.1.7 Ethylene glycol ______________________________________________________________ 36 4.1.8 Methanol ___________________________________________________________________ 38 4.1.9 Methyl ethyl ketone ___________________________________________________________ 40 4.1.10 Tribromomethane __________________________________________________________ 41 4.1.11 Triethanolamine ___________________________________________________________ 42 4.1.12 Summary of derived ERLs for the aquatic compartment ____________________________ 43
4.2 Derivation of ERLs for soil and sediment ____________________________________________ 44
5. Conclusions _______________________________________________________________________ 47 Acknowledgements ______________________________________________________________________ 49 References _____________________________________________________________________________ 51 Appendix 1. Information on aquatic toxicity _________________________________________________ 65 Appendix 2. Information on terrestrial toxicity _______________________________________________ 89
Samenvatting
Milieurisicogrenzen vormen het uitgangspunt voor een schatting van het potentiële risico van stoffen voor ecosystemen en worden afgeleid met gebruik van ecotoxicologische en
milieuchemische gegevens. Milieurisicogrenzen dienen als de wetenschappelijke basis voor milieukwaliteitsnormen die worden vastgesteld door de Stuurgroep Stoffen. In dit rapport zijn de milieurisicogrenzen ernstig risiconiveau voor ecosystemen (EReco; Engelse afkorting
SRCeco), maximaal toelaatbaar risiconiveau (MTR) en verwaarloosbaar risiconiveau (VR)
afgeleid voor een heterogene groep van verbindingen. Deze groep van elf stoffen bestaat uit een aantal vrij vluchtige verbindingen, die gebruikt worden als oplosmiddelen (1-butanol, 2-butanol, n-butylacetaat, ethylacetaat, methanol, methylethylketon en tribroommethaan), als antivriesvloeistoffen (ethyleenglycol en diethyleenglycol), als ingrediënt van wasmiddelen (triethanolamine) en als emulgator (cyclohexylamine). Deze stoffen worden ook geëvalueerd met betrekking tot humane risico’s, waarover apart wordt gerapporteerd (deel 2). In dat rapport worden de hier afgeleide risicogrenzen vergeleken met risicogrenzen voor de mens berekend met het blootstellingsmodel Humanex (Traas en Bontje, 2005).
Negen van de elf stoffen die in dit rapport behandeld zijn, zijn eerder geëvalueerd, bij de afleiding van de destijds geheten ecotoxicologisch ernstige
bodemverontreinigings-concentraties, het huidige EReco. Voor deze stoffen zijn de toxiciteitsgegevens gebruikt uit de
rapporten van Crommentuijn et al. (1995) en Posthumus et al. (1998), aangevuld met recente toxiciteitsgegevens. Naast het EReco werden voor deze stoffen nu ook het MTR en VR
afgeleid. De stoffen cyclohexylamine en triethanolamine zijn niet eerder geëvalueerd en worden in dit rapport voor het eerst behandeld.
Voor het afleiden van het MTR en het EReco voor water werd in alle gevallen gebruik
gemaakt van veiligheidsfactoren volgens de leidraad van de EU voor de risicobeoordeling van nieuwe stoffen, bestaande stoffen en biociden (TGD). Voor bodem- en sedimentorganismen zijn vrijwel geen toxiciteitsgegevens gevonden. Derhalve zijn de MTR- en EReco-waarden
voor de compartimenten bodem en sediment voor de elf stoffen afgeleid met behulp van de evenwichtspartitiemethode volgens de TGD. Voor een overzicht van de afgeleide
milieurisicogrenzen, zie tabel 1 tot en met 4.
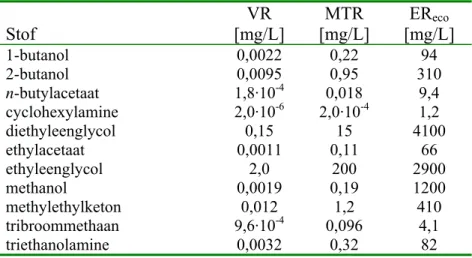
Tabel 1. Overzicht van VR-, MTR- en EReco-waarden voor zoetwater. Normen voor totaal en opgeloste concentraties zijn gelijk.
Stof [mg/L] VR [mg/L] MTR [mg/L] EReco 1-butanol 0,0022 0,22 94 2-butanol 0,0095 0,95 310 n-butylacetaat 1,8·10-4 0,018 9,4 cyclohexylamine 2,0·10-6 2,0·10-4 1,2 diethyleenglycol 0,15 15 4100 ethylacetaat 0,0011 0,11 66 ethyleenglycol 2,0 200 2900 methanol 0,0019 0,19 1200 methylethylketon 0,012 1,2 410 tribroommethaan 9,6·10-4 0,096 4,1 triethanolamine 0,0032 0,32 82
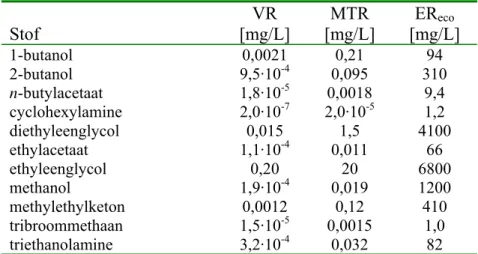
Tabel 2. Overzicht van VR-, MTR- en EReco-waarden voor zeewater. Normen voor het totaal en opgeloste concentraties zijn gelijk.
Stof VR [mg/L] MTR [mg/L] EReco [mg/L] 1-butanol 0,0021 0,21 94 2-butanol 9,5·10-4 0,095 310 n-butylacetaat 1,8·10-5 0,0018 9,4 cyclohexylamine 2,0·10-7 2,0·10-5 1,2 diethyleenglycol 0,015 1,5 4100 ethylacetaat 1,1·10-4 0,011 66 ethyleenglycol 0,20 20 6800 methanol 1,9·10-4 0,019 1200 methylethylketon 0,0012 0,12 410 tribroommethaan 1,5·10-5 0,0015 1,0 triethanolamine 3,2·10-4 0,032 82
Tabel 3. Overzicht van VR-, MTR- en EReco-waarden voor standaardbodem (10 % organisch materiaal en 25 % klei).
Stof VR [mg/kgdw] MTR [mg/kgdw] EReco [mg/kgdw] 1-butanol 0,0015 0,15 63 2-butanol 0,0068 0,68 220 n-butylacetaat 9,6·10-4 0,096 50 cyclohexylamine 8,1·10-6 8,1·10-4 5,0 diethyleenglycol 0,066 6,6 1800 ethylacetaat 0,0020 0,20 130 ethyleenglycol 0,89 89 1300 methanol 9,8·10-4 0,098 630 methylethylketon 0,022 2,2 750 tribroommethaan 0,011 1,1 46 triethanolamine 0,0019 0,19 47
Tabel 4. Overzicht van VR-, MTR- en EReco-waarden voor standaardsediment (10 % organisch materiaal en 25 % klei).
Stof VR [mg/kgdw] MTR [mg/kgdw] EReco [mg/kgdw] 1-butanol 0,0054 0,54 230 2-butanol 0,023 2,3 770 n-butylacetaat 0,0013 0,13 66 cyclohexylamine 1,2·10-5 0,0012 7,2 diethyleenglycol 0,32 32 8900 ethylacetaat 0,0039 0,39 240 ethyleenglycol 4,3 430 6200 methanol 0,0043 0,43 2700 methylethylketon 0,043 4,3 1500 tribroommethaan 0,012 1,2 53 triethanolamine 0,0074 0,74 190
Summary
Environmental risk limits (ERLs) are a starting point for an estimation of the potential risks of substances to ecosystems and are derived from data on environmental chemistry and on ecotoxicological data. ERLs serve as the scientific basis for Environmental Quality Standards set by the Steering Committee for Substances, and are derived using data on (eco)toxicology and environmental chemistry. In this report, the ERLs serious risk concentration for
ecosystems (SRCeco), maximum permissible concentration (MPC), and negligible
concentration (NC) are derived for a heterogeneous group of eleven compounds, used as organic solvents (1-butanol, 2-butanol, n-butyl acetate, ethyl acetate, methanol, methyl ethyl ketone and tribromomethane), as surfactant in detergents (triethanolamine), as antifreeze fluids (ethylene glycol and diethylene glycol), and as emulsifier (cyclohexylamine). The same compounds will also be evaluated for human risk limits in the context of background levels in a separate report (part 2). In that report, the risk limits derived here are compared with risk limits for humans calculated by the exposure model Humanex (Traas and Bontje, 2005). Among the eleven compounds considered in this report, nine have already been evaluated in the context of deriving ecotoxicological Serious Risk Concentrations (SRCeco). For these
compounds existing ecotoxicological data reported in Crommentuijn et al. (1995) and Posthumus et al. (1998) are used together with new data that have become available since then. For these compounds the MPC and NC values were now derived as well as the SRCeco.
Cyclohexylamine and triethanolamine have not been evaluated before and the first data search and ERL derivation for both compounds are reported in the present document.
For the water compartment, MPC and SRCeco values are derived using assessment factors
according to the EU technical guidance for the risk assessment of new and existing substances and biocides (TGD). For the sediment and soil inhabiting organisms, no toxicity data were available. Therefore, SRCeco and MPC values for the soil and sediment compartment were
derived using equilibrium partitioning theory, according to the methodology of the TGD. For an overview of the ERLs derived in this report, see Table 1 to 4.
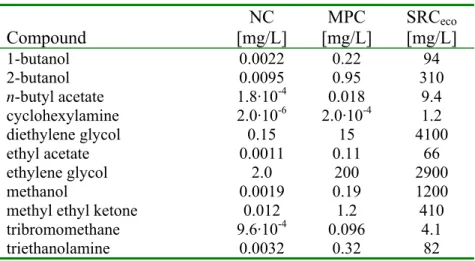
Table 1. Overview of NC, MPC, and SRCeco values for freshwater. Values for total and dissolved concentrations are equal.
Compound NC [mg/L] MPC [mg/L] SRCeco [mg/L] 1-butanol 0.0022 0.22 94 2-butanol 0.0095 0.95 310 n-butyl acetate 1.8·10-4 0.018 9.4 cyclohexylamine 2.0·10-6 2.0·10-4 1.2 diethylene glycol 0.15 15 4100 ethyl acetate 0.0011 0.11 66 ethylene glycol 2.0 200 2900 methanol 0.0019 0.19 1200 methyl ethyl ketone 0.012 1.2 410
tribromomethane 9.6·10-4 0.096 4.1
Table 2. Overview of NC, MPC, and SRCeco values for seawater. Values for total and dissolved fraction are equal.
Compound [mg/L] NC [mg/L] MPC SRC[mg/L] eco 1-butanol 0.0021 0.21 94 2-butanol 9.5·10-4 0.095 310 n-butyl acetate 1.8·10-5 0.0018 9.4 cyclohexylamine 2.0·10-7 2.0·10-5 1.2 diethylene glycol 0.015 1.5 4100 ethyl acetate 1.1·10-4 0.011 66 ethylene glycol 0.20 20 6800 methanol 1.9·10-4 0.019 1200 methyl ethyl ketone 0.0012 0.12 410 tribromomethane 1.5·10-5 0.0015 1.0 triethanolamine 3.2·10-4 0.032 82
Table 3. Overview of NC, MPC and SRCeco values for standard soil (Dutch standard soil, containing 10 % organic matter and 25 % clay).
Compound NC [mg/kgdw] MPC [mg/kgdw] SRCeco [mg/kgdw] 1-butanol 0.0015 0.15 63 2-butanol 0.0068 0.68 220 n-butyl acetate 9.6·10-4 0.096 50 cyclohexylamine 8.1·10-6 8.1·10-4 5.0 diethylene glycol 0.066 6.6 1800 ethyl acetate 0.0020 0.20 130 ethylene glycol 0.89 89 1300 methanol 9.8·10-4 0.098 630 methyl ethyl ketone 0.022 2.2 750
tribromomethane 0.011 1.1 46 triethanolamine 0.0019 0.19 47
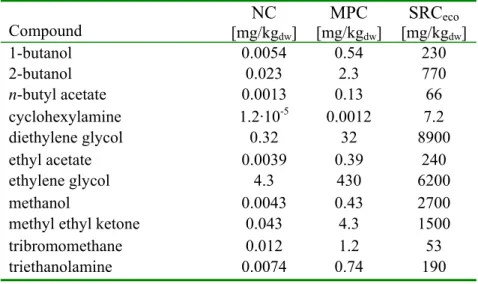
Table 4. Overview of NC, MPC and SRCeco values for standard sediment (Dutch standard sediment, containing 10 % organic matter and 25 % clay).
Compound [mg/kgNC dw] MPC [mg/kgdw] SRCeco [mg/kgdw] 1-butanol 0.0054 0.54 230 2-butanol 0.023 2.3 770 n-butyl acetate 0.0013 0.13 66 cyclohexylamine 1.2·10-5 0.0012 7.2 diethylene glycol 0.32 32 8900 ethyl acetate 0.0039 0.39 240 ethylene glycol 4.3 430 6200 methanol 0.0043 0.43 2700 methyl ethyl ketone 0.043 4.3 1500
tribromomethane 0.012 1.2 53 triethanolamine 0.0074 0.74 190
1.
Introduction
This report is part of the project ‘International and National Environmental Quality Standards for Substances in the Netherlands’. The aim of the project is to derive environmental risk limits (ERLs) for substances in the environment for the compartments air, (ground)water, sediment and soil. Environmental risk limits (ERLs) serve as advisory values to set
environmental quality standards (EQS) by the Steering Committee for Substances for various policy purposes. The term EQS is used to designate all legally and non-legally binding standards that are used in Dutch environmental policy and Table 5 shows the correspondence between ERLs and EQSs. The various ERLs are:
• the Negligible Concentration (NC) for water, soil, groundwater, sediment and air; • the Maximum Permissible Concentration (MPC) for water, soil, groundwater sediment
and air;
• the ecotoxicological Serious Risk Concentration for water, soil, groundwater and sediment (SRCeco).
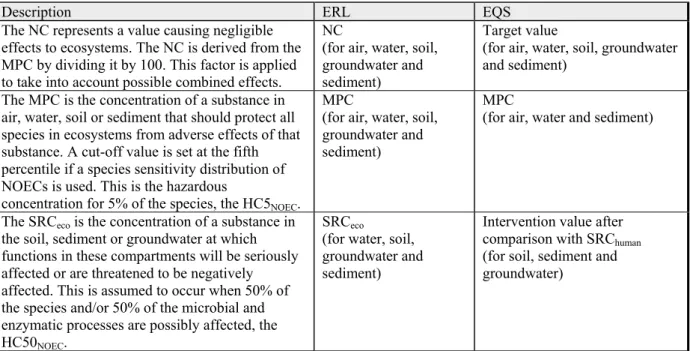
Table 5. Environmental risk limits (ERLs) and the related environmental quality standards (EQS) that are set by the Dutch government in the Netherlands for the protection of ecosystems.
Description ERL EQS
The NC represents a value causing negligible effects to ecosystems. The NC is derived from the MPC by dividing it by 100. This factor is applied to take into account possible combined effects.
NC
(for air, water, soil, groundwater and sediment)
Target value
(for air, water, soil, groundwater and sediment)
The MPC is the concentration of a substance in air, water, soil or sediment that should protect all species in ecosystems from adverse effects of that substance. A cut-off value is set at the fifth percentile if a species sensitivity distribution of NOECs is used. This is the hazardous
concentration for 5% of the species, the HC5NOEC.
MPC
(for air, water, soil, groundwater and sediment)
MPC
(for air, water and sediment)
The SRCeco is the concentration of a substance in
the soil, sediment or groundwater at which functions in these compartments will be seriously affected or are threatened to be negatively affected. This is assumed to occur when 50% of the species and/or 50% of the microbial and enzymatic processes are possibly affected, the HC50NOEC.
SRCeco
(for water, soil, groundwater and sediment)
Intervention value after comparison with SRChuman
(for soil, sediment and groundwater)
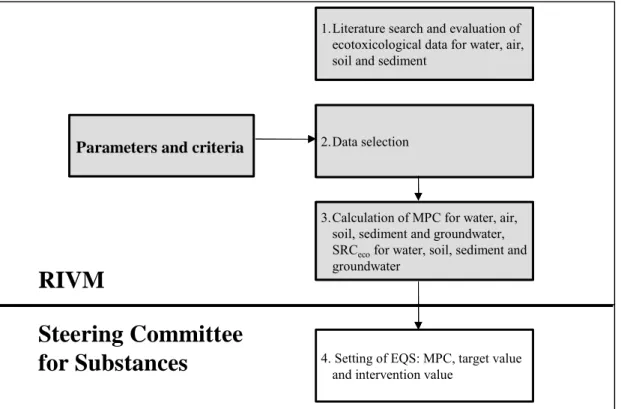
The process of deriving ERLs is shown schematically in Figure 1. ERLs for soil and sediment are calculated for a standardised soil. ERLs for water are reported for dissolved and total concentrations (including a standard amount of suspended matter) and if found significantly different, differentiated to freshwater and saltwater. Each of the ERLs and its corresponding EQS represents a different level of protection, with increasing numerical values in the order Target Value < MPC1 < Intervention Value. The EQS demand different actions when one of them is exceeded, explained elsewhere (VROM, 2001).
In the series of RIVM reports that were published in the framework of the project ‘Setting Integrated Environmental Quality Standards’, (now called ‘International and National
1 A complicating factor is that the term MPC is used both as an ERL and as an EQS. For
Environmental Quality Standards for Substances in the Netherlands’), ERLs were derived for approximately 250 substances and groups of substances. For an overview of the EQSs set by the Ministry of VROM, see VROM (2001). The Expert Centre for Substances of RIVM has recently launched a website at which all EQSs are available. The web site can be found at: http://www.stoffen-risico.nl.
In this report, ERLs are derived for a group of compounds. The results obtained until now in the project ‘International and National Environmental quality standards for Substances in the Netherlands’ are laid down in several reports. In this project the ERLs are derived according to the Technical Guidance Document (TGD), issued by the European Commission and developed in support of the risk assessment of new notified chemical substances, existing substances and biocides (European Commission, 2003). The SRCecos for 8 out of the
11 compounds were already derived (Table 6) and reported by Crommentuijn et al. (1995) and Posthumus et al. (1998). In these reports, no MPC values were derived. In the present report, toxicity data were updated and MPCs, NCs and revised SRCeco values are calculated.
In a second phase of the project, risk limits were calculated that also protect humans and these were compared to ecotoxicological risk limits. This report also contains the scientific advisory values that protect both humans and ecosystems (Traas and Bontje, 2005).
Figure 1. The process of deriving Environmental Risk Limits. Above the line the method to derive ERLs is indicated, i.e. MPC, NC and SRCeco. Below the dashed line the MPC, Target Value and Intervention Value is indicated, set by the Steering Committee for Substances.
1.Literature search and evaluation of ecotoxicological data for water, air, soil and sediment
RIVM
Steering Committee
for Substances
Parameters and criteria
3.Calculation of MPC for water, air, soil, sediment and groundwater, SRCecofor water, soil, sediment and
groundwater 2.Data selection
4. Setting of EQS: MPC, target value and intervention value
Table 6. List of compounds treated in this report and references of previous reports where underlying data can be found.
Compounds References or/and new data Previously derived ERLs butanol (1- and 2-butanol) Crommentuijn et al., 1995
(1-butanol); new data
SRCs
n-butyl acetate Posthumus et al., 1998; Crommentuijn et al., 1995; new data
SRCs
SRCs
cyclohexylamine new data -
diethylene glycol Crommentuijn et al., 1995; new data
SRCs
ethyl acetate Posthumus et al., 1998; new data
SRCs
ethylene glycol Crommentuijn et al., 1995; new data
SRCs
methanol Crommentuijn et al., 1995;
new data SRCs
methyl ethyl ketone (MEK) Crommentuijn et al., 1995; new data
SRCs
tribromomethane (bromoform) Posthumus et al., 1998; new data
SRCs
2.
Substance properties and use
2.1
Physicochemical properties
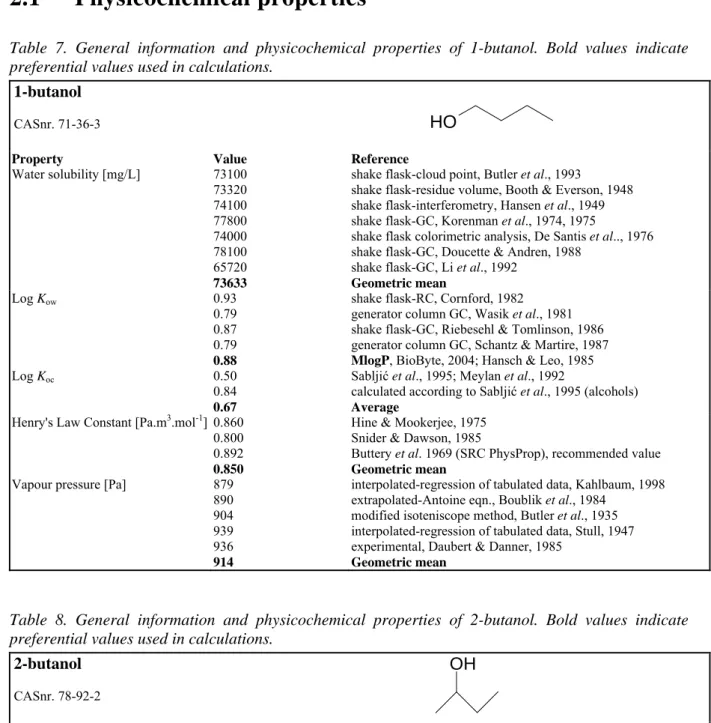
Table 7. General information and physicochemical properties of 1-butanol. Bold values indicate preferential values used in calculations.
1-butanol
CASnr. 71-36-3 HO
Property Value Reference
Water solubility [mg/L] 73100 73320 74100 77800 74000 78100 65720 73633
shake flask-cloud point, Butler et al., 1993
shake flask-residue volume, Booth & Everson, 1948 shake flask-interferometry, Hansen et al., 1949 shake flask-GC, Korenman et al., 1974, 1975
shake flask colorimetric analysis, De Santis et al.., 1976 shake flask-GC, Doucette & Andren, 1988
shake flask-GC, Li et al., 1992 Geometric mean Log Kow 0.93 0.79 0.87 0.79 0.88
shake flask-RC, Cornford, 1982 generator column GC, Wasik et al., 1981 shake flask-GC, Riebesehl & Tomlinson, 1986 generator column GC, Schantz & Martire, 1987 MlogP, BioByte, 2004; Hansch & Leo, 1985
Log Koc 0.50
0.84 0.67
Sabljić et al., 1995; Meylan et al., 1992
calculated according to Sabljić et al., 1995 (alcohols) Average
Henry's Law Constant [Pa.m3.mol-1] 0.860 0.800 0.892 0.850
Hine & Mookerjee, 1975 Snider & Dawson, 1985
Buttery et al. 1969 (SRC PhysProp), recommended value Geometric mean
Vapour pressure [Pa] 879 890 904 939 936 914
interpolated-regression of tabulated data, Kahlbaum, 1998 extrapolated-Antoine eqn., Boublik et al., 1984
modified isoteniscope method, Butler et al., 1935 interpolated-regression of tabulated data, Stull, 1947 experimental, Daubert & Danner, 1985
Geometric mean
Table 8. General information and physicochemical properties of 2-butanol. Bold values indicate preferential values used in calculations.
2-butanol
CASnr. 78-92-2
OH
Property Value Reference
Water solubility [mg/L] 181000 experimental, Hefter, 1984 (from SRC PhysProp Database) Log Kow 0.61 MlogP, BioByte, 2004; Hansch & Anderson, 1967 Log Koc 0.74 calculated according to Sabljić et al., 1995 (alcohols) Henry's Law Constant [Pa.m3.mol-1] 1.040
0.800 0.912
partial pressure-isoteniscope, Butler, 1935 headspace-GC, Snider & Dawson, 1985 Geometric mean
Vapour pressure [Pa] 2286 2266 2440 2329
modified isoteniscope method, Butler et al., 1935 interpolated-regression of tabulated data, Stull, 1947 measured, Banerjee et al., 1990
Table 9. General information and physicochemical properties of n-butyl acetate. Bold values indicate preferential values used in calculations.
n-butyl acetate
CASnr. 123-86-4
O O
Property Value Reference
Water solubility [mg/L] 23580 6702 8400 6290 9559
shake flask-AS, Hansch et al., 1968 gen. col.-GC, Wasik et al., 1981, 1982
experimental, Yalkowsky & Dannenfelser, 1992 (from SRC PhysProp Database)
experimental, Syracuse Research Crop, 1979 (SRC Chemfate) Geometric mean
Log Kow 1.82
1.78
gen. col.-GC, Wasik et al., 1981, 1982; Tewari et al., 1982; Howard, 1990 MlogP, BioByte, 2004
Log Koc 1.92 calculated according to Sabljić et al., 1995 (esters)
Henry's Law Constant [Pa.m3.mol-1] 28.51 Vapour-liquid equilibrium, vapour phase-GC, Kiekbusch & King, 1979 Vapour pressure [Pa] 1530
1529 2000 1673
extrapolated-Antoine eqn., Boublik et al., 1984 extrapolated-Antoine eqn., Dean, 1985 measured, Banerjee et al., 1990 Geometric mean
Table 10. General information and physicochemical properties of cyclohexylamine. Bold values indicate preferential values used in calculations.
cyclohexylamine
CASnr. 108-91-8
N H2
Property Value Reference
Water solubility [mg/L] 1000 000 (20 ºC) experimental, Merck Index, 1996 (from SRC PhysProp Database)
pKa 10.66
10.68
Mackay et al., 2000 BioByte, 2004
Log Kow 1.49 MlogP, BioByte, 2004; Hansch et al., 1995
Log Koc 1.79 calculated according to Sabljić et al., 1995 (nonhydrophobics) Henry's Law Constant [Pa.m3.mol-1] 0.421 experimental, Altschuh et al., 1999 (from SRC PhysProp Database) Vapour pressure [Pa] 1346 experimental, Daubert & Danner, 1989 (from SRC PhysProp Database)
Table 11. General information and physicochemical properties of diethylene glycol. Bold values indicate preferential values used in calculations.
diethylene glycol CASnr. 111-46-6 O H O OH
Property Value Reference
Water solubility [mg/L] 1000 000 experimental, Riddick et al., 1986 (from SRC PhysProp Database) Log Kow -1.30 ClogP, calculated, BioByte, 2004
Log Koc -0.01 calculated according to Sabljić et al., 1995 (alcohols)
Henry's Law Constant [Pa.m3.mol-1] 0.000203 estimated, Meylan & Howard, 1991 (from SRC PhysProp Database) Vapour pressure [Pa] 0.76
1.04 0.89
experimental, Daubert & Danner, 1991 (from SRC PhysProp Database) experimental, Daubert & Danner, 1989 (SRC Chemfate)
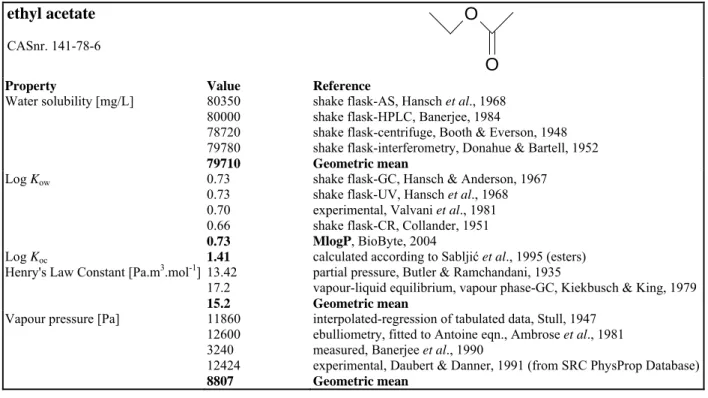
Table 12. General information and physicochemical properties of ethyl acetate. Bold values indicate preferential values used in calculations.
ethyl acetate
CASnr. 141-78-6
O O
Property Value Reference
Water solubility [mg/L] 80350 80000 78720 79780 79710
shake flask-AS, Hansch et al., 1968 shake flask-HPLC, Banerjee, 1984
shake flask-centrifuge, Booth & Everson, 1948 shake flask-interferometry, Donahue & Bartell, 1952 Geometric mean Log Kow 0.73 0.73 0.70 0.66 0.73
shake flask-GC, Hansch & Anderson, 1967 shake flask-UV, Hansch et al., 1968 experimental, Valvani et al., 1981 shake flask-CR, Collander, 1951 MlogP, BioByte, 2004
Log Koc 1.41 calculated according to Sabljić et al., 1995 (esters) Henry's Law Constant [Pa.m3.mol-1] 13.42
17.2 15.2
partial pressure, Butler & Ramchandani, 1935
vapour-liquid equilibrium, vapour phase-GC, Kiekbusch & King, 1979 Geometric mean
Vapour pressure [Pa] 11860 12600 3240 12424 8807
interpolated-regression of tabulated data, Stull, 1947 ebulliometry, fitted to Antoine eqn., Ambrose et al., 1981 measured, Banerjee et al., 1990
experimental, Daubert & Danner, 1991 (from SRC PhysProp Database) Geometric mean
Table 13. General information and physicochemical properties of ethylene glycol. Bold values indicate preferential values used in calculations.
ethylene glycol (1,2-ethanediol)
CASnr. 107-21-1 HO OH
Property Value Reference
Water solubility [mg/L] miscible/infinite Dean, 1985, Riddick et al., 1986, Yaws et al., 1990 Log Kow -0.54
-1.36
shake flask-CR, Collander, 1951
MlogP, BioByte, 2004, Hansch & Leo, 1985 Log Koc -0.03 calculated according to Sabljić et al., 1995 (alcohols)
Henry's Law Constant [Pa.m3.mol-1] 0.00608 experimental, Butler & Ramchandani, 1935 (from SRC PhysProp Database)
Vapour pressure [Pa] 11.70 9.299 11.86 12.26 11.22
ebulliometry, extrapolated-Antoine eqn., Ambrose & Hall, 1981 extrapolated-Antoine eqn., Boublik et al., 1984
extrapolated-Antoine eqn., Dean, 1985
experimental, Daubert & Danner, 1985 (from SRC PhysProp Database) Geometric mean
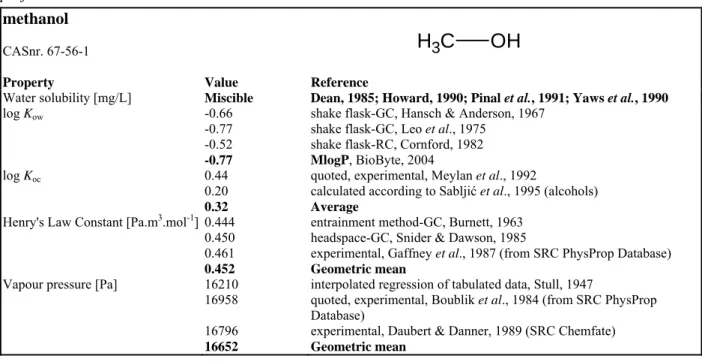
Table 14. General information and physicochemical properties of methanol. Bold values indicate preferential values used in calculations.
methanol
CASnr. 67-56-1
H
3C
OH
Property Value Reference
Water solubility [mg/L] Miscible Dean, 1985; Howard, 1990; Pinal et al., 1991; Yaws et al., 1990 log Kow -0.66
-0.77 -0.52 -0.77
shake flask-GC, Hansch & Anderson, 1967 shake flask-GC, Leo et al., 1975
shake flask-RC, Cornford, 1982 MlogP, BioByte, 2004 log Koc 0.44
0.20 0.32
quoted, experimental, Meylan et al., 1992
calculated according to Sabljić et al., 1995 (alcohols) Average
Henry's Law Constant [Pa.m3.mol-1] 0.444 0.450 0.461 0.452
entrainment method-GC, Burnett, 1963 headspace-GC, Snider & Dawson, 1985
experimental, Gaffney et al., 1987 (from SRC PhysProp Database) Geometric mean
Vapour pressure [Pa] 16210 16958 16796 16652
interpolated regression of tabulated data, Stull, 1947
quoted, experimental, Boublik et al., 1984 (from SRC PhysProp Database)
experimental, Daubert & Danner, 1989 (SRC Chemfate) Geometric mean
Table 15. General information and physicochemical properties of methyl ethyl ketone. Bold values indicate preferential values used in calculations.
methyl ethyl ketone (MEK; 2-butanone)
CASnr. 78-93-3
O
Property Value Reference
Water solubility [mg/L] 136280 223000 343550 218562
gen. col.-GC, Wasik et al., 1981
experimental, Taft et al., 1985 (from SRC PhysProp Database) shake flask-volumetric, Ginnings et al., 1940
Geometric mean log Kow 0.26 0.28 0.29 0.35 0.69 0.26 0.29
shake flask-CR, Collander, 1957 shake flask-AS, Fujita et al., 1986
shake flask-AS, GC, Hansch & Anderson, 1967; Hansch et al., 1968 experimental, Valvani et al., 1981
gen. col.-GC, Wasik et al., 1981 shake flask-GC, Tanii et al., 1986 MlogP, BioByte, 2004; Hansch et al., 1995
log Koc 1.47
1.53 1.17 1.39
Captina silt loam, Walton et al., 1982 McLaurin sandy loam, Walton et al., 1992
calculated according to Sabljić et al., 1995 (nonhydrophobics) Average
Henry's Law Constant [Pa.m3.mol-1] 4.710 4.356 5.760 5.210 5.13
shake flask, partial vapour pressure-GC, Buttery et al., 1971 gas-stripping, Hawthorne, 1984
headspace-GC, Snider & Dawson, 1985 gas stripping-HPLC/UV, Zhou & Mopper, 1990 Geometric mean
Vapour pressure [Pa] 12954 12080 12230 12023 12316
interpolated regression of tabulated data, Stull, 1947 ebulliometry, Ambrose et al., 1975
extrapolated-Antoine eqn., Boublik et al., 1984 extrapolated-Antoine eqn., Dean, 1985 Geometric mean
Table 16. General information and physicochemical properties of tribromomethane. Bold values indicate preferential values used in calculations.
tribromomethane (bromoform)
CASnr. 75-25-2 C
Br
Br Br
Property Value Reference
Water solubility [mg/L] 3100 3130 3115
experimental, Horvath, 1982
extrapolated between two data points, Warner et al., 1987 Geometric mean
log Kow 2.67 MlogP, BioByte, 2004
log Koc (L/kg) 2.06 2.45 2.26 2.26
quoted experimental, Sabljić et al., 1995 Abdul et al., 1987 (SRC Chemfate)
calculated according to Sabljić et al., 1995 (predominantly hydrophobics)
Average Henry's Law Constant [Pa.m3.mol-1] 54.2
62.0 58.0
multiple equilibration, Munz & Robert, 1987, 1989 recommended, Mackay & Shiu, 1981, 1990 Geometric mean
Vapour pressure [Pa] 720 734 727
Extrapolated data, Boublik et al., 1984 (from SRC PhysProp Database) Experimental, extrapolated, Daubert & Danner, 1989 (SRC Chemfate) Geometric mean
Table 17. General information and physicochemical properties of triethanolamine. Bold values indicate preferential values used in calculations.
triethanolamine Casnr. 102-71-6 O H N OH OH
Property Value Reference
Water solubility [mg/L] miscible Dean 1985, Riddick et al., 1986
pKa 7.76 Mackay et al. 2000
7.92 Mackay et al. 2000
log Kow -1.00 MlogP, BioByte, 2004; Hansch et al., 1995
log Koc 0.50 calculated according to Sabljic & Güsten, 1995 (nonhydrophobics) Henry's Law Constant [Pa.m3.mol-1] 3.42*10-14 Hine & Mookerjee, 1975
Vapour pressure [Pa] 0.0131 0.0100 0.000479 0.00856
extrapolated-Antoine eqn., Boublik et al., 1984 extrapolated-Antoine eqn., Dean, 1985
experimental, Daubert & Danner, 1989 (from SRC PhysProp Database) Geometric mean
2.2
Properties and use
The group of compounds considered in this report deals with a heterogeneous set of
11 substances used for different goals in industries or/and in agriculture. Properties and use for each of the compounds are briefly summarised below.
2.2.1 1-Butanol
1-Butanol is a flammable colourless liquid with a rancid sweet odour. It is mainly used as a solvent for fats, waxes, resins, gums and varnishes; in the manufacture of butyl acetate, butyl acrylate, detergents, rayon and lacquers, and as diluent for brake fluids. It is used as an extractant in pharmaceutical synthesis of antibiotics, vitamins and hormones. Biodegradation in freshwater of 1-butanol is quite rapid (ranges from few hours to few days) (EHC 65, 1987).
2.2.2 2-Butanol
2-Butanol is a flammable colourless liquid with a characteristic sweet odour. 2-Butanol occurs naturally as a product of fermentation of carbohydrates. It is mainly used for the extraction of fish meal to produce fish protein concentrate, for the production of fruit essences and as a flavouring agent in food. The compound is readily biodegradable by bacteria and does not bioaccumulate (EHC 65, 1987).
2.2.3 n-Butyl acetate
This compound is mainly used as solvent in lacquers, artificial leathers, photographic films, plastics and safety glass (DOSE, 2000).
2.2.4 Cyclohexylamine
This compound is mainly used in organic synthesis, manufacture of plasticisers, corrosion inhibitors, rubber chemicals, dyestuffs, emulsifying agents, dry cleaning soaps, acid gas absorbants and insecticides (DOSE, 2000).
2.2.5 Diethylene glycol
This compound is a colourless liquid. It is mainly used in antifreeze solutions, as lubricant and finishing agent for wool and other fabrics, as solvent for dyestuffs and is used in composition of corks, glues, pharmaceuticals and toiletries (DOSE, 2000).
2.2.6 Ethyl acetate
Ethyl acetate is a colourless liquid with a characteristic sweet odour. It is mainly used in artificial fruit essences, as a solvent for nitrocellulose, varnishes, lacquers and in cleaning textiles and in the manufacture of photographic film, artificial silk and perfumes (DOSE, 2000).
2.2.7 Ethylene glycol
Ethylene glycol is a colourless liquid with a characteristic ether-like (sweet) odour. It is mainly used as an intermediate in the manufacture of polyethylene terephthalate (polyester); to a lesser extent as antifreeze in coolants, as an intermediate in the production of glyoxal and polyglycols, as humectant and plasticizer. The compound is readily biodegradable in aerobic
and anaerobic conditions, in aquatic environment as well as in soil with sufficient moisture content. Bioaccumulation is not to be expected (GDCh, 1991).
2.2.8 Methanol
Methanol is a clear, colourless, volatile liquid with a characteristic alcoholic odour when pure. It occurs naturally in blood, urine, saliva and expired air in humans and animals. Methanol is available in the diet, principally from fresh fruit and vegetables, fruit juices, fermented beverages and diet foods. It is used in the industrial production of important compounds such as methyl tert-butyl ether (MTBE), formaldehyde, acetic acid, glycol methyl ethers,
methylamine, methylhalides and methylmethacrylate. It is a constituent of a large number of commercially available solvents and consumer products including paints, varnishes, antifreeze solutions etc. The compound is readily degraded in the environment by photo oxidation and biodegradation processes. It is readily biodegradable under aerobic and anaerobic conditions, in a wide variety of environmental media including fresh and salt water, sediments, soils and ground water (EHC 196, 1997).
2.2.9 Methyl ethyl ketone (MEK)
Methyl ethyl ketone (MEK) is a clear, colourless, volatile, highly flammable liquid with an acetone-like odor. MEK is produced biologically and has been identified as a product of microbial metabolism. It has also been detected in higher plants, insect pheromones, animal tissues and human blood, urine and exhaled air. MEK is mainly used as a solvent in protective coatings, adhesives, paint stripper, cleaning fluid and in the manufacture of cements and as intermediate in inorganic synthesis. It is nearly completely degradable in water on the basis of biological oxygen demand (BOD) and it is not expected to accumulate in food webs (EHC 143, 1994).
2.2.10 Tribromomethane
Tribromomethane is a colourless liquid with a characteristic chloroform-like odour. The compound is mainly used as a solvent for waxes, greases and oils. It is also used as an intermediate for organic synthesis (DOSE, 2000).
2.2.11 Triethanolamine
Triethanolamine is a colourless to pale yellow viscous liquid with a slight ammoniacal odour. It is mainly used in the manufacture of detergents, cosmetics/pharmaceuticals, textile
auxiliaries areas, herbicides and cement additives. The compound is considered to be
inherently biodegradable at aerobic conditions in the aquatic environment. No information is available on biodegradation in soils or under anaerobic conditions (GDCh, 1994).
3.
Methods
3.1
Data Search and selection
An on-line literature search was performed for the period 1985-2002. The TOXLINE and BIOSYS databases were used.
A toxicity study is considered reliable if the design of the experiment is in agreement with international accepted guidelines, e.g. OECD guidelines. Criteria are available to judge
studies that have not been performed according to the OECD-guidelines, documented in Traas (2001) and the Technical Guidance Document of the EU (European Commission, 2003). Effects on growth, reproduction or survival are used in the derivation of ERLs, as they are related to population dynamics. Toxicity data on organic substances from soil or sediment studies are normalised to 10% organic matter.
For each species and each compound, the most sensitive toxicity test is selected. If for a single species several toxicity values are found for the same effect parameter, the geometric mean is calculated.
3.2
Derivation of ERLs
3.2.1 Maximum Permissible Concentration
The maximum permissible concentrations (MPC) are derived according to the derivation of the PNEC values in the EU Technical Guidance Document (TGD) on risk assessment (European Commission, 2003, developed for EU council regulation 793/93).
In short, a data search on chronic and acute toxicity for aquatic and terrestrial species and terrestrial processes of a compound is performed. They are evaluated and selected or rejected. For the derivation of ERLs, salt and freshwater data are combined if there are no (statistical) reasons to keep the data separated. For compounds with a log Kow higher than 3.0, or for
compounds for which secondary poisoning is expected, toxicity data for mammals and birds are searched for as well to assess the risk of secondary poisoning. All of the compounds studied in this report have log Kow values below 3 and therefore, an evaluation of secondary
poisoning can be omitted.
To derive PNECs for the aquatic environment with the refined assessment method (e.g. described by Aldenberg and Jaworska, 2000), the TGD requires chronic toxicity data for at least 10 species from 8 different taxonomical groups (family, class). In the present report, this method could not be applied, because there were insufficient data for all compounds.
Consequently, the maximum permissible concentration (MPC) is derived using assessment factors as laid down in the TGD.
In many cases, the only chronic toxicity data available are for unicellular organisms. According to the TGD, the results of tests with bacteria should be considered as short-term tests. Therefore, chronic tests with bacteria are not used for the derivation of the PNEC. Also chronic tests with protozoans are not used for the derivation of the PNEC, although
protozoans are not explicitly mentioned in the TGD in the section on the derivation of the PNEC for aquatic organisms, but only together with bacteria in the derivation of the PNEC for sewage treatment plants (STPs).
Algae and blue-green algae (cyanophyta) are considered as primary producers according to the TGD. Chronic NOECs for these taxa should only be used in the derivation of the PNEC in combination with at least one additional NOEC for daphnids or fish. Meanwhile, the PNEC derived for any standard or non-standard organism from the acute toxicity data may not be
higher than the PNEC derived from the available NOEC. Therefore, if a NOEC is available for algae or cyanophyta that is smaller than the lowest EC50 divided by 10, the MPC is based on this value.
3.2.2 Derivation of the SRCeco
The Serious Risk Concentration for ecosystems (SRCeco) is derived according to the method
described by Verbruggen et al. (2001) with some small modifications to bring the derivation of the SRCeco more in line with the derivation of the MPC based on the PNEC according to
the TGD. The basis for the SRCeco is in principle the geometric mean of the chronic toxicity
data, the hazardous concentration to 50% of the species (HC50). In the method of Verbruggen et al. (2001), the SRCeco is equal to the geometric mean of the chronic toxicity data, if the
chronic data cover at least four different taxonomical groups. In all other cases, the geometric mean of the acute data set is divided by ten and compared to the geometric mean of the chronic data. The lower of the two becomes the SRCeco. However, often only unicellular
organisms and mostly primary producers or consumers are represented in the chronic data, although these species belong to four taxonomical groups (algae, bacteria, cyanophyta, and protozoa). Fish or daphnids are mostly relatively sensitive species and if these species are absent in the chronic toxicity data but represented in the acute data, this may result in a geometric mean of the acute toxicity data, which is lower than of the chronic toxicity data. For this reason, a comparison between the geometric mean of the acute data set divided by ten and the geometric mean of the chronic data is always performed, unless chronic toxicity data are available for algae, Daphnia, and fish.
For calculating the geometric mean of the toxicity data, all species are considered, including bacteria and protozoa. When assessment factors are used to derive the PNEC, bacteria and protozoa should not be used as most sensitive species to base the PNEC upon. However, for the derivation of the geometric mean of all species, these taxa are included as well. This is in line with the application of the statistical extrapolation method according to the TGD to determine the hazardous concentration to 5% of the species (HC5) as basis for the PNEC.
3.2.3 Derivation of negligible concentrations (NCs)
The negligible concentration (NC) represents a concentration causing negligible effects to ecosystems. The NC is derived from the MPC by dividing it by 100. This factor is applied to take into account possible combined effects such as mixture toxicity, because species are always exposed in the environment to mixtures of chemicals and complex mixtures of chemicals are generally best described as concentration-additive (Van Leeuwen et al., 1996; Deneer, 2000).
3.2.4 Equilibrium partitioning
If no data are available for benthic or terrestrial organisms, the MPCs for sediment and soil are calculated by equilibrium according to the TGD. In the equilibrium partitioning concept, it is assumed that equilibrium exists between the concentration of a substance sorbed to organic carbon and (pore) water. In addition, it is assumed that toxicity is related to pore water
concentrations (DiToro et al., 1991).
The ERLs are calculated according to the TGD are for bulk (wet weight) sediment and soil. In the framework of INS, sediment and soil concentrations are normalised to dry weight, with the organic matter content of 10% for Dutch standard soil and sediment. This recalculation is performed according to the equations as documented in the guidance document for deriving Dutch Environmental Risk Limits from EU-Risk Assessment Reports (Janssen et al., 2004).
According to the TGD, PNECs for sediment are calculated with the characteristics of suspended matter. In this report, not only the fraction water and solids but also the organic carbon content of suspended matter is used in the recalculation of concentrations based on wet weight suspended matter to Dutch standard sediment. This results in concentrations for
standard sediment, which are twice as low as calculated according to Janssen et al. (2004), according to which the density and composition of suspended matter must be used for the recalculation to dry weight, but at the same time the organic carbon content of sediment for the normalisation to Dutch standard sediment.
Due to the amount of a substance that is present in the (pore)water phase of sediment and soil, significant differences between the MPC for sediment and soil may occur for the
non-hydrophobic compounds described in this report. This reflects the fact that although expressed as concentrations normalised to dry weight of sediment, the total amount of the substance in sediment or soil is determined by means of common extraction techniques.
For organic substances, the partition coefficient between the bulk soil/sediment (wet weight) and water is based on the organic carbon-water partition coefficient (Koc), the water content of
the soil and the substance contained in the air fraction. When experimental sorption coefficients (Koc) are not available, these are estimated using the regression equations
described by Sabljić et al. (1995). Experimental log Kow values obtained from the
MEDCHEM database (Biobyte, 2004) were used as input for the regressions. When
experimental values were available, an average value between these values and the estimated value was used.
Equilibrium partitioning is also applied when the total concentration in the water phase is calculated, by calculating the contribution of the concentration of the substance in suspended solids. For the compounds considered in this report this contribution is so small, that the total concentrations in water are equal to the dissolved concentrations, for a suspended particulate matter concentration of 30 mg/L (standard value for the Netherlands).
4.
Toxicity data and derivation of ERLs for water
4.1
Derivation of SRC
ecoand MPC for water
The aquatic toxicity data that are found for 1-butanol, 2-butanol, n-butyl acetate,
cyclohexylamine, diethylene glycol, ethyl acetate, ethylene glycol, methanol, methyl ethyl ketone, tribromomethane and triethanolamine are presented in Appendix 1, including rejected data. The selected toxicity data are given in separated tables shown below. For an overview of the derived ERLs see Table 29.
4.1.1 1-Butanol
Environmental risk limits are derived separately for 1-butanol and 2-butanol. Aquatic toxicity data for 1-butanol are given in Table A1.1. Rejected data for 1-butanol are reported in
Table A1.2. The selected toxicity data for the derivation of the environmental risk limits of 1-butanol are presented in Table 18. The geometric mean of the acute freshwater toxicity data is 1233 mg/L, The geometric mean of the acute saltwater toxicity data is 2577 mg/L, and is thus twice as high. Data for freshwater and saltwater are not significantly different if a t-test with equal variance is performed on the log-transformed acute toxicity data (P=0.072). However, the variance of the toxicity data is much higher in the case of freshwater species than for saltwater species (P=0.026). The t-test with Welch-correction for unequal variance shows that are significant differences between freshwater and saltwater data (P=0.016). This is supported by the fact that for the taxa crustaceans and fish there is no overlap in toxicity data between freshwater and saltwater species, although the marine data set is too small to show significant difference. Therefore, the data sets are separated.
For freshwater, the selected acute toxicity data include crustaceans, fish, amphibians, and protozoans. A toxicity study with algae is also available in which the EC50 was higher than 1000 mg/L, and consequently the base-set can be considered complete. In a chronic study with algae, the NOEC for growth was 875 mg/L. Other chronic toxicity studies include bacteria, blue-green algae (cyanophyta), and protozoans. Due to the lack of chronic toxicity data for other trophic levels, the MPC has to be based on the acute toxicity data. Although especially protozoans seem to be a sensitive species for 1-butanol, the TGD does not allow to use chronic toxicity for bacteria and protozoans to base the PNEC upon.
The MPC for freshwater is derived by dividing the lowest EC50 for freshwater species by an assessment factor of 1000. The resulting MPC for freshwater is 0.22 mg/L. For saltwater species, the MPC is based on the lowest EC50 for a saltwater species divided by an assessment factor of 10000. The resulting MPC for saltwater is 0.21 mg/L.
The SRCeco is derived by comparing the geometric mean of the acute toxicity data divided by
an assessment factor of 10 with the geometric mean of the chronic toxicity data. Chronic toxicity data are only available for freshwater species. The geometric mean of chronic toxicity data is 94 mg/L. This is more than ten times lower than the geometric mean of the acute toxicity data for both freshwater and saltwater species. Therefore, the SRCeco for both
freshwater and saltwater is 94 mg/L. This value is comparable to 76 mg/L, the value found by Crommentuijn et al. (1995) on the basis of the combined data for the two congeners.
Table 18. Selected toxicity data for 1-butanol; freshwater and marine species.
Species Taxon Value [mg/L]
Freshwater acute L(E)C50
Daphnia magna Crustacea 1905a
Carassius auratus Pisces 1900
Lepomis macrochirus Pisces 224 b
Leuciscus idus melanotus Pisces 1428 c
Pimephales promelas Pisces 1858 d
Semotilus atromaculatus Pisces 1183 e
Xenopus laevis Amphibia 1200
Spirostomum ambiguum Protozoa 875 f
Tetrahymena pyriformis Protozoa 2466
Marine acute L(E)C50
Artemia salina Crustacea 2950
Nitroca spinipes Crustacea 2100
Alburnus alburnus Pisces 2300
Vibrio fischeri Bacteria 3097g
Freshwater chronic NOEC
Scenedesmus quadricauda Algae 875
Pseudomonas putida Bacteria 650
Microcystis aeruginosa Cyanophyta 100
Chilomonas paramecium Protozoa 28
Entosiphon sulcatum Protozoa 55
Uronema parduczi Protozoa 8.0
Notes
a geometric mean of 1855, 1880 and 1983 mg/L. Value of 16232 mg/L was not selected, because of the strong
deviation from all other values. This value is suspected to be a typing error.
b geometric mean of the range between no and complete mortality (100-500 mg/L). c geometric mean of 1200 and 1770 mg/L.
d geometric mean of 1730, 1910 and 1940 mg/L.
e geometric mean of the range between no and complete mortality (1000-1400 mg/L). f most sensitive parameter (malformations).
g geometric mean of 3388, 2800, 3300 and 2938 mg/L. Value of 44000 mg/L was not selected, because of the
strong deviation from all other values. This value is suspected to be a typing error.
4.1.2 2-Butanol
Aquatic toxicity data for 2-butanol are given in Table A1.3. For 2-butanol, less data are available for less species than for 1-butanol, and only for freshwater species. The selected toxicity data are presented in Table 19. Acute toxicity data are available for algae,
crustaceans, fish, and amphibians. Chronic toxicity data are available for algae, bacteria, cyanophyta, and protozoans.
Because the chronic toxicity data comprise only unicellular taxa (algae, bacteria, cyanophyta, and protozoans), but no taxa from higher trophic levels such as crustaceans and fish, the MPCs is in first instance conservatively based on the acute toxicity data.
The lowest EC50 is 1530 mg/L for the amphibian Xenopus leavis. However, it appears that the lowest NOEC for algae of 95 mg/L is more than a factor of 10 lower than this value. According to the TGD the PNEC derived from the acute toxicity data should not be higher than the PNEC derived from the chronic toxicity data. Therefore, the MPC is still based on the lowest NOEC divided by an assessment factor of 100. The resulting MPC for freshwater
is 0.95 mg/L. For saltwater an assessment factor of 1000 is applied and the resulting MPC is 0.095 mg/L.
For 2-butanol, the geometric means of acute and chronic toxicity data are 3141 and 521 mg/L, respectively. The SRCeco is derived from the acute toxicity data with an assessment factor of
10. The resulting SRCeco is 310 mg/L.
Table 19. Selected toxicity data for 2-butanol; freshwater species.
Species Taxon Value [mg/L]
Freshwater acute L(E)C50
Chlorococcales Algae 3400
Daphnia magna Crustacea 3316 a
Carassius auratus Pisces 4300
Leuciscus idus melanotus Pisces 3530 b
Pimephales promelas Pisces 3670
Xenopus laevis Amphibia 1530
Freshwater chronic NOEC
Scenedesmus quadricauda Algae 95
Pseudomonas putida Bacteria 500
Microcystis aeruginosa Cyanophyta 312
Chilomonas paramecium Protozoa 745
Entosiphon sulcatum Protozoa 1282
Uronema parduczi Protozoa 1416
Notes
a geometric mean of 3750, 2300 and 4227 mg/L. b geometric mean of 3520 and 3540 mg/L.
4.1.3 n-Butyl acetate
Selected aquatic toxicity data for n-butyl acetate are given in Table 20. The full data set is shown in Table A1.4. Acute toxicity data are available for algae, crustaceans and fish in the case of freshwater species and for bacteria, crustaceans and fish for marine species. Chronic toxicity values are available for freshwater algae, bacteria, cyanophyta, and protozoans. As the marine toxicity data are not significantly different from the freshwater data, ERLs are based on the combined set.
Because chronic toxicity data are available for algae and additionally for three unicellular taxa, but not for crustaceans and fish, the MPCs have to be based on acute toxicity data. The lowest EC50 is 18 mg/L for the fathead minnow (Pimephales promelas). With an assessment factor of 1000 the MPC for freshwater is 0.018 mg/L. For saltwater, the assessment factor is 10000 and the resulting MPC is 0.0018 mg/L.
The geometric mean of the combined set of acute toxicity data is 94 mg/L. The geometric mean of the chronic toxicity data is higher than this value. The SRCeco is therefore derived
from the acute toxicity data with an assessment factor of 10. The resulting SRCeco is 9.4 mg/L.
The HC50 found by Posthumus et al. (1998) which was calculated on the basis of QSAR estimates was 89 mg/L. The HC50 found by Crommentuijn et al. (1995), based on experimental data, was 43 mg/L.
Table 20. Selected toxicity data for n-butyl acetate; freshwater and marine species.
Species Taxon Value [mg/L]
Freshwater acute L(E)C50
Chlorococcales Algae 1200
Daphnia magna Crustacea 100 a
Lepomis macrochirus Pisces 100
Leuciscus idus melanotus Pisces 100 b
Pimephales promelas Pisces 18
Marine acute L(E)C50
Artemia salina Crustacea 32
Menidia beryllina 185
Vibrio fischeri 70
Freshwater chronic NOEC
Chlorococcales Algae 600
Scenedesmus quadricauda Algae 21
Pseudomonas putida Bacteria 115
Microcystis aeruginosa Cyanophyta 280
Chilomonas paramaecium Protozoa 670
Entosiphon sulcatum Protozoa 321
Uronema parduczi Protozoa 574
Notes
a geometric mean of 24, 205 and 205 mg/L. b geometric mean of 141 and 71 mg/L.
4.1.4 Cyclohexylamine
Selected aquatic toxicity data on cyclohexylamine are given in Table 21. The full data set is available in Table A1.5. Cyclohexylamine is a basic compound with a pKa value of 10.68. This means that under neutral pH the compound is protonated. When this compound is added to a test system it may significantly increase the pH. For all of the toxicity studies reported in Table A1.5 it was studied, whether such a pH effect could be excluded. Only in these cases toxicity data were considered valid. Data with a possible pH effect were not selected, because a pH value of above 10 is not relevant for the field situation. These data are tabulated as rejected data (Table A1.6). Differences in toxicity due to a pH effect of cyclohexylamine are most evident for Pseudomonas putida.
Acute toxicity data are available for algae, crustaceans, fish and protozoans. Chronic toxicity values are available for algae, bacteria, cyanophyta, and protozoans. No data for marine species are available. The most sensitive species for cyclohexylamine is the blue-green alga Microcystis aeruginosa, with a NOEC value of 0.02 mg/L, which is far lower than the lowest acute toxicity data. Also the available NOECs for the green alga Scenedesmus quadricauda are a factor of 100 lower than the lowest acute values. In that case, an assessment factor of 100 is applied to the lowest NOEC to obtain the MPC for freshwater. The resulting MPC is 0.2 μg/L. For the MPC for marine water an assessment factor of 1000 is applied to the lowest NOEC. This leads to an MPC of 0.02 μg/L.
The geometric mean of the acute and chronic toxicity data are 73 and 1.2 mg/L, respectively. The SRCeco is equivalent to the geometric mean of NOEC values, i.e. 1.2 mg/L.
Table 21. Selected toxicity data for cyclohexylamine; freshwater species.
Species Taxon Value [mg/L]
Freshwater acute L(E)C50
Chlorococcales Algae 49
Daphnia magna Crustacea 61 a
Leuciscus idus melanotus Pisces 106 b
Oncorhynchus mykiss Pisces 90
Freshwater chronic NOEC
Scenedesmus quadricauda Algae 0.40 c
Pseudomonas putida Bacteria 420
Microcystis aeruginosa Cyanophyta 0.02
Entosiphon sulcatum Protozoa 0.69
Notes
a geometric mean of 49, 80, and 58 mg/L, the test system belonging to the lowest value is buffered sufficiently.
For the other two studies with this is unknown, but the possible change in pH does obviously not result in an additional toxic effect.
b geometric mean of 58 and 195 mg/L. c geometric mean of 0.32 and 0.51 mg/L.
4.1.5 Diethylene glycol
Selected aquatic toxicity data for diethylene glycol are given in Table 22 below. The full data set is shown in Table A1.7. Rejected data are presented in Table A1.8. The acute toxicity data differ by at most a factor of 5, while the lowest chronic value is less than a factor of 50 lower than the highest acute value.
Acute toxicity data for freshwater species are available for crustaceans, fish, amphibians, and protozoans. Acute marine toxicity values are found for algae, crustaceans, fish, and bacteria. The acute toxicity data for freshwater and saltwater are not significantly different and consequently, both sets are combined. As a result the base-set (algae, Daphnia, fish) is complete. Chronic toxicity values are available for algae, bacteria, cyanophyta, and protozoans.
With a complete base-set, an assessment factor of 1000 is applied to the lowest EC50. The lowest EC50 is 15000 mg/L for the malformations of the African clawed frog (Xenopus laevis). The lowest chronic toxicity value of 1700 mg/L for the blue-green alga Microcystis aeruginosa is lower than this value but within a factor of 10. Therefore, the MPC is 15 mg/L. For the marine environment an assessment factor of 10000 is applied. The resulting MPC for saltwater is 1.5 mg/L.
The geometric mean of the acute and chronic toxicity data are 40831 and 4457 mg/L, respectively. The SRCeco is derived from the geometric mean of the acute toxicity data with
an assessment factor of 10. The resulting SRCeco is 4100 mg/L. This value is comparable to
Table 22. Selected toxicity data for diethylene glycol; freshwater and marine species.
Species Taxon Value [mg/L]
Freshwater acute L(E)C50
Daphnia magna Crustacea 47200
Oncorhynchus mykiss Pisces 57645 a
Pimephales promelas Pisces 75200
Poecilia reticulata Pisces 61000
Xenopus laevis Amphibia 14719 b
Tetrahymena pyriformis Protozoa 25860 c
Marine acute L(E)C50
Skeletonema costatum Algae 40800
Mysidopsis bahia Crustacea 36900
Cyprinodon variegatus Pisces 62100
Vibrio fischeri Bacteria 29000
Freshwater chronic NOEC
Scenedesmus quadricauda Algae 2700
Pseudomonas putida Bacteria 8000
Microcystis aeruginosa Cyanophyta 1700
Entosiphon sulcatum Protozoa 10745
Notes
a geometric mean of 52800 and 62934 mg/L.
b geometric mean of 18740, 17470, and 9740 mg/L for the most sensitive endpoint (malformations). c geometric mean of 22500, 24400, and 31500 mg/L.
4.1.6 Ethyl acetate
Selected aquatic toxicity data for ethyl acetate are given in Table 23 below. The full data set is shown in Table A1.9. Rejected data are tabulated in Table A1.10, Acute toxicity data are available for as much as 11 taxonomic groups (see also Figure 2). Most data are for
freshwater species with algae, crustaceans, fish, amphibians, annelids, coelenterates, insects, molluscs, flatworms, and protozoans. Marine toxicity data are available for crustaceans and bacteria. The acute toxicity data range by a factor of 50. The lowest chronic values are up to 20 times as low as the lowest acute value.
The lowest acute value is 110 for the protozoan Tetrahymena thermophila. Chronic toxicity are available for algae, daphnids, bacteria, blue-green algae, and protozoans. The lowest values are for Daphnia magna and the protozoan Tetrahymena thermophila, based on
nominal concentrations. The results based on measured concentrations for Daphnia magna is the lowest value and used to derive the MPC. With an assessment factor of 50, the MPC is 0.11 mg/L. For the marine environment, an assessment factor of 500 is used. Consequently, the MPC for saltwater is 0.011 mg/L.
The geometric mean of the acute toxicity data is 660 mg/L. The geometric mean of the chronic toxicity data is 243 mg/L. The SRCeco is derived from the acute toxicity data with an
assessment factor of 10 and is 66 mg/L. This value is lower than the value of 527 mg/L found by Posthumus et al. (1998) and calculated on the basis of QSARs.
Table 23. Selected toxicity data for ethyl acetate; freshwater and marine species.
Species Taxon Value [mg/L]
Freshwater acute L(E)C50
Chlorococcales Algae 4300
Scenedesmus subspicatus Algae 5600 a
Selenastrum sp. Algae 2500
Asellus aquaticus Crustacea 1600
Daphnia cucullata Crustacea 164 b
Daphnia magna Crustacea 711 c
Daphnia pulex Crustacea 260 d
Gammarus pulex Crustacea 750
Leuciscus idus melanotus Pisces 300 e
Oncorhynchus mykiss Pisces 333 f
Oryzias latipes Pisces 335 g
Pimephales promelas Pisces 243 h
Poecilia reticulata Pisces 210
Ambystoma mexicanum Amphibia 150
Xenopus laevis Amphibia 180
Tubificidae Annelida 760
Erpobdella octoculata Annelida 1200
Hydra ologactis Coelenterata 1350
Aedes aegypti Insecta 350
Chironomus thummi Insecta 750
Cloëon dipterum Insecta 480
Corixa punctata Insecta 600
Culex pipiens Insecta 3950
Ischnura elegans Insecta 600
Nemoura cinera Insecta 130
Lymnea stagnalis Mollusca 1100
Dugesia lugubris Platyhelminthes 3020
Tetrahymena thermophila Protozoa 110 i
Marine acute L(E)C50
Vibrio fischeri Bacteria 5188
Artemia salina Crustacea 708 j
Freshwater chronic NOEC
Chlorococcales Algae 1000
Pseudokirchneriella subcapitata Algae 2000
Scenedesmus quadricauda Algae 15
Daphnia magna Crustacea 5.4 k
Pseudomonas putida Bacteria 650
Microcystis aeruginosa Cyanophyta 550
Tetrahymena thermophila Protozoa 12
Chilomonas paramaecium Protozoa 3248
Entosiphon sulcatum Protozoa 202
Uronema parduczi Protozoa 1620
Notes
a most relevant endpoint (growth rate). b geometric mean of 175 and 154 mg/L.