The application
of natural capital
accounting in
Dutch energy and
water policies
The application of natural capital
accounting in Dutch energy and
water policies
Arjan Ruijs, Frans Oosterhuis and Sjoerd Schenau
The application of natural capital accounting
This publication can be downloaded from: www.pbl.nl/en. Parts of this publication may be reproduced, providing the source is stated, in the form: Ruijs A. et al. (2017), The application of natural capital accounting in Dutch energy and water policies, The Hague, PBL Netherlands Environmental Assessment Agency.
PBL Netherlands Environmental Assessment Agency is the national institute for strategic policy analysis in the fields of the environment, nature and spatial planning. We contribute to improving the quality of political and administrative decision-making by conducting outlook studies, analyses and evaluations in which an integrated approach is considered paramount. Policy relevance is the prime concern in all of our studies. We conduct solicited and unsolicited research that is both independent and scientifically sound.
The application of natural capital accounting in Dutch energy and water policies
PBL Netherlands Environmental Assessment Agency The Hague, 2017
PBL publication number: 2559
Corresponding author
Arjan Ruijs (arjan.ruijs@pbl.nl)
Authors
Arjan Ruijs (PBL), Frans Oosterhuis (IVM-VU) and Sjoerd Schenau (Statistics Netherlands)
Acknowledgements
We would like to thank Cor Graveland (Statistics Netherlands), Krista Keller (Statistics Netherlands) and Stefan van der Esch (PBL) for their useful comments, and Foppe de Haan (SER), Pieter Boot (PBL), Ton van Dril (ECN), Rob van der Veeren (Rijkswaterstaat) and Paul Baggelaar (AMO-Icastat) for their contributions.
Graphics
PBL Beeldredactie
Production coordination
MAIN FINDINGS
Summary and main findings 6 FULL RESULTS
1 Introduction 10
2 Water Framework Directive 12
2.1 Policy objectives 12
2.2 Policy process and policy documents 12 2.3 Environmental accounts for water policy 13
2.4 The role of data from environmental accounts in policy development 14 2.5 Usefulness and limitations of environmental accounts in water policy-making 17
3 Energy Agreement 20
3.1 Policy process of the Energy Agreement 20 3.2 Environmental accounts for energy policy 22
3.3 The role of environmental data in policy development 22 3.4 The added value of environmental account data 25
4 Conclusions 28 References 32 Abbreviations 35 Appendix 1 36 Appendix 2 37
Contents
Summary and main findings
How could environmental accounts contribute to improve policy-making, with respect to the sustainable use of natural resources? That is the key question in the World Bank-led Global Partnership on Wealth Accounting and the Valuation of Ecosystem Services (WAVES). Countries that already have some experience of environmental accounting may provide information to answer this question.
In a previous study, Oosterhuis et al. (2016) also contribute to this by examining the development of environmental statistics and environmental accounts in the Netherlands. In the Netherlands, environmental statistics have been collected since the 1970s, and environmental accounting, linked to the system of national accounts, started in the 1990s. Both the environmental statistics and accounts have since continuously developed and expanded. Oosterhuis et al. (2016) observe that they are used in agenda-setting and in informing, developing,
implementing, evaluating and improving environmental policies for various policy areas. Moreover, they argue that translating raw data into policy-relevant insight is essential for making maximum use of environmental statistics and accounts. This is a task that must be clearly allocated as it often requires a kind of expertise and research qualifications that differ from those needed for development of statistics. Furthermore, to increase the scope of application of environmental accounts in policy-making, various institutional channels should be used to link statistics and policy.
This report examines in more detail how environmental accounts have played and still play a role in Dutch policy on water (focusing on the Dutch implementation of the European Water Framework Directive) and energy (focusing on the Dutch Energy Agreement). We assessed how the environmental accounts were used in the three policy phases of awareness raising, policy preparation and policy monitoring. This information may inspire the WAVES Partnership countries to develop mechanisms and institutions that mainstream the uptake of
information from the natural capital accounts in their policy-making processes.
Water
Integrated Water Resource Management (IWRM) has been a key feature of water policy in the Netherlands, since the 1980s, and was reinforced after 2000 by the implementation process of the EU Water Framework Directive (WFD). The core objective of the WFD is to achieve a ‘good status’ for surface waters and groundwater by 2027, at the latest. River Basin Management Plans (RBMPs), Programmes of Measures and monitoring programmes have been drawn up to realise this objective. Moreover, EU Member States are required to prepare an economic analysis of water use, for each river basin district, and are obliged to ensure that all water users contribute to the recovery of the costs of water services.
An assessment of the role of water accounts and water statistics in the WFD suggests that this information plays an important role in supporting the WFD, but does not fulfil all of its envisaged roles. Water accounts have been developed by Statistics Netherlands (CBS), as part of the environmental accounts system, over the past 15 years. A first full National Accounting Matrix including Water Accounts (NAMWA) was prepared in 2001, with the objective to enable the determination of indicators for the support and evaluation of the integrated water policy. NAMWA made it possible to monitor the use of water resources at the level of economic sectors, to relate this use to economic activity (and hence monitor resource efficiency and pollution intensity), to analyse water-related financial incentives, such as taxes and charges and to assess the related share in recovering the costs of the water services provided. Initially, NAMWA was constructed at the national level, but, in 2005, the water accounting system was regionalised with separate matrices for the Rhine, Meuse, Scheldt and Ems river basin districts in the Netherlands.
7
Summary and main findings |
To support the implementation of the WFD, the information from these accounts currently mainly helps for the economic description of the river basins and for monitoring the cost-recovery of water services. The information is used for showing the present state of specific indicators and for monitoring the trend in their development, over time. The water accounts provide information on the use of water resources and water services (including emissions to water) by the various economic sectors. Moreover, they show the financial contributions to cover the costs of the water used, per sector.
The use of the accounts in analysing scenarios, policies and measures, however, has been limited, so far. Initially, the water accounts were expected also to be useful for modelling the economic impacts of various water policy measures, in support of the selection of cost-effective measures. However, ultimately, they were never used for this purpose. We see several reasons the accounts were not used for these purposes. To a certain extent, this may be due to a lack of awareness among policymakers about the information that these accounts offer and how this information could be used for bottom-up policy-making and decision-making processes that characterise Dutch water policies. More importantly, there may also be a mismatch between the information supplied and the level of detail required by policymakers (geographically and by sector). The implementation of WFD measures, to a large extent, is initiated and executed on a regional level, and consists of very concrete and specific local measures, many of which having a qualitative rather than a quantitative character. Economic-environmental analysis at this low geographical level would require data on a low level of aggregation.
Energy
The Dutch economy, compared to that of other EU countries, is characterised by a relatively energy-intensive industry and a large share of fossil fuel in the domestic energy supply. The Netherlands already have a long history of energy and climate policies. Yet, some years ago, growing concern about the lack of progress on CO2
emission reduction and the use of renewable energy and the lack of a long-term perspective in energy and climate policy led to a process of consultation and negotiation, involving government, business, trade unions and NGOs. As a result, in 2013, the Dutch Government, together with 46 partners, entered into an ‘Energy Agreement for sustainable growth’, in which they agreed to share responsibility and commitment to achieve a number of overarching objectives related to energy saving, energy supply and the reduction in greenhouse gas emissions. The main objectives of this broadly supported agreement are a 1.5% annual energy-efficiency improvement
(leading to 100 PJ in energy saving by 2020), an increase in the share of renewable energy from 4.5% in 2013 to 16% by 2023 (14% by 2020), 15,000 new jobs by 2020, and a 100% sustainable energy system by 2050. Progress towards the achievement of these ambitious objectives is being made, but their realisation continues to require a large amount of effort.
Since the 1970s, energy statistics and environmental accounts have been playing a role in analysing and monitoring Dutch energy and climate policies. They also played an important role in the policy process around the Energy Agreement. Before the start of the negotiations, they were helpful to raise awareness of the problems that had to be dealt with. During the negotiation process, they were used to analyse the envisaged effects of the plans; the energy accounts were used in the related model calculations. Currently, they are still important in monitoring the progress of the agreement. The Dutch environmental accounts include energy accounts that consist of the energy use and supply tables. The energy accounts relate to various other environmental account modules, such as the air emissions accounts, the physical and monetary asset accounts for oil and natural gas reserves, and the various monetary environmental account modules. Information from the statistics is used not only in projections of, for instance, future energy use, greenhouse gas emissions, and the effects of government policies, but also to compare the Dutch performance on energy issues with that of other countries.
Currently, the energy accounts also play a role in the annual National Energy Outlook, which evaluates the progress of the Energy Agreement and the feasibility of the objectives. The Outlook, among other things, contains a chapter on economic developments related to energy transition. This chapter is partly based on data from the environmental goods and services sector, which is part of the UN System of Environmental-Economic Accounting Central Framework (SEEA CF). As these data are fully consistent with the national accounts,
a multitude of comparisons with and analyses of the total Dutch economy are conducted. Examples include emissions per sector, the contribution of energy-related activities to the Dutch economy, and gross employment effects of energy-related investments. The energy statistics and accounts are also used for modelling the envisaged impact of policy measures.
The Energy Agreement provides a good example of a clear policy impact from environmental statistics and environmental accounts, both during policy negotiations and its implementation (monitoring, evaluation and possible adjustments).
much more decentralised than Dutch energy policy processes, which is why much of the information in the environmental and national accounts does not match the target groups of water policy interventions. This is different for national energy policies, which target the sectors and households that are reflected in the accounting
information. Finally, the Water Framework Directive has resulted in numerous, often small and location-specific measures for which information is often derived from local investigations and qualitative data instead of national accounting data. Here, also, energy policies differ, as they can usually be assessed in more general and quantitative terms, and they are better suited to the type of information provided in the national and environmental accounts. Finally, in the Netherlands, it took a fair amount of time before the accounting information could be applied, successfully, in policy models and policy analyses, as well as in policy processes. An institutional structure was created, characterised by cooperation between statistical organisations, policy analysts and policymakers – each with their own tasks and responsibilities, through transparency, trust and data sharing, and mutual learning. By recognising these issues, integration of environmental accounting information in policy processes could occur more rapidly in WAVES Partnership countries than was observed in the Netherlands.
Conclusions
This analysis shows that the information from the environmental accounts is highly relevant in the phases of monitoring and policy preparation of the two policy processes investigated. However, the applicability of environmental accounts for policy analysis and policy advice varies between policy areas. The following three factors seem to affect the applicability of the
environmental accounting data in the policy processes: 1) the scale of the environmental problems; 2) the level at which decisions are made; and 3) the correlation between type of policy measure and level of detail of the
information in the environmental accounts.
Evidence from the two examples suggests the accounts are more useful for national rather than local policy issues for which the activities of the actors involved (government or private-sector parties) are reflected in the accounts, and for which generic rather than location-dependent policy measures can be adopted. The local water quality issues that are dealt with in the Water Framework Directive, usually, require local solutions, for which local data are used to determine the appropriate measure or policy. On the other hand, for energy policy measures, location is less relevant than the economic sector for which a certain measure is taken. The geographical level of national and environmental accounts is far better suited to these types of issues. In addition, Dutch water policy processes are
FULL RESUL
TS
FULL RESUL
ONE
Introduction
one
The WAVES1 Global Partnership of the World Bank aims
to promote sustainable development by ensuring that natural resources are mainstreamed in development planning and national economic accounts. In a number of countries, WAVES assists ministries, statistical organisations and central banks in developing environmental accounts. A key question for WAVES is how this information could contribute to improve policy-making. For this, the WAVES Partnership would like to learn from the experience gained in other countries. Oosterhuis et al. (2016) contribute to this by examining the development of environmental statistics and environmental accounts in the Netherlands.2
They observe that these statistics and accounts are used in agenda-setting and informing, developing,
implementing, evaluating and improving national policies, already since the 1970s. That study makes three recommendations. First, it recommends to ensure consultation and cooperation between developers and users of environmental accounts with due attention for the long term and the choice of relevant themes. Second, the translation of raw data into policy-relevant insight is essential for making maximum use of environmental statistics and accounts. It is a task that must be clearly allocated as it often requires a kind of expertise and research qualifications that are different from those needed for developing statistics. Third, to increase the scope of application of environmental accounts, a multitude of channels should be used to link statistics and policy. This should not be limited to statistical organisations and research institutes specifically tasked with policy analysis, but also include universities, think tanks and consultancy firms.
For this report, we examined in more detail how environ-mental accounts have played and still play a role in Dutch policy on water (focusing on the Dutch implementation of the European Water Framework Directive) and energy (focusing on the Dutch Energy Agreement). These policy fields were chosen as they are also high on the political
agendas in WAVES Partnership countries. For both policies, we examined the role of environmental accounts in raising awareness of policy issues, in developing policies to deal with those issues, and in monitoring their progress. This information may inspire the WAVES Partnership countries to develop mechanisms and institutions that mainstream the uptake of information from the natural capital accounts in policy-making processes.
The core subject of this report is the exploration of the role of environmental accounts for the implementation of the EU Water Framework Directive in the Netherlands (Chapter 2) and for the establishment and monitoring of the Dutch Energy Agreement (Chapter 3). On the basis of literature review and interviews with a number of key players working on these policies (see Appendix 1), it evaluates how the environmental accounts have been used in raising awareness, as well as in preparing and monitoring policy. Chapter 4 draws a number of conclusions about how experience gained in the Netherlands may help the WAVES Partnership countries.
Notes
1 Wealth Accounting and the Valuation of Ecosystem Services (see www.wavespartnership.org).
2 In this report the terms environmental account and natural capital account are used interchangeably. In the Netherlands, the term environmental accounts is used. These include physical supply and use tables (PSUT) as part of physical flow accounts for waste, water, emissions to soil, air and water, energy and material flows. It also includes asset accounts for the petroleum and natural gas reserves and monetary environmental accounts that include accounts for environ-mental taxes and charges, the environenviron-mental goods- and services sector and environmental protection (EPEA) and resource management expenditure accounts. Currently, Statistics Netherlands experiments with further implementation of ecosystem services accounts. These accounts are also part of the natural capital accounts (NCA).
TWO
Water Framework Directive
two
2.1 Policy objectives
The EU Water Framework Directive (WFD, Directive 2000/60/EC) establishes an integrated legislative basis for water protection in the European Union.
The environmental objectives of the WFD are specified in its Article 4. These objectives, generally, were focused on achieving a ‘good status’ for surface waters and
groundwater by 2015 (with a number of exemptions, including extensions until 2027). For surface waters, the Directive distinguishes between ‘good chemical status’ and ‘good ecological status’ (or, for artificial and heavily modified water bodies ‘good ecological potential’). For groundwater, a differentiation is made between ‘chemical status’ and ‘quantitative status’. Criteria for the assessment of the status are specified in Annex V of the Directive.
To achieve these objectives, Member States had to prepare ‘Programmes of Measures’, monitoring programmes and ‘River Basin Management Plans’. With respect to the potential contribution of the water accounts, certain provisions of the WFD are relevant, such as:
− the requirement for Member States to prepare an economic analysis of water use for each river basin district, as specified in Article 5(1) and Annex III; − the obligation to ensure that all water users contribute
to the recovery of the costs of water services and that water-pricing policies provide adequate incentives for users to use water resources efficiently (Article 9).
2.2 Policy process and policy
documents
The WFD introduced an integrated approach towards water policy in the EU and its Member States. This integration has several aspects. For example, the WFD addresses both groundwater and surface water; water quantity as well as quality (chemical and ecological); relationships within and between river basins; as well as the various functions and uses of water. Moreover, the WFD also deals with the economic aspects of water and water use.
In the Netherlands, an integrated approach towards water management has meanwhile been applied for some decades. The importance of the relationships between for example quantitative and qualitative water management and between groundwater and surface water was already acknowledged in the 1980s (former Dutch Ministry of Transport, Public Works and Water Management, 1985). During the 1990s, Integrated Water Resources Management (IWRM) and a water systems approach became key concepts of the institutions
responsible for water management1 (former Dutch Ministry
of Transport, Public Works and Water Management, 1998). The implementation of the WFD reinforced this approach after 2000, culminating in the National Water Plan and
This section addresses the use of environmental accounts in water policy in the Netherlands. The focus is on inland waters (both surface and groundwater). Main policy developments in this area, over the past 15 years, were related to the implementation of the EU Water Framework Directive.
13
2 Water Framework Directive |
TWO TWO
the first set of River Basin Management Plans (RBMPs) in 2009. In subsequent years, those plans were implemented and preparations were made for the next phase.
The resulting new National Water Plan and RBMPs cover the 2016–2021 period. The RBMPs are based on the plans and programmes of the various authorities responsible for water management, on national, regional and local levels.
2.3 Environmental accounts for water
policy
The System of Environmental-Economic Accounting for Water (SEEA-Water) provides a conceptual framework for monitoring the progress towards water policy objectives, both in individual countries and on an international scale (UN, 2012). SEEA-Water is based on, and coherent with, the System of National Accounts (SNA) and is part of the SEEA Central Framework, which was adopted in 2012 as an international statistical standard by the UN statistical commission (UN, EU, FAO, IMF, OECD and The World Bank, 2014). Water accounting comprises different types of accounts that capture information on physical flows and monetary flows related to water, the emission of pollutants to water and the availability of water resources (assets), to reflect the integral role that water plays in human life, economic activity and environmental integrity (ecosystems). Integrating data on water with economic and monetary information on water enables the monitoring of water conservation policies and particular instruments, as well as the relationship between water abstraction and water assets to identify water stress at country or river basin level. Moreover, by relating national accounts to physical water flow accounts, a water productivity indicator could be developed. In this context, it also supports development of a number of indicators that relate to the Sustainable Development Goals (SDGs), in particular SDG-6 on water (dealing with water stress and water productivity). Following pioneering work by De Haan (1998), Statistics Netherlands began working on water accounts in 2001. The first full National Accounting Matrix including Water Accounts (NAMWA) was prepared for the year 1996, at the request of the Dutch national water authorities (the former RIZA Institute for Inland Water Management) (Van der Veeren et al., 2004). The objective of NAMWA was to determine the indicators for the support and evaluation of the integrated water policy (IWRM). NAMWA consists of:
− economic accounts (with detailed data on water-related transactions and more aggregated data on other transactions);
− water emission accounts (based on the national emission registration system);
− water flow accounts (based on data from water supply companies and environmental annual reports by large manufacturing companies).
Initially, NAMWA was constructed on a national level, but the WFD, with its river basin approach, necessitated the regionalisation of the water accounting system. A regional NAMWA was therefore developed for the Dutch river basin districts of the Rhine (with sub-basins north, east, west and centre2), Meuse, Scheldt and Ems
(NAMWARiB: NAMWA for river basins) (Brouwer et al., 2005). This made it possible, for instance, to present river-basin data on the ‘emission intensity’ of the economy (emissions per euro of value added) (see Figure 2.1). Subsequently, NAMWAs have been prepared for several years, allowing for time series analyses and identification of trends (Van der Stegen, 2002; Schenau, 2004; Ten Ham, 2006; Van Rossum et al., 2009, 2010; Verberk and Van Rossum, 2014). Furthermore, NAMWAs were made for the economic description of the Dutch part of the North Sea, as a contribution to the reporting requirements of the Marine Strategy Framework Directive (MSFD) (Vuik and Van Rossum, 2010; Pieters and Van Rossum, 2014).
Since 2005, also more detailed water supply and use tables have been developed (Graveland, 2006; Baas and Graveland, 2011a, 2014; Delahaye et al., 2016; Statistics Netherlands 2016a,b; Verschuren et al., 2016a,b), and the time series was extended to date back to 1976, by means of regression analysis (Lodder et al., 2014). These supply-and-use tables show detailed information, for the Netherlands, on the exchange of water between the environment and the economy, both the abstractions from the environment and the ‘return flows’ including losses flowing back to the environment, and the exchange of water between economic sectors. Initial attempts have also been made to arrive at economic values for Dutch water resources within the SEEA framework (Edens and Graveland, 2014).
In addition to their role in the implementation of WFD and MSFD, water accounts also play a role in the monitoring of ‘green growth’ in the Netherlands. With the help of environmental accounts, indicators were developed that show whether there is a decoupling between economic (GDP) growth, environmental burden and resource use (emissions, resource depletion). For example, between 2000 and 2012, real GDP increased by some 15% while heavy metal emissions to water decreased by about 50% and groundwater abstraction
TWO
and Programmes of Measures (PoMs) contain analyses based on the water accounts.4 To find an explanation, we
looked at two areas where the water accounts could play a role, namely the selection of cost-effective measures for water quality improvement, and the issue of ‘cost recovery’.
Selecting cost-effective measures
Even though NAMWA was not intended to support the analysis of the cost effectiveness of water policy, water accounts data was expected to also be useful for this purpose. The preparation of the first set of Dutch RBMPs was accompanied by WEMPA5, a large research
programme aimed at the development of an Applied General Equilibrium model (AGE) for water economics (Brouwer et al., 2008). This model, based on NAMWA(RiB), was to enable policymakers and decision-makers to select the most cost-effective options to achieve a certain objective (e.g. a certain amount of additional emission reduction), and to calculate the direct and indirect economic impacts of these policies and measures (including any disproportionally high costs).
In practice, however, neither the model nor the NAMWA itself were used for these purposes. The role of NAMWA in the economic analysis required by the WFD remained limited to information provision. It was not used to estimate the impact of policy measures on water and decreased by some 7% (Statistics Netherlands, 2015a).
Specifically, in the agricultural sector, the value added increased over the same period by some 10%, while nitrogen surpluses decreased by 40% and phosphorus surpluses by more than 80%. The water accounts also allow the construction of graphs, such as in Figure 2.2, to show the amount of groundwater used per euro of value added in various sectors. This figure, for instance, reveals that the ‘water intensity’ in industry declined between 2004 and 2010 (in some industries even by more than 50%), whereas it increased in the agricultural sectors.3
2.4 The role of data from
environ-mental accounts in policy
development
The actual role of NAMWA in the implementation of the WFD in the Netherlands mainly consists of the economic description of river basins. In River Basin Management Plans (RBMPs), NAMWA data are used to describe the economic development of river basins.
In terms of WFD-related policy analyses, NAMWA data play a relatively minor role. Neither the first (2009) nor the second (2016) River Basin Management Plans (RBMPs)
Figure 2.1 Ems Meuse Rhine Central Rhine North Rhine East Rhine West Scheldt 0.00 0.05 0.10 0.15 0.20 0.25 heavy metal equivalents, per million euros value added Source: Statistics Netherlands 2011
pb
l.n
l
Emission of heavy metals
Emission intensity per river basin, 2007
Ems Meuse Rhine Central Rhine North Rhine East Rhine West Scheldt 0 20 40 60 80 nutrient equivalents, per million euros value added
pb
l.n
l
Emission of nutrients
Note: Emissions of copper, chromium, zinc, lead, cadmium, mercury and arsenic can be converted into heavy metal equivalents and can subsequently be added together. Likewise, emissions of phosphorus and nitrogen can be converted into nutrient equivalents. Conversion into equivalents takes into account the degree of harmfulness of the various metals and nutrients for the environment. The CBS publication does not specify the weights used to calculate the equivalents.
15
2 Water Framework Directive |
TWO TWO
A possible reason for the limited use of water accounts for policy analysis is that WFD measures are not selected ‘top down’, by a single optimum-seeking decision-maker, but is the result of gathering and streamlining a large number of ‘bottom up’ actions as proposed and intended by several actors on all levels of governance (national government, provinces, water boards and municipalities).7
Apparently, the available NAMWA-based information and the WEMPA model do not comply with what is needed in this specific policy-making and decision-making process. We did not study the details of this mismatch, but it seems clear that information on the possible environmental and economic impact of water policy measures will only be used if it is presented in a way that directly links to the decisions that the responsible authorities and actors have to make.
Another explanation for the modest role of water accounting could be the fact that a substantial number of measures that are needed to achieve the WFD objectives have a qualitative rather than quantitative character. The realisation of a good ecological status particularly depends on measures relating to the design and structure of the water system, rather than to measurable parameters such as amounts of emissions or water consumption. Neither the environmental nor the economic impact of economy (Van der Arend et al., 2010). For the first set of
RBMPs, the costs and benefits of the measures were assessed (former Ministry of Transport, Public Works and Water Management, 2006; PBL, 2008; Van der Veeren, 2010), but without using or referring to NAMWA or the, at the time still ongoing, WEMPA work.6
In the second round of RBMP preparations, again, NAMWA was used only for the economic description of the river basins, but no NAMWA-based modelling was used and no cost-benefit analyses were done. The socio-economic reports (Verberk and Van Rossum, 2014; Ecorys, 2013) providing background information for the new (2016–2021) RBMPs, do contain some NAMWA-based information, but are (again) mainly descriptive (focusing, among other things, on the impact of the economic downturn, since 2008, in the various river basins). In addition to the water accounts, they also use other data from Statistics Netherlands and other research institutes. For the long-term trends, Ecorys (2013) uses CPB–PBL scenarios (CPB and PBL, 2006), but without linking them to environmental impacts. The ex-ante evaluation of the new RBMPs (Van Gaalen et al., 2015) focuses mainly on the effectiveness of the proposed measures and largely ignores the interrelationship between economic activities and environmental impacts.
Figure 2.2
Arable farming Livestock farming Paper industry Rubber and plastic products Mixed farms and fruit farming Basic metal products Food, beverages and tobacco Building materials Horticulture
Total economy
0 5 10 15 20 25
litres Source: Statistics Netherlands
pb
l.n
l
2004 2010 Groundwater withdrawal, per euro of value added for the Dutch economy, per sector
TWO
For most of the water services identified, cost recovery rates of close to 100% were calculated, with the exception of ‘collection and transport of rainwater and waste water’ in the year 2000. At that time, some municipalities were not levying a sewerage charge, but were financing their sewerage systems from their general budget. Since 2011, all Dutch municipalities have been applying a sewerage charge.
In both of the cost recovery reports, the water accounts (NAMWA) were used as one of the sources of information. In some cases, they served as a cross-check on estimates from other sources. In other cases, NAMWA was the only available data source; for example, because other statistical data on water supplies to industry are confidential. In addition to NAMWA, other elements of the environmental accounts, such as the water use accounts, the accounts of revenues from environmental taxes and charges, and the net environmental costs for industries were used for calculating cost recovery rates. In both reports, attempts were made to assess any cross-subsidies between the main categories of water users (industry, households and agriculture). For most types of water services, it was concluded that there was no evidence of cross-subsidies (but also no clear evidence of their absence). Only for ‘water system management’ (e.g. including the flood and drought prevention, and general water quality management), the 2013 report concluded that agriculture and nature protection areas probably were benefiting disproportionally, compared to their level of contribution. More specifically, the Note on Important Water Management Issues (Helpdesk water, 2013) states that agriculture, being responsible for 70% of the nutrient load to surface water, pays only EUR 325 million per year for water treatment, whereas households (contributing 30% to the nutrient load), in total, pay EUR 1200 million in waste water treatment charges per year. Likewise, agriculture pays an average EUR 50 per hectare, per year, in water system
such measures (which are usually location-specific) can be readily measured or analysed within the quantitative framework of the water accounting system.
Stone et al. (2006) suggest that the water economic model analyses based on NAMWA could also play a role in the determination of possible disproportional costs. This was a potentially relevant issue since disproportional costs are one of the possible motives for extending the 2015 deadline for achieving WFD objectives to 2027 and for setting less stringent environmental objectives (see Article 4.4 and 4.5 of the WFD). In an early stage of the implementation process, it became clear that it would be difficult for the Netherlands to achieve all of the WFD objectives by 2015.8 However, in the various reports that
were produced to elaborate and underpin the possible arguments for disproportionality (Syncera et al., 2005; Zijp et al., 2007; Van Os et al., 2008), no direct references to water accounts or NAMWA could be found.
Water services cost recovery
Cost recovery is another topic where water accounts, in principle, could provide the information needed to support the requirements of the WFD.9 As noted above,
the WFD obliges Member States to ensure ‘an adequate
contribution of the different water uses, disaggregated into at least industry, households and agriculture, to the recovery of the costs of water services’ (Water Framework Directive, Article 9). The economic analysis should include the necessary calculations to ensure that this cost recovery principle is applied (Annex III). Essentially, it means that water use is not subsidised (the polluter/user pays) and that there are no significant cross-subsidies between the main categories of water users.
In the first and second report on cost recovery (Rijkswaterstaat, 2005, 2013), five water services10
were distinguished. Table 2.1 shows the calculated cost recovery rates for each of these services, for the years 2000 and 2012.
Table 2.1
Cost recovery rates for water services in the Netherlands, 2000 and 2012
Water service 2000 2012
Water production and supply 100% 100%
Collection and transport of rainwater and waste water 80% 100%
Waste water treatment 100% 100%
Groundwater management 95% 100%
Regional water system management 100% 100%
17
2 Water Framework Directive |
TWO TWO
Synopsis
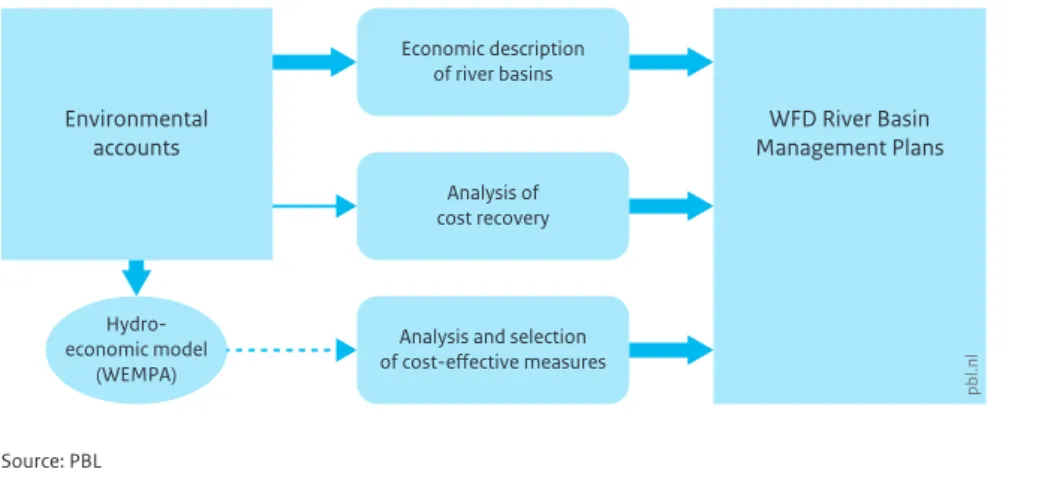
Figure 2.3 illustrates the role of environmental accounts in the WFD implementation in the Netherlands. It shows that these accounts have played an important role in the economic description of river basins, and a smaller role in de analysis of cost recovery. The envisaged role in the analysis and selection of cost-effective measures, with the help of an integrated hydro-economic model (WEMPA), has not materialised (as indicated by the dashed arrow).
2.5 Usefulness and limitations of
environmental accounts in water
policy-making
Important but limited role
Statistics on water use, water pollution and water quality have been prepared in the Netherlands since the 1970s (see e.g. Oosterhuis et al., 2016). National accounts have an even longer history. Their integration into the water accounts from 2000 onwards has enabled the monitoring of water resource use on a sectoral level, relating this use to the particular economic activity, the monitoring of the resource use efficiency and pollution intensity, and assessment of the individual sectors’ share in the recovery of the costs related to the water services provided. This kind of information would not have been available without the water accounts.
management charges, whereas the average costs amount to EUR 200. The source of these figures is unclear, but according to our interviewee they are not based directly on data from the water accounts.
Both cost recovery reports only provide estimates on a national level. Apparently, even though water accounts were available on river basin level (NAMWARiB), this information was not sufficient to allow the calculation of cost recovery rates at this level. Attempts to do so in the first report (see Appendix 3 of Rijkswaterstaat 2005) were not based on NAMWARiB and had to lean on a large number of assumptions. These attempts were not repeated for the second report (Rijkswaterstaat, 2013). According to our interviewee, such an exercise would have had little added value, since full cost recovery of the services provided by water boards and drinking water companies is a legal requirement. It is, therefore, by definition around 100%, with little regional variation. The principle of cost recovery in the WFD includes ‘environmental and resource costs’. For pragmatic reasons, the Dutch Government has interpreted this concept in a narrow sense, by defining them as the costs associated with present mitigating measures (i.e. measures taken to prevent environmental damage11). However, it was
acknowledged that additional measures are needed to achieve the desired environmental quality. The costs of these additional measures can be seen as ‘non-internalised’ (or ‘not yet internalised’) environmental costs.12
Sterk (2013) analyses these additional costs, resulting in somewhat lower cost recovery estimates (between 88% and 99%). The additional data used were taken from a study by Ecorys (2012). The latter study does not refer to water accounts, but is based on the costs of the packages of measures in the RBMPs.
Figure 2.3
The role of environmental accounting in the implementation of the Water Framework Directive (WFD) in the Netherlands
Source: PBL
Environmental
accounts Management PlansWFD River Basin
Economic description of river basins Analysis of cost recovery Hydro-economic model (WEMPA)
Analysis and selection of cost-effective measures
TWO
concrete measures, and not so much with the (direct andindirect) linkages between environment and economy to which the environmental accounts relate. The Dutch Programmes of Measures (as laid down in the Water Management Plans of the Water Boards), in addition to more general plans and intentions, also contain very specific measures. However, as indicated in section 2.4, a substantial part of the measures (and their impacts) have a qualitative rather than a quantitative character. The realisation of a good ecological status particularly depends on measures relating to the design and structure of the water system, which are not shown in the water accounts, rather than to measurable parameters, such as amounts of emissions or water consumption, which are part of the water accounts. Next to that, economic-environmental analysis at this low geographic level would require the availability of data at the same low level of aggregation. This is often not available, for reasons of confidentiality. According to one interviewee, there are also differences in emission data between the national Emission Registration data (which are used for the environmental accounts) and the emission data used by the water boards, due to differences in accounting rules. The absence of scenario-oriented modelling studies that use water accounts was confirmed when looking at the long-term scenarios for the provision of drinking water (an issue not directly related to the WFD implementation). In principle, the scenarios for possible developments in water demand by sector could be based on information from the water accounts. However, the water accounts appear not to have played that role in the latest outlook studies on the drinking water supply by 2040 (Van der Aa et al., 2015), or at least not a direct role.13
Water accounts are expected to be useful for
implementation of the marine strategy
Despite the limited role of the water accounts in the Water Framework Directive, it is expected that their role may be more important in the implementation of the Marine Strategy Framework Directive (MSFD), where the scale and level of policy and statistical data are more comparable. In the MSFD case, implementation is mainly at the national level, and the underpinning economic analyses are done for the entire part of the North Sea that is under the jurisdiction of the Netherlands (the Dutch Exclusive Economic Zone). The ‘NAMWA for the North Sea’ is not only used for the economic description (Vuik and Van Rossum, 2010; Pieters and Van Rossum, 2014), but will also play a role in assessing the impacts of economic activities on and around the North Sea on the environment and ecosystems. It should be noted that water accounts are also used in other water-related policies in the Netherlands that were not investigated in this study.
Baas and Graveland (2011b) distinguish a variety of possible applications of water statistics and water accounts in water policy, in all phases of the policy cycle (see Appendix 2). The analysis with respect to the WFD suggests that water accounts in the Netherlands play an important role in supporting water policy, but do not fulfil all of the envisaged roles.
Using water accounts for cost recovery estimates
and economic descriptions
The information from these accounts is currently mainly used for descriptive purposes, to show the present state of specific indicators and to monitor the trend in their development, over time. The water accounts have been successful in conveying information on the use of water resources and water services (including emissions to water) by the various sectors of the Dutch economy, and on the financial contributions made by these sectors to cover the costs of this resource use and services. By comparing the water use data with economic activity indicators (GDP and value added by sector) on progress towards resource efficiency and decoupling could be constructed (see e.g. Statistics Netherlands, 2015a). This information is widely used, also at the international level (e.g. in UNEP, 2012; OECD, 2015). With respect to the implementation of the WFD, the water accounts have been mainly useful for the economic description of the river basin districts and to some extent for the assessment of the rates of cost recovery for the various water services.
Data need and data supply do not always match
The use of the accounts in analysing future scenarios and the possible impacts of policies and measures, however, has been limited, so far. In principle, economic-environmental analyses would enable the selection of cost-effective measures, the assessment of (direct and indirect) economic impacts of WFD policies and measures, and would allow for the analysis of long-term scenarios for possible developments in the water sector. The limited use of the accounts for these purposes may, to a certain extent, be due to a lack of awareness among policymakers of the information that these accounts offer and how this information can be of use for the bottom-up policy-making and decision-making processes that characterise Dutch water policies. Next to that, there may also be a mismatch between the information supplied and the information policymakers need, in terms of a lack of sufficient detail (geographically and by sector) of the available data.
WFD implementation measures are mostly initiated and executed at the regional level (water boards). At this level, experts are mainly concerned with the technical
19
2 Water Framework Directive |
TWO TWO
12 These costs may be ‘legacies’ of poor water quality caused by activities that took place in the past. It is therefore not possible to relate them directly and completely to current activities.
13 According to our interviewee, the projected water demand was based on demographic and economic scenarios by CPB Netherlands Bureau for Economic Policy Analysis (CPB and PBL, 2006), in combination with expert opinions about possible technical developments regarding water efficiency and water substitution.
Notes
1 In the Netherlands, the various water management responsibilities are divided among the regional Water Boards, municipalities, provinces and (at the national level) Rijkswaterstaat.
2 In 2013, the sub-basins ‘East’ and ‘Centre’ were merged into a new sub-basin ‘East’.
3 Obviously, one should be careful with interpreting such indicators. In agriculture, annual water use strongly depends on the amount of precipitation, and 2010 was a drier year than 2004 (KNMI, 2016). Meaningful trends can therefore only be distinguished by observing averages over several years.
4 The only direct reference to NAMWA is in Table 6.1 of each of the 2009 RBMPs, where the (current) environmental costs per sector are estimated.
5 Water Economic Modelling for Policy Analysis. 6 Indirectly, data from the National accounts and other
environmental accounts (e.g. environmental taxes) may have been used.
7 We have searched a sample of the water management plans drawn up by these institutions for the period 2016-2021, as well as the environmental impact assessment reports made for those plans. None of these contain any references to the water accounts.
8 In 2003, researchers at Alterra investigated the possible economic impact of the WFD on agriculture, nature, recreation and fisheries. Their report (Van der Bolt et al., 2003) caused some turmoil, since it suggested that the WFD objectives could not be achieved without terminating agricultural activity in a substantial part of the Netherlands. The study itself did not use the water accounts, but it led to increased attention for the potentially disproportionally high costs of achieving the WFD targets.
9 The WATECO Guidance document (European Commission, 2003) already pointed to the fact that, for the analysis of the cost recovery requirement, an accounting matrix would be needed similar to NAMWA, distinguishing between categories of water users (households, industry and agriculture) and providers of water services.
10 Interpretation of the scope of the term ‘water services’ differs between the European Commission and several Member States, including the Netherlands. These Member States apply a narrow scope, essentially focusing on drinking water supply and waste water treatment. The Commission uses a broader definition, including for instance also the use of water for hydropower, shipping and irrigation. In 2014, the Court of Justice of the EU (case C-525/12, European Commission versus Federal Republic of Germany) decided that Member States are not obliged to apply the principle of cost recovery to all water services (without giving its opinion on the correct interpretation of the scope of ‘water services’) (see Lindhout et al., 2015).
THREE
Energy Agreement
three
3.1 Policy process of the Energy
Agreement
In 2013, the Dutch Government together with 46 partners (employers’ organisations, trade unions, and environ-mental, housing and transport organisations) entered into the Energy Agreement for sustainable growth (SER, 2013), in which they agreed to share responsibility and commitment to achieve a number of overarching objectives related to energy saving, energy supply and greenhouse gas emissions.
Energy policies have always been a sensitive issue in Dutch politics. The Netherlands is characterised by a relatively large number of energy-intensive industries, compared to many other countries; for example, the Dutch economy has large numbers of refineries, chemical industries, horticultural businesses and a large transport sector (Statistics Netherlands, 2015a; De Nederlandsche Bank, 2016). As a result, the Dutch economy is still very dependent on fossil fuels. The Netherlands emits relatively large amounts of greenhouse gases, compared to many other European countries, and the share of renewable energy in the total gross energy consumption is relatively small, by comparison. In 2013, the Netherlands ranked among the lowest in the EU-28 with regard to the share of renewable energy (Statistics Netherlands, 2015a). The Netherlands has a long history of energy and climate policies. Yet, in the early 2010s, energy policies featured
less prominently on the political agenda and lacked a long-term perspective. In the years preceding the Energy Agreement, there was widespread and growing unease among societal organisations and business about energy and climate policy being politicised and capricious. Moreover, despite international agreements on climate policy and despite the implementation of several European energy and climate policies, the Dutch Government did not provide a clear long-term perspective and direction for its energy policy, although the business community was in need of such a vision for their investment security. Furthermore, shortly after the start of the financial crisis, Dutch energy and climate policy were in the doldrums. As a result, progress in achieving the internationally agreed objectives was slow.
In 2010, a broad citizens’ initiative about new types of energy in the Netherlands (Nederland krijgt nieuwe
energie) was started with the intention of making the Netherlands energy-independent by 2050. The initiative, however, did not lead to renewed government action. In 2011, parliament broadly accepted the Verburg/Samsom motion that called on the government to come to a national energy transition agreement (House of Representatives, 2011-2012). In response, the Minister of Economic Affairs requested in 2012 that the Social and Economic Council (SER) would formulate an advice about the threats and opportunities for the Dutch economy in the light of climate change, rising energy prices and a growing global demand for fossil fuels (SER, 2012). The SER advised the newly installed Rutte/Asscher
This section discusses the use of the environmental accounts in preparing and monitoring the Dutch Energy Agreement. Environmental accounts and energy statistics have been playing a role in Dutch energy and climate policies for many years now, and since the 1970, step by step, more and more energy-related accounts and statistics have been compiled. This section focuses on the process that led to the Energy Agreement of 2013, and that of the subsequent monitoring and adaptation of the agreement. This analysis is based on a review of the existing literature and interviews with key players in the process (see Appendix 1).
21
3 Energy Agreement |
THREE THREE
Cabinet to come to a broadly accepted energy agreement, jointly with employers’ organisations, trade unions and environmental NGOs. In the meantime, in their Coalition Agreement, the new government agreed on aiming for 100% use of renewable energy by 2050.Against this background, at the end of 2012, the SER started the process that resulted in the national Energy Agreement. In eight months’ time, representatives from the
government, employers’ associations, trade unions and environmental organisations had intensive negotiations at four so-called policy tables – industry, built environment, transport and mobility, and renewable energy – about targets and instruments for a new Energy Agreement. In September 2013, the participating organisations agreed on the following objectives (SER, 2013):
a. An average final energy efficiency improvement of 1.5% per year, and a reduction in final energy use of 100 PJ by 2020;
b. A 14% share of renewable energy in the Netherlands’ total final consumption of energy by 2020, and 16% by 2023 (4.5% in 2013);
c. Creating at least 15,000 additional jobs by 2020, a significant number of which to be created in the first years after the agreement.
For the longer term, it was agreed to strive for a 100% sustainable energy system by 2050. The agreement consists of 10 pillars for which the following targets and measures were agreed on:
1. Energy saving of 1.5% per year, in the built environ-ment, industry, agricultural sector and business; 2. Scaling up renewable energy production to 14% of
total energy production by 2020, and 16% by 2023; 3. Support for decentralised renewable energy
generation by citizens;
4. Centralised energy transportation networks and smart grids that are ready for the future;
5. A well-functioning European emissions trading system; 6. Reduce the capacity of old coal-fired power plants
(close five coal-fired power plants);
7. Reduce CO2 emissions in the transport sector by 17%
by 2030, and by up to 60% by 2050, compared to 1990 levels;
8. Create at least 15,000 additional jobs, over the 2014– 2020 period, in construction, installation and sustainable energy;
9. A fourfold increase in the value added of the CleanTech sector by 2020, leading to a Top-10 country position by 2030 in the global CleanTech ranking for energy innovation and export;
10. Create new financing mechanisms to assure the necessary investments.
The parties in the Energy Agreement agreed to evaluate the functioning of the agreement every three years. Moreover, the ministries involved and the Anchoring Committee of the Energy Agreement requested key environmental and energy research institutes of the Netherlands (PBL, ECN, Statistics Netherlands and RVO. nl) to publish an annual National Energy Outlook to monitor progress of the agreement.
Parliament broadly accepted the results from the negotiations, even though some political parties were unhappy with their limited role during the process or missed particular elements in the agreement. One political party rejected the agreement because of its different view on climate change and of the actions needed. The Energy Agreement deliberately focused on sustainable growth. Its focus was on energy saving and renewable energy, rather than on a reduction in
greenhouse gas emissions. These were seen as important policy themes to bring the various organisations to the negotiating table. Moreover, they were seen as major pathways that, ultimately, would also lead to reductions in greenhouse gas emissions. Only for mobility, a direct greenhouse gas reduction target was set. For other themes relating to sustainable growth, such as productivity differences between economic sectors and questions related to decoupling economic growth from energy use, the agreement did not set explicit targets or sub-targets. The parties involved participated for several reasons. The negotiations led to a compromise, with positive and negative aspects for each participant. Yet, the results provided a policy focus and provided certainty for long-term investments. Participants agreed on a stepwise approach, with objectives for 2020, 2030 and 2050, a workable set of short-term policy instruments, and regular evaluations and adjustments.
Since 2013, substantial progress has been made, and parties are committed to achieving all objectives as agreed, although whether the deadlines will be met is still uncertain. Since the start of the agreement, the share of renewable energy in Dutch final energy consumption increased from 3.9% in 2010 to 5.8% in 2015, whereas final energy consumption decreased from 2223 PJ in 2010 to 2076 PJ in 2015. The latest projections show that the share of renewable energy is expected to reach 15.8% by 2023, just below the objective of 16%, and that energy saving due to the Energy Agreement will reach 68 PJ by 2020, which is below the objective of 100 PJ (ECN et al., 2016). Note that, for this last figure, not all instruments were included in the analysis.
THREE
statistical and accounting information that, previously, waspublished in other energy reports by Statistics Netherlands.
3.3 The role of environmental data in
policy development
Environmental statistics and accounts in three
phases of the policy process
Both the energy statistics and the environmental accounts played an important role in the process before and during the negotiation process of the Energy Agreement and are nowadays still important for monitoring its progress. Figure 3.1 shows the types of analyses and phases of the policy process in which the environmental accounts play a role.
The energy statistics and environmental accounts have influenced awareness on the position of Dutch energy use and energy policies in Europe, in several ways. First, the reports from Statistics Netherlands, as mentioned in Section 3.2, use the energy statistics and environmental accounts to show changes in energy use, energy saving, greenhouse gas emissions and growth in the Environmental Goods and Services Sector (see e.g. Statistics Netherlands, 2015a). Secondly, these data are used by the energy research institutes, for example, to project future energy use, greenhouse gas emissions, and the effects of government policies. They use these data, for example, in the regular updates of the Environmental Data Compendium (www.clo.nl) and the Dutch bi-annual Assessment of the Human Environment (e.g. PBL, 2016). Finally, these figures are also used by consultancy firms and environmental organisations to show the public and the authorities how the country is progressing in this domain, compared to other countries. Many of these comparisons and forecasts are based on the energy statistics, but some are also based on the national or environmental accounts (see e.g. De Bruyn et al., 2014). An interesting feature of the Energy Agreement is the role of two main energy policy research institutes in the Netherlands, ECN and PBL, in the policy-making and monitoring phases. Already during the negotiation process, these institutes were asked to join the negotiation table. They did not act as participants during the negotiations, but played an advisory role. They provided evidence for the effects of the measures proposed and answered questions during the process. Moreover, they were asked to make an ex-ante evaluation of the agreed measures (ECN and PBL, 2013). The results of this ex-ante evaluation resulted in a number of changes to the final agreement, as objectives could otherwise not be met.
3.2 Environmental accounts for
energy policy
Environmental statistics and environmental accounts have played and are still playing an important role in Dutch energy policies. Statistics on energy production, use and saving have been published by Statistics Netherlands, since the 1970s. Related statistics include greenhouse gas emission data collected in the Pollutant Release and Transfer Register, and climate-change-related monetary data, such as on environmental investments, expenditure and taxes. Detailed energy statistics are published every month, and the national Energy Balance sheet is published annually, together providing data on energy production, supply and use, per energy carrier (e.g. natural gas, oil, coal, biofuels). Data has been available since 1946.
The Dutch environmental accounts include energy accounts that consist of data on energy use and supply, including power generated by both households and businesses (physical supply and use tables). Moreover, the energy accounts relate to various other
environmental accounts modules, such as:
− air emissions accounts, which relate air emissions to production source and household consumption; − physical and monetary asset accounts related to oil and
natural gas reserves;
− the various monetary environmental account modules, such as the environmental tax accounts, environmental protection expenditure accounts, and the environ-mental goods and services sector.
These accounts are all consistent with the national accounts.
Until 2013, Statistics Netherlands annually published a report on the Dutch Environmental Accounts. The various modules of the environmental accounts were also included in the publication ‘Green growth in the Netherlands’, a bi-annual report published from 2011 onwards. As part of the environmental accounts, Statistics Netherlands also published the ‘Economic radar for the sustainable energy sector’, a report that was published annually between 2011 and 2013. The report on ‘renewable energy in the Netherlands’, compiled by the energy statistics department of Statistics Netherlands, has been published annually since 2003. It gives updates on production, use, and prices of renewable energy (e.g. Statistics Netherlands, 2012). Since the Energy Agreement, Statistics Netherlands, PBL, ECN and RVO.nl have been publishing the National Energy Outlook, which monitors progress of the Energy Agreement (see ECN et al., 2014, 2015 and 2016).1 This report also includes most of the
23
3 Energy Agreement |
THREE THREE
Over the past decade, progress on the energy transition produced several newly developed indicators.
Policymakers identified a specific gap in macroeconomic data related to the energy transition. Economic,
technological and geopolitical developments, potentially, could make sustainable energy production one of the fastest growing industries in the Netherlands. In 2011, the Dutch Ministry of Economic Affairs approached Statistics Netherlands to investigate whether it was possible to develop indicators on the economic aspects of renewable energy and energy saving. To calculate the requested figures, Statistics Netherlands used data from the environmental goods and services sector, which are part of the environmental accounts.2 Data on environmental
activities related to renewable energy production, renewable energy systems and energy saving were collected and compiled to provide detailed data on the energy transition. In addition, those data were also disaggregated according to their production profiles (e.g. solar, wind, biomass) and process profiles (e.g. manufacturing, installation, consultancy, research and development). By using various data sources, it was possible to provide data on production value, gross value added, exports, investments and employment. As these data were fully consistent with the national accounts, this enabled all types of comparisons with and analyses of the total Dutch economy. Nowadays, these comparisons are part of the National Energy Outlook, in the chapter on economic developments related to the energy transition. For example, these data are used for monitoring shares of the energy supply activities in the Dutch economy, for several economic indicators (Figure 3.2), development in To monitor progress, the agreement is evaluated every
three years. As mentioned in Section 3.2, a consortium of ECN, PBL, Statistics Netherlands and RVO.nl annually publishes the National Energy Outlook (see ECN et al., 2014, 2015 and 2016 – see e.g. Table 3.1). This outlook evaluates progress of the agreement and on the objectives. In addition to that, the outlook gives substance to the required international reporting on greenhouse gas and air pollutant emissions and projects future developments. On the basis of this report, each year, the Assurance Committee of the Energy Agreement jointly with the Ministry and the participants in the Energy Agreement discuss whether new measures need to be taken to achieve the agreed targets.
Environmental accounts for looking back and ahead
During both the policy-making and monitoring phases, extensive use is made of the energy statistics and environmental accounts for looking back at the progress made in the energy transition to date, and for looking ahead to the expected future effects of policy measures. Both the ex-ante evaluation and the National Energy Outlook are based on time series of energy statistics (e.g. the Energy Balance sheet and Statistics Renewable Energy; Statistics Netherlands, 2015b,c), environmental accounts and national accounts of Statistics Netherlands and data from the Pollutant Release and Transfer Register (PRTR, 2015). The forecasting and ex-ante policy
evaluation of instruments, in addition to statistical data, also require additional information and tools, such as elasticities and economic models. PBL and ECN combine statistics with such additional information and methods.
Figure 3.1
The role of environmental accounting in the policy process leading to the Energy Agreement in the Netherlands
Source: PBL Environmental
accounts
Policy process
Raising awareness and policy preparation
Policy negotiations leading to energy
agreement Energy models for
scenario and instrument analysis
Annual monitoring and evaluation Time-series
analysis of energy and economic indicators
THREE
Figure 3.2 Employment, 2015 Added Value, 2015 Production value, 2015 Investments, 2010 – 2014 Export value, 2014 Import value, 2014 0 5 10 15 20 % of total economy Source: ECN; PBL; CBS; RVO 2016pb
l.n
l
Conventional energy activities Renewable energy activities and energy savings Energy networks Share of energy supply activities in the Dutch economy, per economic indicator, 2015
Figure 3.3 2008 2010 2012 2014 2016 2018 2020 0 2 4 6 8 %
Source: ECN; PBL; CBS; RVO 2016
pb l.n l Conventional energy Energy networks Renewable energy Energy saving
Forecasts based on proposed policies Percentage of GDP
Contribution of energy supply activities to the Dutch economy and to gross employment
2008 2010 2012 2014 2016 2018 2020 0 50 100 150 200
thousand labour years
pb
l.n
l
Gross employment
the contribution of energy supply activities to the Dutch economy and development in energy-related employment (Figure 3.3) (see also ECN et al., 2016). Some of the underlying data of the indicators from the environmental accounts are very detailed, such as those on the
production and maintenance of boilers (Statistics Netherlands, 2015d).
For looking forwards and evaluating the expected future effects of policy measures, it is not sufficient to only rely on the energy statistics and environmental and national
accounts as such. For this, coupled energy – economy models are needed that are calibrated on the basis of these data. For several years already, ECN has been developing and maintaining a small number of large-scale simulation and optimisation models to model the effects of policy interventions on future energy use and production. These models were found to be particularly useful in assessing the plans described in the Energy Agreement. This modelling framework has been used in the National Energy Outlook in a quantitative assessment of about 70 policy measures.