Attainability of PM
2.5
air quality
standards, situation for the
Netherlands in a European
context
In 2008, the European Directive on air quality established air quality standards
for fine particulate matter (PM
2.5). Presently, the Netherlands is in the process
of adapting its policy, monitoring methods and models to comply with
the requirements for PM
2.5. To support this process, this report provides an
assessment of the attainability of the various air quality standards for PM
2.5.
It is likely that all limit and target values for PM
2.5will be met in time under
current and proposed national and European policies, assuming average
meteorological conditions. Therefore, the PM
2.5standards appear not
to be more stringent than the current PM
10limit values. This situation
might change when the EU air quality directive will be revised in 2013.
Uncertainties in this assessment are large. Therefore, it cannot be ruled out
that a very limited number of exceedances of the 25 µg/m
3target value may
occur along busy streets, by 2010. Meteorological fluctuations may cause
additional exceedances, possibly also of the 25 µg/m
3limit value, by 2015.
The exposure reduction target (ERT) is a target to reduce the average national
PM
2.5concentration at urban background locations, between 2010 and
2020. The ERT value for the Netherlands has not yet been set; 15% being the
most probable. On a theoretical basis, it appears that an ERT of 15% can be
measured with enough significance given the studied PM
2.5monitoring set up.
This study is a BOP publication produced under the auspices of PBL.
The Netherlands Research Program on Particulate Matter (BOP) is a national
program on PM
10and PM
2.5. It is a framework of cooperation involving
the Energy research Centre of the Netherlands (ECN), the Netherlands
Environmental Assessment Agency (PBL), the Environment and Safety Division
of the National Institute for Public Health and the Environment (RIVM) and
TNO Built Environment and Geosciences.
BOP report
Attainability of PM2.5 air quality
standards, situation for the Netherlands
in a European context
J. Matthijsen, PBL; B.A Jimmink, PBL; F.A.A.M de Leeuw, PBL;
W. Smeets, PBL
Attainability of PM2.5 air quality standards, situation for the Netherlands in a
European context
This is a publication of the Netherlands Research Program on Particulate Matter Report 500099015
J. Matthijsen, B. Jimmink, F. de Leeuw, W. Smeets
W. Smeets present affiliation is Utrecht Municipality, Department of Environment and Sustainability
Contact: karin.vandoremalen@pbl.nl ISSN: 1875-2322 (print) ISSN: 1875-2314 (on line) This is a publication in the series: BOP reports Project assistant: Karin van Doremalen
English editing: Charles Frink, Annemieke Righart Figure editing: PBL editing and production team Layout and design: RIVM editing and production team Cover design: Ed Buijsman (photographer: Sandsun) ECN Energy research Centre of the Netherlands PBL Netherlands Environmental Assessment Agency TNO Built Environment and Geosciences
RIVM National Institute for Public Health and the Environment
This study has been conducted under the auspices of the Netherlands Research Program on Particulate Matter (BOP), a national program on PM10 and PM2.5 funded by the Dutch Ministry
of Housing, Spatial Planning and the Environment (VROM).
Parts of this publication may be reproduced provided that reference is made to the source. A comprehensive reference to the report reads as ‘Matthijsen, J., Jimmink, B., De Leeuw, F., Smeets, W. (2009) Attainability of PM2.5 air quality standards, situation for the Netherlands in a
European context’:
The complete publication, can be downloaded from the website www.pbl.nl, or a copy may be requested from reports@pbl.nl, citing the PBL publication number.
Netherlands Environmental Assessment Agency, (PBL) PO BOX 303, 3720 AH Bilthoven, The Netherlands; Tel: +31-30-274 274 5;
Fax: +31-30-274 4479; www.pbl.nl/en
Rapport in het kort 5
In 2008 stelde de Europese richtlijn voor luchtkwaliteit normen vast voor de fijnere fractie van fijn stof (PM2,5).
Nederland is bezig het beleid, de monitoringsmethoden en modellen op het gebied van fijn stof aan te passen om aan de eisen voor PM2,5 te voldoen. Dit rapport ondersteunt dat
proces met een onderzoek naar de haalbaarheid van de verschillende normen voor PM2,5.
Het is waarschijnlijk dat met het huidige en voorgenomen nationale en Europese beleid alle grens- en richtwaarden voor PM2,5 op tijd kunnen worden gehaald, bij gemiddelde
weersomstandigheden. De PM2,5 normen lijken daarmee
niet strenger dan de bestaande grenswaarden voor PM10.
Deze situatie kan veranderen als in 2013 de Europese richtlijn voor luchtkwaliteit wordt herzien. De onzekerheden in deze beoordeling zijn echter groot. Daarom kan een zeer beperkt aantal overschrijdingen van de 25 µg/m3 richtwaarde
langs drukke straten in 2010 niet worden uitgesloten. Ongunstige weersomstandigheden kunnen leiden tot meer overschrijdingen, mogelijk ook van de 25 µg/m3 grenswaarde,
in 2015. De blootstellings-reductie-doelstelling (BRD) is een richtwaarde voor de nationaal gemiddelde PM2,5-concentratie
op stadsachtergrondlocaties tussen 2010 en 2020. De waarde van de BRD in Nederland staat nog niet vast; 15% is het meest waarschijnlijk op basis van de huidige inzichten. Op theoretische grondslag lijkt een BRD van 15% met voldoende significantie gemeten te kunnen worden, gegeven de onderzochte PM2,5 monitoringset-up.
Contents 7
Contents
Rapport in het kort 5
Summary 9 1 Introduction 11 2 Current levels of PM2.5 15
2.1 Levels in the Netherlands 15 2.2 Levels in Europe 18
3 Current emission scenarios 23
3.1 Emission scenarios 23
4 Approach 27
4.1 Approach per PM2.5 standard 27
4.2 Models 27 4.3 Uncertainties 28
5 Distance to PM2.5 targets 31
5.1 Assessment for the Netherlands 31 5.2 Assessment for other EU countries 34
6 Additional measures and the ERT 37
6.1 Additional national measures 37 6.2 Additional local measures 37 6.3 Additional measures, Europe wide 38 6.4 Effect of additional measures 38
7 Conclusions 41
Annex A National PM2.5 emissions per sector 42
Annex B Spatial distribution of PM2.5 reduction 44
Glossary 45 References 46 Acknowledgements 49
Summary 9
In 2008, the new European Directive on air quality went into force (EU, 2008b). The new directive combined four existing EU directives, and established air quality standards for fine particulate matter (PM2.5). Presently, the Netherlands is in
the process of adapting its policy, monitoring methods and models to comply with the requirements for PM2.5. To support
this process, and to assess the attainability of the various air quality standards for PM2.5, this report provides an update of
the relevant parts of the earlier assessment that addressed the attainability of proposed PM2.5 air quality standards
(Matthijsen and Ten Brink, 2007).
It is likely that all limit and target values for PM2.5 will be met
in time under current and proposed national and European policies, assuming average meteorological conditions. The PM2.5 standards appear not to be more stringent than the
current PM10 limit values. This situation might change when
the EU air quality directive will be revised in 2013. Uncertainties in this assessment are large, and our model estimates are believed to have underestimated, rather than overestimated the effect of anthropogenic emission reductions on future PM2.5 concentrations. However, it cannot be ruled out that a
very limited number of exceedances of the 25 µg/m3 target
value may occur along busy streets and motorways in 2010. Even when taking the margin of tolerance for 2010 into account, the resulting value of 29.2 µg/m3 may be exceeded
at a very limited number of traffic locations. Meteorological fluctuations may cause additional exceedances, possibly also of the 25 µg/m3 limit value, in 2015. With current national and
European policies, the exposure concentration obligation – a limit value for the national average PM2.5 concentration at
urban background locations – will very likely be met by 2015. The exposure reduction target (ERT) is a target to reduce the national average PM2.5 concentration at urban background
locations between 2010 and 2020. There is still uncertainty about the level of the exposure reduction target that will apply to the Netherlands, since this level depends on current and future measured PM2.5 concentrations (2009, 2010 and
2011).
Depending on whether or not these measurements exceed, on average, the level of 18 µg/m3, the ERT will be either 15% or
20%. An ERT of 15% seems most probable for the Netherlands, given the present PM2.5 urban background concentrations and
the current understanding of the concentration changes in the near future. There is question on whether an ERT of 15%
can be measured with enough significance since the directive allows a larger uncertainty, up to 25%, in the annual mean PM2.5 concentration. For the Netherlands, an ERT of 15% or
higher appears to be measurable. It is theoretically possible to measure a statistically significant exposure reduction of 12%, given the current PM2.5 measurement network in the
Netherlands, the average annual PM2.5 concentrations with
a measurement uncertainty of 20% and a standard deviation of 18% (due to year-to-year meteorological fluctuations). The effect of possible technical changes in the PM2.5 network
between 2010 and 2020 has not been taken into account. Such changes can cause uncertainties which make an ERT of 15% no longer measurable.
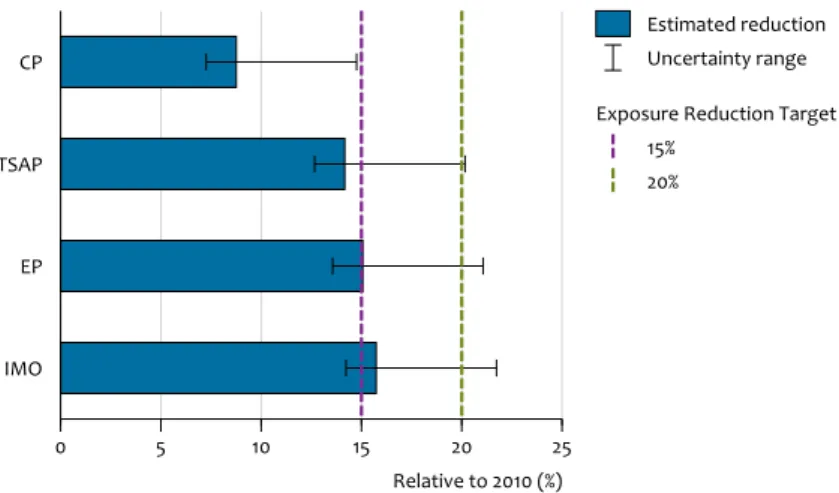
Current model estimates for PM2.5 in 2010 and 2020 show that
an ERT of 15% may be attainable with current and proposed national and European policies, but 20% is not. To attain a 20% reduction with the current model, many more policy measures, such as high-efficiency dedusters in the process industry and in refineries, that go beyond present European ambitions need to be taken on both the national and European scale. By themselves, additional national measures will not be sufficient to meet a 20% exposure reduction target. A 20% reduction, however, falls within the relatively large margin of uncertainty.
Meeting the Stage 2 indicative limit value of 20 µg/m3 by 2020
appears to be possible in the Netherlands under current and proposed national and European policies. The indicative limit value will be reviewed by the Commission in 2013.
This assessment was based on model results for 2006, 2010, 2015 and 2020 and available PM2.5 measurements, which
were obtained with automated monitoring equipment and with instruments operated according to the EU reference method. Emission scenarios for the Netherlands include the current and proposed national emission policies according to Velders et al. (2009). Emission projections for other European countries were taken from Amann et al. (2008).
Our analysis was limited by large uncertainties in the models and measurements. On the one hand, our model estimates are believed to have underestimated, rather than overestimated, the effect of anthropogenic emission reductions on future PM2.5 concentrations. This means
that larger relative reductions, resulting from current and proposed national and European policies, even up to
20%, are within the margin of uncertainty. Furthermore, concentrations at hot-spot traffic locations may have been somewhat overestimated for 2010, partly due to the effect of the current economic recession, which was not included in our analysis. On the other hand, PM2.5 concentration levels
and the trend are not well understood in terms of sources and dispersion; consequently more pessimistic developments can not be excluded as yet. In addition, the basic assumption in our analysis, that all Member States will comply fully with their future national emission ceilings for 2020, may prove to be optimistic.
Introduction 11
The new Commission Directive 2008/50/EC on ambient air quality and cleaner air for Europe came into force on 11 June 2008 (EU, 2008b). The directive combined four existing EU air quality directives (the Framework Directive and the 1st, 2nd and 3rd Daughter Directives); among other things,
it also established new air quality standards for fine particulate matter (PM2.5 – see Table 1). An average annual
PM2.5 concentration of 25 μg/m3 has been set as the target
value for 2010 and as the limit value to be met by 2015. The new directive also introduced additional PM2.5 objectives,
which aim to reduce human exposure to PM2.5. Standards
are set at the national level and are based on the average exposure index (AEI). The AEI is a three-year average PM2.5
concentration level, measured at urban background locations across each Member State.
For this report we investigated the attainability of the PM2.5 limit and target values for the Netherlands. The main
questions were:
Can the air quality standards set for PM2.5 be met with
technical emission control measures under current and proposed national and European policies?
What is the impact of different European emission reduction scenarios (Amann et al., 2008) on the attainability of the PM2.5 standards?
What is the effect of additional national and European policy measures on the attainability of the PM2.5 standards?
These questions were addressed for the situation in the Netherlands, while taking account of the situation in other European countries and the uncertainties.
To address these questions, knowledge on concentration levels in the 2010-2020 timeframe was needed, as well as on the effects of various abatement policies. This knowledge was derived from both models and measurements. Estimates of future PM2.5 concentrations were made using measured,
current levels, together with model calculations, to assess future concentration changes, taking into account the effects of different abatement policies.
This report can be seen as an update and extension – with the focus on attainability – of an initial assessment by Matthijsen and Ten Brink (2007) (hereafter called MtB2007). Updated information with regard to other PM2.5 topics, such as source
apportionment and the contribution of different components to the PM2.5 mass, have been addressed in other reports
which resulted from the BOP research program (BOP, 2007). The main conclusions on attainability of the PM2.5 standards in
MtB2007 are presented in the text box below.
An update of the MtB2007 assessment was necessary for the following four reasons:
Introduction
1
Limit values and target values for PM2.5 for EU Member States according to the air quality directive (EU, 2008b) Limit values
25 μg/m3 2015 for the average annual concentration; applies everywhere*
20 μg/m3 2015 for the AEI**. In the EU directive, this value is referred to as exposure concentration obligation (ECO). The ECO has the same juridical status as a limit value, so it is referred to as a limit value in this report.
20 μg/m3 2020 for the average annual concentration; applies everywhere*. This is a so-called Stage-2 indicative limit value, to be reviewed by the Commission in 2013. Target values
25 μg/m3 2010 for the average annual concentration; applies everywhere
0 - 20% exposure reduction target (ERT) for 2020, relative to 2010 of the AEI**
* While these limit values apply throughout the country, compliance shall not be assessed at the following locations: any loca-tions situated within areas where members of the public have no access and there is no fixed habitation; on factory premises or at industrial installations; on the carriageway of roads and on their central reservations of roads except where there is normally pedestrian access to the central reservation.
** The indicator for the average urban background concentration is the average exposure index (AEI). The AEI is the three-year
average of measured average annual PM2.5 concentrations at urban background locations. The national exposure reduction
target value depends on the initial concentrations; the ERT value ranges from 0% (when the initial AEI is below 8.5 μg/m3) to
more than 20% when the initial AEI exceeds 22 μg/m3. In the Netherlands, present estimates of PM
2.5 concentrations indicate that
urban background levels are around 18 μg/m3. Therefore, the Netherlands faces two possible exposure reduction target values:
15% when the AEI for 2010 falls in the range of 13 to 18 μg/m3 and 20% between 18 to 22 μg/m3.
1. The final set of PM2.5 standards established by the new air
quality directive differs from the set of standards on which MtB2007 was based.
– The directive introduced the exposure concentration
obligation, a limit value of 20 μg/m3 for the AEI, to be met
by 2015.
– Altered margins were set for the AEI for 2010. These
AEI margins determine the national exposure reduction target.
– The limit value for the average annual concentrations to
be met by 2015 was set at 25 μg/m3. At the same time,
25 μg/m3 was set as a target value for 2010. Until 2015,
exceedances are allowed within the margin of tolerance. Note that, in 2007, a more stringent limit value of 20 μg/m3 was negotiated.
– A Stage 2 indicative limit value of 20 µg/m3 has been
introduced in the final directive, applying to average annual concentrations for 2020. This indicative limit value is to be reviewed by the Commission in 2013 in the
light of further information on health and environmental effects, technical feasibility, and experience with the target value in Member States.
2. More measurement results on PM2.5 and PM10
concentrations have become available, both within the Netherlands and in other Member States. These measurements formed the starting points for the new assessment.
3. In December 2008, an agreement was reached at EU level on the climate and energy package proposed by the Commission in December 2007. MtB2007 stressed that planned national and European legislation to mitigate climate change should also be integrated in updated assessments, because they can affect particulate-matter levels.
4. Several air quality policy developments were taken into account in the present analysis, including the agreement of the International Maritime Organization (IMO) (October 2008) on cleaner fuels and engine requirements for sea
This study was conducted under the auspices of the Netherlands Research Program on Particulate Matter (BOP), a national program on PM10 and PM2.5, funded by the Netherlands Ministry
of Housing, Spatial Planning and the Environment (VROM). The programme is a framework of cooperation involving four Dutch institutes: the Energy research Centre of the Netherlands (ECN), the Netherlands Environmental Assessment Agency (PBL), the Environment and Safety Division of the National Institute for Public Health and the Environment (RIVM), and TNO Built Environment and Geosciences.
The goal of BOP is to reduce uncertainties about particulate matter (PM) and reduce the number of policy dilemmas, which complicate the development and implementation of adequate policy measures. Uncertainties about the health aspects of PM are not explicitly addressed.
The approach for attaining these objectives involves the integration of mass and composition measurements of PM10 and
PM2.5, emission studies and model development. In addition,
dedicated measurement campaigns were conducted to research specific PM topics.
The results from the BOP research programme are being published in a special series of reports. The topics in this series, in general terms, are the following: sea salt, mineral dust, secondary inorganic aerosol, elemental and organic carbon (EC and OC), and mass closure and source apportionment. Some BOP reports concern specific PM topics: urban background concentrations, PM trend, shipping emissions, EC and OC emissions from traffic, and attainability of PM2.5 standards
(this report). Technical details of the research programme will be condensed in two background documents; one on measurements and one on model developments. In addition, all results will be combined in a special summary for policymakers.
Netherlands Research Program on Particulate Matter (BOP)
For the Netherlands, the available data on current and future levels of PM2.5 suggested that the limit value of 25 µg/m3 can
probably be attained by 2015, apart from in a very limited number of hot spots. The strictest limit value for PM10 concerns
24-hour concentrations, which are not to exceed 50 µg/m3 more
than 35 times per calendar year. This limit value appears to be more stringent than the PM2.5 limit value of 25 µg/m3.
Target value: a reduction of 15% of the AEI (exposure in urban areas) between 2010 and 2020 will probably not be reached under current legislation. A reduction of 20% will almost certainly not be reached under current legislation, even with proposed additional measures. In case a 20% reduction is
required, additional national and local measures, and possibly European measures, may be necessary.
In other EU Member States
In other densely populated and industrialised regions in Europe, attainability problems regarding the PM2.5 limit value of
25 µg/m3 appear to be similar to those in the Netherlands.
However, it is unclear whether the relevant Member States will face similar problems meeting an exposure reduction target of 20%, because the level of implementation of technical and non-technical reduction measures differs throughout Europe, and measurements of PM2.5 are scarce.
Introduction 13
shipping, the Euro-VI standards for heavy-duty vehicles and several national air quality measures. As model input, updates of the national emission scenarios were applied for the Netherlands (Velders et al., 2009), and for other European countries the emission scenarios reported in Amann et al. (2008) were used.
The PM2.5 results in this report are rather uncertain (at least
±20% 2 sigma: 95% confidence limits). These uncertainties stem from uncertainties about measurements, models and emissions. Furthermore, scenario studies were based on several assumptions that largely determined the results. For instance, we used an add-on concentration, fixed in time, to describe the contribution to PM2.5 from natural
sources and sources that are not explicitly included in the model. In addition, all emission scenarios analysed in this report assume that EU Member States will comply with their national emission ceilings set for 2010. The current economic downturn will probably help to make this assumption more realistic. However, whether the newly drafted national emission ceilings for 2020 will be complied with in time, by all EU Member States, remains uncertain.
The following is a general outline of the report: Chapter 2, Current PM2.5 levels, presents a summary of
available information on current PM2.5 concentration levels
in the Netherlands and Europe. The current levels were the starting point for the attainability analysis in this report. The uncertainties in PM2.5 measurements have been put into the
context of the requirements brought about by the PM2.5
standards.
Chapter 3, Current and proposed policies, provides a description of the different national and European emissions and emission scenarios that were used as input for the model experiments, in addition to current legislation and the NEC-6 scenarios. In order to investigate further options, composite scenarios and the Maximum Reduction Range scenario have been described.
Chapter 4, Approach, presents an elaboration on the methodology that was followed to assess the attainability of the new PM2.5 standards. The conclusions on the attainability
have been put into the context of the uncertainties in PM2.5
model results.
Chapter 5, Distance to PM2.5 targets, presents the results from
the assessment for the Netherlands and compares them to the situation in other Member States.
Chapter 6, Additional measures, provides a shortlist of national and international policy actions for reducing PM-related emissions and their effect on PM2.5 concentration levels.
Chapter 7, Conclusions, gives a summary of the overall results, and comments on shortcomings caused by uncertainties.
15
In order to report on the attainability of the PM2.5 standards,
current levels of PM2.5 had to be ascertained, and could
then be used as a starting point. The ranges for PM2.5 in the
Netherlands and abroad, as reported in MtB2007, have been updated here with recent information.
Throughout Europe, the knowledge on current PM2.5
concentration levels is still rather limited. Many Member States have only recently started to include PM2.5
measurements in their national air quality monitoring networks. Routine measurements of PM2.5 using
automated samplers are thought to be more uncertain than measurements of PM10 because the semi-volatile PM
fraction, which is a main source of measurement uncertainty, resides predominantly in the fine fraction. Consequently, the climatology of PM2.5 in the Netherlands is not yet well
understood. In this section we report on the current PM2.5
levels in the Netherlands and the rest of Europe.
2.1 Levels in the Netherlands
In 2004, monitoring of PM2.5 started in the Dutch National
Air Quality Monitoring Network (LML, 2008). In addition to this national monitoring network, PM2.5 is also monitored in
the Netherlands by the local networks in Amsterdam and in the Rotterdam area. Since 2002, these local networks have reported average annual PM2.5 concentrations (GGD
Amsterdam, 2008; DCMR, 2008). Measurements provided by the networks for the 2002-2005 period concerned mostly raw data, in the sense that no equivalence factor was established or applied. Such an equivalence factor can be used to translate raw data into values which would be obtained with the reference method. Raw PM2.5 data (without application of
an equivalence factor) has limited value for determining the PM2.5 levels.
In 2006, PM2.5 measurements with the EU reference method
were started in the Netherlands. Since 2007, some of these measurements have been obtained as a result of the BOP program. The reference method for sampling and measuring PM2.5 is described in EN 14907:2005 ‘Standard gravimetric
measurement method for the determination of the PM2.5
mass fraction of suspended particulate matter’. Figure 2.1 shows a range of PM2.5 measurements for the Netherlands, as
obtained with the reference method in 2006, 2007 and 2008.
The data shown in Figure 2.1 have been subdivided according to rural, urban and traffic locations. The number of measurement stations per year is shown below the figure. The concentration ranges for 2006 and 2007 should be interpreted cautiously; the representativeness of the ranges is small due to the limited number of measurements and monitoring locations. Furthermore, the absolute value probably contains a bias of up to several µg/m3 due to water
adsorption (see Measurement uncertainty in this chapter). The PM2.5 concentration ranges for 2008 (Hoogerbrugge,
in preparation) are more reliable due to the following modifications in the procedure:
1. A bias due to water adsorption on the quartz filter was minimised due to a more stringent measurement protocol in the Netherlands for the reference method (NTA 8019). 2. The number of rural and urban stations was large enough
to establish a representative range.
3. Data coverage over the year was optimised by using multiple imputation technique, a method for correcting the average annual concentration for missing data. This technique has not yet been applied to the PM2.5
measurement series for 2006 and 2007.
Levels at rural locations
PM2.5 concentrations at the rural sites in 2008 ranged
between 13 and 18 µg/m3. This range was 12 to 16 µg/m3 in
MtB2007. Generally speaking, the PM2.5 levels measured at the
nine rural locations were similar to levels at urban background locations. A relatively small increment from rural to urban background locations was in accordance with a recent study on urban background concentrations in the Netherlands (Voogt et al., 2009).
Levels at urban background locations
Concentrations at urban agglomerations were especially interesting because they served as input for deriving the average exposure index. The range found for average annual PM2.5 concentrations in 2008 was 15 to 21 µg/m3. A
similar range of 17 to 22 µg/m3 was inferred from routine
PM10 measurements at urban background locations and
extrapolated PM2.5 to PM10 ratios. Compared to the indicative
urban background levels (16 to 19 µg/m3) given by MtB2007,
the ranges reported here were higher at the top and lower at the bottom. These data suggest that the concentration increment in urban background areas with respect to rural background concentrations (the urban increment) was relatively small; less than 2 µg/m3.
Current levels of PM
2.5
2
Levels at urban traffic locations
PM2.5 concentrations measured in 2008 at traffic locations
in the Netherlands ranged between 17 and 19 µg/m3. These
location levels appeared to be relatively low compared to rural and urban background levels, and were at the lower end of the range of the levels reported for traffic locations in other populated regions in Europe. PM2.5 concentrations which have
been inferred from routine PM10 measurements at traffic
locations and observed PM2.5 to PM10 ratios of 0.59 (see Table
2.1) point towards higher PM2.5 levels, up to 23 µg/m3, at these
locations. Therefore PM2.5 concentrations along motorways
and streets may even exceed 25 µg/m3, but the number of
locations where this may occur is probably limited.
Average Exposure Index
The average exposure index (AEI) is a measure for PM2.5
introduced in the EU air quality directive. The AEI is the indicator for the average urban background concentration of particulate matter. The rationale for the introduction of such an indicator was that epidemiological research cannot identify a no-effect level for particulate matter. This means that health effects may be expected at all PM levels. Consequently, from a health point of view, it makes sense to reduce particulate matter levels on large spatial and temporal scale. The AEI is a good indicator for this purpose. In the Netherlands, twelve locations have been selected to measure urban background PM2.5 concentrations (see Figure 2.2) for the purpose
of determining the AEI. The AEI is used for determining whether the exposure concentration obligation (ECO) and the exposure reduction target (ERT) have been met. The ECO and ERT standards both concern three-year average
urban background concentrations and do not have to be met everywhere, in contrast to the other PM2.5 standards.
The exposure reduction target has 2010 as the reference year. The Netherlands has opted for the average concentration levels of 2009, 2010 and 2011 as the starting point, instead of those of 2008, 2009 and 2010, or 2009 and 2010.
The set of PM2.5 measurements that we obtained with the
reference method was too small to calculate an ‘official’ average exposure index.
Monitoring PM2.5 according to the directive guidelines
At present, the Dutch national Air Quality Monitoring Network (LML), operated by the RIVM, includes PM2.5
measurements at urban background locations obtained with the reference method, starting in 2008. This takes place in cooperation with the local networks of Amsterdam and Rotterdam. To calculate the average exposure index (AEI), PM2.5 measurements were used from twelve urban
background locations (see Figure 2.2). Eight of these twelve locations are required by the guidelines in the new air quality directive for the specific situation in the Netherlands, and four additional urban background locations were chosen to increase the spatial coverage.
The final number of traffic and rural PM2.5 measurement
locations is yet to be decided upon. In the future PM2.5 will
also be measured with automated monitoring instruments besides with reference instruments. The automated measurements will be carried out with Beta-Attenuation monitoring instruments in the national network, as well as in
Concentration ranges for average annual PM2.5 (µg/m3) in 2006, 2007 and 2008, based on measurements in the
Netherlands taken with the reference method by the RIVM, the Public Health Service Amsterdam and the Rotter-dam Environmental Protection Agency.
Figure 2.1
Rural Urban Traffic
0 10 20 30 µg/m 3 Range 2006 2007 2008
Average annual concentration
PM2.5 measurements Mean 2015 limit value Number of stations 2006 2007 2008 Rural -9 Urban 3 4 10 Traffic 1 2 6
17
several regional measurement networks. For this instrument, equivalence has been found with the reference method (van Arkel et al., 2008).
Measurement uncertainty
The conclusions drawn from the current PM2.5 levels in this
chapter were based on measurements obtained with the reference method using quartz filter material. Although these measurement results were uncertain (typically 20%,
2 sigma), this uncertainty was generally smaller than that in measurement results from automated PM samplers which dry the air before sampling. Reference measurements that were performed according to the guidelines still allowed considerable variation, as in choice of filter material. The use of different types of filters per Member State complicates the comparability of levels between Member States and air quality networks. Quartz-fibre filters adsorb water vapour during collection of particulate matter, and part of this water is retained during drying. This adsorbed water vapour was then erroneously counted as water associated with PM (e.g. Maggs et al., 2009; Brown et al., 2006). Adsorption of volatile organic carbon on quartz filters can introduce a bias in a similar way and of similar magnitude (e.g. Ten Brink et al., 2009). In 2007, the managers of air quality networks in Netherlands agreed on a measurement protocol that defines the reference method in greater detail (NTA 8019). Since 2008, the various networks have been using the same quartz filters and the same protocol for the preparation of quartz filters, for reference measurements. The protocol for quartz filter preparation aims to improve quality assurance and minimisation of a possible bias due to adsorbed water
vapour. A similar bias due to adsorbed volatile OC is not specifically addressed in the measurement protocol. Only some of the measurements reported here were conducted under the more stringent national EN guidelines (12341, 12907), so some series may have contained a substantial bias due to water and OC adsorption (2006, 2007 in Figure 2.1). A bias due to water adsorption in the ranges for 2008 (Figure 2.1) was believed to be negligible.
Uncertainty requirements in relation to the exposure reduction target
European regulations allow a maximum uncertainty of 25% (2 sigma) in the measured data, but the national exposure reduction target for the Netherlands will be 15% or 20%. Since the allowed uncertainty in the measurements is larger than the exposure reduction target it appears that a reduction of this magnitude will not be easily measurable.
We estimated that for the measurement set-up in the Netherlands, an AEI reduction of about 12% or more could be determined as statistically significant (α=0.05, tested one-sidedly). For details, see the text box below. In principle, therefore, an AEI reduction of 15 or 20% could be determined as statistically significant. There are, however, other technical issues which may complicate the accountability of the AEI-related PM2.5 standards, such as the question of whether the
urban background location was representative of the urban background concentrations.
Urban background locations in the Netherlands which have been selected for PM2.5 measurements used to derive
the average exposure index (AEI).
Figure 2.2 Breda Zaandam Utrecht Heerlen Schiedam Enschede Nijmegen Den Haag Amsterdam Veldhoven Groningen Rotterdam
Urban background stations for average exposure index, AEI
Urban background station Urbanised area
2.2 Levels in Europe
Most EU Member States have started measuring PM2.5 to
comply with the requirements in the 1st Daughter Directive
on Ambient Air Quality (EU, 1999). In this context, data have been reported to the European Environment Agency (EEA),
which has placed the data in the public database AirBase (AirBase, 2009; Mol et al., 2009).
For 2007, the number of PM2.5 measurement series reported
to AirBase was about seven times smaller than those available for PM10 (see the maps for PM2.5 and PM10 in Figures 2.3 and
Average annual PM2.5 concentrations in 2005, 2006 and 2007 from AirBase stations (rural, urban and traffic) with
data coverage of more than 75%. Source: AirBase. Average annual PM2.5 concentrations
Concentration (µg/m3 ) 0 - 15 15 - 20 20 - 25 25 - 30 > 30 2006 2007 2005 Figure 2.3
19
2.4). About two thirds of the countries that report data on PM10 concentrations also do so for PM2.5. Consequently,
although the basis for an assessment of PM2.5 levels, Europe
wide, is still rather small, the AirBase data showed that in several countries the current concentrations were higher than
the 2015 limit value of 25 µg/m3, with some even higher than
30 µg/m3 (see Figures 2.3 and 2.5).
Exceedances of the 25 μg/m3 and 30 µg/m3 levels occurred
specifically in highly industrialised regions in central Europe and at urban sites in southern Europe. It is obvious that there
Current levels of PM2.5
PM10 in 2005, 2006 and 2007, from AirBase measurements (rural, urban and traffic locations) with data coverage of
more than 75%. Number of days with concentrations above the 50 μg/m3 limit value. Source: AirBase.
PM10 exceedance days
Number of days with concentration > 50 µg/m3 0 - 7 8 - 35 36 - 50 > 50 2005 2006 2007 Figure 2.4
were even more sites at which the indicative limit value for 2020 of 20 μg/m3 was exceeded. In Germany, for instance, the
current levels at the higher end were about 25 μg/m3. Low
levels were typically found in the less populated countries of northern Europe. Data from the Netherlands were not yet available in AirBase, but are presented above (Figure 2.1). The value of this PM2.5 data is rather uncertain, because
most of these were not obtained according to the official measuring guideline, but from automated monitors; in general, these monitors systematically underestimate the levels. In 2006, about 70% of the PM2.5 measurements
officially reported were obtained with automated monitoring instruments for which equivalence had to be proven with the reference method (for example, see Vixseboxse and De Leeuw, 2008). For PM2.5, it is uncertain to what extent these
data had been corrected to establish equivalence. The PM10
and PM2.5 data available from AirBase were used without any
further processing. We assumed that, where needed, the PM data had been corrected for a non-reference method in accordance with the EU directive’s requirements (Exchange of Information, EoI; EC, 1997).
Because the EoI requires the countries to submit validated data, information on PM10 methods and correction factors
was given by Buijsman and De Leeuw (2004) and De Leeuw (2005), but this information was not up to date. Information on the applied PM2.5 correction factors was
not available. Some information, although still incomplete, on PM correction factors was available from the reporting questionnaire under the Air Quality Framework Directive (see Vixseboxse and De Leeuw, 2008).
The ratio of PM2.5 to PM10 concentrations
The ratio of PM2.5 to PM10 is important, because of the
stringent legislation on the two parameters. The ratio also could be used to infer PM2.5 levels from PM10 concentrations,
which were more abundant (see Section 5.2).
Average PM2.5 to PM10 ratios (Table 2.1) were derived from
AirBase co-located PM2.5 and PM10 measurements, extracted
for the 2004-2006 period (see De Leeuw and Horalek, 2009). The ratios were in the range of 0.4 to 0.8. In northern and central eastern Europe there was a clear tendency towards lower ratios in the declining order of rural to urban to traffic. This indicated an increasing contribution of locally emitted coarse particles at urban and traffic sites. In north-western
The following describes a test to determine whether a significant reduction in the average exposure index (AEI) could be measured (α=0.05).
In the Netherlands the AEI is monitored at twelve urban background stations with instruments that measure PM2.5
according to the reference method (EN-14907:2005). The uncertainty in the average annual PM2.5 concentration
was estimated to be about 10% (1 sigma). Meteorological fluctuations are another source of uncertainty. Velders and Matthijsen (2009) found that average annual PM10
concentrations have a standard deviation (SD1) of about 9% (1 sigma), from year to year, due to meteorological fluctuations. We assumed the same for PM2.5, since PM2.5 and PM10 are
strongly correlated in time. The standard deviation, SD2, due to the measurement uncertainty in the average annual urban background concentration at 12 stations then becomes about 3% (0.10/√12). Since both sources of variance are uncorrelated, the overall standard deviation (SD = √(SD12 + SD22) would be
about 9.5% (√(0.032+0.092)) for any year.
The AEI is defined as the three-year running average annual urban background concentration. Averaging over three years reduces the standard deviation by a factor of √3. Consequently, we estimated a standard deviation of the AEI of about 5.5% (0.095/√3) for any set of three years. The AEI for 2020 (AEI2020)
and 2010 (AEI2010) are not correlated. Therefore, the standard
deviation, SDΔ, of the difference, Δ = AEI2010 - AEI2020, is simply:
(1) The AEI for 2020 is significantly (α=0.05) smaller than for 2010, when:
(2) where ε = 1.65, when α=0.05 is tested one-sidedly, which means that significance tested for AEI2020is lower than for AEI2010. For a
two-sided test ε = 2. When we assume an AEI reduction of about 15%, equations 1 and 2 become:
(3) Which means that the measured relative difference,
(AEI2010 - AEI2020)/AEI2010, should be larger than about 12% to be
significant (α=0.05, tested one-sidedly). This result is rather insusceptible to uncertainty in the PM2.5 measurement, because
the main source of uncertainty is introduced by year-to-year meteorological fluctuations. The data quality objectives in the directive allow a maximum uncertainty level of 12.5% (1 sigma) in the measured average annual PM2.5 concentration.
If the measurement uncertainty were 20% (1 sigma) instead of 10%, then the significance level would increase from 12 to 14% (α=0.05, tested one-sidedly).
Note that there are other sources of uncertainty which were not included in this test; these are caused by aspects such as limited data coverage. Nevertheless, the results presented here appear to be quite robust. The significance of an AEI reduction based on reference measurements is a topic currently being addressed by the association of National Air Quality Reference Laboratories (AQUILA). AQUILA is a formally established network - open to all of the National Reference Laboratories across Europe - that verifies and supports the correct implementation of air quality directives in Europe (AQUILA, 2009).
The statistical significance of an AEI reduction using reference measurements
SDΔ = 0.055 AEI20102+AEI20202
AEI2010−AEI2020 ≥ 1.65 ×0.055 AEI2010 1.85 ≈ 0.12 AEI2010
21
and southern Europe, there was no such tendency. The rural stations in north-western Europe had a ratio which was surprisingly low compared to the ratio at urban and traffic sites in this region. The low number of time series may have played a role here: only eight rural time series (six in the United Kingdom and two in Belgium) were available, whereas the urban time series were measured mostly in France (64 from the 78 time series in total). In southern Europe, the rural background stations were mostly located on the Iberian Peninsula (45 from the 48 time series in total). A possible explanation for the low rural ratio in this region might be an important contribution of mineral (Sahara) dust.
The representativeness of the rural ratio in the north-western and southern regions is questionable. Therefore, the differences between a rural station and a nearby (less than 75 km) urban background station were examined in a more detailed analysis (De Leeuw and Horalek, 2009). Only 17 rural stations were linked with one or more urban background stations within the required distance. On average, the PM2.5 to
PM10 ratio at a rural background station would be 10% higher
than at the nearby urban stations. The rural ratios in the north-western and southern regions were therefore adjusted by 10%.
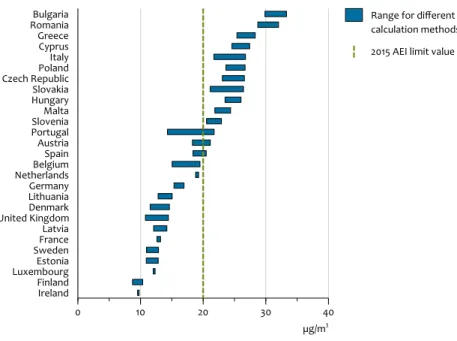
Annual PM2.5 concentration range, minimum, maximum and average, per EU country for 2007. The range consists
of measurements at rural, urban background and traffic locations, with data coverage of more than 75%. Note that
not all EU countries have reported PM2.5 data for 2007.
Figure 2.5 Romania Greece Bulgaria Italy Denmark Poland Slovakia Slovenia Czech Republic Latvia Cyprus Austria Hungary Belgium Malta France Spain Germany United Kingdom Portugal Lithuania Estonia Sweden Ireland Finland 0 10 20 30 40 50 µg/m3 Range Annual PM2.5 concentration, 2007 Mean 2015 limit value
Average PM2.5 to PM10 ratios for Europe, per region and per station type
PM2.5 to PM10 ratio number of time series
Region Rural Urban Traffic Rural Urban Traffic
northern 0.78 0.55 0.42 5 11 6
north-western 0.53-0.69* 0.63 0.59 8 78 32
central eastern 0.75 0.71 0.65 20 73 41
southern 0.57-0.64* 0.58 0.53 48 39 38
Europe 0.62 0.65 0.58 81 201 117
* Adjusted ratio, see above text.
Table 2.1
Current emission scenarios 23
In order to achieve lower PM levels, policies to mitigate emissions were developed at both the European and national levels. This chapter describes the various policy scenarios that were used throughout this report. These scenarios were used to analyse the likeliness of achieving air quality standards for PM2.5 in the future, as described in Chapter 1. The various
scenarios were developed by the International Institute for Applied Systems Analysis (IIASA) during the revision of the Directive on National Emission Ceilings (NEC) (Amann et al., 2008) by applying the GAINS model. This model can generate integrated evaluations of emissions across the entire chain, from source to effect and the reverse, as well as generating mitigation scenarios. The GAINS model was used to construct cost-optimised emission reduction scenarios (achievement of EU-wide targets as set out in the Thematic Strategy, at the least cost to the EU as a whole).
The NEC directive revision process should lead to a proposal from the European Commission for national emission ceilings for 2020. The revision process is presently pending.
3.1 Emission scenarios
The policy scenarios presented in this study are the result of various optimisation runs with the GAINS model of IIASA (Amann et al., 2008). These scenarios portray the possible future development of emissions, given a specific central baseline projection for economic activities, traffic, energy use and agricultural activities. The baseline projection was based on energy projections that include the recent Climate
and Energy Package of the European Commission (see, for instance, Olivier et al., 2008) and the national projections of agricultural activities. Amann et al. (2008) examined cost-effective emission ceilings for the air pollutants sulphur dioxide (SO2), nitrogen oxides (NOx), primary PM2.5, ammonia
(NH3) and volatile organic compounds (VOC). Compliance
with emission ceilings for 2020 for these pollutants – all of which contribute to PM2.5 – will lead to achieving the
environmental objectives of the Thematic Strategy on Air Pollution (CEC, 2005).
The scenarios assessed in this study consisted of three types of emission sources: land-based emissions for the Netherlands, land-based emissions for other European countries and North Sea emissions from international shipping (see Table 3.1 and Table 3.2). Emissions for land-based sources in the Netherlands were in line with the RGE and BGE emission scenarios that have been developed as part of the Dutch National Air Quality Programme (Velders et al., 2009). More details on the primary PM2.5 emissions
that are specific to the Netherlands can be found in Annex A. Emissions for the rest of Europe and for international sea shipping were based on the so-called NEC-6 emission scenarios as given in the sixth analysis report on National Emission Ceiling scenarios, as developed by IIASA for the European Commission (Amann et al., 2008).
The emission figures for the Netherlands from the RGE and BGE emission scenarios that were used for this report may deviate from emission figures for the Netherlands in the corresponding emission scenarios reported by IIASA in its
Current emission
scenarios
3
Overview of emission scenarios used for the evaluation of the PM2.5 air quality standards
Emission scenario Year The Netherlands1) Rest of Europe2) International Shipping2)
CP 2010/2020 RGE Current Policies No further control
TSAP 2020 BGE TSAP
Central Case No further control
EP 2020 BGE European Parliament No further control
IMO 2020 BGE TSAP – after
internation-al shipping measures IMO 3)
MRR 2020 Maximum Reductions Maximum Reductions IMO
1) RGE and BGE are according to Velders et al., 2009 2) EU-27, according to Amann et al., 2008 3) North Sea only, according to IMO, 2008.
NEC-6 report; these sources were not fully consistent. The national emission estimates were used, instead of those according to Amann et al. (2008), to facilitate comparability with the results from the Dutch National Air Quality Monitoring Network (e.g. Velders et al., 2008; Velders et al., 2009). However, the differences between the approaches are negligible with respect to the overall conclusions.
Current Policies, CP
The Current Policies scenario (CP) projects emissions for 2010 and 2020, resulting from the increasing implementation of current and proposed emission control measures. In addition, compliance with current National Emission Ceilings, from 2010 onwards, was assumed. Also included were the recent proposals for additional European emission legislation, that is, the introduction of EURO-VI standards for heavy-duty vehicles (EU, 2008c) and the revision of the Integrated Pollution and Prevention Control Directive for large stationary sources (EU, 2008a; IIASA, 2008). The Dutch RGE scenario includes all current measures, as well as current international and national policies.
To keep the analysis for the CP emission scenario consistent with Amann et al. (2008), no further controls on the emissions from international maritime shipping were included in this CP scenario. However, the scenario included the International Maritime Organization’s agreement with new reduction limits for SO2 and NOx emission from ships, to be implemented by
2020 (IMO, 2008).
TSAP
The Thematic Strategy for Air Pollution (TSAP) scenario meets the health and environmental objectives, as proposed by the European Commission in its thematic strategy for 2020 (CEC, 2005). These objectives were achieved in this scenario in a cost-effective way, by reducing land-based emissions, without taking into account any further emission control measures for maritime shipping. The Dutch BGE emission scenario, in accordance with the RGE emission scenario, included all current measures and established policies. It also incorporated the proposals for national control measures, as presented in the Dutch National Air Quality Cooperation Programme (VROM, 2008a; VROM, 2008b), such as the national emission target for primary PM emissions in industry
and the Dutch Energy and Climate action programme (VROM, 2008c; VROM, 2007).
EP
The European Parliament (EP) scenario aims at more ambitious health and environmental objectives for 2020 than those proposed by the Commission. Like in the TSAP scenario, further control measures for maritime shipping were not incorporated in this scenario.
The European Parliament noted in a resolution that the Thematic Strategy does not show how the objectives of the 6th Environment Action Programme (EC, 2002) can be attained, and called for the Commission to aim for a significantly higher level of ambition to reduce air pollution by 2020, in order tot achieve these objectives. In response to this resolution, IIASA developed an alternative set of environmental and health objectives. IIASA also estimated the cost-effective emission reductions needed to achieve these alternative objectives.
IMO
The so-called International Maritime Organization (IMO) scenario aims at the same health and environmental
objectives as does the TSAP-scenario, with the distinction that the IMO scenario also takes into account additional control measures for international shipping. This scenario assumed the implementation of tighter controls for sea shipping (for details, see Amann et al., 2008). Obviously, such extra emission reductions from international shipping alleviate some pressure for further reduction of land-based emission sources. The resulting set of cost-effective land based emission ceilings for countries for 2020 are generally less ambitious than for the TSAP case. The effect of this emission scenario on PM2.5 levels may differ between countries, given
the different contributions from international shipping to national PM2.5 levels.
MRR
These are the Maximum emission Reductions considered in the RAINS/GAINS (MRR) scenario, which refers to the lowest level of emissions that can be achieved in various countries, through full application of the measures included in RAINS/ GAINS model (RAINS/GAINS model: see text box Models
Emission totals (kilotonnes) for the EU27, for the different policy scenarios
Year scenario SO2 NOx PM2.5 NH3 VOC
2000 10,352 12,155 1,857 4,020 10,867 2010 CP 8,297 9,003 4,294 8,848 2020 CP 2,924 5,684 1,263 3,709 6,146 2020 TSAP 2,336 5,158 1,006 3,139 6,072 2020 IMO 2,700 5,290 1,054 3,176 6,077 2020 EP 1,938 4,838 957 3,079 5,523 2020 MRR 1,755 4,446 655 2,394 4,138
Emission totals (kilotonnes) for the EU27, for the different policy scenarios in 2020, the emissions in 2010 accord-ing to the Current Policies scenario, and emissions in 2000 (Amann et al., 2008). Note that under the EP emission
scenario, EU27 totals are smaller per component than under the IMO emission scenario: -28% (SO2), -9% (NOx), -9%
(PM2.5), -3% (NH3) and -9% (VOC).
Current emission scenarios 25
for the assessment of particulate matter). The RAINS/GAINS model does not consider non-technical measures, such as behavioural changes or structural changes (for example, fuel switching or additional savings in energy use). The effects on PM2.5 in the Netherlands in relation to attainability of the
Approach 27
To research the attainability of PM2.5 air quality standards
in the Netherlands, models were used in combination with measurements. In this section, the approach is described for each PM2.5 air quality standard, followed by the applied
models. The section ends with a discussion on the uncertainty in the model results.
4.1 Approach per PM
2.5standard
Exposure concentration obligation
Maps with PM2.5 background concentrations for 2006, 2010,
2015 and 2020, calculated with the OPS model, were used to evaluate the attainability of the exposure concentration obligation (ECO). For more details on the OPS model and its application, see Section 4.2; also see Van Jaarsveld (2004) and Velders et al. (2009). The emissions used as input were in accordance with current and proposed Dutch and European policies (BGE/IMO see Table 3.1). The average exposure index (AEI) is the indicator to assess the ECO. In this assessment we used modelled concentrations of the twelve 1x1 km2 grid
cells that corresponded with the urban background locations (Figure 2.2). The assessment by MtB2007 used the average concentration of the six air quality agglomerations designated in the Netherlands as a proxy for the AEI. When we reapplied that approach, the calculated AEI values were similar and led to the same conclusion for the attainability of the ECO by 2015.
Standards for average annual PM2.5
levels to be met at all locations
The OPS model in combination with the Luvotool model (see Section 4.2) were used to assess the attainability of the 25 µg/m3 level, as a limit value for 2015 and target value for
2010, as well as the 20 µg/m3 level (the Stage 2 indicative value
to be met by 2020).
These standards concern the average annual PM2.5
concen-trations and should be met at all relevant locations, such as along busy streets. The highest PM2.5 concentrations in the
Netherlands are likely to be found mostly at traffic locations in urban agglomerations and along busy motorways. There-fore, current and future estimates of PM2.5 concentrations at
urban traffic locations and along motorways are believed to be the best indicators for assessing whether the aforemen-tioned PM2.5 standards will be attained in the Netherlands.
Model estimates for the contributions from local traffic at street level were calculated, separately, with the Luvotool model (PBL, 2008), for 2010, 2015 and 2020, and added to large-scale concentration levels calculated with the OPS model.
Exposure reduction target
Attainability of the exposure reduction target (ERT) was eval-uated with the OPS model, but the emission input was pre-pared following a somewhat different approach. The effect of different recently issued emission scenarios relevant to the attainability of the ERT was examined with the GAINS-NL model (see Section 4.2). This approach was taken to link our assessment to the revision process of the EU Directive on National Emission Ceilings, where the RAINS/GAINS model was used for the assessment of the emission ceilings. All emission scenarios (Section 3) yielded a concentration change of the AEI for 2020, compared to the Current Policy scenario AEI for 2010. To calculate the relative change, the AEI reductions were then divided by the AEI that resulted from the Current Policy scenario for 2010.
4.2 Models
OPS model
The Netherlands Environmental Assessment agency (PBL) uses the OPS model (Van Jaarsveld, 2004) to generate maps of average annual pollutant concentrations for the Neth-erlands, at 1x1 km2 grid, for air quality components that are
subject to European regulations (see text box Methodology for calculating PM2.5 concentrations). These maps, in conjunction
with more detailed calculations of contributions from local sources, are used to report on air quality, as obligated under the EU Air Quality Directive, as well as for impact assessments related to new spatial projects.
The OPS model provides a much higher resolution (1x1 km2)
than, for instance, the EMEP model, which is used for describ-ing the dispersion of air pollution for the GAINS model. The output domain of the OPS model, however, is limited to the air quality within the Netherlands (but takes sources within Europe into account). OPS model results were compared with EMEP results for PM2.5 (see also Schaap et al. (2009), Cnossen
and Velders (2009), and MtB2007).
Luvotool: calculation of the contribution from local traffic sources
The contribution from local traffic sources on top of the large-scale PM2.5 concentration was calculated with the Luvotool
model (PBL, 2008). The model calculates a high resolution PM2.5 concentration map (25x25 m2 grid), as is shown in the
calculation scheme in Figure 4.1. The model has two parts for calculating the contribution from traffic. For urban roads, the dispersion calculation is strongly parameterised using the CAR II model (Eerens et al., 1993; Jonker and Teeuwisse, 2006). In the Netherlands, CAR II is widely used for assess-ing the contribution of air pollutants from street traffic. The model was updated in 2007 (Wesseling and Sauter, 2007). For non-urban roads, Luvotool assumes that a road section is a finite line source, and the distribution is calculated with a Gaussian plume model. The Luvotool calculations result in a map with contributions from local traffic for more than 8.2 million road segments of 25x25 m2. This ‘traffic’ map is added
to the large-scale PM2.5 concentration map. Large-scale PM2.5
concentrations calculated with the OPS model for 2010, 2015 and 2020, were based on Velders et al. (2009). The added traffic contributions were based on the PM2.5 traffic emissions
in accordance with the BGE scenario as described in Velders et al. (2009). In the combined PM2.5 maps (large-scale + local
traffic contribution), a correction was applied for motorways, otherwise a doubling would occur in the traffic contribution at those locations. In Section 5.1, Standards for average annual PM2.5 levels to be met at all locations, statistics are shown for
the three PM2.5 concentration maps for 2010, 2015 and 2020,
mentioned above.
GAINS-NL model
GAINS-NL is a RAINS/GAINS model version made available for national use. It focuses on the Netherlands (RAINS-NL and GAINS-NL; Aben et al., 2005). GAINS-NL combines the emis-sion generator of the GAINS model with a source receptor matrix based on OPS model results, to calculate, for instance, large-scale PM2.5 concentration maps for the Netherlands on
a 5x5 km2 grid. The original RAINS/GAINS model has a much
coarser resolution (50x50 km2). Input emissions are SO 2, NOx,
NH3 and primary PM2.5. The effect of VOC emission changes on
PM2.5 are not accounted for by the GAINS-NL model.
The RAINS/GAINS models are integrated assessment models that can be used to explore cost-effective emission control
strategies to improve European air quality (RAINS) and, in addition, reduce emissions of greenhouse gases within Europe (GAINS) (Wagner et al., 2006 and 2007). The RAINS/ GAINS models use linearised relations between source emis-sions and concentrations, so-called source receptor matrices, which are calculated from EMEP model results. The GAINS model was used for the optimisation runs, forming the basis of the NEC-6 emission scenarios discussed in Chapter 3 (Amann et al., 2008).
In this study, we used the GAINS-NL model in addition to the OPS model itself. Since OPS and GAINS-NL are based on the same model, the results are in close agreement. The AEI outcomes of OPS and GAINS-NL, with regard to the ERT evaluation, agree within about 7%. Such small differences are insignificant for the conclusions on the attainability of the ERT. The results from both model versions, therefore, were considered equal. Differences between the results of the two model versions were mainly caused by resolution differences (5x5 km2 versus 1x1 km2), and by differences in the
alloca-tion of emissions to emitting sectors. Differences may also arise from model improvements which have been included in updated versions of the OPS model, but which have not yet been implemented in GAINS-NL.
EMEP model
The unified EMEP model (EMEP, 2003) is a chemical transport model for the European domain. Annual assessments for different air pollutants are derived from EMEP model calcula-tions for the European domain and for each Member State (EMEP, 2007, 2008a and 2008b). The EMEP model, therefore, plays an important role in preparing policy for the European Union. PM2.5 is part of the model output on a resolution of
50x50 km2.
4.3 Uncertainties
This assessment faced major uncertainties in the measure-ments and model results. The PM2.5 measurements carried
out according to the reference method in 2008 had an uncertainty of about 20% (2 sigma). Modelled large-scale PM2.5
concentrations were more uncertain: future PM2.5
concen-trations contained an uncertainty of 40% (2 sigma). Relative concentration changes based on model estimates between
Calculation scheme in Luvotool, in this case for the indicator PM2.5. Large-scale concentrations were calculated
offline with the OPS model.
Figure 4.1 Luvotool and its environment
Traffic emissions Large-scale concentrations Contribution from traffic to concentration Concentration map of the Netherlands Indicators Urban dispersion Non-urban dispersion Luvotool Traffic data