Techno-economic benefit Assessment
From ITS to C-ITS Signage Applications: A
Academic year 2019-2020
Master of Science in Industrial Engineering and Operations Research Master's dissertation submitted in order to obtain the academic degree of
Leuven)
Counsellors: Thibault Degrande, Dr. Sven Maerivoet (Transport & Mobility
Supervisors: Prof. dr. ir. Sofie Verbrugge, Prof. dr. ir. Didier Colle
Student number: 01503921
Cédric Janssens
Preface
It is with proud that I present to you my master dissertation ’From ITS to C-ITS Sig-nage Applications: A Techno-economic benefit Assessment’. This thesis was written in order to obtain the academic degree of Master of Science in Industrial Engineering and Operations Research. It is the accomplishment of a five year study at the faculty of engineering and architecture at the University of Ghent in which I gained knowledge and insight in various topics and further developed myself as a human being.
From September 2019 to June 2020, I was involved in the research and writing of this dissertation. The research I conducted was complex and challenging. After ex-tensive quantitative research, I was able to answer the research question. During this research, my supervisors Thibault Degrande and dr. Sven Maerivoet were always able to answer my questions and available for a discussion about my approach to the research question. Prof. dr. ir. Didier Colle and prof. dr. ir. Sofie Verbrugge thoroughly evalu-ated my intermediate reports, which helped me to criticize my own work and to adjust it where needed. I want to thank them for enabling me to always continue my dissertation.
I wish you pleasure in reading this master dissertation.
The author(s) gives (give) permission to make this master dissertation available for consultation and to copy parts of this master dissertation for personal use. In all cases of other use, the copyright terms have to be respected, in particular with regard to the obligation to state explicitly the source when quoting results from this master disserta-tion.
Abstract
C´edric Janssens, Master of Science in Industrial Engineering and Operations Research, Faculty of engineering and architecture, University of Ghent
Abstract of Master’s dissertation, Academic year 2019-2020
From ITS to C-ITS Signage Applications: A Techno-economic benefit Assessment To further improve road transport, new technologies have to be implemented. One of the promising technologies is cooperative intelligent transportation systems C-ITS. The purpose of this master dissertation is to investigate the socio-economic viability of the traffic efficiency applications TEA, being in-vehicle signage, in-vehicle speed limits and probe vehicle data, on inter-urban roads for cars and to make public recommendations regarding the deployment in Flanders. The literature review starts with studying and comparing different evaluation methods for public infrastructure projects in order to find the most appropriate method for evaluating C-ITS services. The cost-benefit analysis CBA method is found to be the most convenient. The second part of this literature review discusses C-ITS, different service types and in more detail the TEA and their benefits. The methodology sets up a CBA model that indicates the socio-economic via-bility of the TEA to the properties of an investigated highway segment. These properties allow the model to calculate the socio-economic benefits and investment costs for the deployment and then to perform three viability indicators. On the basis of the results of this dissertation, it is recommended that the Flemish government should oblige the implementation of C-ITS in new vehicles and to start the deployment of the infrastruc-ture when an adoption of 10% is reached. To maximally benefit from the TEA, it is suggested to aim for a full C-ITS coverage of the highways in Flanders. In this manner, the government not only enables socio-economic benefits from the TEA, it also creates the foundation for future technological road transport improvements.
From ITS to C-ITS Signage Applications: A
Techno-economic benefit Assessment
C´edric Janssens
Supervisors: Prof. dr. ir. Sofie Verbrugge, Prof. dr. ir. Didier Colle Counsellors: Thibault Degrande, Dr. Sven Maerivoet
Abstract—To further improve road transport, new technologies have to be implemented. One of the promising technologies is cooperative intelligent transportation systems C-ITS. The purpose of this master dissertation is to investigate the socio-economic viability of the traffic efficiency applications TEA, being in-vehicle signage, in-vehicle speed limits and probe ve-hicle data, on inter-urban roads for cars and to make public recommendations regarding the deployment in Flanders. The literature review starts with studying and comparing different evaluation methods for public infrastructure projects in order to find the most appropriate method for evaluating C-ITS services. The cost-benefit analysis CBA method is found to be the most convenient. The second part of this literature review discusses C-ITS, different service types and in more detail the TEA and their benefits. The methodology sets up a CBA model that indicates the socio-economic viability of the TEA to the properties of an investigated highway segment. These properties allow the model to calculate the socio-economic benefits and investment costs for the deployment and then to perform three viability indicators. On the basis of the results of this dissertation, it is recommended that the Flemish government should oblige the implementation of C-ITS in new vehicles and to start the deployment of the infrastructure when an adoption of 10% is reached. To maximally benefit from the TEA, it is suggested to aim for a full C-ITS coverage of the highways in Flanders. In this manner, the government not only enables socio-economic benefits from the TEA, it also creates the foundation for future technological road transport improvements.
Index Terms—cooperative intelligent transportation systems, in-vehicle signage, in-vehicle speed limits, probe vehicle data, cost-benefit analysis
I. INTRODUCTION
Nowadays our society is facing a number of major challenges that have to be resolved. In order to reduce the impacts of climate change, the European Union EU wants to become the first climate neutral continent by 2050 [1]. The Flemish government wants to reduce the number of traffic fatalities to 200 by 2020. However, after years of decline, the number increased again in 2019 [2]. In order to achieve those goals, road transport has to evolve. Hence, both the EU and the Flemish government are constantly looking for new opportunities to reduce the impacts of road transport. The development of new technologies is one of those opportunities. One of the promising technologies is cooperative intelligent transportation systems C-ITS. It is a first step towards fully autonomous vehicles. The C-ITS technology enables intelligent transportation systems ITS stations, such as
nomadic devices to share information with each other. With benefits such as improved road safety, reduced congestion, optimised traffic efficiency, increased service reliability and lowered energy consumption, the potential of C-ITS cannot be neglected [3]. A wide range of C-ITS services exist, though this dissertation focuses on the inter-urban services, categorized as the traffic efficiency applications TEA. These are in-vehicle signage, in-vehicle speed limits and probe vehicle data.
A successful implementation of C-ITS requires investments from both private and public stakeholders. Private stakeholders rely on business models to find the economic viability of such projects. Though, public stakeholders need to consider the socio-economic impacts too. The purpose of this master dissertation is to investigate the socio-economic viability of the TEA on inter-urban roads for cars and to make public recommendations regarding the deployment in Flanders. In order to support these recommendations, an evaluation model that indicates the socio-economic viability of the TEA for a highway segment has to be set up.
II. LITERATURE REVIEW
A. Investment decisions for public authorities
The first chapter of the literature review studies and compares three evaluation methods for public infrastructure projects, being the cost-benefit analysis CBA, multi-criteria decision making MCDM and cost-effectiveness analysis CEA method, in order to find the most appropriate method for evaluating C-ITS services. The CBA method tries to evaluate all potential socio-economic impacts to determine whether the investment is profitable for the community [4]. Firstly, all incorporated socio-economic costs and benefits are expressed in monetary values. Whenever some cost or benefit occurs in multiple years, the discount rate is used to calculate its present value. Having all these monetary values, the total cost and benefit can be computed. Finally, indicators that evaluate the socio-economic viability of the project can be performed [5]. In essence, evaluating a transport project is a problem statement that is characterized by multiple actors, criteria and objectives. The MCDM method exploits this structure to approach the evaluation. It exists out of a set of objective functions that needs to be optimized while being subjected
involve various topics such as social factors and economic influence [6]. In contrast to the CBA method, no effort is made to convert these to a monetary value. For instance, noise pollution can be expressed in decibel and employment in man-years [7]. Each part of the set of objective functions can be given a certain priority, chosen by the decision makers. This introduces some subjectivity into this evaluation method. After setting up the model, it can be solved using different techniques [6]. The aim of the CEA method is to determine whether the investment cost of a project is justified. For each alternative a cost needs to be expressed as well as an effectiveness score. This cost and score have to be approached from the society’s perspective. The different alternatives are then ranked on their effectiveness. Depending on the willingness to pay for one increase in effectiveness, the decision maker can now decide which alternative needs to be selected [8]. Out of these methods, the CBA method is found to be the most convenient for three reasons. Firstly, this method excludes the decision maker’s preferences and will therefore result in a more objective outcome [9]. Secondly, the CBA method better incorporates the project lifetime [9]. Lastly, this method is used in multiple countries and is even mandatory in the Netherlands to evaluate a transport infrastructure project [10].
The procedure to perform a CBA consist of four steps, being identification of the costs, calculation of the benefits, comparison of the alternatives and report and planning the action. To compare the different alternatives in step three, three indicators have to be computed, namely the internal rate of return IRR, net present value NPV and benefit-cost ratio BCR [11]. The NPV calculates the discounted difference between the benefits and the costs. A NPV larger than zero indicates a profitable investment and a NPV smaller than zero indicates an investment that generates losses [11]. The IRR is the discount rate that sets the NPV to zero. Whenever the IRR is greater than or equal the cost of capital, the project is worth the investment [11]. The cost of capital is the rate of return that could have been earned by investing the same amount of money into a different project with an equally large risk. The BCR calculates the ratio between the discounted benefits and costs. The project is economic viable, if the BCR exceeds one [11]. It has to be remarked that the information from this method is not decisive. Hence, it has a supportive political role and the results should be skeptically analysed.
B. Cooperative intelligent transportation systems
The second chapter of this literature review introduces the reader to C-ITS, its technology, different service types and in more detail the TEA. ITS are communication and information technologies that improve the efficiency, robustness and safety of transport [12]. C-ITS enables real-time data exchange between a vehicle and other vehicles or infrastructure. By giving advice to the driver and facilitating its movements on the road, the safety, sustainability, efficiency and comfort
these benefits than a vehicle as a stand-alone system. A full deployment of C-ITS can potentially replace the traditional traffic management and information systems [13]. In order to enable C-ITS, a vehicle-to-everything V2X protocol has to be established. This protocol will technically allow that vehicles directly communicate with other transportation systems, such as road side units RSUs, traffic control centers, other vehicles and pedestrians. Additionally, this protocol is required for the deployment of self-driving vehicles, since it allows vehicles to interact in a human manner with each other. V2X is decentralized implemented and deployed. Therefore, every V2X equipped vehicle will function as an independent V2X sensor system. This excludes that a central operating system has to control the vehicles, which is an advantage over regular cellular communication technology [14]. V2X is an umbrella term for the possible communication partners of a vehicle. Examples are vehicle-to-vehicle V2V, vehicle-to-infrastructure V2I, vehicle-to-pedestrians V2P and vehicle-to-network V2N. The V2X technology can be implemented in two ways, short-range and wide-area technologies. The short-range technologies use the 5.9GHz band, which is licensed for ITS, and focuses on the short-range, high-availability and high-reliability services. The wide-area technologies use cellular technologies from mobile networks. Therefore, they are called cellular V2X C-V2X. These focus on the longer distance and high-availability communication services, such as V2N. Though, C-V2X forms a valid alternative for the short-range technologies. Nowadays, the 4G cellular network is used, however this can be extended to 5G whenever it comes available [15]. In Figure 1, a drawing of a potential C-ITS landscape is shown [16]. The more road users have access to the deployed C-ITS services, the larger the total benefit will be [13]. Therefore, the necessary infrastructure has to be installed. Generally, one makes the distinction between in-car and roadside infrastructure. The in-car infrastructure needs to be funded by the road user. The roadside infrastructure contains the central and roadside ITS sub-systems and is typically funded by the government [3]. After deploying this infrastructure, the society can experience different benefits, which are categorised as safety, congestion and time savings, emission, noise pollution and road damage benefits [17].
The TEA are Day 1 V2I information services that deliver benefits to highways. These are an important starting point for the deployment of other C-ITS services. Hence, this master dissertation will provide an indication for the socio-economic viability of any C-ITS service on highways. The in-vehicle signage service allows RSUs to send information about fixed and dynamic traffic sings directly to the passing vehicles. The visibility of the traffic information is now prolonged from an instant to a longer time period [18]. The in-vehicle speed limits service informs the driver about the current speed limits at his location. This service will reduce sudden acceleration and braking and thus cause a smoother driving style [3]. The
Fig. 1. A drawing of a potential C-ITS landscape [16].
traffic by collecting the vehicle data [19]. All these services cause significant safety benefits. The in-vehicle speed limits and probe vehicle data service reduce the vehicle emission. However, the in-vehicle speed limits service slightly reduces the traffic efficiency [3].
III. METHODOLOGY
In order to form public recommendations regarding the de-ployment of the TEA in Flanders, a CBA has to be performed. Therefore, the aim of this master dissertation is to develop a general European model that performs a CBA for the deploy-ment of the TEA for cars on an elected highway segdeploy-ment. This model has to support the decision maker in deciding whether these applications are socio-economic viable on this highway segment. Throughout the subsequent subsections, the methodology is shortly exposed. For a more exhaustive explanation, the reader is referred to the methodology of the dissertation.
A. Highway segment information
The highway segment information forms the input of the CBA model and can be categorized into five groups, being highway, general, traffic jam, capacity and policy informa-tion. The highway information contains the number of lanes, measurement length, car and truck speed, fraction of trucks, desired C-ITS coverage, fraction already deployed with ITS, a correction factor for the benefits when ITS is already enrolled and a correction factor when this is not the case. The general information consists of the car and truck length, distance between two consecutive vehicles, range of a RSU and the average age of the passing cars. The traffic jam information contains the standstill time fraction, standstill distance, driving distance and driving speed. The capacity information consists of the number of hours of regular traffic during the day, regular traffic during the night and traffic jam hours; and highway usage during the night. The policy information contains the required adoption rate to start the deployment of the TEA, the discount rate and the project lifetime. These allow the model to calculate the car density and annual vehicle kilometers vkm on this segment and serve as input data for the subsequent
B. Socio-economic benefits expressed as monetary values The first order benefit types, being fatalities, injuries, CO2,
CO, particulate matter PM, NOx, volatile organic compounds
VOCs and time loss and congestion, of the different TEA services are combined to perform a general benefit per benefit type, which is shown in Table I. As starting point, three different adoption scenarios were provided. Their behaviour over time is visualized in Figure 2. Adoption scenario 1 PO1 reflects a limited intervention of the government based on non-legislative measures regarding the implementation of C-ITS [20]. Moderate intervention is assumed in adoption scenario 2 PO2, nevertheless it can still be freely decided by industry or member states whether to deploy C-ITS [20]. Adoption scenario 3 PO3 presumes that governments oblige the equipment of C-ITS in new vehicles [20]. Network effects appear if a product or service becomes more valuable to the current users when more people start using it. Though, near higher adoption rates, the incremental value should decrease [21]. Clearly, network effects apply on the C-ITS technology. The more vehicles are equipped with C-ITS, the more valuable it becomes for the community. However, the extra value one extra user implies for other users should decrease for higher adoption rates. To quantify the value (or benefit) of such a network, a S-curve or sigmoid curve has to be applied. This curve is noted with the function of Formula 1. The properties of this curve are then exploited to obtain a yearly benefit per benefit type and adoption scenario. Based on those outcomes, a separate benefit model for each benefit category of the TEA is set up.
TABLE I
THE TOTALTEABENEFITS PER BENEFIT TYPE FOR A100%ADOPTION RATE.
Benefit category Benefit type TEA Safety Fatalities 9,92% Injuries 7,30% Emission CO2 2,30360% NOx 0,50180% PM 0,40060% CO 0,20360% VOCs -0,09640% Time loss and congestion Average speed -1%
S(n) = 1
1 + e−n (1)
With:
n= the number of users
C. Benefit and investment models
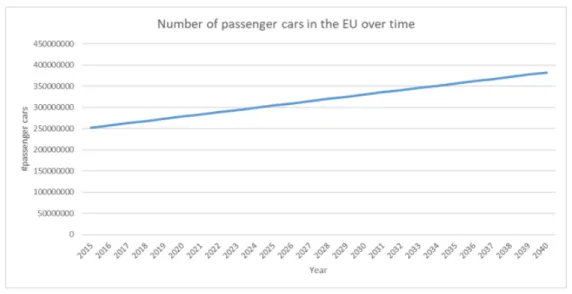
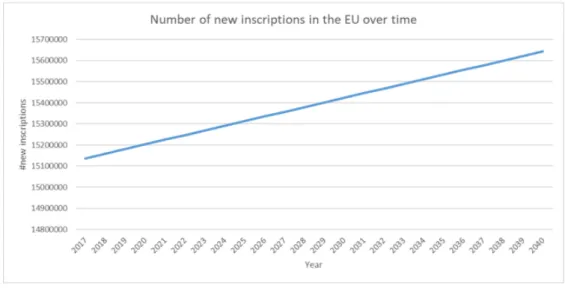
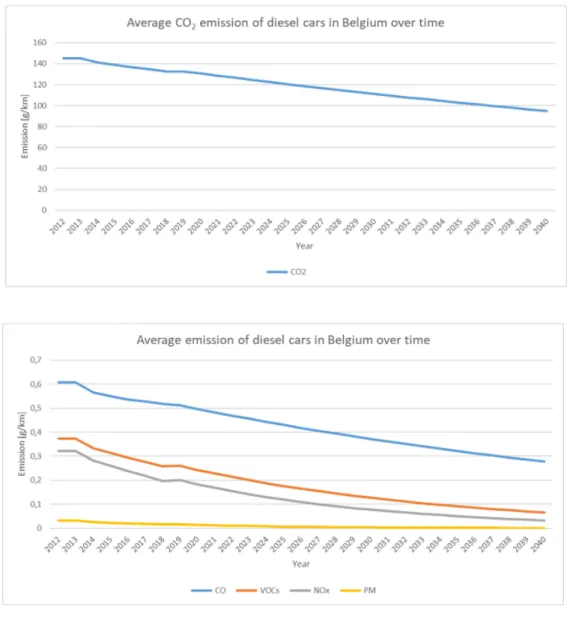
The emission benefit is calculated by firstly forecasting the composition of the vehicle fleet in the EU, based on the current composition, a forecast of the composition of the new inscriptions and the number of passenger cars. Secondly, the
Fig. 2. The different provided adoption scenarios over time.
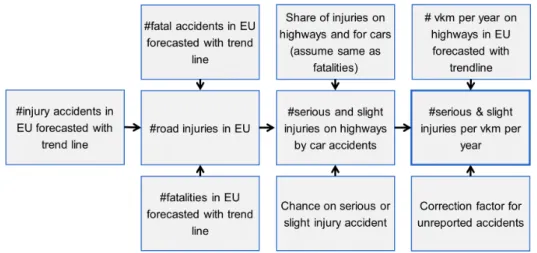
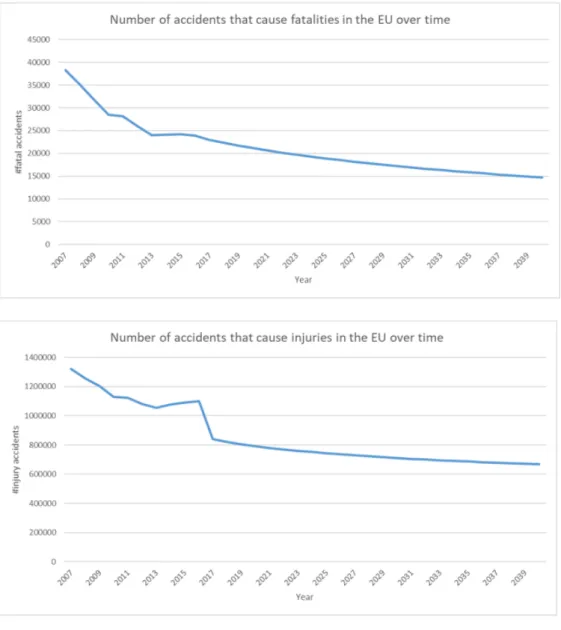
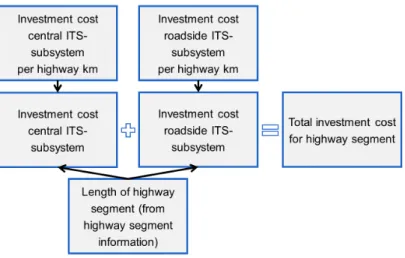
abstracted. Combining these results with the already calculated annual vkm, allows to perform the total emission on the highway segment. Together with the socio-economic costs for these emissions, this results in the cost per emission on the segment. The benefit per year and adoption scenario, then allows to perform the emission benefit per adoption scenario on this highway segment. The safety benefit is calculated by firstly forecasting the number of fatal, serious and slight injury accidents per vkm, based on the number of accidents that yearly occur in the EU and the number of car vkm on highways. Multiplying this with the yearly number of vkm on the segment, results in the number of fatal, serious and slight injury accidents. The socio-economic accident cost then allows to perform the total accident cost. Together with the benefit per year and adoption scenario, the safety benefit per adoption scenario is then performed. The time loss and congestion benefit is simply performed by multiplying the annual vkm on the highway segment, the benefit per adoption scenario and the time loss cost. It has to be reported that all these models were implemented in an underestimated manner to obtain a defensive outcome. On the other hand, the investment cost has to be implemented. Firstly, the investment cost is calculated per highway km. Then, this is multiplied with the length of the highway segment in order to obtain the total investment cost for the highway segment. It has to be reported that the the implemented investment cost regards the infrastructure that is able to provide multiple C-ITS services. It was decided to not apply the cost allocation method in order to obtain a defensive outcome for the deployment of the TEA.
D. Outcome
Since all the benefits and investment costs are now ex-pressed as monetary values, the NPV, IRR and BCR can be computed. These indicate the socio-economic viability of the TEA for the chosen highway segment and support the decision maker in deciding whether to invest in the deployment.
IV. RESULTS AND DISCUSSION
A. CBA model
To visualize the share of each benefit model in the total benefit, Figure 3 is given. This Figure shows the benefit of
II, in PO2 over time and benefit categories. This learns the reader that the safety benefit is about twice the magnitude of the emission benefit and that the time loss and congestion benefit has a rather small negative impact on the total benefit. In more detail, the heatmaps of Figures 4 and 5 allow to observe that the benefit for serious injuries has the highest impact, followed by the CO2emission of petrol cars, fatalities
and the CO2 emission for diesel and plug-in hybrid vehicles.
To give the reader an idea about the socio-economic viability of the TEA, the indicators of section II-A are performed for highway segment B from Table II and shown in Table III. One concludes that for highway segment B only PO2 and PO3 are socio-economic viable. The robustness of the model to variations of its input data is analysed, which allows to conclude that input data for the highest impact benefit types, as listed above, have the highest influence on the end result.
Fig. 3. The TEA benefit for highway segment A over time and benefit category for PO2.
TABLE II
THE TWO DIFFERENT HIGHWAY SEGMENTS USED TO DISCUSSED THE OBTAINED RESULTS THROUGHOUT THE METHODOLOGY. Parameter Highway segment A Highway segment B Number of lanes 3 3
Measurement length 1 km 1 km Car speed 120 km/h 120 km/h Truck speed 90 km/h 90 km/h Fraction trucks 20% 20% Distance between vehicles 3,5s 3,5s C-ITS coverage 100% 100% Fraction deployed with ITS 0% 0% Average car age 10,8 years 10,8 years Deployment adoption rate 0% 10% Discount rate 5% 5% Project lifetime 21 years 21 years
TABLE III
THE PERFORMED INDICATORS OF THECBAMODEL FOR THE DEPLOYMENT OF THETEAON HIGHWAY SEGMENTB.
Adoption scenario NPV IRR BCR PO1 -11.238,37 0,48 PO2 24.464,96 17,49% 1,98
Fig. 4. The NPV of the TEA benefit for highway segment A over the subdivision of the benefit types (emission as vehicle types) for PO2.
Fig. 5. The NPV of the TEA benefit for highway segment A over the subdivision of the benefit types (emission as emission types) for PO2.
B. Public recommendations regarding the deployment of the TEA
This section aims to form public recommendations regarding the deployment of the TEA in Flanders. In order to support these, a Monte Carlo simulation for the properties of Flanders’s highway infrastructure is performed for a varying C-ITS coverage and required adoption rate to start the deployment of the TEA. It is concluded that when the government is not going to stimulate the implementation of C-ITS in its vehicle fleet, the best outcome would be obtained by not investing in the deployment of the TEA. In case of a moderate government policy regarding the stimulation of C-ITS, the investment should only start at an adoption rate of 10% and aim for at least 50% C-ITS coverage. In implementing this deployment strategy, an average NPV of C1.222.465,14 and a standard deviation on this outcome of C410.807,01 could be expected. Hence, the possibility on a negative NPV is almost non-existing. Whenever the government is going to oblige the implementation of C-ITS in new vehicles, it should start the deployment of the TEA from an adoption rate of 5% and a 30% C-ITS coverage, which results in an average NPV of C5.077.332,47 and a standard deviation on this outcome of C502.648,62. In order to increase the benefits, they should aim to quickly
maximally benefit from the deployment. It has to be reported that the outcome resulting from this CBA model is an underestimate of the actual impact. Hence, the impact of TEA can only be more beneficial than quantified by the model. On the basis of the results of this dissertation, it is rec-ommended that the Flemish government should oblige the implementation of C-ITS in new vehicles and to start the deployment of the infrastructure when an adoption of 5% is reached. To maximally benefit from the TEA, it is suggested to aim for a full C-ITS coverage of the highways in Flanders. The importance of the TEA may not be underestimated. As highway Day 1 C-ITS information services they form the start-ing point for the next evolution of our highway transport. The TEA will support the society in reducing its road emission and decreasing the number of inhabitants that pass away or suffer from injurious or sorrow due to accidents. Hence, the perfect improvement to achieve the goals of the European and Flemish government to become the first climate neutral continent by 2050 and reducing the number of fatalities on highways. The positive impact of deploying the TEA exceeds the socio-economic benefits of these services. The deployment implies to invest in the technology and infrastructure that is technically able to further expand the provided C-ITS services in Flanders. Clearly, this will result in increasing socio-economic benefits without any investment costs. Investing in this infrastructure as a government will show the society that new technologies are supported and stimulated. The development of the TEA will not only enable the expansion to other C-ITS services. It will also prepare the government and its road infrastructure for the introduction of autonomous vehicles. Therefore, it is concluded that a proper invest in the deployment of the TEA not only results in immediate socio-economic benefits. It also creates the foundation for future technological road transport improvements.
V. CONCLUSION AND FUTURE WORK
A. Conclusion
To further improve road transport, new technologies have to be implemented. One of the promising technologies is cooperative intelligent transportation systems C-ITS. The purpose of this master dissertation was to investigate the socio-economic viability of the traffic efficiency applications TEA, being in-vehicle signage, in-vehicle speed limits and probe vehicle data, on inter-urban roads for cars and to make public recommendations regarding the deployment in Flanders.
Observing the outcome, learned the reader that the safety benefit is about twice the magnitude of the emission benefit and that the time loss and congestion benefit has a rather small negative impact on the total benefit. In more detail, it was observed that the benefit for serious injuries has the highest impact, followed by the CO2emission of petrol cars,
data was analysed, which allowed to conclude that input data for the highest impact benefit types, as listed above, have the highest influence on the end result.
On the basis of the results of this dissertation, it was recommended that the Flemish government should oblige the implementation of C-ITS in new vehicles and to start the deployment of the infrastructure when an adoption of 5% is reached. To maximally benefit from the TEA, it is suggested to aim for a full C-ITS coverage of the highways in Flanders. The importance of the TEA may not be underestimated. As highway Day 1 C-ITS information services they form the starting point for the next evolution of our highway transport. The TEA will support the society in reducing its road emission and decreasing the number of inhabitants that pass away or suffer from injurious or sorrow due to accidents. Hence, the perfect improvement to achieve the goals of the European and Flemish government to become the first climate neutral continent by 2050 and reducing the number of fatalities on highways.
B. Future work
To further improve the usability of the CBA model, some future work is listed. Firstly, one could implement the benefits and possible costs for other vehicle types, such as lorries, vans and bicycles. In this way, a larger part of the society that will benefit from the deployment of the TEA is included. Secondly, the model only focuses on first order benefits. By further studying the impacts of the TEA, second order benefits could be implemented. Hence, the benefit would better match the actual socio-economic benefit.
REFERENCES
[1] “A European Green Deal.” [Online]. Avail-able: https://ec.europa.eu/info/strategy/priorities-2019-2024/european-green-deal en?fbclid=IwAR392M 8BO-YXwmm-CnfDQjj7JymaURn2jbvLplVc0zlzvL-6bhaKHA7Cv0 erin verwerken [2] A. D. Boeck, “Na jarenlange daling stijgt het
aantal verkeersdoden weer in Vlaanderen,” 2020. [Online]. Available: https://www.demorgen.be/nieuws/na-
jarenlange-daling-stijgt-het-aantal-verkeersdoden-weer-in-vlaanderen
b2bae382/?fbclid=IwAR0Qn1wDQxdDELonq8pNn6AZfNfKDfwP6U6S9w5FeLt-nHfP-REM89rokXo&referer=https%3A%2F%2Fl.facebook.com%2F&utm campaign=shared earned&utm medium=social&utm source=copylink [3] European Comission, “Study on the Deployment of C-ITS in
Europe: Final Report. Framework Contract on Impact Assessment and Evaluation Studies in the Field of Transport,” 2016. [Online]. Available: https://ec.europa.eu/transport/sites/transport/files/2016-c-its-deployment-study-final-report.pdf
[4] S. Damart and B. Roy, “The uses of cost-benefit analysis in public transportation decision-making in France,” Transport Policy, vol. 16, no. 4, pp. 200–212, 2009.
[5] B. van Wee, “How suitable is CBA for the ex-ante evaluation of transport projects and policies? A discussion from the perspective of ethics,” Transport Policy, vol. 19, no. 1, pp. 1–7, 2012. [Online]. Available: http://dx.doi.org/10.1016/j.tranpol.2011.07.001
[6] A. Kumar, B. Sah, A. R. Singh, Y. Deng, X. He, P. Kumar, and R. C. Bansal, “A review of multi criteria decision making (MCDM) towards sustainable renewable energy development,” Renewable and Sustainable Energy Reviews, vol. 69, no. November 2016, pp. 596–609, 2017. [Online]. Available: http://dx.doi.org/10.1016/j.rser.2016.11.191 [7] G. Blauwens, P. D. Baere, and E. V. de Voorde, Transport economics.
[8] “Cost-Effectiveness Analysis.” [Online]. Available:
https://www.herc.research.va.gov/include/page.asp?id=cost-effectiveness-analysis#what-is-cea
[9] P. Mackie, T. Worsley, and J. Eliasson, “Transport appraisal revisited,” Research in Transportation Economics, vol. 47, no. 1, pp. 3–18, 2014. [Online]. Available: http://dx.doi.org/10.1016/j.retrec.2014.09.013 [10] J. A. Annema, N. Mouter, and J. Razaei, “Cost-benefit analysis
(CBA), or multi-criteria decision-making (MCDM) or both: Politicians’ perspective in transport policy appraisal,” Transportation Research Procedia, vol. 10, no. July, pp. 788–797, 2015. [Online]. Available: http://dx.doi.org/10.1016/j.trpro.2015.09.032
[11] C. Chalkiadakis, P. Iordanopoulos, and T. Lusikka, “Topic Study 7 : Cost-benefit analyses of ITS and C-ITS services.”
[12] S. Edwards, “ITS1: Introduction to ITS and C-ITS,” 2018. [Online]. Available: https://www.its-elearning.eu/courses/course-v1:Capital+ITS1+test/about
[13] F. Ognissanto, J. Hopkin, and A. Stevens, “Investigation of the costs, benefits and funding models for two bundles of cooperative intelligent transport system services,” IET Intelligent Transport Systems, vol. 13, no. 6, pp. 1048–1056, 2019.
[14] V. Tabora, “Improving Self-Driving Car Safety And Reliability With V2X Protocols,” 2018. [Online]. Avail-able: https://medium.com/self-driving-cars/improving-self-driving-car-safety-and-reliability-with-v2x-protocols-1408082bae54
[15] Analysis Mason and SBD, “Socio-Economic benefits of cellular V2X - Final Report for 5GAA,” no. December, p. 86, 2017. [Online]. Available: http://5gaa.org/wp-content/uploads/2017/12/Final-report-for-5GAA-on-cellular-V2X-socio-economic-benefits-051217 FINAL.pdf [16] O. Brandl, “V2X traffic management,” Elektrotechnik und
Informationstechnik, vol. 133, no. 7, pp. 353–355, 2016. [Online]. Available: http://dx.doi.org/10.1007/s00502-016-0434-6
[17] M. Vlaanderen, “kosten ( algemeen voor Vlaanderen ) met betrekking tot luchtverontreiniging en klimaatverandering Studie uitgevoerd in opdracht van MIRA , Milieurapport Vlaanderen,” no. december, 2010. [18] “In-vehicle signage service (IVS).” [Online]. Available:
https://www.c-roads-germany.de/english/c-its-services/ivs/
[19] “Cost-Effectiveness Analysis.” [Online]. Available:
https://www.herc.research.va.gov/include/page.asp?id=cost-effectiveness-analysis#what-is-cea
[20] Paul M. Muchinsky, “No Title No Title,” Psychology Applied to Work: An Introduction to Industrial and Organizational Psychology, Tenth Edition Paul, vol. 53, no. 9, pp. 1689–1699, 2012.
[21] @kylesamani, “On The Network Effects Of Stores Of Value,” 2018. [Online]. Available: https://hackernoon.com/on-the-network-effects-of-stores-of-value-4286f6c98cdc?fbclid=IwAR35Esrx2SbIet3yUCmxj– LU0OhUM1EXcPvLn8WVufkxqIfCrX5wIh8Q70
Contents
I Literature review 3
1 Investment decisions for public authorities 4
1.1 Evaluation methods . . . 5 1.1.1 Cost-benefit Analysis . . . 5 1.1.2 Multi-criteria decision-making . . . 7 1.1.3 Cost-effectiveness analysis . . . 8 1.1.4 Selected method . . . 9 1.2 Cost-Benefit Analysis . . . 9 1.2.1 Socio-economic benefits . . . 10 1.2.2 Investment costs . . . 10
1.2.3 Procedure and performed indicators of a CBA . . . 10
1.2.4 Issues of the standard CBA model . . . 12
1.2.5 Criticism on the CBA . . . 14
2 Cooperative intelligent transportation systems 16 2.1 Intelligent transportation systems . . . 16
2.2 Cooperative intelligent transportation systems . . . 17
2.2.1 V2X protocol . . . 18
2.2.2 V2X technology . . . 20
2.2.3 Required infrastructure . . . 21
2.2.4 Benefit types of C-ITS . . . 23
2.3 C-ITS Services . . . 23
2.4 In-vehicle signage . . . 25
2.4.1 Service description . . . 25
2.4.2 Benefits . . . 25
2.5 In-vehicle speed limits . . . 26
2.5.1 Service description . . . 26
2.6 Probe vehicle data . . . 27
2.6.1 Service description . . . 27
2.6.2 Benefits . . . 28
II Methodology 29 3 Methodology overview and highway segment information 30 3.1 Overview of the methodology . . . 30
3.2 Highway segment information . . . 31
3.2.1 C-ITS correction factors . . . 34
3.2.2 Annual vkm and car density . . . 34
4 Socio-economic benefits expressed as monetary values 36 4.1 TEA benefits from literature . . . 36
4.2 Benefit over adoption rate . . . 39
4.2.1 Adoption scenarios . . . 39
4.2.2 Network effect . . . 39
4.2.3 Total benefit . . . 41
5 Emission benefit on the highway segment 42 5.1 Composition of the European vehicle fleet . . . 43
5.2 Emission of the vehicle types per km . . . 49
5.2.1 Emission of petrol cars per km . . . 49
5.2.2 Emission of diesel cars per km . . . 50
5.2.3 Emission of electrified cars per km . . . 54
5.2.4 Emission of LPG and natural gas cars per km . . . 54
5.3 Total emission on the highway segment . . . 55
5.4 Socio-economic cost per emission type . . . 56
6 Safety benefit on the highway segment 58 6.1 Number of accidents per vkm . . . 60
6.1.1 Number of fatalities per vkm . . . 60
6.1.2 Number of serious and slight injuries per vkm . . . 62
6.2 Socio-economic accident costs. . . 65
7 Time loss and congestion benefit on the highway segment 67 7.1 Socio-economic time loss cost . . . 67
8 Investment cost expressed as monetary value 70
8.1 Investment cost central ITS subsystem per highway km . . . 70
8.2 Investment cost roadside ITS subsystem per highway km . . . 72
8.3 Investment costs for the highway segment . . . 74
9 Sensitivity analysis and Monte Carlo simulation 75 9.1 Sensitivity analysis . . . 75
9.2 Monte Carlo simulation . . . 75
9.2.1 Distributions of the model input . . . 76
III Results and discussions 80 10 CBA model for the deployment of the TEA 81 10.1 Benefit over adoption rate . . . 82
10.2 Emission benefit on the highway segment . . . 85
10.2.1 Composition of the European vehicle fleet . . . 85
10.2.2 Total emission on the highway segment . . . 85
10.2.3 Emission cost on the highway segment . . . 89
10.2.4 Emission benefit on the highway segment . . . 90
10.3 Safety benefit on the highway segment . . . 95
10.3.1 Number of accidents on the highway segment . . . 95
10.3.2 Total accident cost on the highway segment . . . 95
10.3.3 Safety benefit on the highway segment . . . 96
10.4 Time loss and congestion benefit on the highway segment . . . 99
10.5 Socio-economic benefits on the highway segment . . . 100
10.6 Investment costs for the highway segment . . . 104
10.7 Outcome of the CBA . . . 104
11 Sensitivity analysis 106 11.1 Sensitivity analysis of the benefit models . . . 106
11.1.1 Emission benefit model . . . 106
11.1.2 Safety benefit model . . . 112
11.1.3 Time loss and congestion benefit model . . . 114
11.2 Sensitivity analysis of the highway segment data . . . 115
12 Public recommendations regarding the deployment of the TEA 118 12.1 Public recommendations per adoption scenario . . . 118
List of Figures
1.1 The procedure to perform a CBA. . . 11
2.1 Interconnection and operation in ITS [1]. . . 18
2.2 V2X as an umbrella term for all vehicle communication partners [2]. . . . 19
2.3 The C-ITS interaction based on the short-range technology [3]. . . 21
2.4 A drawing of a potential C-ITS landscape [3]. . . 22
3.1 Schematic overview of the methodology. . . 31
4.1 Schematic overview of the socio-economic benefit methodology. . . 37
4.2 Allocation factors for summing the C-ITS service benefits. . . 38
5.1 Schematic overview of the emission benefit methodology. . . 43
5.2 The forecasted number of passenger cars in the EU, based on data from 2015 until 2019. . . 44
5.3 The forecasted number of new inscribed passenger cars in the EU, based on data from 2017 and 2018. . . 45
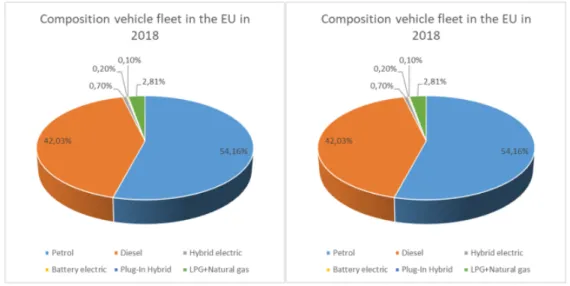
5.4 The composition of the European vehicle fleet and new inscriptions in 2018. 46 5.5 The most aggressive uptake for the evolution of the new inscribed cars in the EU in order to achieve net-zero greenhouse gas emission by 2050. . . . 47
5.6 The evolution of the composition of new inscribed cars in the EU by vehicle type. . . 47
5.7 The evolution of the composition of the European vehicle fleet by vehicle type. . . 48
5.8 The number of vehicles per vehicle type in the EU over time. . . 48
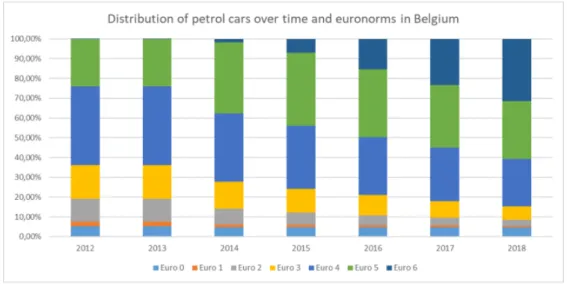
5.9 The distribution of Belgian petrol cars over euronorms from 2012 until 2018. . . 49
5.10 The forecasted average emission of petrol cars for each gas type in Bel-gium, based on data from 2012 until 2018. . . 51
5.11 The distribution of Belgian diesel cars over euronorms from 2012 until 2018. 52 5.12 The forecasted average emission of diesel cars for each gas type in Belgium,
based on data from 2012 until 2018. . . 53 5.13 The foretasted distribution of LPG and CNG vehicles in Belgium, based
on data from 2008 until 2018. . . 55 6.1 Schematic overview of the safety benefit methodology. . . 59 6.2 Schematic overview of the methodology to calculate the number of fatal
accidents per vkm. . . 61 6.3 The forecasted number of road fatalities in the EU, based on data from
2007 until 2016. . . 61 6.4 The forecasted number of car vkm on highways in the EU, based on data
from 2010 until 2016. . . 62 6.5 Schematic overview of the methodology to calculate the number of serious
and slight injury accidents per vkm. . . 63 6.6 The forecasted number of accidents that cause fatalities and injuries in
the EU, based on data from 2007 until 2016. . . 64 7.1 Schematic overview of the time loss and congestion benefit methodology. . 68 8.1 Schematic overview of the methodology to calculate the investment cost. . 71 8.2 Schematic overview of the methodology to calculate the central ITS
sub-system investment cost per highway km. . . 72 8.3 Schematic overview of the methodology to calculate the roadside ITS
subsystem investment cost per highway km. . . 73 9.1 The estimated normal distribution of the number of lanes in Flanders. . . 77 9.2 The estimated normal distribution of the distance between consecutive
vehicles in Flanders. . . 78 9.3 The estimated normal distribution of the fraction of highways that is
already deployed with ITS in Flanders. . . 78 9.4 The estimated normal distribution of the average car age in Flanders. . . 79 9.5 The estimated triangular distribution of the car speed in Flanders. . . 79 10.1 The different provided adoption scenarios over time. . . 82 10.2 The benefit types of the TEA in function of the adoption rate. . . 83 10.3 The benefit types of the TEA over time for PO1 towards a non-ITS
de-ployed highway. . . 83 10.4 The benefit types of the TEA over time for PO2 towards a non-ITS
10.5 The benefit types of the TEA over time for PO3 towards a non-ITS de-ployed highway. . . 84 10.6 The evolving emission on 1 km highway with 3 lanes in the EU split up
over emission types. . . 86 10.7 The evolving CO2 emission on 1 km highway with 3 lanes in the EU split
up over vehicle types. . . 86 10.8 The evolving CO emission on 1 km highway with 3 lanes in the EU split
up over vehicle types. . . 87 10.9 The evolving VOCs emission on 1 km highway with 3 lanes in the EU
split up over vehicle types. . . 87 10.10The evolving NOx emission on 1 km highway with 3 lanes in the EU split
up over vehicle types. . . 88 10.11The evolving PM emission on 1 km highway with 3 lanes in the EU split
up over vehicle types. . . 88 10.12The emission cost for 1 km highway with 3 lanes in the EU over time and
emission types. . . 89 10.13The emission cost for 1 km highway with 3 lanes in the EU over time and
vehicle types. . . 90 10.14The emission benefit per adoption scenario for highway segment A over
time. . . 91 10.15The emission benefit for highway segment A over time and vehicle or
emission types for PO1. . . 92 10.16The emission benefit for highway segment A over time and vehicle or
emission types for PO2. . . 93 10.17The emission benefit for highway segment A over time and vehicle or
emission types for PO3. . . 94 10.18The number of inhabitants that pass away or suffer serious or slight
in-juries on 1 km highway with 3 lanes in the EU over time. . . 95 10.19The accident cost for 1 km highway with 3 lanes in the EU over time and
accident types. . . 96 10.20The safety benefit per adoption scenario for highway segment A over time. 97 10.21The safety benefit for highway segment A over time and accident types
for PO1. . . 97 10.22The safety benefit for highway segment A over time and accident types
for PO2. . . 98 10.23The safety benefit for highway segment A over time and accident types
10.24The time loss and congestion benefit per adoption scenario for highway
segment A over time. . . 99
10.25The TEA benefit per adoption scenario for highway segment A over time. 101 10.26The TEA benefit for highway segment A over time and benefit category for PO1. . . 101
10.27The TEA benefit for highway segment A over time and benefit category for PO2. . . 102
10.28The TEA benefit for highway segment A over time and benefit category for PO3. . . 102
10.29The NPV of the TEA benefit for highway segment A over the subdivision of the benefit types (emission as emission types) for PO2. . . 103
10.30The NPV of the TEA benefit for highway segment A over the subdivision of the benefit types (emission as vehicle types) for PO2. . . 103
10.31The TEA investment cost per adoption scenario for highway segment B over time. . . 104
10.32The outcome of the CBA for the deployment of the TEA per adoption scenario for highway segment B over time. . . 105
11.1 Tornado chart emission benefit PO2 2030 for composition of the vehicle fleet. . . 107
11.2 Tornado chart emission benefit PO2 2030 for input parameters composi-tion petrol and diesel vehicles. . . 108
11.3 Tornado chart emission benefit PO2 2030 for the emission of petrol vehicles.108 11.4 Tornado chart emission benefit PO2 2030 for the emission of diesel vehicles.109 11.5 Tornado chart emission benefit PO2 2030 for the emission of hybrid elec-tric vehicles. . . 109
11.6 Tornado chart emission benefit PO2 2030 for the emission of plug-in hybrids.110 11.7 Tornado chart emission benefit PO2 2030 for the emission of LPG and natural gas vehicles. . . 110
11.8 Tornado chart emission benefit PO2 2030 for the CO2 emission. . . 111
11.9 Tornado chart emission NPV PO2 for the emission costs. . . 111
11.10Tornado chart emission NPV PO2 for the emission benefits. . . 112
11.11Tornado chart safety NPV PO2 for the safety input data. . . 113
11.12Tornado chart safety benefit PO2 2030 for the number of inhabitants that suffer an accident. . . 113
11.13Tornado chart safety benefit PO2 2030 for serious injuries input data. . . 114
11.14Tornado chart NPV PO2 for the high level input data. . . 116
11.15Tornado chart NPV PO2 for the annual vkm input data. . . 116 11.16Tornado chart NPV PO2 for the car frequency regular traffic input data. 117
12.1 The average NPV for the deployment of the TEA in PO1 over the C-ITS coverage and adoption rate to start the deployment. . . 120 12.2 The average NPV for the deployment of the TEA in PO2 over the C-ITS
coverage and adoption rate to start the deployment. . . 121 12.3 The average NPV for the deployment of the TEA in PO3 over the C-ITS
coverage and adoption rate to start the deployment. . . 121 12.4 The distribution of the NPV in PO2 for 50% C-ITS coverage and 10%
adoption rate. . . 122 12.5 The distribution of the NPV in PO3 for 30% C-ITS coverage and 5%
List of Tables
2.1 Examples of V2V, V2I and V2P services. . . 24
2.2 Examples of V2V, V2I and V2P services categorised as information, warn-ing and actuation services. . . 24
2.3 The benefits of the in-vehicle signage service on highways. . . 26
2.4 The benefits of the in-vehicle speed limits service on highways. . . 27
2.5 The benefits of the probe vehicle data service on highways. . . 28
3.1 The highway information of an arbitrary highway segment in the EU. . . 33
4.1 The TEA benefits from literature for a 100% adoption per benefit type and C-ITS service. . . 38
4.2 The total TEA benefits per benefit type for a 100% adoption rate. . . 39
5.1 The average emission per euronorm and gas type for petrol cars. . . 50
5.2 The average emission per euronorm and gas type for diesel cars. . . 50
5.3 The average emission of a LPG and CNG vehicle as a fraction of a petrol car per gas type. . . 54
5.4 The average car age in all countries of the EU. . . 56
5.5 The socio-economic cost for different emission types in Flanders in 2015. . 56
5.6 The socio-economic cost for different emission types in the EU in 2016. . . 57
5.7 The socio-economic cost for different emission types in the United King-dom and the Netherlands in 2012. . . 57
6.1 Correction factors for unreported accidents in 2006. . . 60
6.2 The external socio-economic accident cost split up over categories in Bel-gium in 2016. . . 65
6.3 The external socio-economic accident cost split up over categories in the EU in 2016. . . 65
6.4 The external socio-economic accident cost in the United Kingdom and the Netherlands in 2012. . . 66 7.1 The delay and deadweight loss cost for passenger cars at highways in the
EU. . . 68 7.2 The VOT per vehicle for different vehicle types in Flanders. . . 69 8.1 The CAPEX and OPEX of the central ITS subsystem. . . 71 8.2 The CAPEX and OPEX of the roadside ITS subsystem. . . 73 9.1 The distribution properties of the model input. . . 77 10.1 The three different highway segments used to discussed the obtained results. 81 10.2 The performed indicators of the CBA model for the deployment of the
Glossary
BCR Benefit-cost ratio. 11, 12, 30, 105
C-ITS Cooperative intelligent transportation systems. iv, xi, xii, xv, xix, xx, 1, 2, 9, 16–18, 20–25, 30–34, 38–41, 70, 74–76, 81, 82, 100, 104, 115, 118–123, 126, 127, 129
C-V2X Cellular V2X. 20
CAM Cooperative awareness messages. 27
CAPEX Capital expenditures. xxi, 10, 70–73, 104
CBA Cost-benefit analysis. iv, xi, xiii, xv, xviii, xxi, 5–15, 30, 57, 67, 74, 81, 104, 105, 123, 129
CEA Cost-effectiveness analysis. 8, 9
CNG Compressed natural gas. xvi, xx, 54, 55, 69 DSRC Dedicated short range communications. 20
EU European Union. xv–xvii, xx, xxi, 1, 20, 24, 31, 33, 44, 45, 47, 48, 55–57, 60–62, 64–69, 85–90, 95, 96, 126, 129
EV Electric vehicle. 43, 54, 69, 85
GSM Global system for mobile communications. 17 IRR Internal rate of return. 11, 12, 30, 105
ITS Intelligent transportation systems. xiii, xv–xvii, xxi, 1, 16–18, 20–23, 31–34, 41, 70–74, 76–78, 81–84, 100, 104, 115, 126
LPG Liquefied petroleum gas. xii, xvi, xx, 43, 54, 55, 69 MCDM Multi-criteria decision-making. 7–9
NPV Net present value. xviii, xix, 11, 12, 30, 75, 76, 100, 103, 105, 111–113, 115–122, 127
OPEX Operating expenditures. xxi, 10, 70–73, 104 pkm passenger kilometers. 60, 68
PM Particulate matter. xvii, 26–28, 38, 39, 42, 50, 54, 56, 57, 85, 88–90 PO1 Adoption scenario 1. xvi–xix, 39, 83, 90, 92, 96, 97, 99–101, 118, 120
PO2 Adoption scenario 2. xvi–xix, 39, 75, 84, 90, 93, 96, 98–100, 102, 103, 105, 107– 117, 119, 121, 122
PO3 Adoption scenario 3. xvii–xix, 39, 84, 90, 94, 96, 98–100, 102, 105, 119, 121, 122 RSU Roadside unit. 18, 20, 22, 23, 25–27, 31, 33, 70–73, 104, 105, 118
TEA Traffic efficiency applications. iv, xii, xiii, xvi–xxi, 1, 2, 16, 30–32, 34, 36–40, 70, 74–76, 81–84, 91, 101–105, 118–121, 123, 124, 126–129
USA United States of America. 20 V2C Vehicle-to-cloud. 19 V2H Vehicle-to-home. 19 V2I Vehicle-to-infrastructure. xx, 19, 20, 22–25, 31 V2N Vehicle-to-network. 19, 20, 22, 23 V2P Vehicle-to-pedestrians. xx, 19, 20, 23, 24 V2V Vehicle-to-vehicle. xx, 19, 20, 23, 24 V2X Vehicle-to-everything. xi, xv, 18–20, 23
vkm vehicle kilometers. xii, xvi, xviii, 34, 35, 42, 55, 59–63, 67–69, 99, 115, 116 VOCs Volatile organic compounds. xvii, 26–28, 38, 39, 42, 50, 54, 56, 57, 82, 85, 87 VOT Value of time. xxi, 68, 69
Introduction
Nowadays our society is facing a number of major challenges that have to be resolved. In order to reduce the impacts of climate change, the European Union EU wants to become the first climate neutral continent by 2050 [4]. The Flemish government wants to reduce the number of traffic fatalities to 200 by 2020. However, after years of decline, the number increased again in 2019 [5]. In order to achieve those goals, road transport has to evolve. Hence, both the EU and the Flemish government are constantly looking for new opportunities to reduce the impacts of road transport. The development of new technologies is one of those opportunities.
One of the promising technologies is cooperative intelligent transportation systems C-ITS. It is a first step towards fully autonomous vehicles. The C-ITS technology enables intelligent transportation systems ITS stations, such as vehicles, roadside equipment, traffic control centers and nomadic devices to share information with each other. With benefits such as improved road safety, reduced congestion, optimised traffic efficiency, increased service reliability and lowered energy consumption, the potential of C-ITS cannot be neglected [6]. A wide range of C-ITS services exist, though this dissertation focuses on the inter-urban services, categorized as the traffic efficiency applications TEA. These are in-vehicle signage, in-vehicle speed limits and probe vehicle data.
A successful implementation of C-ITS requires investments from both private and public stakeholders. Private stakeholders rely on business models to find the economic vi-ability of such projects. Though, public stakeholders need to consider the socio-economic impacts too. This master dissertation aims to develop a model that supports the deci-sion maker in evaluating the socio-economic viability of the TEA on a highway segment for cars. In order to set up this model, an investment evaluation method for public authorities has to be chosen that will serve as baseline for the implementation of this model. This method will then in depth be discussed. Secondly, C-ITS, different service types and in more detail the TEA and their benefits will be explained to the reader.
Then, all socio-economic benefits and investment costs on inter-urban roads of the TEA will be listed, studied, quantified and implemented in the model. A sensitivity analysis will be performed in order to investigate the robustness of the model to its input data. Lastly, a Monte Carlo simulation will help to form and support public recommendations regarding the deployment of the TEA in Flanders.
This master dissertation will contribute in two ways. Firstly, it allows the reader to gain more insight in the socio-economic benefits, investment costs and the evaluation of the socio-economic viability of the TEA and in general all C-ITS services. Secondly, the developed model will be a useful tool to support the decision maker in deciding whether to deploy the TEA on a highway segment.
Part I
Chapter 1
Investment decisions for public
authorities
The transport infrastructure is one of the drivers of the economic performance of a mod-ern society. To maintain or further improve its quality, a lot of road constructions have to be executed. Although these constructions provide multiple benefits for the society, some negative impacts have to be incorporated as well [7]. For instance, building a new highway has influence on the travel time, safety and economy, however it also causes noise pollution, visual intrusion and extra carbon emission. Hence, whenever the public authority decides whether to invest in the new highway, this broad range of impacts has to be considered [8].
To decide whether a transport project is worth the investment, a comprehensive analysis has to be performed. Due to human frailty, this analysis is highly susceptible to the the decision maker’s preferences. To overcome this issue, evaluation methods subject to certain regulations have been developed. These methods also support the decision makers. How benevolent the decision makers may be, there are psychological reasons why failure of taking the right decision is not excluded. Examples are the difficulty to abandon the idea previously preferred, the difficulty to consider multiple aspects, and humanity rapidly making a decision based on its instinct [7].
Evaluation methods are thus developed to incorporate all impacts a project causes, reduce the impact of the personal favour of the decision makers and decrease the chance of failure due to psychological reasons. In this chapter some evaluation methods are discussed and the preferred method for further usage in this dissertation is studied in more detail.
1.1
Evaluation methods
1.1.1 Cost-benefit AnalysisIn 1844 the cost-benefit analysis CBA idea was invented by the French economist Jules Dupuit. It lasted until the 1960s, when the decision-makers in the Western countries started to reorganize the authorities’ expenses after the long period of economic growth, before it began to be used [9]. In the previous decades more and more countries, such as England, the Netherlands, Germany, Sweden, the United States, Australia and New Zealand have started to use CBA and to conduct research to improve its framework [7]. The Dutch government even regulated that decisions regarding the deployment of large transportation infrastructure have to be supported by a CBA [10].
Concept
The CBA method tries to evaluate all potential socio-economic impacts to determine whether the investment is profitable for the community [9]. Firstly, all incorporated socio-economic costs and benefits are expressed in monetary values. Whenever some cost or benefit occurs in multiple years, the discount rate is used to calculate its present value. Having all these monetary values, the total cost and benefit can be computed. Finally, indicators, such as overall return on investment, can be performed to evaluate the socio-economic viability of the project [8].
Advantages and disadvantages
Mackie et al. state that “An important advantage with using CBA is that it is a way to overcome cognitive, structural and process-related limitations and biases in decision making” [7, p.3]. Though, there is controversy among economists and spatial planners about the value of the CBA model. They declare that “CBA is found to be inadequate to incorporate and assess multiple, often conflicting objectives, criteria and attributes like environmental and social issues which are usually intrinsically difficult to quan-tify” [10, p.790].
As mentioned above, the CBA method expresses all socio-economic impacts as mon-etary values. To obtain these monmon-etary values, the willingness to pay can be used. In this way the weight of each impact is based on the citizens’ priorities instead of the politicians. This advantage comes with a disadvantage. It immediately causes that the CBA method can neither consider the popularity nor the controversy of the project nor the possibility to fund it nor the strategic objectives of the public authority [7].
Since these monetary values are calculated using the discount rate, the method is able to deal with the time value of money. The longer the project’s lifetime, the more important this is in evaluating the investment. Other methods seem to struggle with this [7].
Another advantage of expressing each impact as a monetary value lies in the ability to use money metrics such as return on investment and benefit-cost ratio. These easily evaluate the viability of the project. Performing a sensitivity analysis and investigating the risks and uncertainties is therefore also possible. In that way the impact of certain parameters’ variability can be considered. Although the clear advantage, it may not be forgotten that certain impacts are difficult to express in monetary values. The question remains how to handle these [7].
According to [11], the CBA method assumes all monetary values of incorporated impacts to be exact values. In reality these values can sometimes only be computed using demand forecasts, cost estimates, benefit valuations and effect assessments. The outcome is therefore influenced by forecasting and measurements errors. The question is to what degree the conclusions of the CBA model are still valid. Asplund and Eliasson state that “Our results show that uncertainties with regard to valuations and effects cause negligible losses of total net benefits, while the losses caused by uncertainties re-garding investment costs and transport demand matter more, but nowhere near the point at which CBA results become useless or misleading” [11, p.204].
As already mentioned in the introduction of Chapter 1, a public investment has an impact on the entire society. The CBA method tries to take all affected parties into account while evaluating the investment. This is an important advantage [7].
In case of mega projects, CBA faces difficulties for three reasons. Firstly, there is no clear alternative to compare the project with. Secondly, these mega projects tend to have macroeconomic effects, which are difficult to evaluate. Lastly, these kind of projects are politically influenced before the evaluation even starts [7].
Despite the drawbacks of the CBA method, it remains a useful and widely used tool. It is most valuable when multiple projects with similar objectives and impacts need to be evaluated.
1.1.2 Multi-criteria decision-making
The first known work on multi-criteria decision-making MCDM was published by Ben-jamin Franklin, a famous American statesman. In 1906 economist Vilfredo Pareto pub-lished ’Manual of Political Economy’. Together with the work of Francis Edgeworth, which was published in 1881, these form the basis of the modern MCDM method [12]. It is still unclear to what extent the MCDM method is used today. Nevertheless, Annema et al. [10] declare that it has been employed more frequently as an evaluation method for transport projects in the last years.
Concept
In essence, evaluating a transport project is a problem statement that is characterized by multiple actors, criteria and objectives. The MCDM method exploits this structure to approach the evaluation. It exists out of a set of objective functions that needs to be optimized while being subjected to a set of constraints. These objectives and constraints can involve various topics such as technical, institutional and social factors, economic influence and stakeholders [13]. In contrast to the CBA method, no effort is made to convert these to a monetary value. For instance, noise pollution can be expressed in decibel and employment in man-years [14]. Each part of the set of objective functions can be given a certain priority, chosen by the decision makers. This introduces some subjectivity into this evaluation method. After setting up the model, it can be solved using different techniques [13].
Advantages and disadvantages
The MCDM method enables to adjust the priority of each part of the set of objective functions. The preferences of different stakeholders and decision makers can thus be taken into account. In this way the popularity or controversy of the project, the pos-sibility to fund it and the strategic objectives of the public authority can be included. Although this is a clear advantage, it can also be a disadvantage. The outcome is sub-jective to the opinion of the decision makers. Malevolent decision makers can in this way easily affect the evaluation’s outcome to their desires [10].
As mentioned in Section 1.1.1, the CBA method may have difficulty to quantify im-pacts that are difficult to express as monetary values. The MCDM method overcomes this issue by incorporating these impacts qualitatively. In this way unnecessary and difficult translations of impacts to monetary values are avoided [10].
The MCDM, just as the CBA, method is strongly dependent on estimated and fore-casted numbers. Therefore, the outcome is influenced by errors. It is again the question what the impact on the outcome of the evaluation might be [10]. Opposing to the CBA method, no sources were found that state the limited impact on conclusions of this es-timation and forecast errors. It thus may not be concluded that this impact is negligible. Since there is a lack of strict criteria about which impacts should be included and which not, double counting can quickly occur. This disadvantage of using the MCDM can have an impact on the outcome of the evaluation and should therefore be handled with care [10].
As mentioned in Subsection 1.1.1 the Dutch government decided that a CBA is mandatory for every large transportation project. The subjectivity to the decision-makers preference and the quick occurrence of double counting made them prefer the CBA over the MCDM method [10].
1.1.3 Cost-effectiveness analysis
A standard method for the cost-effectiveness analysis CEA was developed by some ex-perts of the U.S. Public Health Service [15]. Therefore this method is mostly applied in healthcare.
Concept
The aim of the CEA method is to determine whether the investment cost of a project is justified. For each alternative a cost needs to be expressed as well as an effectiveness score. This cost and score have to be approached from the society’s perspective. The different alternatives are then ranked on their effectiveness. Afterwards, the dominated alternatives, projects with a higher cost and a lower effectiveness score, are excluded from the evaluation. Next, the incremental cost-effectiveness ratio is calculated. Then again, based on this cost-effectiveness ratio, dominated projects are eliminated. Depend-ing on the willDepend-ingness to pay for one increase in effectiveness, the decision maker can now decide which alternative needs to be selected [15].
This method becomes even more useful when one of the evaluated alternatives is the reference state, which is to not invest. The decision maker is then able to exclude the projects that are outperformed by this reference state [15].
Advantages and disadvantages
As mentioned in the beginning of this section, the CEA method is developed by and for the health care system, therefore literature to apply this method to an infrastruc-ture project is barely found. Consequently, it would be very difficult to perform this method. In particular, calculating the effectiveness score would be challenging without any reference literature.
1.1.4 Selected method
The preferred method to use in the remainder of this master dissertation, is the CBA method. The following arguments were decisive.
Firstly, the CBA method causes the decision-makers’ preferences to be excluded form the evaluation, therefore the outcome will be more objective. Additionally, this dis-sertation is written by a neutral party. Thus, no priorities towards any objectives are present, therefore formulating the problem statement for the MCDM method would be more difficult.
Secondly, the lifetime of a transport project is rather long. Hence, its impact is quite important to incorporate. In this the CBA method outperforms the other methods, as discussed in Section 1.1.1.
Lastly, as mentioned in Section 1.1.1, the CBA method is used in multiple countries and is even mandatory in the Netherlands to evaluate a transportation infrastructure project. Additionally, other methods to evaluate the deployment of cooperative intel-ligent transportation systems C-ITS such as the COBRA+ tool even use this method as their baseline [16]. Clearly, the CBA method is widely used for evaluating transport infrastructure projects [17]. The public recommendations based on the outcome of the CBA method will therefore be more valuable.
1.2
Cost-Benefit Analysis
In this section the CBA method is explained in more detail. It starts with describing what socio-economic benefits and investment costs are. Then, a procedure for evaluating a transport infrastructure project with the CBA method is expounded. Afterwards some issues of the standard CBA method are discussed. To conclude some criticism on this method is reported.
1.2.1 Socio-economic benefits
A socio-economic benefit is a benefit for the entire community. These benefits can be categorised as monetary and non-monetary. Examples of monetary benefits are time sav-ings, energy savings and supply savings. Instances of non-monetary benefits are quality, reputation, safety, environment and morale. Those benefits can recur over or occur in multiple years [18].
In analogy to prior work of TM Leuven, this work only considers safety, time savings and congestion, emission, noise pollution and road damage benefits [19].
1.2.2 Investment costs
Although the socio-economic benefits might be significant, the cost for providing these benefits have to be considered in the evaluation. The investment cost exists out of capi-tal expenditures CAPEX, the cost for the implementation of the project, and operating expenditures OPEX, the cost for running the project [20]. This OPEX includes ongoing costs which are the planned expenditures in the coming time period, labour costs, con-tractor costs and supply or input costs [18]. The investment cost can be defined as all the costs for the public authority in order to deploy the transport infrastructure project.
1.2.3 Procedure and performed indicators of a CBA
The objective of the CBA method is to evaluate the socio-economic viability of a trans-port infrastructure project [8]. In this section, a procedure to execute such a CBA and the possible performed indicators are explained.
Procedure
The procedure consist of four steps, being identification of the costs, calculation of the benefits, comparison of the alternatives and report and planning the action. The first step is called the identification of the costs. Here all costs, thus both the CAPEX and OPEX, are listed. The next step is the calculation of benefits. All immediate, yearly, long-term and ongoing benefits are expressed in the same monetary value as the costs of step one. The third step, which is called comparison of alternatives, compares all considered alternatives on their costs and benefits from the previous steps. If only one alternative is considered, it has to be compared to the reference state, which is to not invest. The last step report and planning the action is based on the previously performed CBA. One of the alternatives is recommended together with a brief plan of actions and other influencing factors [18]. The overall procedure is sketched in Figure 1.1.
Figure 1.1: The procedure to perform a CBA.
Performed indicators
To compare the different alternatives in step three, three indicators have to be computed, namely the internal rate of return IRR, net present value NPV and benefit-cost ratio BCR [18].
The NPV calculates the discounted difference between the benefits and the costs, as shown in Formula 1.1. In this way, it measures the performance of the project. A NPV larger than zero indicates a profitable investment and a NPV smaller than zero indicates an investment that generates losses [18].
N P V (N ) = N X i=0 Bi− Ci (1 + d)i (1.1) With:
Bi = benefits of the project in year i
Ci = costs of the project in year i
N = number of time periods
The IRR is the discount rate that sets the NPV to zero. This is shown in Formula 1.2. In this way, it measures the efficiency of the investment. Whenever the IRR is greater than or equal the cost of capital, the project is worth the investment [18]. The cost of capital is the rate of return that could have been earned by investing the same amount of money into a different project with an equally large risk.
0 = N P V = N X i=0 CFi (1 + IRR)i (1.2) With:
CFi = cash flow in year i
N = number of time periods
The BCR calculates the ratio between the discounted benefits and costs. This is shown in Formula 1.3. The project is economic viable, if the BCR exceeds one [18].
BCR(N ) = PN i=0 Bi (1+d)i PN i=0 Ci (1+d)i (1.3) With:
Bi = benefits of the project in year i
Ci = costs of the project in year i
d = discount rate
N = number of time periods
1.2.4 Issues of the standard CBA model
A major issue of CBA is the absence of an universal standard model. Most authorities define their own specific set of criteria. However, in general these hardly differ [8]. According to an interview with 21 Dutch politicians, the CBA model struggles with some other issues as well. These are thoroughly discussed in this section. An overall conclusion is that the information from the model is not decisive. Hence, it has a supportive political role and the results should be skeptically analysed [10].
Quantification of the benefits
The CBA method is based on expressing every impact as a monetary value. However, to what extend are these quantifications correct and objective? For instance, the value
![Figure 2.3: The C-ITS interaction based on the short-range technology [3].](https://thumb-eu.123doks.com/thumbv2/5doknet/3297533.22232/45.892.140.697.236.697/figure-c-interaction-based-short-range-technology.webp)