Contact: Arno Swart, RIVM
This is a publication of:
National Institute for Public Health and the Environment
P.O. Box 1 | 3720 BA Bilthoven The Netherlands
Page 2 of 7
1
Inactivation of bacteria in aerosols
1.1 Introduction
Due to environmental conditions, such as radiation or temperature, numbers of viable micro-organisms in the air decline. This process is called die-off or inactivation. Here, the term inactivation will be used. In order to include a model for inactivation in the OPS dispersion model, a literature search was conducted and an empirical model was developed. This model relates inactivation to several environmental variables.
1.2 Literature search
Literature was searched in Scopus on title, abstract and keywords: (Staphylococcus OR coli OR Campylobacter) AND (inactivation OR persistence OR die-off OR survival) AND (air OR dust)
A further selection was made by scanning the title and abstracts on reporting effects of environmental conditions, whether a model was presented, whether inactivation rate coefficient were reported, or whether data were provided to estimate inactivation. Articles with analyses of data from earlier research were used to collect additional articles with original data. The article references were stored in an Endnote-database.
Reported inactivation rate coefficients (dimension: per minute) were collected in a spreadsheet. Commonly, inactivation of bacteria in
aerosols proceeds faster within the first minutes after aerosolisation (1st phase) than later (2nd phase) (Cox and Baldwin, 1967; Handley and Webster, 1995; Hoekstra et al., 2015; Poon, 1966,1968; Wathes et al., 1986). It is plausible that aerosols exiting a stable are at least several minutes old, therefore, the 2nd inactivation phase should apply for bacteria in aerosols in the outdoor environment. Based on this
assumption, the reported inactivation rate coefficients of the 2nd fase were collected. A single reported inactivation rate coefficient was assumed to represent the 2nd inactivation phase. Reported inactivation rate coefficients were taken directly from the articles or were derived from plotted concentration-time series.
In addition, the following variables were registered: • Bacteria type.
• Gram staining: Gram positive bacteria have a thicker cell wall than Gram negative bacteria and, therefore, survive generally longer in the environment.
• Aerosol: wet (from a suspension) or dry (from a powder). • Medium: What suspension (water, buffer, culture medium) was
aerosolised. • Temperature (°C).
• Relative humidity (fraction). • Reference to the article.
From the selected articles, also measured time-concentration series of bacteria in artificial aerosols were collected in a second spreadsheet. For each point in time the concentration reduction was calculated,
normalized and log-transformed.
1.3 Model development
Assuming a first order inactivation rate, the reduction of bacteria concentration as a function of time can be described as:
𝑙𝑙𝑙𝑙 �𝐶𝐶𝑡𝑡𝐶𝐶
0� = −𝜇𝜇t (1)
where C0 is the initial bacteria concentration in an aerosol (numbers per volume), Ct is the concentration at time t (minute), and µ is the
inactivation rate coefficient (minute-1). The inactivation rate coefficient was assumed to depend on Gram staining, temperature and relative humidity.
The data were analysed in the statistical software package R (version 3.2.2) and an empirical model was derived in order to predict
inactivation of bacteria in aerosols using lmer in package lmerTEST to fit linear mixed effects and to select the best model. Gram staining, temperature and relative humidity and interactions were included as fixed main effects. Because of the fact that there may be dependences on studies that cannot be explained, the factor article was included as a so-called random effect. Additionally, Gram staining, temperature and relative humidity were explored as random effects:
log(𝜇𝜇𝑘𝑘) = 𝛽𝛽0+ 𝑏𝑏0𝑘𝑘+ (𝛽𝛽1+𝑏𝑏1𝑘𝑘) g + (𝛽𝛽2+𝑏𝑏1𝑘𝑘)T + (𝛽𝛽3+𝑏𝑏3𝑘𝑘)r+𝜀𝜀𝑘𝑘 (2)
where μ is the inactivation rate coefficient, g is Gram staining, T is temperature, r is relative humidity (fraction) and the index k runs over articles. The coefficients bik for the random effects are distributed as N(0,σk) and the error ε_k~N(0,σ_e^2).
The step¬-function in lmerTest was used to select the best model by automatic backward elimination of all effects of linear mixed effect model.
1.4 Results
From 14 articles, 223 inactivation rate coefficients for bacteria in artifically produced aerosols were collected (Brown, 1954; Cox, 1966, 1970; Cox en Baldwin, 1967; Ehrlich et al., 1970a; Handley and
Webster, 1995; Heindel et al., 1993; Hoeksma et al, 2015; Israeli et al., 1994; Müller and Dinter, 1988; Paez-Rubio and Peccia, 2005; Poon, 1968; Teltsch et al., 1980; Wathes et al., 1986). The data encompassed 11 different bacteria, of which the most were from E. coli and S.
marcescens. Of the 11 bacteria, six were Gram positive and five were Gram negative.
From 11 articles, 2058 measured concentrations of bacteria in artifical aerosols as a function of time were collected (Cox and Baldwin, 1967; Cox and Goldberg, 1972; Cox, 1966, 1970; Ehrlich et al., 1970a,
Page 4 of 7
Webster, 1995; Hoeksma et al, 2015; Lighthart, 1973). The data encompassed 15 different bacteria types, of which eight were Gram positive and seven were Gram negative. A number of media appeared toxic and were, therefore, excluded; the other media were water, buffers and liquid culture media. Relative to water the other media appeared to act protective.
The developed model was based on the reported inactivation rate coefficients from experiments at laboratory scale. After model selection, the final model included article and relative humidity as random effects (as intercept and slope, respectively). Gram staining and temperature were selected as fixed effects. A simple relationship for prediction was found:
𝑙𝑙𝑙𝑙 �𝐶𝐶𝑡𝑡
𝐶𝐶0� = −10
−1.81−0.73𝑔𝑔+0.03𝑇𝑇𝑡𝑡 (3)
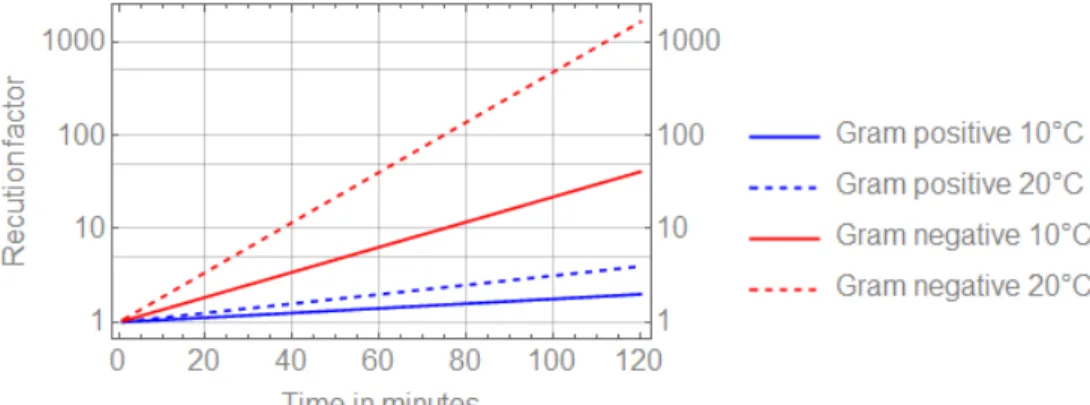
where g is Gram staining: g=0 for Gram negative and g=1 for Gram positive; T is the temperature in °C.
Figure 1 depicts the reduction factor of the bacteria concentration in aerosols over a period of two hours for positive and
Gram-negative bacteria at 10°C and 20°C using equation (3). After two hours, concentration reductions are predicted to be 2, 4, 40 and 1600 times, respectively.
Figure 1. Reduction factor because of inactivation of bacteria in an aerosol as a function of time for Gram-positive and Gram-negative bacteria at 10°C and 20°C.
Figure 2 (left) shows the Normal Q-Q plot of the residuals. The negative residuals deviate from the normal distribution, ie. the distribution is of the residuals is more left-skewed than a normal distribution. This is reflected in the comparison between the log10(µ) values from literature and predicted values, according Gram staining (neg and pos) and literature articles (Figure 2, right plot), where the lower values tend to be more underpredicted and where the higher values tend to be more overpredicted.
Figure 2. Normal Q-Q plot of the residuals (left plot) and log10mu values from literature versus predicted values, according Gram staining (neg and pos) and literature articles (ref) (right plot).
1.5 Discussion
The collected articles did not cover the entire spectrum of
microorganisms. Specifically for Campylobacter no data were available. Zhao et al. (2011) conducted experiments with Campylobacter aerosols, but did not report inactivation data. In this study, Campylobacter DNA was detected only on day one after inoculation, but culturing was not successful. The authors conclude that only dead organisms were present. Possibly, bacterial numbers were too low to culture successfully.
The inactivation model describes bacteria inactivation as a function of time, temperature and gram staining. Furthermore, also bacterial species, aerosol type, relative humidity and suspension medium were identified as influential. However, data on these aspects were too scarce to include them quantitatively in the model.
In most of the collected articles, inactivation of bacteria in aerosols proceeded very fast initially (the first seconds to minutes) and from then on slower. The 1st phase inactivation is highly variable and may differ between dry and wet aerosols (Cox, 1970; Cox and Goldberg, 1972; Hoeksma, 2015).
Page 6 of 7
seen as a protective layer (Hoeksma, Aarnink et al. 2015). However, as remarked upon in the same publication, wet aerosols rapidly lose
moisture, becoming dry aerosols, when the air is not saturated. This suggests that laboratory experiments with wet aerosols may still be representative for field conditions.
Commonly, wet aerosols were produced from bacteria suspended in distilled water or isotonic buffers. Nutrients, such as sugars and amino acids may be protective (Webb, 1960a, 1960b, 1963). Between articles and bacteria, a large variation in initial inactivation rate was reported. The large variation in inactivation rate can be ascribed to the different experimental setups and to differences between types and strains of bacteria. The effect of air humidity on inactivation is non-linear and highly variable. The uncertainty of the predicted inactivation is,
therefore, large. On the one hand, because the inactivation rate is not constant, but decrease gradually with time, it is possible that the
reported model overestimates inactivation for longer times. On the other hand, effects of wind and sunlight at field conditions were not included, whereas these conditions may cause faster inactivation than predicted
References
Brown AD. The survival of airborne microorganisms III. Effects of temperature. Australian Journal of Biological Sciences. 1954;7(4):444-51.
Cox CS, Baldwin F. The toxic effect of oxygen upon the aerosol survival of Escherichia coli B. Journal of General Microbiology. 1967;49(1):115-7.
Cox CS, Goldberg LJ. Aerosol survival of Pasteurella tularensis and the influence of relative humidity. Applied microbiology. 1972;23(1):1-3. Cox CS. Aerosol survival of Escherichia coli B disseminated from the dry state. Applied microbiology. 1970;19(4):604-7.
Cox CS. The survival of Escherichia coli sprayed into air and into
nitrogen from distilled water and from solutions of protecting agents, as a function of relative humidity. Journal of General Microbiology.
1966;43(3):383-99.
Ehrlich R, Miller S, Walker RL. Effects of atmospheric humidity and temperature on the survival of airborne Flavobacterium. Applied microbiology. 1970a;20(6):884-7.
Ehrlich R, Miller S, Walker RL. Relationship between atmospheric temperature and survival of airborne bacteria. Applied microbiology. 1970b;19(2):245-9.
Ehrlich R, Miller S. Survival of airborne Pasteurella tularensis at different atmospheric temperatures. Applied microbiology. 1973;25(3):369-72. Ferry RM, Brown WF, Damon EB. Studies of the loss of viability of stored bacterial aerosols. J HYG. 1958;56(1):125-50+389-403.
Graham DC, Quinn CE, Sells IA, Harrison MD. Survival of Strains of Soft Rot Coliform Bacteria on Microthreads Exposed in the Laboratory and in the Open Air. J APPL BACTERIOL. 1979;46(2):367-76.
Handley BA, Webster AJF. Some factors affecting the airborne survival of bacteria outdoors. J APPL BACTERIOL. 1995;79(4):368-78.
Heindel TH, Streib R, Botzenhart K. Effect of ozone on airborne microorganisms. Zentralbl Hyg Umweltmed. 1993;194(5-6):464-80. Hoeksma P, Aarnink A, Ogink N. Effect of temperature and relative humidity on the survival of airborne bacteria. Wageningen Livestock Research, 2015; Report 864.
Israeli E, Shaffer BT, Lighthart B. Survival and enumeration of aerosolized and freeze-dried genetically engineered E. coli, under controlled environmental conditions. Aerobiologia. 1994;10(2-3):167-73.
Lighthart B. Survival of airborne bacteria in a high urban concentration of carbon monoxide. Applied microbiology. 1973;25(1):86-91.
Müller W, Dinter PS. The survival ability of pasteurella in the
environment with special reference to the airborne situation. Tierarztl Prax Suppl. 1988;3:16-20.
Poon CPC. Studies on the instantaneous death of airborne Escherichia coli. Am J Epidemiol. 1966;84(1):1-9.
Teltsch B, Shuval HI, Tadmor J. Die-Away kinetics of aerosolized bacteria from sprinkler application of wastewater. APPL ENVIRON MICROBIOL. 1980;39(6):1191-7.
Webb SJ. Factors affecting the viability of air-borne bacteria. I. Bacteria aerosolised from distilled water. Canadian journal of microbiology. 1959;5:649-69.
Webb SJ. Factors affecting the viability of air-borne bacteria. II. The effect of chemical additives on the behavior of air-borne cells. Canadian journal of microbiology. 1960;6:71-87.
Webb SJ. Factors affecting the viability of air-borne bacteria. VII. The relationship between the structure of chemical additives and their action on air-borne cells. Can J Biochem Physiol. 1963;41:867-73.