Foreign
in the Netherlands
knowledge workers
10.
Authors Stefan Groot (PBL) Gusta van Gessel Otto Raspe (PBL)This chapter deals with the distribution of foreign knowledge workers across different types of firms and regions. Our findings are that they are more likely to work in foreign and in internationally operating firms than native Dutch knowledge workers. They are also very unevenly spread across the country, working mostly in cities and agglomerations, most prominently in Amsterdam and other Randstad cities. The ‘love for agglomeration’ can largely be explained by the types of firms in a region, but also by economic density, proximity to Amsterdam Airport Schiphol and agglomeration characteristics. Our conclusion therefore is that policies to attract foreign knowledge workers should
incorporate spatial elements in their strategies.
10.1
Introduction
The international migration of highly skilled personnel is increasing rapidly and has become a central aspect of globalization. Policy makers and business leaders are looking with above average interest at these talent flows, not least because todays knowledge-based economies rely more on people with higher skill levels than in the past (OECD, 2001). It has been argued that economies that are better able to attract international knowledge workers are better able to respond to cyclical labour market shortages, increase the stock of human capital, encourage the circulation of the knowledge embodied in highly skilled workers and promote innovation (OECD, 2001).
Many countries have therefore placed attracting foreign knowledge workers high on their political agenda. Since many aim to attract highly skilled workers from the same pool one can argue that the global competition for talent is growing (OECD, 2008) which, with a certain flair for drama, has been labelled ‘the war for talent’ (Chamers et al. 1998, Beechler and Woodward 2009).
The Netherlands also focuses on its capacity to attract, develop, motivate and retain international knowledge workers. This has been formulated in recent policy documents by the Ministries of Economic Affairs (2011) and Infrastructure and the Environment (2011): the ambition is to be in the top ten of most competitive economies, offering an excellent environment for businesses and knowledge workers. So-called human capital agendas per assigned top sector elaborate on specific policy goals in attracting international knowledge workers. Also the Ministry of Education, Culture and Science aims to attract and retain international talents (students).
Although the importance of international knowledge workers has been much emphasised, many labour market aspects of foreign knowledge migration are
poorly understood. In this paper we try to contribute to a better understanding of foreign knowledge workers in The Netherlands. How can ‘foreign knowledge workers’ be characterized, and are they economically different from non-knowledge workers and from their domestic counterparts?
We focused on their international dimensions. What is their origin? Where do they work, in foreign or domestic firms, in internationally operating of nationally focused firms, in what sectors? We especially focused on where they work geographically, combined with the dimensions of internationalisation. We found that foreign knowledge workers are very unevenly spread across the Netherlands. Agglomerations play a crucial role, especially the most internationally operating ones like Amsterdam, The Hague, Rotterdam and Brainport Eindhoven. This means that policy makers focusing on attracting knowledge workers must incorporate a spatial economic vision when offering them ‘an excellent environment’.
10.2
Data and methodology
A number of datasets have been merged to analyse foreign knowledge workers in this chapter. The basis is a large fiscal dataset that includes
employer-reported wages and hours worked of all employees in the Netherlands (Dutch:
Polisadministratie). This dataset has been merged with census data that include
age, gender, country of birth, and all past and present addresses of individuals (Dutch: Gemeentelijke Basisadministratie). For information on firms in particular sector, we rely on the business register of Statistics Netherlands (Dutch: ABR). As these three datasets are exclusively taken from registers, the resulting data set includes all tax paying employees with a current address in the Netherlands. However, it excludes cross-border commuters who work but do not live in the Netherlands and the self-employed. We rely on two data sources pertaining to work location. First: for employees who work for firms that concentrate all their activities in one Dutch municipality − which we know through the regional firm register (Dutch: ABR-Regiobase) − we take that municipality as the location. For firms with establishments in multiple regions, we use the most likely work location as determined by Statistics Netherlands in the municipality of work register (Dutch:
Gemeente Standplaats). Employees who work through employment or pay-roll
agencies are registered in the location of these agencies. They are excluded from our analyses as their actual work location is simply unknown. The observation in our analyses is at the job level. An employee can have several jobs a year. We have removed all jobs lasting less than one month, jobs of less than 12 hours a week,
and jobs earning less than the minimum wage. Also, we only included employees between 18 and 65.
A key element in this chapter is how we define a foreign knowledge worker. As the level of education of foreign employees is not well known, let alone the actual contents of their work, it is problematic to use a definition based on such criteria. The education register − which contains data on Dutch diplomas and degrees − omits people with degrees from foreign institutions. This leaves the labour force survey (Dutch: EBB) as our alternative. However, employees with high positions and foreign workers who have migrated to the Netherlands relatively recently are not well represented in the labour force survey. So we have to take an indirect approach to define a foreign knowledge worker.
We used the labour force survey to distinguish between knowledge and non-knowledge workers and to analyse the relationship between level of education and wages for groups of workers in various age brackets. And, paying no attention to country of birth, we defined knowledge workers as those workers of a certain age with wages above a certain threshold. These thresholds are set in such a way that at least 50 percent of even the lowest paid workers (e.g. those with wages just above the threshold) are higher educated. Overall, the resulting classification has a very strong overlap with the level of education and the classification of highly qualified jobs. Around two thirds are college (hbo) or university graduates. Appendix 10.a (to be published on the website) provides an extensive elaboration on our methodology.
Next, we determined which knowledge workers are foreigners. We define a foreign knowledge worker as someone born outside the Netherlands, who did not immigrate before the age of 18. The latter is important for two reasons: first, many foreign born individuals were born while their Dutch parents temporarily lived abroad; second, foreign born individuals who immigrated to the Netherlands as children were mostly educated in the Netherlands and tend to be very similar to native Dutch individuals.
When we compare foreign to Dutch knowledge workers, it is important to bear in mind that even though the latter group consists almost exclusively of native Dutch people born in the Netherlands, it also includes a few people who lived abroad when they were children with their Dutch expat parents, and some non-native people who immigrated as young children and not for work-related reasons. We use the term Dutch knowledge workers for convenience. Finally, if someone is considered a knowledge worker in at least one year, he or she is also considered as such in all other years even if while earning a lower wage.
10.3
General characteristics of foreign
knowledge workers
As table 10.3.1 shows, over 600,000 foreigners are employed in the Netherlands. Only a sixth are knowledge workers. For comparison: over one third of the Dutch workers can be considered knowledge workers. In comparison with their Dutch counterparts, foreign knowledge workers are younger, work more hours a week and work less often on a part-time basis. Their hourly wage is substantially higher: there is a 15 percent average wage differential. This may imply that even though their share is relatively small they are overrepresented in high-profile jobs. Women make up about a third of all knowledge workers. The share of foreign female knowledge workers is 3 percentage points higher than that of Dutch knowledge workers, but much lower than for foreign born and native non-knowledge workers. The relatively low share of female foreign knowledge workers probably helps explain why there is a low incidence of part-time employment. Their relatively high average wages could imply that they hold higher positions in the internal hierarchy of organisations than part-time employees are likely to hold, which are characterized by a relatively lower share of women.
About 4 percent of all knowledge workers in the Netherlands is foreign. The share of foreigners is higher among non-knowledge workers, namely 11 percent. So the Netherlands attracts more low skilled foreign labour than knowledge workers. The group of foreign non-knowledge workers differs greatly from foreign knowledge workers: they are younger, more often female, more often part-timers and they earn much lower hourly wages. The average annual wage of foreign non-knowledge workers is slightly over a third of that of foreign non-knowledge workers.
1/6
of foreign employees
are knowledge workers
E
e
The contrast between foreign knowledge- and non-knowledge workers becomes also visible when the country of birth is considered. The non-knowledge workers come from all over the world. Nearly half of the knowledge workers come from the European Union, against a quarter of the non-knowledge workers. A third of the non-knowledge workers come from Turkey, Morocco and Poland. The origin of knowledge workers is much more diverse than that of non-knowledge workers. Knowledge workers in the Netherlands mainly come from the United Kingdom, Germany and Turkey.
10.3.1 General characteristics of knowledge workers, 2010
Unit
Knowledge workers Non-knowledge workers
foreign Dutch foreign Dutch
Employees x 1 100,645 2,400,762 500,238 3,970,457
Average age 40.5 42.2 38.6 40.4
(9.3) (10.1) (10.7) (12.4)
Hours per week 36.8 35.6 31.2 30.6
(6.4) (6.9) (9.3) (9.3)
Hourly wage euros 31.4 28.3 13.7 15.8
(31.9) (16.7) (4.0) (4.6)
Annual wage 1) 60,920 52,581 22,579 25,213
(65.502) (33.359) (9.716) (10.402)
Share of women % 34.5 31.2 46.2 53.1
Share of part-time 24.0 31.5 55.2 57.6
Source: Statistics Netherlands/PBL. Standard deviation is in parentheses.
10.3.2 Foreign workers by country of birth, 2010
Foreign knowledge workers Foreign non-knowledge workers
x1 % x1 % European Union 45,312 45.0 143,872 28.8 Germany 8,861 8.8 29,979 6.0 Belgium 4,871 4.8 11,987 2.4 France 4,051 4.0 5,654 1.1 Spain 1,882 1.9 5,991 1.2 Italy 3,454 3.4 10,586 2.1 Portugal 1,173 1.2 7,325 1.5 United Kingdom 9,665 9.6 12,406 2.5 Poland 3,413 3.4 39,915 8.0
Other EU, Eastern Europe 3,099 3.1 10,737 2.1
Other EU (excluding Eastern Europe) 4,843 4.8 9,292 1.9
OECD countries (excluding EU) 17,956 17.8 86,698 17.3
United States 3,758 3.7 4,468 0.9 Canada 1,103 1.1 3,033 0.6 Australia 1,122 1.1 3,516 0.7 Turkey 7,735 7.7 67,040 13.4 Other OECD 4,238 4.2 8,641 1.7 Other countries 37,375 37.1 269,416 53.9 Brazil 981 1.0 4,725 0.9 China 2,261 2.2 12,158 2.4 India 3,860 3.8 5,887 1.2 Russia 3,293 3.3 11,378 2.3 Morocco 4,320 4.3 55,970 11.2
Rest of the world 22,660 22.5 179,298 35.9
Total 100,645 100.0 500,238 100.0
10.4
Characteristics of firms that
employ foreign knowledge workers
We find that foreign knowledge workers are much more likely to work for an internationally oriented firm than any other type of employee included in figure 10.4.1. One aspect of international orientation is foreign control. In the Netherlands about 2 percent of the local business units are under foreign control. Their share in total Dutch employment is slightly below 12 percent. Nearly 30 percent of the foreign knowledge workers work in these firms. This figure is twice as high as for Dutch knowledge workers. From previous research (Statistics Netherlands, 2011b, page 90) we know that many labour immigrants, especially from non-EU countries, work for a company from their home country. More than half of the Japanese immigrants start to work for a Japanese company. This phenomenon can be also observed, though to a lesser degree, in Chinese and American firms. Apart from direct links of workers with the country where the parent company is located, the stronger international orientation of foreign firms is likely to result in greater employment opportunities for foreign workers at these firms, which are probably less focused on the Dutch language and business culture, and require more knowledge about foreign markets.
Another aspect of international orientation is international trade. Foreign knowledge workers work in firms where the average share of goods exports amounts to 15 percent of total turnover. That share is over 50 percent higher than for Dutch knowledge workers. When it comes to imports of intermediaries, the picture is less pronounced, but still the firms with foreign knowledge workers have the highest share of imports in total turnover.
The higher share of foreign knowledge workers is likely to be related to the fact that exporting firms operate in a more international environment. It is, however, also explained to some extent by other characteristics of trading firms: for example, traders tend to be much larger than non-traders and larger firms tend to employ more foreign and more knowledge workers.
Still over half of the foreign knowledge workers work in firms that do not export goods or that have a less than 1 percent share in exports. In figure 10.4.2 one of the reasons for this becomes clear. More than half of the foreign knowledge workers work in financial and commercial services, government, education, health care and other services. These are not known for their goods exports. We could not investigate to what extent these organisations participate in trade in services due to a lack of data. This is an area for further research.
10.4.1 Share of employees that work at a foreign firm and average share of exports (imports) in total turnover (intermediairies) of the firms where employees work, 2010
Source: Statistics Netherlands/PBL. Foreign knowledge workers Dutch knowledge workers %
Foreign non-knowledge workers Dutch non-knowledge workers 0 5 10 15 20 25 30 Import share Export share Foreign firms Commercial services Manufacturing (knowledge intensive)
8% 3% 2% 20% 6% 2% 2% 16% 8% 17% 32% 16% 7% 25% 19% 17%
Trade and transport services
Manufacturing (capital intensive) Financial services
Manufacturing (labour intensive)
10.4.2 Distribution of knowledge workers across industries
Public services
Source: Statistics Netherlands/PBL.
Other
Compared to Dutch knowledge workers, the foreign knowledge workers are overrepresented in the commercial services sector and in trade whereas Dutch knowledge workers are more concentrated in knowledge intensive manufacturing, government, education and health care. Foreign knowledge workers are also overrepresented in employment agencies. Workers with a contract in this flexible and dynamic sector can be employed in all other sectors in the Dutch economy, which may foster flexibility, knowledge diffusion and international orientation (Statistics Netherlands, 2011b, page 87).
10.4.3 Stylized facts of foreign knowledge workers by industry sectors, 2010
Foreign knowledge workers
number share in total knowledge workers average hourly wage wage differential other knowledge workers 1) x1 % euro %
Mining and quarrying 630 9.90 51.82 33.50
Employment agencies 7,794 7.50 21.61 −5.60
Hotels and restaurants 1,504 6.50 19.03 −19.80
Commercial services 25,022 5.70 36.20 9.20
Trade 13,873 5.30 32.50 16.10
Manufacturing (knowledge intensive) 7,666 4.90 30.63 4.50
Manufacturing (capital intensive) 2,802 4.60 25.56 −8.90
Transport 5,887 4.30 29.86 11.50
Other services 3,979 3.80 34.41 6.90
Agriculture 633 3.80 18.95 −18.70
Manufacturing (labor intensive) 1,574 3.70 20.99 −18.30
Financial services 7,084 3.40 36.02 11.10 Education 7,610 3.10 28.10 1.60 Healthcare 8,776 3.00 32.49 8.10 Utilities 329 1.90 32.29 9.50 Construction 2,327 1.80 22.81 −10.30 Government 3,119 1.20 29.45 −1.70
Source: Statistics Netherlands/PBL.
1) Wage differential corrected for age (linear and quadratic) and gender by estimating a Mincereian
wage regression.
In table 10.4.3 the sectors are sorted in order of the share of foreign knowledge workers in the total number of knowledge workers. They are represented in all industries, but their share varies from 1 percent in government to 10 percent in mining. An interesting sector for foreigners is the commercial services sector which employs a quarter of all foreign knowledge workers (see figure 10.4.2). The ratio of foreign to total knowledge workers in commercial services is relatively high at 6 percent (see table 10.4.3). Their average hourly wage was € 36 in 2010 which is the second highest wage rate after mining. They earn 9 percent more than the
Dutch knowledge workers in the same sector. Apparently foreign knowledge workers are relatively attractive for the sector. This is perhaps because well qualified personnel is hard to come by or because the specific type of knowledge that foreign knowledge workers have is much in demand. Perhaps foreign controlled enterprises decide to transfer well-paid employees to their Dutch subsidiary. The same goes for other sectors such as trade and health care.
An extraordinary sector is mining and quarrying. This sector is small, but it has the highest share of foreign knowledge workers, the highest average hourly wage and the greatest wage differential of all sectors.
Employment agencies often provide work for foreign workers, but they have to accept lower wages than Dutch knowledge workers.
Typical sectors with a small share of foreign knowledge workers are government, construction and utilities. Knowledge of Dutch society is very important for government employees.
10.5
Regional aspects
After discussing the general characteristics of foreign knowledge workers, the firms where they work, and their differences from Dutch employees, it is interesting to investigate in which parts of the Netherlands they work. The link with internationally oriented firms is shown in the preceding paragraph. Major towns and border regions have a high concentration of foreign-owned firms and firms involved in international trade (Statistics Netherlands, 2012b, chapter 5 International enterprises in a regional context). Are these regions also attractive for foreign knowledge workers? Does the choice of the region play a role in the relative share of foreign knowledge workers? To answer these questions, we need to know in which municipality the establishment of the firm is located. Then we can show a map with knowledge workers by region.
Both in absolute and in relative terms, many foreign knowledge workers are found in Amsterdam, Rotterdam, The Hague, Utrecht and Eindhoven, and also in Haarlemmermeer where Amsterdam Airport is located. The share of foreign knowledge workers in local employment is particularly high in Amsterdam and neighbouring municipalities. A high share is also found in Petten, where the ECN research facility is located.
Source: Statistics Netherlands/PBL.
1) Map colors (in green): share of foreign knowledge workers in total number of knowledge workers by municipality.
Pie diagrams: share of foreign knowledge workers employed at six different industries in the 22 agglomerations (GSA) as defined by Statistics Netherlands. Size of the pie diagrams relates to the total number of foreign knowledge workers in each agglomeration.
Manufacturing Trade services Financial services Commercial services Public services Other 1 or less 1 to 2% 2 to 4% 4 to 6% 6 to 8% More than 8% GSA borders
Figure 10.5.1 shows the ratio of foreign to the total number of knowledge workers by municipality. This varies from less than 1 percent to 9 percent or more. Two thirds of all foreign knowledge workers work in the 22 Dutch urban regions that have been defined by Statistics Netherlands. Such urban agglomerations consist of several urbanized municipalities (Dutch: Grootstedelijke Agglomeratie). They are outlined on the map. For each urban agglomeration we also show a pie-diagram. The pie sizes relate to the total number of foreign knowledge workers in each agglomeration. That is why the largest agglomerations have the largest circles. The pie also shows the share of foreign knowledge workers employed in six different industries. In Amsterdam, The Hague and Utrecht the highest share of foreign knowledge workers works in commercial services. By contrast, many foreign knowledge workers in the high-tech cluster around Eindhoven work in manufacturing. In agglomerations with transportation hubs (the seaports of Rotterdam and Amsterdam and Schiphol airport) a substantial share of the foreign knowledge workers is employed in trade. Public services play their part in agglomerations where a university is situated: Enschede, Maastricht, Nijmegen, Leiden, Utrecht, Rotterdam and Amsterdam. Delft and Wageningen also have universities, but they are not part of one of the 22 agglomerations. These municipalities are recognizable on the map through their high share of foreign knowledge workers. The Hague, with its many international institutions, has also a major public sector involvement of foreign knowledge workers.
Foreign knowledge workers are more urban than other foreign workers. About two out of five of this latter group work in the periphery. Nevertheless the
agglomerations with a lot of foreign knowledge workers, also have large numbers of non-knowledge foreign workers. In Amsterdam 20 percent of all non-knowledge workers come from elsewhere. It is a melting pot for foreign knowledge and non-knowledge workers (table 10.5.2).
10.5.2 Stylized facts of foreign workers in 22 Dutch agglomerations, 2010
Foreign knowledge workers Foreign non-knowledge workers
number of employees share in total knowledge workers number of employees share in total non-knowledge workers x1 % x1 % Groningen 775 2.2 3,621 5.8 Leeuwarden 223 1.2 1,445 4.5 Zwolle 324 1.3 2,581 6.0 Enschede 792 4.4 4,094 10.3 Apeldoorn 356 1.3 3,156 6.9 Arnhem 675 2.1 4,519 8.8 Nijmegen 1,062 3.9 3,913 8.3 Amersfoort 860 2.5 4,066 9.3 Utrecht 4,318 3.7 17,445 13.9 Amsterdam 20,291 8.3 57,178 20.8 Haarlem 709 2.9 4,085 10.9 Leiden 2,053 5.7 5,784 10.7 ‘s-Gravenhage 7,015 5.8 22,979 16.0 Rotterdam 8,135 4.5 36,185 14.7 Dordrecht 880 2.7 4,860 9.1 Breda 782 2.6 4,303 9.3 Tilburg 681 2.3 4,840 8.3 ‘s-Hertogenbosch 753 2.0 3,743 7.0 Eindhoven 3,781 5.8 11,006 11.3 Geleen/Sittard 489 2.8 2,222 6.8 Heerlen 421 2.0 3,243 7.1 Maastricht 765 4.6 3,551 10.6 Periphery 36,711 3.0 199,105 8.3
Source: Statistics Netherlands/PBL. 5 or less 5 to 10% 10 to 20% 20 to 30% 30 to 40% 40 to 50% More than 50% GSA borders Less than 1% 1 to 5% 5 to 10% 10 to 25% 25 to 50% More than 50%
10.5.3 Internationalisation of firms where foreign knowledge workers are employed1)
1) Map colors (in green): share of foreign knowledge workers that work at a foreign firm in the total number of
In paragraph 10.4 we concluded that firms with an international orientation are attractive for foreign knowledge workers. Foreign firms employ about a quarter of all foreign knowledge workers. And firms with foreign knowledge workers have a higher share of exports in their turnover. In figure 10.5.3 we take a closer look at the regional aspects of this conclusion. The share of foreign knowledge workers in a foreign firm in total number of foreign knowledge workers by municipality differs widely from zero to over 50 percent. The greater the share of foreign firms in local employment of foreign knowledge workers, the darker the shade of green on the map. In small municipalities with a high share it is possible that nearly all foreign knowledge workers are employed in a single or just a few firms under foreign control. That is why municipalities with a high share of foreign knowledge workers in foreign firms are found in all parts of the Netherlands. The municipalities with the highest shares are Amsterdam, Haarlemmermeer, Rotterdam, The Hague, Utrecht, Amstelveen and Eindhoven. But numerous medium-sized towns, such as Terneuzen and Geleen/Sittard, also have a substantial share.
The pie diagrams in figure 10.5.3 show the share of foreign knowledge workers employed at firms by how important their exports are. In line with figure 10.5.2, the size of the circles represents the total number of foreign knowledge workers in each agglomeration. Enschede is an example where a high share of foreign knowledge workers is employed at firms with high export levels (more than 25 percent of turnover). This group includes sectors without exports, such as the University of Twente, but also firms exporting services.
In most agglomerations the majority of foreign knowledge workers are employed in firms without or with low levels of exports in goods (less than 1 percent of turnover). There are some exceptions: particularly border regions are characterized by a relatively high share of foreign knowledge workers. Evidently knowledge workers in the Randstad are employed in firms that are characterized by relatively low export levels, such as financial and commercial services, education and health care. In the border regions manufacturing plays a more important role. In general, there is a strong relationship between the share of foreign knowledge workers employed in the services sector and the average export intensity of firms where they are employed.
10.6
Exploring the geography of foreign
knowledge workers
The previous paragraphs dealt with various aspects of foreign knowledge workers. We considered possible links with internationalisation of firms, and looked at differences between sectors and regions. How does the relative importance of the various aspects that have been addressed in the previous sections explain the distribution of knowledge workers across firms and regions?
10.6.1 Effects on the relative %-share of foreign knowledge workers, 2010
Results of negative binomial regression
(I) without agglomerations (II) agglomerations included
(III) agglomerations as only variable on regional level
parameter (z-value) parameter (z-value) parameter (z-value)
Effect of on the relative share of foreign knowledge workers of:
Foreign firm 212.9 (39.6) 192.5 (37.9) 236.6 (42.0)
Exporter 149.9 (21.2) 155.4 (22.2) 157.4 (21.9)
Doubling the share of exports 25.5 (12.4) 25.5 (12.6) 27.1 (13.0)
Importer −9.5 (−2.0) −7.0 (−1.5) −9.2 (−2.0)
Doubling the share of imports −1.7 (−0.8) −1.3 (−0.6) −1.6 (−0.7)
Doubling the employment density 50.2 (19.1) 16.0 (5.7)
Doubling the distance to Schiphol −29.9 (−23.7) −36.7 (−24.0)
Industry fixed effects
Mining and quarrying 321.3 (7.1) 206.1 (5.6) 191.9 (5.2)
Manufacturing (capital intensive) 22.9 (2.3) 12.5 (1.3) −2.0 (−0.2)
Manufacturing (labour intensive) 14.4 (1.5) 5.0 (0.6) −7.3 (−0.9)
Manufacturing (knowledge intensive) 20.2 (2.3) 2.7 (0.3) −3.4 (−0.4)
Utilities 121.6 (3.4) 70.8 (2.3) 58.9 (2.0)
Construction −14.0 (−1.9) −25.4 (−3.6) −28.2 (−4.1)
Trade 3.5 (0.5) −9.0 (−1.3) −3.1 (−0.4)
Hotels and restaurants −20.7 (−2.4) −37.7 (−5.0) −34.6 (−4.5)
Transport 17.2 (2.0) −0.7 (−0.1) 8.3 (1.0) Financial services 69.4 (6.6) 34.1 (3.7) 44.9 (4.6) Commercial services 75.4 (7.6) 40.8 (4.6) 52.6 (5.7) Government −43.7 (−4.7) −51.5 (−6.0) −57.5 (−7.0) Education 20.7 (2.1) −2.3 (−0.3) −3.6 (−0.4) Healthcare 6.7 (0.8) −13.4 (−1.8) −12.9 (−1.7) Other services 69.7 (6.7) 28.4 (3.1) 32.8 (3.5) Agglomerations Groningen 68.1 (5.2) −11.0 (−1.2) Leeuwarden 19.4 (1.2) −30.0 (−2.3)
10.6.1 Effects on the relative %-share of foreign knowledge workers, 2010 (end)
Results of negative binomial regression
(I) without agglomerations (II) agglomerations included
(III) agglomerations as only variable on regional level
parameter (z-value) parameter (z-value) parameter (z-value)
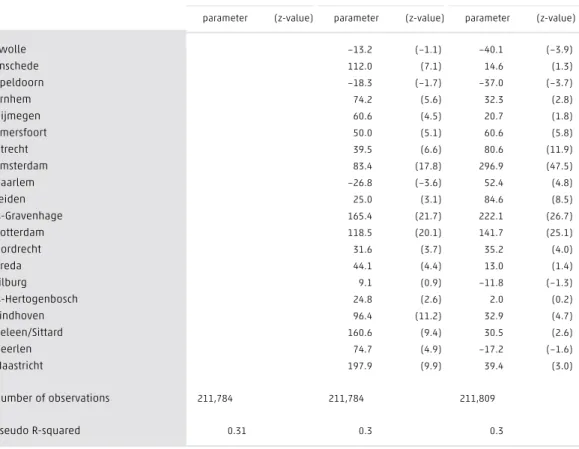
Zwolle −13.2 (−1.1) −40.1 (−3.9) Enschede 112.0 (7.1) 14.6 (1.3) Apeldoorn −18.3 (−1.7) −37.0 (−3.7) Arnhem 74.2 (5.6) 32.3 (2.8) Nijmegen 60.6 (4.5) 20.7 (1.8) Amersfoort 50.0 (5.1) 60.6 (5.8) Utrecht 39.5 (6.6) 80.6 (11.9) Amsterdam 83.4 (17.8) 296.9 (47.5) Haarlem −26.8 (−3.6) 52.4 (4.8) Leiden 25.0 (3.1) 84.6 (8.5) ‘s-Gravenhage 165.4 (21.7) 222.1 (26.7) Rotterdam 118.5 (20.1) 141.7 (25.1) Dordrecht 31.6 (3.7) 35.2 (4.0) Breda 44.1 (4.4) 13.0 (1.4) Tilburg 9.1 (0.9) −11.8 (−1.3) ‘s-Hertogenbosch 24.8 (2.6) 2.0 (0.2) Eindhoven 96.4 (11.2) 32.9 (4.7) Geleen/Sittard 160.6 (9.4) 30.5 (2.6) Heerlen 74.7 (4.9) −17.2 (−1.6) Maastricht 197.9 (9.9) 39.4 (3.0) Number of observations 211,784 211,784 211,809 Pseudo R-squared 0.31 0.3 0.3
Source: Statistics Netherlands/PBL.
Table 10.6.1 shows the results of a negative binomial regression analysis,
whereby the natural logarithm of the number of foreign knowledge workers in an establishment of a firm is related to a set of control variables, several dimensions of internationalisation, and a number of regional characteristics. Because total employment at the firm and the firm establishment, as well as total employment of Dutch knowledge workers were included as explanatory variables, the results are to be interpreted as the effect on the relative presence of foreign knowledge workers in a firm establishment. Furthermore, the parameter estimates that are presented in table 10.6.1 have been converted to percentages. For example, the estimated effect of being a foreign firm in column (I), which is 212.9 percent, implies that if we compare two establishments of firms that are the same on all accounts (also in terms of employment at the firm and the firm establishment), we estimate the share of foreign knowledge workers to be 3.129 times the share of
foreign knowledge workers we would expect if the establishment would be part of a Dutch owned firm.1)) The z-value indicates the extent of significance. The higher
the z-value the stronger the relation between the variable and the relative share of foreign knowledge workers.
The share of foreign knowledge workers in a firm depends greatly on foreign control and exports of goods. A high employment density and a close distance to the Schiphol airport come to the fore as key factors while trying to ‘explain’ share of foreign knowledge workers.
In preceding paragraphs Amsterdam turned out to be the most attractive
agglomeration for foreign knowledge workers. In column (II) we add fixed effects for each agglomeration to the specification of column (I), to measure whether foreign workers are still more attracted to certain cities in the Netherlands after controlling for the characteristics of the firms located in those regions. In this regression, we excluded density and distance of Schiphol so that all regional effects are captured by the agglomeration fixed effects. The estimated parameters have to be interpreted relative to firm establishments located outside the 22 Dutch agglomerations. The results show that even when we control only for firm
characteristics, the relative share of foreign knowledge workers in Amsterdam remains the highest of all Dutch agglomerations.
In column (III) we have added economic density and distance to Schiphol airport as additional control variables. The results show that an important part of the overrepresentation of foreign knowledge workers in Amsterdam is explained by its closeness to Schiphol airport and its high density. Even though we still see a relatively high share of foreign knowledge workers in Amsterdam, it is higher in The Hague and Rotterdam, and also some agglomerations in the border regions: Maastricht, Geleen/Sittard, Enschede and Eindhoven are attractive locations.
10.7
Conclusions
By combining several unique micro datasets this chapter contributes to a better understanding of the labour market aspects of foreign knowledge workers in the Netherlands. Even though they are more likely to work in foreign firms than native Dutch workers (30 percent works for a foreign controlled firm), they mainly exploit their ‘talents’ in domestic firms. Also, they are highly productive: there is
1) Parameters of the negative binomial model can be converted to percentages via the formula: exp(parameter)*100%−100%.
a 15 percent average wage differential in favour of foreign knowledge workers. Furthermore, they are often employed at internationally operating (trading) firms; firms that are important for the international competitiveness of the very open Dutch economy.
Even though they play an important role in the Dutch economy, the total number foreign knowledge workers is still relatively small: about 4 percent of all knowledge workers in the Netherlands. And only a minority of one sixth of all foreigners employed in the Netherlands are knowledge workers. Over one third of the Dutch workers can be counted as knowledge workers. To attract more international knowledge workers, it is important to understand the characteristics of this human capital factor. One key finding in this paper is that foreign knowledge workers tend be strongly overrepresented in the largest agglomerations. The greater Amsterdam region alone employs 22 percent of all foreign knowledge workers. But also agglomerations like Rotterdam, The Hague, Utrecht and Eindhoven attract many foreign knowledge workers. In an effort to ‘explain’ this unequal distribution of foreign knowledge workers we found that even after controlling for the fact that foreign knowledge workers tend to work in foreign firms, certain sectors and exporting firms − and that these firms are also unequally divided over the country − there are strong effects of agglomeration economies for foreign knowledge workers. Regions with a high employment density, and particularly the metropolitan area of Amsterdam attract significantly more foreign knowledge workers than more peripheral regions. Even though the high share in Amsterdam is partially explained by high density and its proximity to Schiphol airport.
The findings of this chapter are highly relevant for policy making. They do not only contribute to a better understanding of the characteristics of foreign knowledge workers, but also show that a macro-economic approach that neglects the importance of agglomerations does not fit the very strong link between foreign knowledge workers in the Netherlands and certain regions with a strong international orientation. We highly recommend incorporating this spatial dimension in a strategy to become an attractive country in this ‘global war for talent’. Clearly, spatial policy that aims to attract foreign knowledge workers is not space-insensitive and will have very different implications for different regions.