1
Fiscal policy and CO
2emissions of new passenger cars in the EU
This version: 4 February 2015*
Reyer Gerlagh, Tilburg University, Netherlands Inge van den Bijgaart, Tilburg University, Netherlands
Hans Nijland, PBL Netherlands Environmental Assessment Agency, Netherlands Thomas Michielsen, CPB Netherlands Bureau for Economic Policy Analysis, Netherlands
Abstract
To what extent have national fiscal policies contributed to the decarbonisation of newly sold passenger cars? We construct a simple model that generates predictions regarding the effect of fiscal policies on average CO2 emissions of new cars, and then test the model empirically. Our empirical strategy combines a diverse series of data. First, we use a large database of vehicle-specific taxes in 15 EU countries over 2001-2010 to construct a measure for the vehicle registration and annual road tax levels, and separately, for the CO2 sensitivity of these taxes. We find that for many countries the fiscal policies have become more sensitive to CO2 emissions of new cars. We then use these constructed measures to estimate the effect of fiscal policies on the CO2 emissions of the new car fleet. The increased CO2-sensitivity of registration taxes have reduced the CO2 emission intensity of the average new car by 1,3 percent, partly through an induced increase of the share of diesel-fuelled cars by 6,5 percentage points. Higher fuel taxes lead to the purchase of more fuel efficient cars, but higher annual road taxes have no or an adverse effect.
JEL Classification Numbers: H30, L62, Q48, Q54, Q58, R48 Key Words: vehicle registration taxes, fuel taxes, CO2 emissions
*. We are grateful for comments from Alice Ciccone, Georgios Fontaras, Herman Vollebergh, Josh Linn,
Lutz Kilian, Stephan Leinert, Rebecca Scott, Christian Huse, Anco Hoen, Robert Kok, Gerben Geilenkirchen, Justin Dijk.
2
1 Introduction
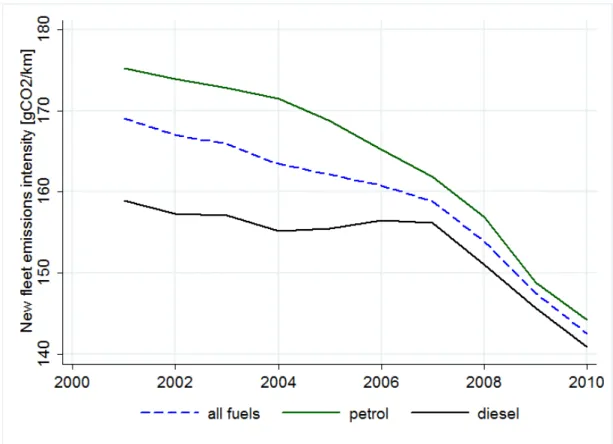
Transport accounts for about 23% of energy-related CO2 emissions (Sims and Schaeffer, 2014), that is 15% of global greenhouse gas emissions (Blanco, Gerlagh and Suh, 2014). Within the EU, passenger cars represent about 12% of EU CO2 emissions.2 In 1995, the European Commission launched a strategy to reduce carbon dioxide emission intensity (i.e. emissions per kilometer) for new cars sold in the European Union. Since then, the emission intensity of new sold cars has come down remarkably, especially since 2007 (Figure 1). In 2011, the strategy was updated with a proposal to reduce EU transport greenhouse gas emissions by 60%, by 2050 as compared to 1990 levels (European Commission, 2011).
The strategy is based on three pillars. The first pillar targets car manufacturers, requiring them to reduce the average emissions of new cars. The associated directive, established in 2009, aims to decrease the average emissions of new sold cars to 130 gCO2/km by 2015, and 95 gCO2/km by 2020 (European Parliament and Council, 2009).3 The second pillar aims to ensure that the fuel-efficiency information of new passenger cars offered for sale or lease in the EU is made available to consumers to facilitate an informed choice. The third pillar aims to influence consumer’s vehicle purchase choices by increasing taxes on fuel-inefficient cars relative to fuel-efficient cars. For our analysis, tax instruments are divided in three categories related to the purchase, ownership and use of a car: the registration tax, the annual road tax and annual income tax for company cars, and the fuel tax.4
The three pillars are expected to reinforce each other. Increasing the tax burden on fuel-intensive cars, relative to the burden on fuel-efficient cars (third pillar), and providing information (second pillar) is expected to increase the sale of fuel-efficient cars, which in turn makes it more profitable for car manufacturers to produce fuel efficient cars (the first
2 http://ec.europe.eu/clima/policies/transport/vehicles/cars/index_en.htm
3 All data on CO2 emission/km in this study are determined according to the NEDC guidelines
(New European Driving Cycle, the prescribed European test cycle).
4 We use purchase tax, registration tax, and acquisition tax interchangeably. Similarly, road
taxes and annual taxes refer to the same fiscal instrument. Due to a lack of data, we did not include annual income tax for company cars in our analysis. See Section 7.
3
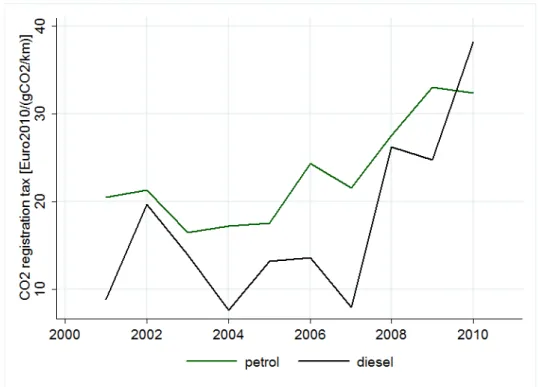
pillar). Our study assesses the effectiveness of the third pillar. We construct measures for the level and CO2 sensitivity of car taxes so that we can compare different tax regimes over countries and years, and we then use these constructed measures to evaluate the effects of these taxes. Figure 2 presents the EU15-average for two of our constructed variables, showing the implementation of the third pillar policy; the figure presents the average CO2 sensitivity of registration taxes in the EU15 for petrol and diesel cars. We elaborate on the construction of this variable in Section 3.2. On the vertical axis, we plot the increase in the registration tax in Euros, for each increase in CO2 emission intensity (gCO2/km), if all other car features remain constant. The figure shows that an increase of the emissions intensity by 10g CO2/km implies, on average, an increase in the registration tax of about €130 in 2001, and €350 in 2010.5
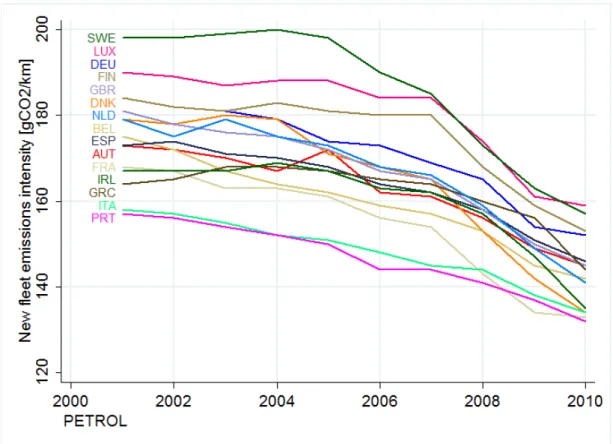
Taxes, including car taxes, are decided on a national level, though. In 2005, the European Commission proposed to harmonise national vehicle registration and annual road taxes (European Commission, 2005), but the proposal was rejected by the member states. Yet, over the years, many EU-countries implemented the third strategy pillar, greening the car taxes though either a revision of purchase taxes, company car taxes or annual road taxes. Figure 3 shows the emissions intensity of petrol cars in the EU15 countries (EEA 2013, Eurostat 2014), and thus presents the effect of changing policies and changes in other variables. Newly sold passenger cars in the different EU15 countries have quite different levels of CO2-emissions, but there is a robust downward trend, again especially since 2007.6 In 2010, average emissions from new cars ranged from 130 gCO2/km (Portugal) to 153 (Germany).7 Since then, emissions have continued to decrease.
5 All prices are deflated with 2010 as base year. For comparison, note that the EU from 2019
will levy a penalty of €95 per gCO2/km if the average CO2 emissions of a manufacturer's fleet
exceed its limit value.
6 The anticipation of regulation EC/443/2009 (European Parliament and Council, 2009) is a
possible explanation for the downward trend after 2007.
7 We did not use so-called ‘super credits’ to calculate average emissions (according to
4
Figure 1: CO2 emission-intensity for new cars, EU15 average8 (Source: Campestrini and Mock, 2011)
5
Figure 2: CO2 sensitivity of registration taxes averaged over EU159
9 A value of 20 €/(gCO2/km) on the vertical axis means that if two cars are identical, in
technical characteristics and tax-exclusive price, but one of the two cars emits 30 gCO2/km
more, then the less fuel-efficient car will pay 20[€/(gCO2/km)] x 30 [gCO2/km] =600€ higher
taxes. The figure uses unweighted averages of the fiscal regimes over all countries. The numbers are reported in Section 8.2, Table 5.
6
Figure 3: CO2 emission-intensity for new petrol cars, by country (Source: Campestrini and Mock, 2011)
The figure also shows substantial differences across countries. CO2 emissions of new cars have declined most rapidly in Sweden and Denmark. There are various possible explanations for the differences between countries, and changes over time in the fuel efficiency. For example, the fall in Sweden’s emission intensity in Figure 3 may be attributed to domestic policies (Huse and Lucinda, 2013), or to convergence to the EU average, whereas Denmark’s move from being average to becoming one of the most fuel-efficient countries might be the consequence of its aggressive car tax policies. Overall, we can sort these explanations into five categories. The first category relates to the EU’s first pillar, which requires manufacturers to sell more fuel efficient cars. For this reason, the portfolio of cars available for purchase is expected to become more fuel-efficient over time. Second, the type of cars bought and their fuel efficiency may partly be explained by trends in consumer preferences. The EU second pillar is related to this cateogory. Third is fiscal policy on registration and road taxes, related to the third pillar. Countries have developed widely different fiscal policies aimed at promoting fuel-efficient cars. Some countries have
7
much more aggressive policies vis-a-vis other countries, and countries moving in the same direction still implemented their policies in different years. Fourth are fuel taxes, which differ substantially between countries, and many countries have seen changes in fuel taxes. Fifth are income and the economic crisis. Higher incomes are associated with larger cars, and lower incomes with smaller, more fuel-efficient cars. In addition, the economic crisis hit the countries very differently. Those countries hit hardest by the crisis are expected to see – all else equal – the largest drop.
In this paper, we focus on the third cause, associated with the third pillar. That is, we address the following research question: to what extent have national fiscal policies contributed to the decarbonisation of newly sold passenger cars? We construct a simple model of a representative agent to generate predictions regarding the effect of fiscal policies on average CO2 emissions of new cars. We study changes at the aggregate level and are interested in differences between countries and changes over time within countries. That is, the model and our econometric analysis do not provide a detailed micro foundation of consumers’ decisions; see Berry et al. (1995) or Meerkerk et al. (2014) for such an analysis. After presenting the model, we build a dataset in which we compare vehicle tax systems across 15 countries over the years 2001-2010. We use a dataset of vehicle-specific taxes, and use these data to characterize each country’s tax system at year t with regards to the average registration and road tax, and the sensitivity of the taxes with respect to the car CO2 emissions. We differentiate taxes by petrol and diesel, so that we construct 8 variables to provide an elaborate characterization of a country’s vehicle tax system for a given year. Both the construction of the multiple tax proxies and the multi-country sample mark important contributions to the empirical literature, which typically has considered a single-country single-event (Hennesy and Tol 2011, Huse and Lucinda 2013, Ciccone 2014, D’Haultfoeuille et al. 2014, Cropper and Chugh 2014).
The constructed variable are used to empirically study the effect of the fiscal treatment, especially the car purchase tax, on the fuel efficiency of newly sold cars. We identify the effect by considering dynamic differences between countries in car taxes and in emission intensities. We control for static differences between countries through country fixed effects, control for income and for common dynamic patters (e.g. EU policies) through time fixed effects. We can identify the effect of fiscal policies on car sales as some countries have consistent low purchase taxes (<30%) that are not very sensitivity to CO2 emissions (Belgium, France, Germany, Italy, Luxembourg, Sweden, United Kingdom), while
8
Spain has low purchase taxes but these have become substantially more CO2 sensitive over the period 2001-2010. Greece has high purchase taxes (>30%) but these became less CO2 sensitive over the years, and the remaining countries (Austria, Denmark, Finland, Ireland, Netherlands, Portugal) have relatively high purchase taxes (>30%), with a CO2 component that substantially increased over the years (>10 €/(gCO2/km)), though the countries differ substantially. Our empirical strategy is based on the correlation between the uneven developments in taxes and patterns in the emission intensities for these countries.
2 Literature
There is an emerging empirical literature on the effects of fiscal policies on the fuel-efficiency of newly sold cars. The general finding is that fiscal policies are an effective tool to influence car purchase decisions. In addition, the literature establishes that purchase taxes are more effective than annual (road) taxes, and that tax reform can cause sizable petrol-diesel substitution.
A strong example of the responsiveness of car purchases to fiscal policies is provided by D’Haultfoeuille et al. (2014). They assess the effect of the system of fees and rebates that existed in France from December 2007 to December 2009. In this system, owners of fuel efficient cars could receive a tax rebate of up to 1000 euros whereas fuel inefficient car owners had to pay a fee of up to 2600 euros. The precise rebate and fee thresholds showed up remarkably in the sales for different car types, with large sales increases just below and drops just above the thresholds.
The effectiveness of car taxes can depend on the subtle features of the policy adopted. The theory of rational choice for car purchases assumes that consumers fully internalize both the expected cost in terms of annual road and fuel taxes, as well as purchases taxes. Empirical evidence however suggests bounded rationality. Consumers do not exploit all available information equally, and tend to give more weight to short-term costs and benefits, known as "consumer myopia” or nearsightedness (DellaVigna, 2009). For example, when deciding on whether to purchase a more fuel efficient car, consumers tend to calculate the expected savings in fuel costs only for about three years (see Greene et al., 2005; Kilian and Sims, 2006; Greene et al., 2013). This nearsightedness is considered a main reason why, compared to annual taxes, vehicle acquisition taxes are more effective in directing consumers’ buying decisions (Brand et al., 2013; Gallagher and Muehlegger, 2011; Klier and Linn, 2012; van Meerkerk et al., 2014).
9
Another phenomenon identified by the literature is the substitution between petrol and diesel cars. When Ireland differentiated its purchase and annual road taxes according to CO2 emission intensities, sales of smaller cars did not go up. Instead, sales of diesel cars increased at the expense of large petrol cars (Hennesy and Tol, 2011, Leinert et al., 2013). This unanticipated shift towards diesel cars reduced the average CO2 emissions by 13 percent in the first year after the tax reform (Rogan et al., 2011). Less advantageous, it also raised NOx emissions (Leinert et al., 2013). The vehicle acquisition tax reform in Norway in 2007 resulted in a drop in CO2 emissions of newly sold cars by 6 gCO2/km in the short run, mainly caused by an increase of diesel market share by almost 23 percentage points (Ciccone, 2014). The tax reform in Denmark in 2007 contributed to the sales of more fuel-efficient cars in the years thereafter. Yet, Mabit (2014) argues that the biggest contribution to the sales of fuel-efficient cars is probably not the tax reform, but technological improvements.
All research discussed above analyses the effect of specific vehicle tax policies in a single country. Hence, these papers cannot control for year-specific effects and the results are not easily generalizable. Our empirical analysis does not consider a single-event in one country, yet studies more broadly the fiscal treatment of car purchases and ownership in relation to car emissions. There are some previous cross-country and panel-data studies on the effect of fuel prices on fuel efficiency (Burke and Nishitateno 2013, Klier and Linn 2013). The effect of the registration and road tax level on car purchases is previously studied in Ryan et al. (2009), who use a panel structure for EU countries. They conclude that vehicle taxes, notably registration taxes, are likely to have significantly contributed to reducing CO2 emission intensities of new passenger cars. Ryan et al. (2009) focus on the average level of registration taxes in a country.10 We take this analysis one step further by constructing measures of the CO2 sensitivity in addition to the level of registration and road taxes. This allows us to exploit differences between EU countries in the stringency and timing of climate-related vehicle fiscal policies. An important part of our study is thus a
10 Note that Ryan et al. (2009) weigh the registration tax measure by vehicle sales, so that in
their analysis the right-hand-side variable depends on policy outcomes. To prevent dependency of right-hand variables on policy outcomes, we construct tax measures that do not use sales for weighing; see footnote 13.
10
more comprehensive characterization of the vehicle tax system that can be used to compare differences across countries and changes over time, based on a large dataset of country-year-vehicle specific prices inclusive and exclusive of taxes.
3 Model
We illustrate the effect of vehicle purchase taxes on the average emission intensity with a simple model. We consider two car types. A representative consumer maximises (expected future) utility u dependent on the current purchase of cars, q1 and q2, and income m net of purchase expenditures x:
max𝑞1,𝑞2𝑢(𝑞1, 𝑞2, 𝑚 − 𝑥) s.t. 𝑠. 𝑡. 𝑝1𝑐𝑞1+ 𝑝2𝑐𝑞2= 𝑥. (1)
where 𝑝𝑖𝑐 are costs per quantity, including registration taxes as well as future variable costs
and annual taxes. The utility function satisfies the standard assumptions on continuity, differentiability, positive derivatives, and concavity. We also assume that both types are normal goods (increasing consumption with increasing income, decreasing consumption with increasing prices) and that the total budget for cars, 𝑥, increases in total income, 𝑚.
We do not model consumers’ care about the environmental performance of cars as such (see Achtnicht 2012 for an analysis along those lines), but focus on the effects of government instruments geared to direct consumers’ choices. We assume that the tax is fully shifted to consumers,11 so that the consumer price of cars is
𝑝𝑖𝑐= (1 + 𝜏
𝑖)𝑝𝑖𝑝, (2)
where 𝜏𝑖 is a type-specific ad valorem tax and 𝑝𝑖𝑝 is the producer price.
11 We abstract here from strategic pricing by car manufacturers. Though this is important as a
mechanism, our results below will hold as long as the car manufacturers pass-through part of taxes. In general, ad valorem taxes may be under- or overshifted under Bertrand competition with differentiated products (Anderson, De Palma and Kreider, 2001). If car manufacturers differentiate prices between countries so as to partly compensate taxes, the effect of fiscal measures will be reduced, and our coefficients will become smaller and less significant.
11
The tax 𝜏𝑖 consists of a uniform component 𝜑 and an environmental component,
where 𝜃 is a relative weight of the environmental component. The two car types have different emission intensity, say grams of CO2 per km, which we denote by 𝛽𝑖. Without loss
of generality, let 𝛽2> 𝛽1, for example because car type 2 is more spacious, has more
weight, or is more fancy. The type-specific tax becomes:
𝜏𝑖= 𝜑 + 𝜃𝛽𝑖. (3)
We are interested in the effect of changes in car taxes on the average CO2 intensity of the car fleet, which we define as
𝐵 =𝛽1𝑞1+𝛽2𝑞2
𝑞1+𝑞2 . (4)
Policy can change the uniform component of the car tax, 𝜑, the environmental component, θ, or both. We define the average car-tax, given by
𝑇 =𝜏1𝑞1+𝜏2𝑞2
𝑞1+𝑞2 = 𝜑 + 𝜃𝐵. (5)
so that we can study shifts in the tax structure while keeping a constant overall tax rate. It is intuitive that an increase in the weight of car-feature θ, while keeping the average tax rate T constant, will decrease the average emission-intensity of the cars.
Proposition 1. An increase in the weight of environmental performance in taxes, θ, while
keeping average total taxes T constant, will decrease the average CO2 intensity B:
𝑑𝐵
𝑑𝜃< 0. (6)
Proof. The policy in the proposition increases the price of the relatively emission-intensive car and decreases the price of the more fuel-efficient car. The result follows immediately from the assumption that both car types are normal goods. Q.E.D.
Thus tilting the car taxes to become more CO2-dependent will make the car fleet more CO2 -efficient. The effect of an overall car tax increase depends on the comparative income elasticity of the two car types.
12
Proposition 2. If the environmental tax component 𝜃 is sufficiently small, then feature B
decreases with an overall tax increase 𝜑 (or equivalently an increase in T) if and only if the less fuel-efficient car type has higher income elasticity:
𝑑𝐵 𝑑φ< 0 ⇔ 𝜕𝑞2 𝜕𝑚 𝑚 𝑞2 > 𝜕𝑞1 𝜕𝑚 𝑚 𝑞1. (7) Proof. Consider 𝜕𝑞2 𝜕𝑚 𝑚 𝑞2> 𝜕𝑞1 𝜕𝑚 𝑚 𝑞1⇔ 𝜕𝑞2 𝜕𝑥 𝜕𝑥 𝜕𝑚 𝑚 𝑞2> 𝜕𝑞1 𝜕𝑥 𝜕𝑥 𝜕𝑚 𝑚 𝑞1⇔ 𝜕𝑞2 𝜕𝑥 𝑚 𝑞2 > 𝜕𝑞1 𝜕𝑥 𝑚 𝑞1⇔ 𝜕𝑞2 𝜕𝑥 𝑥 𝑞2> 𝜕𝑞1 𝜕𝑥 𝑥 𝑞1 .
When 𝜃 = 0, an increase in 𝜑 is equivalent to a decrease in the budget for cars. Because type 2 has a larger income- and budget elasticity �−𝜕𝑞2
𝜕φ φ 𝑞2> − 𝜕𝑞1 𝜕φ φ 𝑞1�, the average CO2
-intensity B goes down. By continuity, the result also holds for 𝜃 sufficiently small. Q.E.D.
The typical hypothesis asserts that demand for luxurious cars is more income-elastic (Mannering and Winston, 1985). Larger cars, which are also emission-intensive, tend to be more comfortable. For example because they offer more storage and lower occupant fatality rates in vehicle-to-vehicle crashes – attributes that are more easily dispensable than a car’s basic transportation service. It thus seems plausible that demand for spacious cars will react more strongly to an equiproportional price increase. The proposition then predicts a decrease in the average pollution intensity if the uniform tax 𝜑 increases.
For high environmental taxes 𝜃 the effect may be reverted, as an increase in the uniform tax rate 𝜑 can then represent a fall in the relative price of less fuel-efficient cars. As we will see however, the relative importance of the environmental component in total car taxes is modest in European countries, so that the proposition’s condition seems to apply.
4 Data
Here we describe the data used for the empirical analysis. The dependent variable of interest is the average CO2 intensity of newly purchased vehicles, which depends on substitution patterns between more and less fuel efficient cars, but also on common fuel efficiency improvements over all cars, which in our econometric strategy is absorbed by time fixed effects. The main explanatory variables are fuel taxes and the two coefficients used in the model in Section 3: the average level of registration and annual road taxes, and
13
their CO2 sensitivity. Here, we define the vehicle registration tax as all one-off taxes paid at the time the vehicle is registered, which is usually the time of acquisition. For road taxes, we include all annual recurrent taxes of vehicle ownership. We construct these data for each country, year and fuel type in our sample using a detailed database with vehicle registration taxes and road taxes at vehicle-country-year level.
4.1 Data sources
Our first data source is a set of manufacturer price tables as supplied by the European Commission (2011a). These tables form an unbalanced panel with 11930 observations on prices and registration taxes, across 204 car types, 20 countries (15 countries up to 2005) over the years 2001-2010. Petrol cars make up about two-third of all observations. This source includes the retail price data per country inclusive and exclusive of the registration tax, and allows us to construct the vehicle-country-year specific registration tax. As of 2011, the European Commission no longer collects data on automobile prices. As these prices are a crucial part of our analysis, our series end in 2010. Next we construct vehicle-country-year specific road taxes using our second data source: the ACEA (2010) tax guides and the European Commission (2011a) passenger car dataset. The construction of the country registration and annual tax dataset is an important extension compared to Ryan et al. (2009), and enables us to differentiate between average taxes and the CO2 sensitivity of vehicle-related taxes. We also take information on fuel taxes from the ACEA tax guides. Because most cars are petrol or diesel, we restrict our sample to these two fuel types. Sales data play no role in the construction of the country tax data sets.
The next dataset, from Campestrini and Mock (2011), contains information on the CO2 intensity of the newly purchased diesel and petrol cars (CO2 emissions in g/km, weighted by sales, see also Figure 1) and the shares of diesel cars (See Figure 6 in the appendix Section 8.3). We have this information for the EU15 countries, from 2001-2010. Lastly, data on nominal per capita GDP is taken from Eurostat (2014). We deflate all prices (sales prices, taxes, GDP) using a common EU15 price deflator.12
12 The deflator is constructed using a weighted average of the EU15 countries’ individual
inflation rates, according to standard EU methodology. See https://www.ecb.europa.eu/stats/prices/hicp/html/index.en.html.
14
4.2 Constructing country average and CO2 sensitivity of car taxes
Countries have widely divergent rules for registration and road taxes. In some countries, vehicle registration taxes are based on CO2 emissions, in others, the cylindrical content is used to compute the tax, or the sales price of the car. In many instances, registration taxes combine multiple variables. Rules for annual road taxes vary even more across Europe. Some countries base their annual tax on a car’s engine power (in kW or hp), while other countries use cylinder capacity, CO2 emissions, weight and exhaust emissions. In addition to the dispersion between countries, for both registration and road taxes, many countries have changed their policies over the period 2001-2010; they adopted (temporary) discounts for fuel efficient cars, or additional charges for cars exceeding specified standards. We compare tax systems across countries by characterizing each country’s tax system at year t by the two coefficients used in our model in Section 2. The first coefficient describes the country-year average tax, the second the CO2 sensitivity of the tax. Both variables are computed for both the registration and road tax, and for petrol and diesel. We thus construct 8 variables that characterize a country’s vehicle tax system for a given year.
We now provide the details. Let CO2it be the CO2 intensity of car-type i in year t, 𝜏𝑐𝑖𝑡 the (registration or road) (percentage) tax in country c, and let δcit be the index {0,1}
identifying whether the data are available for country c. For the sake of exposition, we do not use subscripts for fuel and tax type (registration versus road). We construct the country-specific average CO2 intensity and average tax rate (denoted by bars on top over the variables):13 𝐶𝑂2 ������𝑐𝑡=∑ 𝛿𝑖 𝑐𝑖𝑡𝐶𝑂2𝑖𝑡 ∑ 𝛿𝑖 𝑐𝑖𝑡 (8) 𝜏̅𝑐𝑡=∑ 𝛿𝑖∑ 𝛿𝑖𝑐𝑖𝑡𝑐𝑖𝑡𝜏𝑐𝑖𝑡 (9)
13 In the construction of our tax system variables we do not weigh by sales, to prevent our
description of the tax system from being contaminated by the subsequent effects of that same tax system. The tax system may of course affect sales, and thereby the average CO2 intensity of new cars. This is discussed in Section 6.
15
That is, the typical car for a country has emissions 𝐶𝑂2������𝑐𝑡 and pays a tax rate 𝜏̅𝑐𝑡. We
subsequently calculate the CO2-sensitivity of the tax by comparing how much taxes increase when CO2 emissions increase, on average, and weighted:
𝐶𝑂2𝑇𝐴𝑋𝑐𝑡=∑ 𝑤∑ 𝑤𝑖 𝑐𝑖𝑡(𝜏𝑐𝑖𝑡−𝜏�𝑐𝑡) 𝑐𝑖𝑡(𝐶𝑂2𝑐𝑖𝑡−𝐶𝑂2������𝑐𝑡)
𝑖 (10)
Where weights are given by the deviation from the average CO2 intensity:
𝑤𝑐𝑖𝑡= (𝐶𝑂2𝑐𝑖𝑡− 𝐶𝑂2������𝑐𝑡) (11)
The squared weights ensure that the denominator in (10) is strictly positive, and that the CO2 sensitivity is mainly determined by the tax-differences between the fuel-efficient and fuel-intensive cars.
Yet, if we want to determine a country’s tax pressure and compare between countries, we should not consider the tax of the typical car for that country, but the tax for a typical car that is the same over all countries. Thus, we construct the (virtual) tax rate that would apply to a car with a CO2-emission profile 𝐶𝑂2�𝑡 that is typical for the set of all
countries:
𝐶𝑂2
�𝑡=∑ 𝛿𝑐,𝑖 𝑐𝑖𝑡𝐶𝑂2𝑐𝑖𝑡
∑ 𝛿𝑐,𝑖 𝑐𝑖𝑡 (12)
𝑇𝐴𝑋𝑐𝑡= 𝜏̅𝑐𝑡+ 𝐶𝑂2𝑇𝐴𝑋𝑐𝑡(𝐶𝑂2�𝑡− 𝐶𝑂2������𝑐𝑡) (13)
The above method generates 8 variables for each country-year pair. The precise interpretation depends on the details of the input variables, CO2it and τcit. If CO2 emissions are measured linearly in [gCO2/km], and taxes in euros, then 𝜏̅𝑐𝑡 is the average tax in euros
[€] while CO2TAXct is the increase as measured in [€/(gCO2/km)]. If taxes are measured ad valorem, then 𝜏̅𝑐𝑡 is the average tax rate in percentages while CO2TAXct is the increase in
the tax rate per gCO2/km. Our preferred specification uses the logarithm of one plus tax rates and the logarithm of CO2 emissions, so that variables are interpretable as elasticities, and (with time fixed effects) the construction is independent of price levels. In this case, a decrease of the variable CO2t by 0.01 means that emissions have come down by 1%. A
decrease of the variable 𝜏̅𝑐𝑡 of 0.01 means that the tax rate for the typical car has fallen by
16
car is 10% more fuel efficient, then the consumer price of the more fuel-efficient car is 0.1* CO2TAX per cent below the consumer price of the more fuel-intensive car. All estimations in the main text are based on the double-log variables. We have reproduced our results for a linear model, which is presented in the appendix, Section 8.2. The appendix also provides the equations with more elaborate references to the details of taking logarithms.
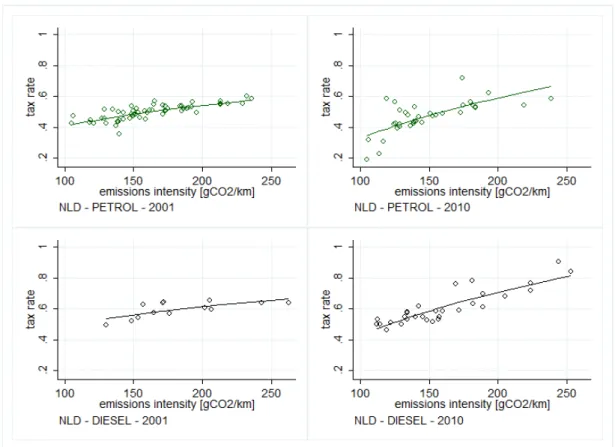
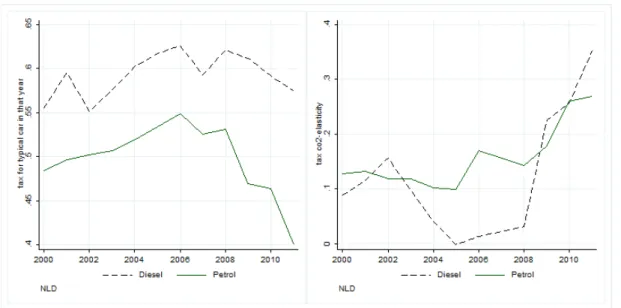
Figure 4 below shows a typical breakdown of the vehicle registration tax rate in its level and CO2 sensitivity. The charts show the registration taxes paid in the Netherlands, in 2001 (left) and 2010 (right), for a series of petrol (upper) and diesel (lower) cars. The dots are observations for individual car types, described at the beginning of Section 3.1. The lines present the ‘predicted’ tax rates based on the two proxy variables TAX and CO2TAX constructed above. As is immediately visible from the left and right panels, the tax rate has become more sensitive to CO2 emissions between 2001 and 2010, that is, the slope of the line has increased. Figure 5 shows the decomposition of the tax in its average tax rate and the CO2 tax over the years 2000-2011. The average registration tax rate for petrol cars started at about 50 per cent, and sharply dropped in the last years reaching about 47 per cent in 2010 and 40 per cent in 2011. The CO2 sensitivity of registration taxes however has increased substantially for both petrol and diesel cars between 2000 and 2011. Figure 4 (panel in top-right corner) illustrates this shift. Various tax breaks for fuel-efficient cars came into force, which substantially increased the CO2 sensitivity of taxes, from about 10% to 25% (see Figure 5, right panel), but at the same time reduced the average tax. All other things equal, in 2011, the after-tax price decreases by about 3% if a car is 10% more fuel-efficient. The charts in Figure 4 also show that, in the Netherlands, taxes for diesel cars are persistently above those for petrol cars;14 in our results section, we will come back to the effect of tax differentiation between petrol and diesel cars.
14 The Netherlands is atypical in the sense that registration taxes and fuel taxes are used as
instruments to segregate the car market. Diesel fuel taxes are low (relative to petrol) while diesel registration taxes are high (relative to petrol). The tax scheme intends to separate long-distance drivers (who buy diesel cars) from short-long-distance drivers (who buy petrol cars).
17
Figure 4: Taxes per vehicle, dependent on CO2 emission intensity, for the Netherlands, 2001 (left panels) and 2010 (right panels), Petrol (upper) and Diesel (lower). Taxes are
18
Figure 5: Registration tax levels for typical vehicle, and tax dependence on CO2 emission intensity, for the Netherlands, 2000-2011, Petrol (green solid) and Diesel (black dashed).15
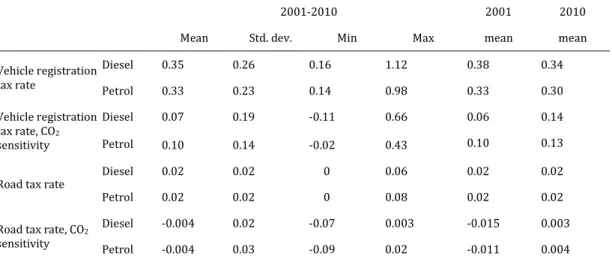
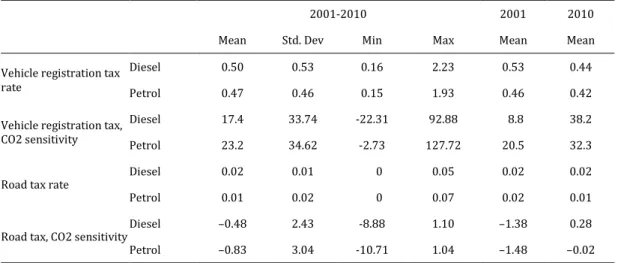
Table 1 below provides some additional summary statistics and the means for the first and last sample years. Over 2001-2010, the average registration tax for diesel cars decreased from 46 to 40 per cent (see footnote at table, and also see Table 5 in the appendix Section 9.2) while for petrol cars the registration tax rate decreased from an average of 39 to 35 percent. The extra tax paid for purchasing a high-emission vehicle has increased substantially, however. In 2001, purchasing a diesel vehicle with 10 percent higher emissions increased the registration tax rate by approximately 0.6 percentage point on average. By 2010, this has increased to 1.4 percentage point. For some countries, the elasticity of the registration tax rate with respect to emissions is negative. This does not directly imply that fewer taxes are paid for polluting vehicles. If a more polluting car is more expensive, then the absolute tax paid can increase while the tax rate paid can decrease.16
15 Note that the figure extends the period (2001-2010) over which we run the regressions. Also
note that the y-axis on the left panel should be interpreted as ‘elasticity’: ln(1+τ). Thus, a value of 0.5 implies a tax of exp(0.5) = 65 per cent.
16 This can happen if part of the registration tax is independent of the car price. Indeed, results
from the linear model presented in the appendix, Table 5, show that in all countries, tax levels (weakly) increase for more CO2 emission-intensive vehicles.
19
In 2001, the road tax rate is on average 2 percent of the vehicle’s (tax-exclusive) purchase price, for both diesel and petrol cars. Several countries have no annual road tax. The average elasticity of the annual tax rate with respect to CO2 emissions has changed from being negative in 2001 to a positive value in 2010. Overall, there is a slight pattern towards lower road tax rates, combined with a greater dependence of the tax rate on the emissions of a car.
Table 1: Summary statistics for constructed tax levels and CO2 sensitivity for EU15*
2001-2010 2001 2010
Mean Std. dev. Min Max mean mean Vehicle registration tax rate Diesel 0.35 0.26 0.16 1.12 0.38 0.34 Petrol 0.33 0.23 0.14 0.98 0.33 0.30 Vehicle registration tax rate, CO2 sensitivity Diesel 0.07 0.19 -0.11 0.66 0.06 0.14 Petrol 0.10 0.14 -0.02 0.43 0.10 0.13 Road tax rate Diesel 0.02 0.02 0 0.06 0.02 0.02
Petrol 0.02 0.02 0 0.08 0.02 0.02
Road tax rate, CO2 sensitivity
Diesel -0.004 0.02 -0.07 0.003 -0.015 0.003 Petrol -0.004 0.03 -0.09 0.02 -0.011 0.004 *All numbers are based on a logarithmic representation. The average tax rate for diesel cars in 2001 was thus exp(0.38)–1=0.46. See Table 5 in the appendix, Section 8.2, for the tax levels and CO2 sensitivity based on the linear model.
Vehicle fiscal measures are correlated, also when we take out country and time fixed effects. Petrol and diesel registration taxes move in tandem, both for the levels and CO2 -sensitivity. The same applies to the annual taxes, where correlations exceed 80%.17 Petrol and diesel fuel taxes are also positively correlated. The year fixed effects separate fuel price developments from fuel tax changes. There is almost no correlation between the three groups of tax instruments. For annual taxes, we see a very strong negative correlation between the level of annual taxes and its CO2 sensitivity, implying that the set of annual taxes are strongly multi-collinear, so that we must be careful when interpreting individual coefficients for annual taxes.18
17 See Table 7 in the appendix for details
18 The negative correlation between the level of annual taxes and its CO2 sensitivity is ‘natural’
20
5 Econometric strategy
The benchmark model estimates the dependence of the CO2 intensity of the new car fleet in country c in year t (as in Figure 3), separately for diesel and petrol,19 on the two dimensions of the registration car taxes: its level and its CO2 sensitivity
𝐶𝑂2𝑖𝑛𝑡𝑐𝑡= 𝛼1𝑐+ 𝛼2𝑡+ 𝛽1𝑇𝐴𝑋𝑐𝑡+ 𝛽2𝐶𝑂2𝑇𝐴𝑋𝑐𝑡+ ∑ 𝜋𝑘 𝑘𝑍𝑐𝑘𝑡+ 𝜀𝑐𝑖𝑡, (14)
where 𝛼1𝑐 and 𝛼2𝑡 are country and time dummies, and the country-time specific control
variables Z include income, the share of diesel cars in total sales, and gasoline taxes.20 For our preferred logarithmic model, we use logarithms for the dependent variable. In the linear model (see appendix, Section 8.2), the dependent variable is measured in average grams of CO2 emissions per km.
We add convergence patterns through the control variable, through
𝑍𝑐1𝑡 = 𝐶𝑂2𝑖𝑛𝑡𝑐0 (15)
𝑍𝑐2𝑡= (𝑦𝑒𝑎𝑟𝑡− 2001) × 𝐶𝑂2𝑖𝑛𝑡𝑐0, (16)
where 𝐶𝑂2𝑖𝑛𝑡𝑐0 is the CO2 intensity of the new fleet in the base year 2001. Convergence between countries is measured through a negative coefficient for the interaction term (16). We assume there is no systematic correlation between observed fiscal vehicle policies and unobserved policies such as vehicle retirement plans that could induce omitted variable bias.
proportional with the car’s size, weight and price. Thus, annual taxes have a tendency to be regressive. This is picked up by a negative coefficient for the CO2 sensitivity.
19 All variables are specific for diesel and petrol. We use both petrol and diesel independent
variables when we estimate the diesel share as dependent on car taxes.
20 The fuel tax is estimated for each country-year-fuel type by fuel: tax=ln(1+{fuel tax
21
We estimate the model for both fuel types jointly and separately, with and without the annual taxes. One of the control variables, the share of diesel cars, is itself dependent on a country’s tax regime. As discussed in the introduction, diesel cars are typically less CO2 intensive than petrol cars, and a high CO2 intensity of taxes may thus encourage individuals to switch to diesel cars. To assess whether this affects our results, we re-estimate the model without the diesel share.
6 Results
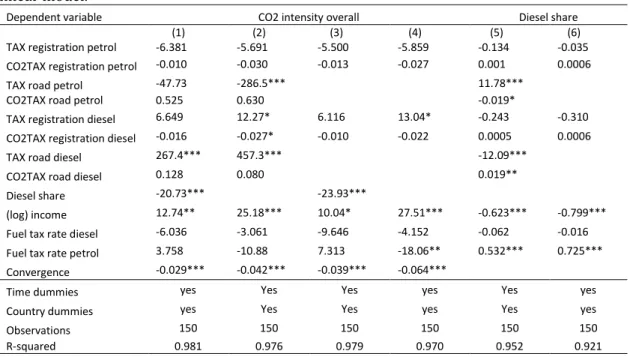
The main results are presented in Tables 2 and 3. Table 2 displays the results for the CO2 intensity for diesel and petrol cars respectively. Table 3 then reports the results for the CO2 intensity of all new purchased cars where petrol and diesel are aggregated, and reports the dependence of the share of diesel cars on taxes.
6.1 Fuel-type specific effects
Starting with the CO2 intensity of new diesel cars, we find a clear significant effect of registration taxes on CO2 emissions (see Table 2). Especially the CO2 sensitivity is an effective instrument to change the characteristics of newly bought vehicles: a 1% increase in CO2 sensitivity reduces the CO2 intensity by 0.04 to 0.1 percent. The effect is weaker when we control for the diesel share, suggesting that part of the effect goes through the changes in the diesel share. As we see in Table 3, a higher CO2 sensitivity of diesel registration taxes increases the share of diesel cars. Buyers who decide to acquire a diesel car as a substitute for a petrol car typically buy diesel cars that are smaller compared to the average diesel car, while they substitute away from petrol cars that are larger compared to the average petrol car (see the case study of Ireland, Rogan et al., 2011, Hennessy and Tol, 2011, Leinert et al., 2013). These consumers who substitute diesel cars for petrol cars thereby reduce the average emissions from both diesel and petrol cars. The mechanism is confirmed by the negative coefficients for diesel share in the diesel emissions (Table 2, columns 1 and 3) and in the petrol emissions (Table 2, columns 5 and 7). Indeed, a closer look at our data (not shown here) shows that diesel cars are on average 20 percent heavier compared to petrol and the average weight for both diesel and petrol cars decreases with an increase in the diesel share. Part of the emission reduction of new cars in the EU has been achieved by lower registration taxes for diesel cars (Table 1 and Appendix, Table 5), which translated in an increased share of diesel cars (Table 3, column 5 and Appendix,
22
Figure 6), which are typically more fuel efficient than petrol cars (Figure 1), and thus in turn decreases the CO2 intensity of the average car (Table 3, column 1).
The registration tax level reduces the CO2 intensity of new diesel cars, yet only significantly so when we account for the diesel share. In response to the observed decline of diesel registration tax levels during the sample period, consumers of small diesel cars switch to relatively less fuel-efficient, heavier diesel models, but there is also substitution from petrol cars to small diesel cars. We find no significant effect for road taxes on the emissions by diesel cars. Higher diesel fuel tax rates increase the fuel efficiency of newly acquired vehicles, as expected (Burke and Nishitateno, 2013). In addition, we find higher CO2 intensities with increasing income and a clear convergence pattern between EU countries.
We find a similar pattern for petrol vehicles. The effect of CO2 tax sensitivity is negative and significant: the average CO2 sensitivity in 2010 (0.13) reduces the CO2 intensity of new bought cars by about 2 percent. Again, the effect is weaker if we account for the share of diesel cars. Higher taxes for fuel-intensive petrol cars will push potential owners of large petrol cars to consider a diesel car as a substitute, thereby reducing the size and emission-intensity of the average petrol car through the diesel-share variable. An increase in the registration tax level reduces the CO2 intensity of newly acquired vehicles, but the coefficients are insignificant. For petrol vehicles, annual road taxes receive a significant coefficient, yet the signs are opposite to what is expected. Fuel taxes do not show a significant effect for petrol car purchases.21
This paper is one of the first including annual road taxes, in addition to registration and fuel taxes, in the analysis of car purchase behaviour. We find that an increase in the annual road tax level and CO2 sensitivity increases the CO2 intensity of new petrol cars. We are not sure what causes this finding. It is not obvious that individuals account for future annual tax expenses, as discussed in Section 2. In our regressions, even though the annual tax rates enter significantly, excluding them from the regression has only little effect on the coefficient for the other variables. Hence, we can interpret the other coefficients with
21 The insignificance is not driven by lack of variation as petrol taxes show up significantly in
23
confidence, and conclude that leaving annual taxes unaccounted for probably does not greatly alter our conclusions.
6.2 Aggregate effects
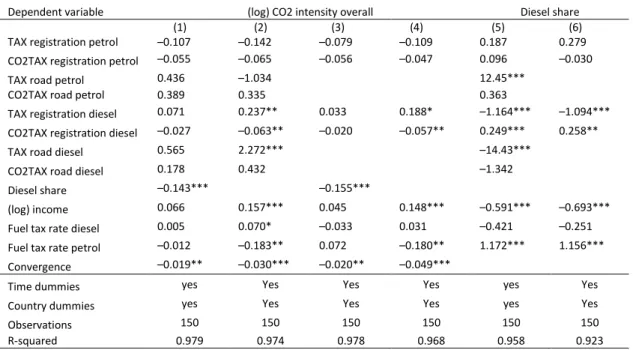
Then consider the overall effect of car taxes on the new fleet emission intensity (Table 3). The diesel share is the most important mediating variable: none of the policy variables is significant when this share is included in the regression, though the joint effect of more CO2-sensitive diesel and petrol taxes is significantly different from zero (columns 1 and 2).22 The results in Table 3 allow us to assess the effect of the changes in registration taxes on the diesel intensity. We subtract the log of taxes in 2001 from those in 2010 (Table 1) and multiply the differences with the coefficients in Table 3 (column 5). We conclude that the changes in registration taxes have increased the diesel share by 6.5 percentage points. Using a similar calculation (but using column 2 from Table 3), we find that the changes in registration taxes have reduced the CO2 intensity of the average new car by 1.3%23. 0.9 percentage points of this overall effect is explained by changes in the diesel share.24 The overall effects are modest; an explanation is that the large countries with a major domestic car industry (France, Germany, Italy, United Kingdom), have relatively low registration taxes that are almost independent of emission intensities.
When leaving out the diesel share, the diesel registration taxes stand out as the most important determinants. Lower overall taxes for diesel cars increase the share of diesel cars and thereby decrease average overall emissions, but also encourage existing diesel drivers to switch to more polluting models. At the same time, a more CO2 sensitive diesel registration tax favours small diesel cars, increasing the diesel share (column 5 and
22 As noted previously and presented in Table 7 in the appendix, policy measures for petrol and
diesel vehicles are strongly correlated. This inflates the standard errors of the individual regressors in Table 3, columns 1-4. When testing, we find in column 1 and 2 that the sum of the diesel and petrol coefficients for the CO2 sensitivity of registration taxes is significantly
different from zero.
23 We use more decimals than shown for the numbers in Table 1, so the reader’s calculation
may give a slightly different result.
24
6) and decreasing overall emissions (column 3 and 4). Interestingly, the changes in registration taxes over the period 2001-2010 have caused extant diesel drivers to choose more CO2-intensive cars on average. For these drivers, the effect of lower registration tax levels in 2010 compared to 2001 dominates the effect of the increased CO2 sensitivity.
Along the same lines, we find that higher petrol fuel taxes tend to increase the diesel share and reduce the fleet’s emission intensity (columns 2,4,5,6), while diesel fuel taxes tend to decrease the share of diesel cars, increasing the average emissions (column 2 and 4), though the effect is weak. The finding is consistent with Ryan et al. (2009), but a subtle and important distinction from the general conclusion in the literature that higher petrol prices tend to lead to more fuel efficient cars (Davis and Kilian 2011, Burke and Nishitateno 2013, Klein and Linn 2013).
6.3 Transmission mechanisms
Finally, we present a brief assessment of the transmission channels through which fiscal car taxes change emissions. We have already seen that consumers switch between petrol and diesel cars, in response to tax measures, but within a fuel type, they can also respond to tax measures by switching to lighter cars with less powerful engines, or alternatively, they can choose for cars with more fuel efficient engines while keeping the preferred car specifications unaffected (Fontanas and Zamaras, 2010).
In Table 4 we present, for diesel and petrol separately, the effect of fiscal measures on the CO2 intensity with and without additional controls for average vehicle mass and engine power. If controlling for mass or power reduces the (absolute) value of the policy coefficient, this can be taken as an indication that part of the policy’s effect is transmitted through the car features. Next, we estimate the direct effect of fiscal policies on average vehicle mass and engine power. In all models, we control for convergence, income, time and country fixed effects.
To allow easy comparison, columns 1 and 5 in Table 4 reproduce Table 2 columns 1 and 5 respectively. Column 2 and 6 confirm that larger cars with more powerful engines have higher emission intensities. For diesel cars, registration taxes do not significantly affect average mass or engine power of newly purchased vehicles, although adding these features does slightly reduce the (absolute) coefficient on registration taxes in column 2 compared to column 1. A similar effect is found for the CO2 sensitivity of diesel registration taxes. One possible interpretation of this finding is that higher and more CO2-sensitive
25
diesel registration taxes push the technology frontier for cars, providing the same qualities (mass and horsepower) to the consumers, at lower CO2 emissions. For petrol cars, the effects of registration taxes appear to be transmitted through the car features: higher (CO2 sensitivity of) registration taxes reduce the average mass and horse power of newly purchased vehicles, even when controlling for the diesel share. There is less indication of a technology effect, and more evidence of switch in the type of cars bought by consumers.
We note that the effects of income on CO2 intensities appear to be fully transmitted through car features, both for diesel and petrol cars. Such an outcome is intuitive, as increasing income will be used mainly to increase the level of desirable features. The effect of income on CO2 intensity does not become significantly negative when controlling for mass and horse power, so we find no evidence that consumers use income increases to purchase more environmentally friendly cars. For diesel cars, the effect of diesel fuel taxes is also fully transmitted through the car features.
26 Table 2. Dependence of new car fleet emissions on taxes, per fuel type
Dependent variable (log) CO2 intensity diesel (log) CO2 intensity petrol
(1) (2) (3) (4) (5) (6) (7) (8) TAX registration –0.165* –0.021 –0.163* –0.028 –0.086 –0.030 –0.073 –0.028 CO2TAX registration –0.045 –0.099*** –0.049* –0.095*** –0.119** –0.136*** –0.124** –0.136*** TAX road –0.334 0.157 1.855*** 1.624*** CO2TAX road –0.240 0.369 1.014*** 1.018*** Diesel share –0.155*** –0.149*** –0.069*** –0.059*** (log) income 0.128* 0.251*** 0.136** 0.233*** 0.132*** 0.196*** 0.098** 0.150*** Fuel tax rate –0.226*** –0.302*** –0.225*** –0.303*** 0.034 –0.048 0.079 0.004 Convergence –0.030** –0.051*** –0.032** –0.048*** –0.020** –0.029*** –0.022** –0.030***
Time dummies Yes yes Yes Yes Yes Yes yes Yes
Country dummies Yes yes Yes Yes Yes Yes yes Yes
Observations 150 150 150 150 150 150 150 150
R-squared 0.929 0.915 0.929 0.914 0.975 0.973 0.973 0.970
27
Table 3. Dependence of car emissions (aggregated over fuels) and diesel share on taxes. Dependent variable (log) CO2 intensity overall Diesel share
(1) (2) (3) (4) (5) (6)
TAX registration petrol –0.107 –0.142 –0.079 –0.109 0.187 0.279 CO2TAX registration petrol –0.055 –0.065 –0.056 –0.047 0.096 –0.030
TAX road petrol 0.436 –1.034 12.45***
CO2TAX road petrol 0.389 0.335 0.363
TAX registration diesel 0.071 0.237** 0.033 0.188* –1.164*** –1.094*** CO2TAX registration diesel –0.027 –0.063** –0.020 –0.057** 0.249*** 0.258**
TAX road diesel 0.565 2.272*** –14.43***
CO2TAX road diesel 0.178 0.432 –1.342
Diesel share –0.143*** –0.155***
(log) income 0.066 0.157*** 0.045 0.148*** –0.591*** –0.693*** Fuel tax rate diesel 0.005 0.070* –0.033 0.031 –0.421 –0.251 Fuel tax rate petrol –0.012 –0.183** 0.072 –0.180** 1.172*** 1.156*** Convergence –0.019** –0.030*** –0.020** –0.049***
Time dummies yes Yes Yes Yes yes Yes
Country dummies yes Yes Yes Yes yes Yes
Observations 150 150 150 150 150 150
R-squared 0.979 0.974 0.978 0.968 0.958 0.923
28 Table 4. Transmission of fiscal policies to CO2 intensity
Dependent variable diesel petrol
(logs) CO2 CO2 mass horse power CO2 CO2 mass horse power
(1) (2) (3) (4) (5) (6) (7) (8)
Mass (log) 0.772*** 0.516***
Horse power (log) 0.288*** 0.143***
TAX registration -0.165* -0.024 -0.014 -0.185 -0.086 -0.016 -0.097 -0.229 CO2TAX registration -0.045 -0.038** 0.002 -0.024 -0.119** -0.000 -0.156*** -0.260*** TAX road -0.334 -0.102 -1.505** 0.823 1.855*** 0.493 1.594*** 3.580*** CO2TAX road -0.240 -0.130 -0.684* 0.546 1.014*** 0.193 1.038*** 1.896*** Diesel share -0.155*** -0.037* -0.086** -0.104** -0.069*** -0.042*** -0.042 -0.045 (log) income 0.128* -0.016 0.114* 0.193** 0.132*** -0.018 0.166*** 0.420*** Fuel tax rate -0.226*** 0.031 -0.240*** -0.294** 0.034 0.051 -0.023 0.034 Convergence -0.030** -0.048*** -0.003 -0.008 -0.020** -0.006 -0.014* -0.010
Time dummies Yes Yes yes Yes Yes Yes yes Yes
Country dummies Yes Yes yes Yes Yes Yes yes Yes
Observations 150 150 150 150 150 150 150 150
R-squared 0.929 0.976 0.876 0.929 0.975 0.992 0.952 0.965
29
7 Discussion
We find empirical evidence that fiscal vehicle policies significantly affect emission intensities of new bought cars. Increasing CO2-sensitivity of registration taxes and higher fuel taxes lead to the purchase of more fuel efficient cars, but higher annual road taxes have no or an adverse effect. The former is consistent with the literature; the latter is counter-intuitive, possibly because annual road taxes are not salient, but the high collinearity between annual road taxes may also play a role. We decomposed the vehicle registration tax rate into two variables, the level and CO2-sensitivity, and found that especially the CO2-sensitivity is an important determinant of the emission intensity of new cars. A one percent increase in the CO2 sensitivity of vehicle purchase taxes reduces the CO2 intensity of the average new vehicle by 0.04 to 0.13 percent. The changes in registration taxes from 2001 to 2010 have reduced the CO2 emission intensity of the average new car by 1.3%. The diesel-petrol substitution induced by changes in the relative taxes for diesel versus petrol cars is an important factor for the average fleet’s fuel efficiency. We also find higher CO2 intensities with increasing income and a clear convergence pattern between EU countries.
There is a clear positive potential for fiscal instruments as part of the set of policy measures aimed at reducing CO2 emissions from cars.25 Our findings thus support the European Commission’s third policy pillar. Yet, we should not overstate the contribution of registration taxes. The overall effect of the registration tax changes that we identify, a 1.3% improvement of fuel efficiency, is small compared to the overall achievement over the period observed (Figure 1). Innovation and other policy instruments have played a substantial role. In that context, it is important to understand that various policy instruments can strengthen, but also counter each other. In the European Directive EC/443/2009 car manufacturers are evaluated (from 2015 onwards) based on their average emissions of cars sold across all EU countries. Increased sales of fuel efficient cars in one country thus allows manufactures to sell more fuel inefficient cars in other countries. The principle, sometimes referred to as a ‘waterbed-effect', implies that environmental gains from fiscal national policies can leak away as the sale of more
30
efficient cars in a country with a fiscal regime that puts a large premium on CO2 emissions, is countered by the sale of more fuel-intensive cars in other countries. National fiscal policies, aimed at the demand side, and in line with the third pillar of EU-policies, might thus be less effective conditional on the effectiveness of the first pillar of EU-policy, aimed at the supply of fuel efficient cars throughout the EU.Given an exogenously set ceiling for the EU-wide CO2 emissions, there is no clear economic gain from a diversified fiscal regime between EU countries, while there are social costs (Hoen and Geilenkirchen, 2006). Indeed, a few years ago, the EU proposed to harmonize vehicle taxes in the EU, but the proposal was rejected by the Member States. We also mention a few other potential disadvantages of fiscal support of fuel efficient cars.
In this paper, we focus on the average emission intensity of new cars. Reducing taxes for small, fuel-efficient cars can lead to scale effects (i.e. more cars) and intensity-of-use effects (i.e. more kilometres per car). Konishi and Zhao (2014) show that in a green tax reform in Japan, this scale effect offset the composition effect (i.e. a bigger share of fuel-efficient cars) by approximately two third. In addition, there is a rebound effect. Fuel-efficient cars are cheaper to drive, and a portion of the CO2 gains by CO2 -based vehicle purchase tax is lost as the fuel-efficient cars increase car travel demand (Khazoom, 1980). The existence of the effect is undisputed, but its magnitude remains an issue of debate (see e.g. Brookes, 2000, Binswanger, 2001, Sorrell and Dimitropoulos, 2008). Frondel and Vance (2014) estimated that 44-71% of potential energy savings from efficiency improvements in Germany between 1997 and 2012 were lost due to increased driving. The rebound effect may be mitigated if part of the increase in sales of new, clean cars is due to consumers sooner retiring their less-efficient cars.
Of the policies aimed at reducing CO2 emissions, excise fuel duties most directly target the environmental objective, specifically since the use of the car is accountable for about 80% of CO2 emissions in its life-cycle (E. Gbeghaje-Das 2013). Fuel excise duties are also closer to the ‘polluter pays-principle’, one of the leading principles of European Environmental Policy (European Parliament and Council, 2004). Taxing fuels would lead to more efficient cars and lower mileage without rebound effects (Cropper and Chugh, 2014), making it the preferred instrument for reducing road transport emissions. Yet significant fuel tax increases are politically costly.
There are also secondary effects of fiscal policies. When consumers choose lighter cars that are more fuel efficient, not only CO2 emissions fall but emissions of NOx and PM10
31
as well. A weight reduction of 10% results in a decrease of the emission of NOx with 3-4% (Nijland et al., 2012). On the other hand, substituting diesel cars for petrol cars improves CO2 fuel efficiency by about 10-20%, yet increases the emissions of NOx (Nijland et al., 2012). In the case of PM10 the situation is not clear, as modern petrol cars with direct injection might emit more PM10 than modern diesel cars (Köhler, 2013). Lighter cars also reduce fatalities for drivers of other vehicles, pedestrians, bicyclists, and motorcyclists (Gayer 2004, White 2004). The design of the fiscal regime, encouraging lighter cars or encouraging diesel cars, can alter the secondary effects substantially.
We used CO2 emission data according to the NEDC guidelines. It is known that the tests typically report lower emissions compared to realistic conditions, especially for cars that score very well at the tests (Ligterink and Bos, 2010, Ligterink and Eijk, 2014). Moreover, the gap between test results and realistic estimates for normal use have increased over time; from about 8% in 2001 to 21% in 2011, with a particularly strong increase since 2007 (Mock et al. 2012, ICCT, 2014). The gap between test values and estimates of realistic use values also affects the estimated emission of air pollutants, particularly the emissions of NOx from diesel cars (e.g. Hausberger, 2006, Vonk and Verbeek, 2010). To continue the use of test-cycles therefore requires an update of procedures and improvement of their reliability as predictor of real-life use.
Finally, we mention three limitations of our study. We proxy the fiscal treatment of personal vehicles, assuming that taxes change continuously with CO2 emissions. Yet, there are indications that consumers are more sensitive to discrete price increases, such as tax breaks for cars that meet specific criteria (see e.g. Finkelstein, 2009, Klier and Linn, 2012, Kok, 2013). This study did not explicitly model these elements of tax design. Second, about half of the new sales in Europe are company cars (Copenhagen Economics, 2010). One of the reasons for their widespread use is their beneficial tax treatment (Gutierrez-i-Puigarnau and van Ommeren, 2011), including implicit subsidies as employees often do not bear the variable costs of private use (Copenhagen Economics, 2010). Therefore, private consumers and business consumers react differently to price signals such as fiscal rules and fuel taxes. We do not have available data on the two separate markets and must leave this topic to future research. Third, we did not consider other fiscal measures such as the scrap subsidies which had major effects on sales in various countries, though the effects on the fuel efficiency is considered limited (Leheyda and Verboven, 2013).
32
8 References
ACEA European Automobile Manufacturers Association (2010), ACEA Tax Guide, 2001-2010 edition, Brussels
Achtnicht M (2012), German car buyers’ willingness to pay to reduce CO2 emissions, Climatic Change 113:679-697.
Anderson, S. P., A. de Palma and B. Kreider (2001), Tax incidence in differentiated product oligopoly, Journal of Public Economics 81(2): 173-192.
Berry, S., J. Levinsohn and A. Pakes (1995), Automobile Prices in Equilibrium, Econometrica, 63(4):841-890.
Blanco G., R. Gerlagh, S. Suh, et al., 2014: Drivers, Trends and Mitigation. In: Climate Change 2014: Mitigation of Climate Change. Contribution of Working Group III to the Fifth Assessment Report of the Intergovernmental Panel on Climate Change [Edenhofer, O., R. Pichs-Madruga, Y. Sokona, et al. (eds.)]. Cambridge University Press, Cambridge, United Kingdom and New York, NY, USA.
Binswanger, M. (2001), Technological Progress and Sustainable Development: What about the Rebound Effect? Ecological Economics, 36, 119-132.
Brand, C., J. Anable & M. Tran (2013), ‘Accelerating the transformation to a low carbon passenger transport system. The role of car purchase taxes, feebates, road taxes and scrappage incentives in the UK’, Transportation Research Part A: Policy and Practice (49): 132-148.
Brookes, L. (2000), Energy Efficiency Fallacies Revisited, Energy Policy, 28, 355-367. Burke PJ and S Nishitateno (2013), Gasoline prices, gasoline consumption, and new-vehicle
fuel economy: Evidence for a large sample of countries. Energy Economics 36: 363-370. Burke PJ (2014), Green Pricing in the Asia Pacific: An Idea Whose Time Has Come?, Asia &
the Pacific Policy Studies 1: 561–575.
Campestrini M. and Mock P. (2011), European Vehicle market Statistics, ICCT, Washington Ciccone A. (2014), Is it all about CO2 emissions? The effects of green taxation for new
vehicles in Norway, Memorandum, Department of Economics, University of Oslo 19/2014
Copenhagen Economics (2010), Company car taxation, Working Paper 22, Copenhagen. Cropper M., Chugh R. (2014), The Welfare Effects of Fuel Conservation Policies in the
33
Davis LW and L Kilian (2011), Estimating the Effect of a Gasoline Tax on Carbon Emissions, Journal of Applied Econometrics, 16 : 1187-1214.
DellaVigna, S. (2009), ‘Psychology and Economics. Evidence from the Field’, Journal of Economic Literature 47(2): 315-372.
D’Haultfoeuille, X., P. Givordz, X. Boutinx (2014) The Environmental Effect of Green Taxation: The Case of the French “Bonus/Malus.”, The Economic Journal, Vol. 124, Issue 578, 444-480,
EEA European Environment Agency (2013), Monitoring CO2 emissions from new passenger cars in the EU: summary of data for 2012, Copenhagen. Data files available at www.eea.europa.eu/data-and-maps/data/ds_resolveuid/61bf022022044c748fecc33143dbcbbd.
European Commission (1995), A Community strategy to reduce CO2 emissions from passenger cars and improve fuel economy. Communication from the Commission to the Council and the European Parliament. COM (95) 689 final, 20 December 1995, Brussels.
European Commission (2005), Proposal for a council directive on passenger car related taxes, COM(2005) 261 final, Brussels.
European Commission (2011a), Price car reports,
http://ec.europa.eu/competition/sectors/motor_vehicles/prices/archive.html.
European Commission (2011b), Roadmap to a Single European Transport Area - Towards a competitive and resource efficient transport system , COM(2011) 144 final, Brussels.
European Commission (2014), Excise Duty Tables,
https://circabc.europa.eu/faces/jsp/extension/wai/navigation/container.jsp.
European Parliament and Council (2004), Directive 2004/35/EC of the European Parliament and of the Council of 21 April 2004 on environmental liability with regard to the prevention and remedying of environmental damage, Brussels.
European Parliament and Council (2009), Regulation No 443/2009 of 23 April 2009 setting emission performance standards for new passenger cars as part of the Community’s integrated approach to reduce CO2 emissions from light-duty vehicles, Brussels.
Eurostat (2014) GDP and main components - volumes (nama_gdp_k), available at epp.eurostat.ec.europa.eu/portal/page/portal/national_accounts/data/database
34
Finkelstein, A. (2009). E-Ztax: Tax Salience and Tax Rates. Quarterly Journal of Economics 124(3): 969–1010.
Fontaras G and Z Samars (2010), On the way to 130gCO2/km — Estimating the future characteristics of the average European passenger car. Energy Policy 38: 1826-1833. Frondel M., Vance C. (2014), Fuel Taxes versus Efficiency Standards: An Instrumental
Variable Approach, WCERE conference, Istanbul
Gallagher, K.S. & E.J. Muehlegger (2011), ‘Giving green to get green. Incentives and consumer adoption of hybrid vehicle technology’, Journal of Environmental Economics and Management (61): 1–15.
Gayer T (2004), The Fatality Risks of Sport-Utility Vehicles, Vans, and Pickups Relative to Cars, J. of Risk and Uncertainty 28:103-133.
Gbeghaje-Das, E., (2013), Life Cycle CO2 assessment of low carbon cars, PE consultants, London.
Greene, D., P. Patterson, M. Sing & J. Li (2005), ‘Feebates, rebates and gas-guzzler taxes: a study of incentives for increased fuel economy’, Energy Policy (33): 757-775.
Greene, D., D.H. Evans & J. Hiestand (2013), ‘Survey evidence on the willingness of U.S. consumers to pay for automotive fuel economy’, Energy Policy (61): 1539-1550.
Gutierrez-i-Puigarnau, E. and van Ommeren, J.N.(2011), Welfare effects of distortionary fringe benefits taxation: the case of employer-provided cars, International Economic Review, 52(4), 1105-1122.
Hausberger S., (2006), Fuel Consumption and Emissions of Modern Passenger Cars, Institute for Internal Combustion Engines and Thermodynamics, Report Nr. I-25/10 Haus-Em 07/10/676, Graz.
Hennessy, H. & R.S. Tol (2011), ‘The impact of tax reform on new car purchases in Ireland’, Energy Policy (39): 7059–7067.
Hoen, A. & G.P. Geilenkirchen (2006), De waarde van een SUV - waarom de gemiddelde auto in Nederland niet zuiniger wordt. Bijdrage aan het Colloquium Vervoersplanologisch Speurwerk 2006, 23 en 24 november 2006, Amsterdam.
Huse C. and C. Lucinda (2013), The Market Impact and the Cost of Environmental Policy: Evidence from the Swedish Green Car Rebate, Economic Journal 124:393-419.
ICCT (2014), From laboratory to road. A 2014 update of official and “real-world” fuel consumption and CO2 values for passenger cars in Europe, International Council on Clean Transportation Europe, Berlin.
35
Khazoom, D.J. (1980), Economic Implications of Mandated Efficiency Standards for Household appliances, The Energy Journal 1, 21-40.
Kilian, L., Sims E. (2006), The Effects of Real Gasoline Prices on Automobile Demand: A Structural Analysis Using Micro Data,Working Paper, University of Michigan, Ann Arbor.
Klier, T., Linn J. (2012), Using Vehicle Taxes to Reduce Carbon Dioxide Emissions Rates of New Passanger Vehicles: Evidence from France, Germany, and Sweden, MIT CEEPR Working Paper 2012-011, Cambridge, USA.
Klier T and J Linn (2013), Fuel prices and new vehicle fuel economy — Comparing the United States and Western Europe, JEEM 66: 280-300.
Köhler, F. (2013), Testing of particulate emissions from positive ignition vehicles with direct fuel injection system, Technical Report, 2013-09-26, TűV Nord
Kok, R (2013). New car preferences move away from greater size, weight and power: Impact of Dutch consumer choices on average CO2-emissions., Transportation Research. Part D: Transport & Environment, 21 (June), 53-61.
Konishi Y., and M. Zhao (2014), Can Green Car Taxes Restore Efficiency? Evidence from the Japanese New Car Market, Tokyo Center for Economic Research Working Paper E-82 Leheyda N. and F. Verboven (2013), Scrapping Subsidies during the Financial Crisis -
Evidence from the Europe, mimeo, University of Leuven
Leinert, S., Daly, H., Hyde, B. & Gallachóir, B. Ó. (2013), Co-benefits? Not always: Quantifying the negative effect of a CO2-reducing car taxation policy on NOx emissions, Energy Policy, (63): 1151–1159.
Ligterink, N.E., Bos B. (2010), CO2 uitstoot van personenwagens in norm en praktijk – analyse van gegevens van zakelijke rijders, TNO report MON-RPT- 2010-0014, Delft. Mabit, S.L. (2014), Vehicle type choice under the influence of a tax reform and rising fuel
prices, Transportation Research Part A, 64 (2014) 32–42.
Mannering, F., Winston, C. (1985), A dynamic empirical analysis of household vehicle ownership and utilization, RAND Journal of Economics 16 (2), 215-236.
Mock P., German J., Bandivadekar A., Riemersma I. (2012), Discrepancies between type-approval and “real-world” fuel-consumption and CO2 values, Assessment for 2001-2011 European passenger cars, ICCT working paper 2012-2
Meerkerk, J. van, G. Renes & G. Ridder (2014), Greening the Dutch car fleet: the role of differentiated sales taxes, PBL Working Paper 18, Den Haag: PBL.