Lheebroekerzand - The Netherlands
Data of 1997-1998-1999
E.A.M. Mathijssen-Spiekman and M.A.H. Wolters-Balk
This investigation has been performed by order and for the account of the Directorate General for Environmental Protection, Division Climatical Change and Industry and the Director Division Risks, Environment and Health, within the framework of project 607165 Integrated Monitoring Area Lheebroekerzand (formerly 673710, 259101 and 607160), that is part of the UN/ECE International Cooperative Programme on Integrated Monitoring on Air Pollution Effects.
Mailing list
1 J. Sliggers (DGM-KvI)
2 S. Kleemola (ICP-IM Programme Centre, Finnish Environment Institute, Helsinki, Finland)
3 L. Lundin (Chairman ICP-IM, Department of Environmental Assessment, Swedish University of Agricultural Sciences, Uppsala, Sweden)
4 Pacl (NFP ICP-IM Czech, Czech Hydrometeorological Institute, Kosetice, Czech Republic)
5 J. Sienkiewicz (NFP ICP-IM Poland, Institute of Environmental Protection,Warsaw, Poland)
6 M. Mirtl (NFP ICP-IM Austria, Federal Environmental Agency, Wien, Austria) 7 K.E. Nielsen (NFP ICP-IM Denmark, National Environmental Research Institute,
Silkeborg, Denmark)
8 Baron Ir. F.W. van Tuijll tot Serooskerken (State Forestry Service: SBB, Pesse) 9 P. Kerssies (State Forestry Service: SBB, Pesse)
10 A. Henckel (State Forestry Service : SBB, Lhee) 11 Dr. H. van Dam (AquaSense TEC, Amsterdam) 12 A.F.M. van Hees (Alterra, Wageningen)
13 S. Clerkx (Alterra, Wageningen)
14 A. Hoentjen (Provincie Drenthe, Assen)
15 G. Duursema (Zuiveringsschap Drenthe, Assen) 16 M. Fagel (Waterschap Reest en Wieden, Meppel) 17 A.J. van Dijk (SOVON, Beek-Ubbergen)
18 K. Veling (The Butterfly Foundation, Wageningen) 19 K.A. van Eerde (Dwingeloo)
20 J. Kleine (Dwingeloo)
21 Dr. J.W. Erisman (ECN, Petten)
22 Drs. C.M. van Herk (Lichenologisch Onderzoekbureau Nederland, Soest) 23 Depot of Dutch Publications and Dutch Bibliography
24 Board of Directors RIVM
25 Director Environment, Prof. Ir. N.D. van Egmond
26 Director Division Risks, Environment and Health, Dr. Ir. G. de Mik 27 Director Division Forecasting, Ir. F. Langeweg
28 Director Division Analytical Chemical Laboratories, Dr. P. van Zoonen 29 Head Laboratory for Ecotoxicology, Drs. J.H. Canton
30 Head Laboratory of Air Research, Dr. D. van Lith
31 Head Laboratory of Water and Drinking-Water Research, Ir. A.H.M. Bresser 32 Head Laboratory of Soil and Groundwater Research, Ir. R. van den Berg 33 Head Laboratory of Inorganic Chemistry, Ir. H.J. van de Wiel
35 Department Information and Public Relations
36 Head Coordination Center for Effects of the UN/ECE Mapping Programme, Prof. Dr. J.P. Hettelingh (MNV/CCE)
37 Dr. M. Posch (MNV/CCE) 38 Dr. H.J.P.A.Verkaar (MNV) 39 Dr. A. Sterkenburg (ECO) 40 Dr. A.M. Breure (ECO) 41 Drs. D. de Zwart (ECO) 42 A.C. de Groot, ing (ECO) 43 G.G. van Dijk (ECO) 44 Dr. C.D. Mulder (ECO) 45 D. Gielen (LCB)
46 Dr. F.A.A.M. de Leeuw (LLO) 47 Ir. A. Stolk (LLO)
48 Ir. W. van Duijvenbooden (LBG) 49 Drs. J. Wiertz (LBG) 50 Dr. Ir. J.R.M. Alkemade (LBG) 51 H. Prins (LBG) 52 D. Wever (LBG) 53 H.L.J. van Maaren (LBG) 54 R. Jeths (LBG) 55 L. Gast (LBG) 56 W.H. Willemsen (LWD) 57 Drs. F.G. Wortelboer (LWD) 58 Dr. Ir. R.F.M.J. Cleven (LAC) 59 Drs. R. Ritsema (LAC) 60 Mrs. E. Smit (LAC) 61 Mrs. G.W.M. Nagtegaal-Wouterse (LAC) 62 Mrs. I. Eisen (LAC) 63-64 Authors 65-66 Library RIVM
67 Bureau Reports Registration 68-90 Copies for participants ICP-IM 90-100 Bureau Reports Sales
Contents
Abstract 7 Preface 9 Samenvatting 11 Summary 13 1. Introduction 152. Progress of the International Cooperative Programme on Integrated Monitoring on Air Pollution
Effects (ICP-IM) 17
2.1 Introduction 17
2.2 Network of monitoring sites 17
2.3 Studies carried out with data of the IM database 18
2.4 Task Force Meeting 1997, 1998, 1999 23
2.4.1 Task Force Meeting 1997, Dwingeloo, the Netherlands 23
2.4.2 Task Force Meeting 1998, Tallinn, Estonia 24
2.4.3 Task Force Meeting 1999, Wallingford, United Kingdom 25
2.5 Participation of the Netherlands in ICP-IM 25
3. Monitoring Programme 27
3.1. Monitoring Programme according to the ICP-IM manual 27
3.1.1 Inventory of birds (BB) 28
3.1.2 Inventory of plants (BV) 28
3.1.3 Climate (AM) 29
3.1.4 Air chemistry (AC) 29
3.1.5 Precipitation chemistry (DC) 29
3.1.6 Metal chemistry of mosses (MC) 30
3.1.7 Throughfall and stemflow (TF,SF) 30
3.1.8 Soil chemistry (SC) 31
3.1.9 Soil water chemistry (SW) 31
3.1.10 Groundwater chemistry (GW) 32
3.1.11 Lake water chemistry (LC) 32
3.1.12 Foliage and litterfall chemistry (FC, LF) 32
3.1.13 Hydrobiology of lakes (LB) 33
3.1.14 Forest damage (FD) 33
3.1.15 Vegetation (VG) 35
3.1.16 Trunk epiphytes (EP) 35
3.2 Additional programme 37
3.2.1 Leafminers (LM) 37
3.2.2 Butterflies (BF) 37
4. Results and discussion 39
4.1 Monitoring Results ICP-IM 39
4.1.1 Inventory of birds (BB) 39
4.1.2 Inventory of plants (BV) 41
4.1.3 Climate (AM) 41
4.1.4 Air chemistry (AC) 41
4.1.5 Precipitation chemistry (DC) 42
4.1.6 Metal chemistry of mosses (MC) 42
4.1.8 Soil chemistry (SC) 44
4.1.9 Soilwater chemistry (SW) 44
4.1.10 Groundwater chemistry (GW) 44
4.1.11 Lake water chemistry (LC) 44
4.1.12 Foliage and litterfall chemistry (FC, LF) 46
4.1.13 Hydrobiology of lakes (LB) 47
4.1.14 Forest damage (FD) 49
4.1.15 Vegetation (VG) 49
4.1.16 Trunk epiphytes (EP) 50
4.2 Additional programme 52
4.2.1 Leafminers (LM) 52
4.2.2 Monitoring of butterflies (BF). 52
References 57
APPENDIX I Data of the monitoring programme 61
APPENDIX II List of participating organizations and contact persons 133
Abstract
The International Cooperative Programme on Integrated Monitoring of Air Pollution Effects on Ecosystems (ICP-IM) is an extensive monitoring programme with a large number of chemical, physical and biological variables. In this report the results of the last three years of monitoring in the Lheebroekerzand, Drenthe, carried out in the framework of the United Nations Economic Commission for Europe (UN-ECE) are presented. With the data collected in the field and the measurements in the laboratoria, a database is build up containing
environmental information in relation to possible effects of air pollution on ecosystems for Europe and Canada.
The objectives of this report are to collect and present the 1997, 1998 and 1999 monitoring data of the Netherlands, to inform participating organizations and volunteers and to close the period of monitoring by RIVM in the Lheebroekerzand.
In the period from 1997 to 1999, the biological part of the integrated monitoring programme consisted of a regular inventory of vegetation, birds, epiphytes, leafminers and butterflies in the monitoring area, as well as inventories of the aquatic macrofauna present in the moorland pool Kliplo and observations on the performance of pine trees. The chemical-physical part included meteorological variables like temperature, humidity, the amount of precipitation and irradiation, together with chemical analysis of organic and inorganic compounds in air, precipitation, leaves, needles, mosses, soil, soilwater, groundwater and pool water. Comparing the data of chemical variables of different subprogrammes of 1997, 1998 and 1999 no clear trends can be recognized. However the monitored concentrations for SO4S in
air, throughfall, stemflow and lake water seem to diminish in time. For concentrations of NO3N and NH4N in air and lake water the same conclusion can be drawn. This decrease in
concentration can not be confirmed in rainwater. Concerning biological variables (Inventory of birds, Inventory of plants, Hydrobiology of lakes, Forest damage, Trunk epiphytes, Leafminers and Butterflies) nothing can be said about possible trends so far. However, it seems that the number of individuals for birds, macrofauna, leafminers and butterflies is decreasing in time. More years of sampling and analysis are required to draw conclusions on the applicability of these data. A data-analysis of all available data of the Lheebroekerzand is carried out and will be published in a separate report.
Preface
Since 1989, The Netherlands gradually developed its monitoring site at Lheebroekerzand in the province of Drenthe. The Laboratory for Ecotoxicology (ECO) from the National Institute for Public Health and the Environment (RIVM) carried out the coordination of the
monitoring activities and the collection of data. RIVM-ECO is the National Focal Point of the Netherlands for ICP-IM. Since 1993, fieldwork started according to the Manual for Integrated Monitoring Programme (Phase 1993-1996). Data of previous studies carried out in the
Lheebroekerzand were collected and made available. For the subprogramme on lake water chemistry, the available data even dated back to 1924. Next to the subprogrammes described in the Manual, additional biological inventories were added to the national programme. The biological monitoring activities consisted of regular inventory of breeding birds (BB),
epiphytes (EP), butterflies (BF), leafminers (LM) and vegetation (VG) in the monitoring area, as well as inventories of aquatic macrofauna in the moorland pool Kliplo (LB) and
observations on the performance of pine trees (FD). The chemical-physical part included meteorological parameters like temperature, humidity, the amount of precipitation and irradiation (AM), together with chemical analyses of organic and inorganic compounds in air (AC), wet and dry deposition (DC, TF, SF), mosses (MC), leaves and needles (FC, LF), lake water (LC), soil, soilwater and groundwater (SC, SW, GW). Many national institutes, organizations and volunteers made it possible to carry out this ambitious monitoring programme.
Since the start of the monitoring programme in 1993, there has been pressure on continuity. Every year, the importance of integrated monitoring in the Netherlands had to be proven. Many internal RIVM-discussions and presentations have been conducted. In 1997, the Director Environmental Research of RIVM concluded that the project did not provide the information that was required for the national tasks of RIVM. Still the decision to stop the monitoring task was postponed to enable the identification of topics that may be of national interest. In June 1999 this was successful. Cooperation was found with several projects within RIVM and requests for data for the validation of modeling were regularly posed. In view of budget restrictions for national environmental research, the Dutch Minister of the Environment decided in July 1999 to put an end to our contribution to the ICP on Integrated Monitoring. Therefore, our equipment was moved from the Lheebroekerzand in January 2000. Some internal RIVM funding has been put aside to ensure proper data handling and reporting for the 1999 monitoring results. In 2001 some time is allowed to be spend on the initiation of vegetation effects modeling as planned during the 1999 ICP-IM Task Force meeting. The seven years of continued struggle to put up an international monitoring network was about to pay off in the sense of smooth operation and worthwhile interpretation of
results.
Finally we would like to gratefully acknowledge all the institutes, organizations, volunteers, National Focal Points of ICP-IM, the ICP-IM Programme Centre and all the other persons
who contributed to this project on the national as well as the international level. The nice national and international co-operation we had over the past years was greatly appreciated.
Monique Wolters (Coordinator Field Procedures) Dick de Zwart (Statistical advisor)
Samenvatting
In dit rapport worden de resultaten van 1997, 1998 en 1999 gepresenteerd van het
monitoringprogramma uitgevoerd in het Lheebroekerzand, Drenthe. Het programma werd uitgevoerd in het kader van de United Nations Economic Commission for Europe (UN-ECE) International Cooperative Programme on Integrated Monitoring of Air Pollution Effects on Ecosystems (ICP-IM).
Het doel van dit rapport is om de gegevens van 1997 tot en met 1999 te verzamelen en te presenteren, de deelnemende organisaties en vrijwilligers te informeren over de stand van zaken en om de monitoringsperiode in het Lheebroekerzand onder coördinatie van het RIVM af te sluiten. Het merendeel van de gegevens is reeds toegevoegd aan de internationale database die zich bevindt in Helsinki, Finland. Het is zeker niet de bedoeling om in dit rapport dieper in te gaan op oorzaak en effecten.
In de periode van 1997 tot 1999 bestond het biologische gedeelte van het
monitoringprogramma uit een regelmatige inventarisatie van de vegetatie, vogels,
korstmossen, bladmineerders en vlinders evenals inventarisaties van de macrofauna aanwezig in het ven Kliplo en observaties aan naaldbomen ter bepaling van de vitaliteit. Het chemisch-fysische deel van het programma bestond uit meteorologische variabelen zoals temperatuur, luchtvochtigheid, hoeveelheid neerslag en instraling samen met chemische analyses van lucht, neerslag, bladeren, naalden, mossen, bodem, bodemwater, grondwater en venwater. Conclusies betreffende de resultaten van het monitoringprogramma zijn:
1. Uit vergelijking van de resultaten van de concentraties van chemische variabelen in de verschillende monitoringsprogramma’s in 1997, 1998 en 1999 blijkt o.a. dat de
concentraties van SO4S in lucht, doorval, stamafvoer en venwater afnemen in de tijd. Voor
concentraties van NO3N en NH4N in lucht en venwater lijkt dit ook het geval. Deze
afname van concentraties kan echter niet bevestigd worden met een gemeten afname van deze variabelen in bulk regenwater. Interpretatie van deze gegevens vereisen een langere periode van monitoring.
2. Betreffende de biologische variabelen (Inventarisatie van vogels, korstmossen, vegetatie, macrofauna, bladmineerders en vlinders) kan eveneens geen uitspraak gedaan worden over mogelijke veranderingen in de tijd. Wel lijkt het aantal individuen voor vogels,
macrofauna, bladmineerders en vlinders af te nemen. Meerdere jaren van inventariseren zijn noodzakelijk om deze vermeende trends te kunnen bevestigen.
Voortgang en conclusies betreffende de Nederlandse bijdrage aan het UN-ECE-integrale monitoringprogramma zijn:
1. In verband met het doorvoeren van bezuinigingen op milieuonderzoek heeft de minister van Milieu besloten monitoring in het Lheebroekerzand stop te zetten. In Januari 2000 zijn alle meetopstellingen in het Lheebroekerzand verwijderd. Wel is RIVM-ECO door de Minister verzocht om deel te blijven nemen aan de ICP-IM-werkgroep. Het ‘National Focal Point’ in Nederland wordt opgeheven en er zullen geen monitoringsgegevens meer aan de internationale database geleverd worden. Uitvoeren van onderzoek met ICP-IM
data zonder zelf een deelnemer te zijn van ICP-IM is in tegenspraak met de voorschriften van ICP-IM. Onderzoek met ICP-IM data mag alleen uitgevoerd worden door de
deelnemende landen. Desondanks heeft de Task Force van ICP-IM toestemming gegeven voor voortzetting van het in 1998 gestarte vegetatieonderzoek om geïntegreerde effect-voorspellingsmodellen te gaan ontwikkelen op Europese schaal.
2. Ondanks de conclusie dat het voortbestaan van het Lheebroekerzand van belang is voor nationale en internationale netwerken (Mathijssen et al., 1997) is de definitieve beslissing genomen om integrale monitoring op deze unieke locatie niet te continueren.
Belangrijke ontwikkelingen voor de voortgang van ICP-IM zijn:
1. De gereviseerde ‘Manual for Integrated Monitoring’ (1998) werd geaccepteerd tijdens de Task Force Meeting in Tallinn in April 1998. De subprogramma’s zijn zoveel mogelijk afgestemd met vergelijkbare activiteiten van andere groepen onder de UN-ECE LRTAP Conventie. Bovendien zijn in de manual de relaties tussen de verschillende programma’s geplaatst in een algemeen kader van oorzaak en effecten.
2. Deelname aan projecten en activiteiten van andere organisaties is gestimuleerd en heeft geresulteerd in samenwerkingsverbanden met o.a. IFEF, GTOS, ILTER and NoLIMITS. 3. Onderzoek met behulp van data uit de ICP-IM database wordt steeds meer uitgevoerd. Dit
houdt in dat de database steeds waardevoller wordt naarmate hij omvangrijker wordt. Helaas is dit het laatste rapport met monitoringsgevens afkomstig uit het Lheebroekerzand. Gezien de voortgang binnen het project en de internationale ontwikkelingen mag hier gesteld worden dat het aan te bevelen is een nieuw, vergelijkbaar monitoringprogramma te starten.
Summary
In this report the results of the monitoringprogramme of 1997, 1998 and 1999 in the
Lheebroekerzand carried out in the framework of the United Nations Economic Commission for Europe (UN-ECE) International Cooperative Programme on Integrated Monitoring of Air Pollution Effects on Ecosystems (ICP-IM) are presented.
The ICP-IM is an extensive monitoring programme with a large number of chemical, physical and biological variables. With the data collected a database is build up containing environmental information in relation to possible effects of air pollution on ecosystems for Europe and Canada.
The objectives of this report are to compile and present the 1997, 1998 and 1999 monitoring data of the Netherlands, to inform participating organizations and volunteers and to close the period of monitoring by RIVM in the Lheebroekerzand. It is explicitly not within the scope of this report to give a detailed analysis of causes and effects.
In the period from 1997 to 1999, the biological part of the integrated monitoring programme consisted of a regular inventory of vegetation, birds, epiphytes, leafminers and butterflies in the monitoring area, as well as inventories of the aquatic macrofauna present in the moorland pool Kliplo and observations on the performance of pine trees. The chemical-physical part included meteorological variables like temperature, humidity, the amount of precipitation and irradiation, together with chemical analysis of air, precipitation, leaves, needles, mosses, soil, soilwater, groundwater and pool water. The collected data on these variables can not yet be interpreted in detail until more elaborate time-series are available. Where possible, the series of data are compared with data of previous years.
Results and conclusions concerning the monitoring-programme are:
1. Comparing the data of chemical variables of different subprogrammes of 1997, 1998 and 1999 no clear trends can be recognized. However the monitored concentrations for SO4S
in air, throughfall, stemflow and lake water seem to diminish in time. For concentrations of NO3N and NH4N in air and lake water the same conclusion can be drawn. This
decrease in concentration can not be confirmed in rainwater. A proper interpretation of data needs more years of monitoring data.
2. Concerning biological variables (Inventory of birds, Inventory of plants, Hydrobiology of lakes, Forest damage, Trunk epiphytes, Leafminers and Butterflies) nothing can be said about possible trends so far. However it seems that the number of individuals for birds, macrofauna, leafminers and butterflies is decreasing in time. More years of sampling and analysis are required to draw conclusions on the applicability of these data.
Concerning the participation of the Netherlands to ICP-IM, remarks to be made are:
1. The Minister of the Environment decided to stop the monitoring in January 2000 because of the austerity policy in studies on the environment. However, the Ministry of the Environment requests continued participation of RIVM/ECO in ICP-IM. This means that an appeal is made to use the know-how of ECO to participate in statistical and modeling studies with the international data. The National Focal Point of the Netherlands is
cancelled and no more monitoring data will be delivered to the international database. This is in direct conflict with the agreement that studies with ICP-IM data can only be carried out by members of ICP-IM. However the Task Force of ICP-IM gave permission to continue the study on modeling environmental vegetation effects on a European scale. 2. In spite of the conclusion that the existence of the monitoring site the Lheebroekerzand in
the Netherlands is important for national and international parties and for policy aspects (Mathijssen et al., 1997), the definite decision is made to stop monitoring in this unique location.
Important to report about the progress of ICP-IM is:
1. The revised Manual for Integrated Monitoring (1998) was accepted at the Task Force Meeting in Tallinn in April 1998. ICPIM has succeeded in harmonizing the monitoring programmes with comparable activities of the other programmes under the UNECE LRTAP Convention. Besides, the revised manual defines the different programme levels in a general framework of causes and effects.
2. Participation and cooperation of ICPIM in projects and activities of external organizations is stimulated and performed with organizations as IFEF, GTOS, ILTER and NoLIMITS. 3. The data of the international ICPIM database becomes more valuable, what can be
illustrated with the many studies carried out with data from this database.
Unfortunately this is the last report to present the Lheebroekerzand monitoring data. In view of the progress of ICP-IM and the many requests for data it is recommended here to start a new, similar monitoring programme.
1.
Introduction
In 1993 the monitoring area, located in the nature reserve park Dwingelderveld in Drenthe (see Figure 1), became part of the international network of integrated monitoring sites of the International Cooperative Programme on Integrated Monitoring of Air Pollution Effects (ICP-IM). BELGIUM NETHERLANDS GERMANY NORTH SEA Latitude: 52°49'51" Longitude: 6°25'58"
Figure 1: Location of the Lheebroekerzand in The Netherlands.
This monitoring network started with 36 stations in the Pilot Programme (1989-1991) and comprises at the moment 70 stations grossly distributed over Europe and Canada. The programme combines the collection of chemical, physical and biological data over time in different ecosystem compartments simultaneously at the same location (UN/ECE, 1993). The Dutch programme was set up according to the Manual for Integrated Monitoring, Programme Phase 1993-1996 (UN/ECE, 1993). The monitoring-activities prescribed in this manual were not fully implemented. Although the continuation of the monitoring has already been discussed before (Mathijssen et al., 1997), a decision was made to continue the running programmes at a minimum level. No new programmes should start until a final decision on a possible continuation of the monitoring for a longer period would be taken. Alas, in January 2000 the monitoring in the Lheebroekerzand was not continued.
This report is the sixth in a series to present the data of the monitoring area the
previous years are reported (Mathijssen et al. 1995a, 1995b, 1996 and 1998). For more background information on the ICP-IM project and the participation of the Netherlands, the RIVM report Development of the Integrated Monitoring Area - The Netherlands (Mathijssen-Spiekman et al., 1994) can be used as a reference.
Besides the data of 1997-1999, this report will show the state of affairs of the international monitoring activities carried out under auspices of the United Nations Economic Commission for Europe (UN/ECE). It is explicitly not within the scope of this report to give a detailed analysis of causes and effects. Therefore a study will be carried out with the use of historical data gathered in the Lheebroekerzand and its surroundings. The objectives of this report are to compile the monitoring data of 1997, 1998 and 1999, to inform participating organizations and volunteers and to close the period of monitoring by RIVM in the Lheebroekerzand.
2.
Progress of the International Cooperative
Programme on Integrated Monitoring on Air
Pollution Effects (ICP-IM)
2.1
Introduction
Studies of air pollutants acting on particular receptors have often shown that an integrated approach is needed to fully understand the mechanisms of damage and the resulting effects. The ICP on Integrated Monitoring was established in 1992 (after the Pilot Programme 1989-1991) and is part of the Effects Monitoring Strategy under the UN/ECE Long-Range
Transboundary Air Pollution Convention. The main aim of ICP-IM is to provide a framework to observe and understand the complex changes occurring in the external environment. Since it became evident that the internationally adopted emission reduction protocols are likely to lead to a situation where the critical pollutant loads on a continental scale are locally
exceeded, it is becoming more and more important to be able to indicate the ecological impact of critical loadexceeding. This can be accomplished by putting more emphasis on studying biological effects in combination with local chemical exposure levels. Therefore, the monitoring and prediction of complex ecosystem effects on undisturbed reference areas require a continuous effort to improve the collection and assessment of data on the local and the international scale.
Besides the monitoring to provide an explanation of the changes in the ecosystem, ICP-IM has the objective to develop and validate models for the simulation of ecosystem responses and use them to estimate responses to actual or predicted changes in pollution stress and in concert with survey data to make regional assessments.
The programme is executed under the leadership of Sweden, and the ICP-IM Programme Centre in Helsinki, Finland, is entrusted with collecting, storing, processing and analyzing data from countries taking part in the programme. The history and the objectives of the programme as well as the organizational aspects are described in the first report concerning this monitoringproject (Mathijssen-Spiekman et al., 1994).
2.2
Network of monitoring sites
In 1999, 22 countries carried out the integrated monitoring programme with 70 sites. Most of these are European countries. Of the North American countries only Canada is still taking part in the programme. The integrated monitoring network covers the following 22 countries: Austria, Belarus, Canada, Czech Republic, Denmark, Estonia, Finland, Germany, Iceland, Ireland, Italy, Latvia, Lithuania, the Netherlands, Norway, Poland, Portugal, Russian Federation, Spain, Sweden, Switzerland, United Kingdom. These countries have either on-going data submission from at least one monitoring site or the data submission is just starting. Switzerland will carry out the IM programme on a lower level and a new decision on the extent of IM activities will be made in 2002. In the database in Helsinki, data are also
available of Hungary and Ukraine, but the monitoring activities in Hungary have been suspended and Ukraine has been unable to submit data the last few years.
In Table 1 an overview is given of the data from the participating countries reported to the ICP-IM Programme Centre.
The ICP-IM Manual detailing the protocols for monitoring each of the necessary physical, chemical and biological parameters was agreed upon in 1993 for the programme phase 1993-1996. In 1996 a start is made to set up a new manual with an intensive input of all countries. This manual more clearly illustrates the objectives of ICP-IM. The requirements of the monitoring activities are much more rationalized than in the previous manual, and the minimum requirements are more clearly specified to reduce the occurrence of non-overlapping cause and effects data. The new manual was accepted at the IM Task Force Meeting in Tallinn, April 20-22, 1998. The subprogrammes have as far as possible been harmonized with comparable activities of the other programmes under the UN ECE LRTAP Convention (mainly ICP Forests, ICP Waters and EMEP). The manual also contains the first versions of a new (optional) subprogramme ‘Toxicity Assessment’ (TA), as well as an overview on the monitoring of persistent organic pollutants (POPs) and heavy metals. The manual defines the different programme levels in a general framework of causes and effects (UN/ECE, 1998).
2.3
Studies carried out with data of the IM database
The amount of data in the IM database in Helsinki is valuable to carry out many different kind of studies. Recent assessment studies with ICP-IM data, which are reported in the 9th Annual Report 2000, are:
• Input-output and proton budgets.
Ion mass budgets have proven to be useful for evaluating the importance of various biogeochemical processes that regulate the buffering properties in ecosystems. Long-term monitoring of mass balances and ion ratios in catchment/plots can also serve as an early warning system to identify the ecological effects of different anthropogenically-derived pollutants, and to verify the effects of emission reductions.
The first results of input-output and proton budget calculations were presented in the 4th Annual Synoptic Report (1995) and the updated results regarding the effects of N
deposition were presented in Forsius et al. (1996). Data from selected ICP-IM sites were also included in an European study for evaluating soil organic horizon C:N ratio as an indicator of nitrate leaching (Dise et al., 1998). The results regarding the calculation of fluxes and trends of S and N compounds are also presented in the Acid Rain Conference in December 2000.
The budget calculations showed that there was a large difference between the sites regarding the relative importance of the various processes involved in the transfer of acidity. These differences reflected both the gradients in deposition inputs and the difference in site characteristics. The proton budget calculations showed a clear
Table 1: Internationally reported data held presently in the ICP-IM database (Annual Report 2001) AREA SUBPROGRAMME AM AC DC MC TF SF SC SW GW RW LC FC LF RB LB FD VG EP AL MB BB BV AT01 95-98 95-98 97 97 - 93,99 93,98 BY02 89-99 89-99 89-99 95-98 95-99 CA01 88-96 88-96 88-96 88-96 CH01 88-97 88-97 88-97 91-97 90-96 88-97 - 89 - 95-97 CZ01 89-98 89-98 89-98 89 89-98 89-98 - -DE01 90-99 90-99 90-99 90 90-99 90-99 90 90-99 88-99 90-99 - 90-99 90-98 - 90-99 90-95 92-95 94-99 91-96 90,95 DK01 92-99 92 86 92-99 - - - -DK02 97 97 - -DK03 94-99 94-99 95 94-99 - - - - 95 EE01 95-99 94-99 94-99 94 94-99 94-99 94 94-99 95-96 - - 94-99 94-99 - - 94-95 94,97 94-96 94-99 94 EE02 94-99 98-99 94-99 94-97 94-99 94-99 94-95 95-99 95-99 94-99 96 94-99 94-99 96-99 96 94-95 94-99 96-99 ES01 92-93 92-93 92 92-93 91-93 - -FI01 88-99 94-99 88-99 88-96 89-99 89-99 88-89 89-99 88-99 87-99 88-97 90-97 90-93 88-91 88-98 88-97 90 87-89 87 FI03 88-99 93-99 88-99 89-96 89-99 89-99 88 89-99 88-99 87-99 88-97 90-97 90 88-91 90-98 90-97 90-91 87-89 FI04 88-99 89-99 88-99 89-96 89-99 89-97 89 89-96 88-99 86-99 89-97 90-97 89-91 89-98 89-98 90-91 87-89 FI05 88-99 88-99 91,96 89-97 89-97 88 89-96 89-99 87-99 88-97 90-97 88-91 89-98 89-97 90-91 88-89 GB01 88-99 91-99 88-99 90 90-91 88-99 - -GB02 88-99 91-99 88-99 88-91 88-91 90-91 88-99 - -IE01 91-98 91-98 92-97 91-98 91-96 91-98 IS01 97-99 98-99 97-99 96 IT02 77-99 93 93-99 93-99 93-99 93-95 93-99 - - 93-95 - - 92-99 92 IT03 92-97 93-97 92-97 94-97 94-97 93,95 95-97 - - 93,97 94 - - 93-97 95 92 IT04 92-97 93-97 92-97 94-97 94-97 93,95 95-97 - - 93,95 94 - - 93-97 92 IT05 97 97 97 97 97 95 - - 97 - - 97 IT06 97 97 97 97 95 - - 97 - - 97 IT07 97 97 97 97 97 95 - - 97 - - 97 IT08 97 97 97 97 95 97 - 97 - - 97 IT09 97 97 97 97 97 95 97 - 97 - - 97 IT10 97 97 97 95 - - 97 - - 97 IT11 97 97 97 95 - - 97 - - 97 IT12 97 97 97 97 97 95 - - 97 - - 97 IT13 97 97 95 - - 97 - - 97 LT01 93-99 93-99 93-99 93 93-98 93 94-99 93-99 93-99 93-99 93-98 93 LT02 93-98 93-99 93-98 93 94-98 93 94-99 93-99 93-99 - 93-98 - 93-99 93-99 93-98 93 LT03 95-98 95-99 95-99 95-98 94 95-99 95-99 95-99 95-98 94-99 94-99 94-98 94
AREA SUBPROGRAMME AM AC DC MC TF SF SC SW GW RW LC FC LF RB LB FD VG EP AL MB BB BV LV01 93-99 93-99 93-99 94,98 94-99 94-99 94-99 94-99 94-99 93-99 - 94-99 94-99 95-98 - 94-99 94-98 94-98 96-98 LV02 93-99 94-99 93-99 94,98 94-99 94-99 94,99 94-99 94-99 93-99 93-98 94-99 94-99 95-98 95-98 94-99 94,97 94-98 96-98 NL01 61-99 86-99 61-99 93-99 93-99 93-99 93,97 97 80-99 - 80-99 93-99 93-98 - 92-99 84-99 99 90-98 NO01 87-99 87-99 87-99 92 89-99 86 89-99 87-88 87-99 - 86 - 91-99 86 86 NO02 87-91 87-99 87-99 88 89-99 89 89-99 87-99 - 89 - 92-99 89 PL01 88-96 88-96 88-96 88-90 93-96 88 93-96 88-96 88-95 88-90 PT01 88-99 89-99 94-99 90-99 90-99 RU03 89-94 89-98 89-98 RU04 89-94 89-98 89-98 90 93-99 93-99 93 93 94-96 RU12 93-94 93-98 93-94 RU14 94 94-98 94-98 RU15 90-98 90 90-97 94 90-98 90-96 90 90-98 90-98 - 93 - 91 94 RU16 89-90 89 89 89 93-99 93-96 91-94 89-94 93 94-95 91 RU18 92-97 92 92-97 92-97 93 94-97 95-97 92 92-94 92 93 94 93 93 SE04 87-97 88-99 87-99 95 87-96 95 87-88 79-96 87-96 - 99 - 97-99 95,98 96 92-98 95-99 SE14 96-99 96-99 96-99 95 96-99 95-99 96-99 96-99 - 99 95,99 - 97-99 82-99 97 97-99 95-99 SE15 97-99 96-99 96-99 96-99 97 95-99 97-99 96-99 - 97,99 95,99 - 98-99 96-99 98 97-99 95-99 SE16 99 99 99 99 99 99 99
relationship between the net acidifying effect of nitrogen processes and the amount of N deposition. As soon the deposition becomes greater, the importance of N processes
increases as net sources of acidity. A critical deposition threshold of about 8-10 kg N/ha/a, indicated by several previous assessments, was confirmed by the input-output calculations with the ICP-IM data. The output flux of nitrogen was strongly correlated with key
ecosystem variables like N deposition, N concentration in organic matter and current year needles, and N flux in litterfall. Soil organic horizon C:N ratio seems to give a reasonable estimate of the annual export flux of N for European forested sites receiving throughfall deposition of N up to about 30 kg N/ha/a. Such statistical relationships from intensively studied sites could be efficiently used in conjugation with regional monitoring data (e.g. ICP Forests and ICP Waters data) in order to link process levels data with regional-scale
questions.
The reduction in deposition of S and N compounds at the ICP-IM sites, caused by the ‘Protocol to Abate Acidification, Eutrophication and ground-level Ozone’ of the CLRTAP , was estimated for the year 2010. Implementation of the protocol will further decrease the deposition of S and N at the ICP-IM sites in western and northwestern parts of Europe, but the decrease in eastern parts will be smaller.
Modeling of soil water fluxes at ICP-IM sites using the WATBAL model (Starr, 1999) has recently started. The inflow-fluxes are measured by the subprogrammes Precipitation-, Throughfall- and Stemflow-chemistry. On a catchment scale the outflow fluxes is measured by Runoff water chemistry. However measurement of the outflow flux at the plot scale, percolating soil water, is much more difficult. In this study data of ICP-IM sites is used for validating the model. The conclusion is that WATBAL provides a means of calculating the water balance components for a soil and at a suitable time interval (monthly). Most
importantly, WATBAL can provide an estimate of the monthly soil water flux, a flux vital for making mass balances but which is difficult to measure. The results will enable a more detailed assessment of plot-scale results, as well as calculations of detailed ecosystem budgets and trends of different chemical compounds.
• Trend analysis of bulk and throughfall deposition and runoff water chemistry.
The first results from a trend analysis of monthly ICP-IM data on bulk and throughfall deposition as well as runoff water chemistry were presented by Vuorenmaa (1997). ICP-IM data on water chemistry have also been used for a trend analysis carried out by the ICP Waters and presented in the 9-years report of that programme (Lükewille et al., 1997). New calculations on the trends of N and S compounds, base cations and hydrogen ions have been made for ICP-IM sites with available data across Europe. The site-specific trends were calculated for deposition and runoff water fluxes using monthly data and non-parametric methods.
Statistically significant downward trends of SO4 and H+ deposition were observed at the
majority of the ICP-IM sites. Decreasing NH4 trends were more common than those of NO3.
Sites with higher N deposition and lower C/N-ratios clearly showed higher N output fluxes, and the results were consistent with previous observations from European forested
ecosystems. Decreasing SO4, NO3, base cation and H+ trends in output fluxes were observed
implementation of emission reduction policy in Europe. However, clear responses were not observed at all sites, showing that recovery at many sensitive sites can be slow and that the response at individual sites may vary greatly.
• Assessment of biological data using multivariate gradient analysis.
The effect of pollutant deposition on natural vegetation, including both trees and understorey vegetation, is one of the central concerns in the impact assessment and
prediction. The first assessment of vegetation monitoring data at ICP-IM sites with regards to N and S deposition was carried out by Liu (1996). Vegetation monitoring was found useful in reflecting the effects of atmospheric deposition and soil water chemistry, especially regarding sulphur and nitrogen. The results suggested that plants respond to N deposition more directly than to S deposition with respect to vegetation indices.
De Zwart (1998) carried out an exploratory multivariate statistical gradient analysis of possible causes underlying the aspect of forest damage at ICP-IM sites. These results suggested that coniferous defoliation, discolouration and lifespan of needles in the diverse phenomena of forest damage are for respectively 18%, 42% and 55% explained by the combined action of ozone and acidifying sulphur and nitrogen compounds in air.
From the present and previous ordination exercises (De Zwart, 1997) it was concluded that the applied statistical techniques are capable of revealing underlying structure and possible cause-effect relationships in complex ecological data, provided that analyzed gradients have an adequate range to be interpolated. Since the data obtained was unexpectedly poor in span of environmental gradients, the results of the presented statistical ordination only indicated correlative cause-effect relationships with a limited validity. The poor span of gradients could be attributed to the relative scarcity of biological effect data and the occurrence of missing observations both in chemical and biological data sets. It was concluded, that the power of the vegetation monitoring in impact assessment would increase considerably with improvements in the ICP-IM data reporting and inclusion of additional sites.
A scientific strategy to carry out further data assessment of cause-effect relationships for biological data, particularly vegetation, has been developed within the ICP-IM. This work is lead by the National Focal Point of the Netherlands.
• Dynamic modeling and assessment of the effects of different emission/deposition scenarios. In a policy-oriented framework, dynamic models are needed to explore the temporal aspect of ecosystem protection and recovery. The critical load concept, used for defining the environmental protection levels, does not reveal the time scales of recovery. Dynamic models have been developed and used for the emission/deposition scenario assessment at selected ICP-IM sites. (e.g. Forsius et al., 1997, 1998a, 1998b; Posch et al., 1997). These models are flexible and can be adjusted for the assessment of alternative scenarios of policy importance.
These modeling studies have shown that both the amount and the time of implementation of emission reductions determine the recovery of soil and water quality of the ecosystems. According to the models, the timing of emission reductions determines the state of recovery over a short time scale (up to 30 years). The quicker the target level of reductions is
response (> 30 years), the magnitude of emission reductions is more important than the timing of the reduction. The model simulations also indicate that N emission controls are very important to enable the maximum recovery in response to S emission reductions. Increased nitrogen leaching has the potential to not only offset the recovery predicted in response to S emission reductions but further to promote substantial deterioration in pH status of freshwaters and other N pollution problems in some areas of Europe.
At the 17th session of the UN/ECE Executive Body in December 1999 the importance of the monitoring and dynamic modeling of recovery was underlined. The important results of the ICPs and the Task Force on Health in implementing the Convention were also noted. This underlines the need to continue with the dynamic modeling work within ICP-IM.
• Assessment of concentrations, pools and fluxes of heavy metals.
A scientific strategy to carry out further data assessment on stores and fluxes of heavy metals has been developed within ICP-IM. This work is lead by the National Focal Point of Sweden and started in 1999 (Bringmark, 1998, 1999, 2000).
2.4
Task Force Meeting 1997, 1998, 1999
2.4.1 Task Force Meeting 1997, Dwingeloo, the Netherlands
The fifth meeting of the Task Force of ICP-IM was held from 23 to 26 March 1997 in Dwingeloo in the Netherlands. The meeting was attended by 38 experts from the following countries: Austria, Belarus, Canada, Czech Republic, Denmark, Estonia, Finland, Germany, Hungary, Latvia, Lithuania, the Netherlands, Norway, Poland, Russian Federation, Spain, Sweden, Switzerland and United Kingdom. The Vice-Chairman of the Working Group on Effects and a representative of the secretariat of the United Nations Economic Commission for Europe (ECE) were present. The International Cooperative Programmes on Forests and Surface Waters were also represented, as well as the Task Force on Mapping (TFM) and the
Coordination Center for Effects (CCE).
Prof. Ir. N.D. van Egmond, RIVM Director of the Environment, and Prof. Dr. H.E. Eijsackers, Head of the RIVM Laboratory for Ecotoxicology noted the important role of the UN Economic Commission for Europe (ECE) and, in particular, the effect-oriented activities executed under the Convention. Mrs Dr. E. de Hullu, State Forestry Service The Netherlands, provided information on recent national efforts to protect forest ecosystems.
On the agenda for the meeting were the following issues: Preparation of the updated manual, Draft Annual Report 1997, Cooperation with other ICPs and the future work programme. For updating the manual two working groups were established to update the relevant subprogrammes. During the meeting the draft-version of the manual was discussed in small groups. The TF requested the existing expert-groups to incorporate the agreed changes, amendments and additions. An editorial group was asked to finalize the draft manual for acceptation by the TF in 1998.
The draft of the sixth Annual Report 1997 and a draft contribution of ICP-IM to the Joint Report of the ICPs (UN-ECE, 1997) and the Mapping Programme were accepted.
The Task Force strongly recommended to the Working Group on Effects to consider all possible ways and means for promoting even closer cooperation and harmonization between
ICPs and in particular within the ongoing effect-oriented activities on the national level, in order to ensure most effective use of the limited resources.For the work-programme of ICP-IM for 1998 was noted that:
• Programme activities should be focused on the priority needs of the Executive Body, in particular those related to the preparation of future protocols.
• More data will be needed concerning environmental effects of heavy metals, persistent organic pollutants, volatile organic compounds and ozone.
• Continuing integration of effect-oriented activities would require further strengthening of cooperation with ICPs Forests and Waters, but also with the Task Force on Mapping and with EMEP.
• Effective continuing activities of the NFPs are indispensable for further implementation of the Programme; their activities should be adequately supported on both the national and international level.
• Successful implementation of the programme depends on a sufficient quantity of quality controlled data in the IM database.
2.4.2 Task Force Meeting 1998, Tallinn, Estonia
The sixth meeting of the Task Force of ICP-IM was held from 20 to 22 April 1998 in Tallinn in Estonia. The meeting was attended by 39 experts from the following countries: Austria, Czech Republic, Denmark, Estonia, Finland, Germany, Ireland, Italy, Latvia, Lithuania, the
Netherlands, Norway, Russian Federation, Sweden, Switzerland and United Kingdom. Also represented were the Chairman of the Working Group on Effects, a representative of the
secretariat of the United Nations Economic Commission for Europe (ECE), ICPs on Forests and Surface Waters. The participants were welcomed by Mr. O. Tammemäe, Director of the Nature Protection Department of the Estonian Ministry of the Environment. On the agenda were the revision of the manual, cooperation with other programmes and organizations, reports to the Working Group on Effects, Workplan for 1998/1999 and the independent external review of the ICPs.
The Annual Report (1998) and the Joint Report were presented. Concerning the Workplan for 1998/1999 the Task Force agreed that, in addition to further work on acidification and nitrogen parameters and related trend analyses, and on the application of dynamic modeling, future programme priorities should also cover:
• Studies in bioindication and heavy metals fluxes • Intercomparison/intercalibration exercises • Risk assessment
• Studies on the regional significance of site-specific dynamic models • Integrated analyses of selected problems for longer time periods
• Closer cooperation with other ICPs as well as participation in projects outside the Convention.
The chairman informed the Task Force about the independent external review of all
programmes participating in the effect-oriented activities. An external reviewer will document the scope and depth of ICP-IM activities, the quality of the results and their relevance to and importance for the Convention.
2.4.3 Task Force Meeting 1999, Wallingford, United Kingdom
This seventh meeting of the Programme Task Force was held from 20 to 21 April 1999 in Wallingford in the United Kingdom. The meeting was attended by 30 experts from the following countries: Austria, Belarus, Czech Republic, Denmark, Estonia, Finland, Germany, Latvia, Lithuania, the Netherlands, Norway, Russian Federation, Sweden and United Kingdom. Also represented were the Chairman of the Working Group on Effects, a representative of the secretariat of the United Nations Economic Commission for Europe (ECE) and representatives of ICP on Crops and ICP on SurfaceWaters.
The meeting started with reviewing the recent activities and results of the programme and their contributions to other bodies under the Convention, in particular to the Working Group on Effects and to the Executive Body. The Working Group on Effects did complete the revised manual. Cooperation with ICP on Waters has resulted in organizing the Workshop on biological monitoring and cooperation with organizations outside the Convention has been carried out (e.g. IFEF, GTOS, and NoLIMITS). The ICP-IM database has been improved and updated in October 1998.
The results of the external review of all the ICPs were discussed in the Working Group on Effects in February 1999. The main general conclusions drawn from the review are:
• the interests of the Executive Body are being well served by the effect-oriented activities of the Working group on Effects;
• the scientific quality is generally good;
• the results are rarely presented in a form that is easily understood by policy makers, media or the public.
Particularly the results of ICP-IM were well received in the review. The efforts to assemble a central database, harmonization of methods and the inter-site data comparisons were mentioned favorably. Only the need to write readable summaries in all reports in order to improve their usefulness to non-scientists was advised.
For future priorities for ICP-IM can be referred to the programme priorities of 1998.
2.5
Participation of the Netherlands in ICP-IM
Monitoring in the Lheebroekerzand has been carried out at a minimum level. Data has been delivered to Helsinki and has been imported in the ICP-IM database.
During the revision of the manual the Netherlands played an important role to stimulate the monitoring of biological parameters and put the whole monitoring programme in a general framework of causes and effects.
The Netherlands has been carried out the study: Multivariate gradient analysis applied to relate
chemical and biological observations in 1997 and is coordinating the study: IM data used for modeling environmental vegetation effects on a European scale started in 1998 and continuing
3.
Monitoring Programme
3.1. Monitoring Programme according to the ICP-IM manual
In 1997, 1998 and 1999 the subprogrammes are carried out according the Manual for Integrated Monitoring (Programme Phase 1993-1996). The choice is made to run all the obligatory
monitoring programmes for intensively monitored sites, if possible. However, since 1997 the continuation by RIVM has been discussed, the decision was made to continue the running programmes at a minimum level and no new programmes would start until was decided to stop or to continue the monitoring for a longer period (Mathijssen-Spiekman et al., 1997).
Table 2: Monitoring subprogrammes and availability of data
Compulsory subprogrammes Data NL01
Inventory of birds (BB) 1928-1998
Inventory of plants (BV) 1988-1999
Climate (AM) 1961-1999
Air chemistry (AC) 1984-1999
Precipitation chemistry (DC) 1982-1999
Metal chemistry in Mosses (MC) 1993-1999 Throughfall and Stemflow chemistry (TF, SF) 1982-1999
Soil chemistry (SC) 1993-1997
Soil water chemistry (SW) 1997
Groundwater chemistry (GW) 1980-1999
Runoff water chemistry (RW) -1)
Lake water chemistry (LC) 1924-1999
Foliage and litterfall chemistry (FC, LF) 1993-1999
Hydrobiology of streams (RB) -1)
Hydrobiology of lakes (LB) 1992-1999
Forest damage (FD) 1984-1999
Vegetation (VG) 1988-1999
Trunk epiphytes (EP) 1951-1999
Aerial green algae (AL) -2)
Microbial decomposition (MB) -2)
1) Not possible in Lheebroekerzand
2) Possible, but not started in view of discussion of continuation of the monitoring
In Table 2 an overview is presented of the obligatory monitoring activities executed at the monitoring area Lheebroekerzand (NL01). The first year indicates the year in which the subprogramme started or since when data are available. Data of studies carried out in years before 1993 are not all collected according to the requirements described in the manual. A description of the methods of the different monitoring studies is indicated in the following subchapters. Refer to the Figures 1 and 2 for an indication of the location of the involved stations.
5x50 mtr zero coordinate
bird census area vegetation inventory area
1 2 3 4 5 6 7 1 2 3 4 5 6 7 Climate Lake Chemistry Lake Biology
Metal Chemistry Mosses
Precipitation Chemistry Foliage Chemistry Litterfall Chemistry Throughfall Stem Flow
Soil & Groundwater Chemistry Foliage Chemistry
Throughfall Stem Flow
Soil & Groundwater Chemistry Foliage Chemistry
Litterfall Chemistry Forest Damage water
Station Sub-programme
Soil & Groundwater Chemistry route butterfly inventory
Figure 2: Base map Lheebroekerzand with station and activity indication.
3.1.1 Inventory of birds (BB)
The Dutch Cooperative Organizations on Bird Research (SOVON) carried out the breeding bird monitoring programme in 1997 and 1998. In 1999 the countings were not carried out. During the breeding season, in April, May and June, 6 visits in the field have to be made to count the number of pairs of breeding bird species according to the method described by Van Dijk (1993). The observations are done by P. Kerssies (SBB) in the entire Dutch monitoring area of 95 ha. No changes were made with regard to the previous years of bird monitoring in the
Lheebroekerzand.
3.1.2 Inventory of plants (BV)
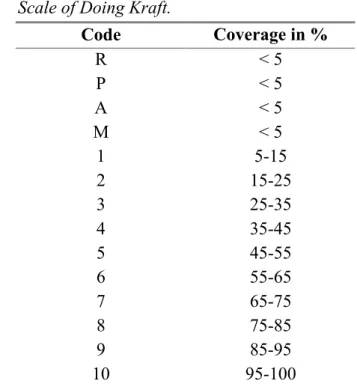
ALTERRA made an inventarisation of the plants in the area in1999. In 55 plots (10m x 10m) in the vegetation inventory area (Figure 2) all observed mosses, herbs, plants and shrubs smaller than 0.5 m were recorded with their coverage. The coverage is estimated according to the scale of Doing Kraft (Broekmeyer et al., 1991) in Table 3.
Table 3: Scale of Doing Kraft. Code Coverage in % R < 5 P < 5 A < 5 M < 5 1 5-15 2 15-25 3 25-35 4 35-45 5 45-55 6 55-65 7 65-75 8 75-85 9 85-95 10 95-100
A description of the detailed method is given by Broekmeyer et al. (1991).
3.1.3 Climate (AM)
The RIVM Laboratory for Ecotoxicology (ECO) carried out meteorological measurements. The meteostation of ECO is situated at station number 1 in the monitoring area (Figure 2) and measures air temperature at 1.50 m height, soil temperature just below the surface and at a depth of 20 cm, relative air humidity, irradiation (solari-meter) and UV-B-radiation at 1.50 m height. Every minute the variables are measured. Mean values are registered once an hour. A description of the meteostation is provided in Standard Operating Procedure (SOP) no. ECO/271.
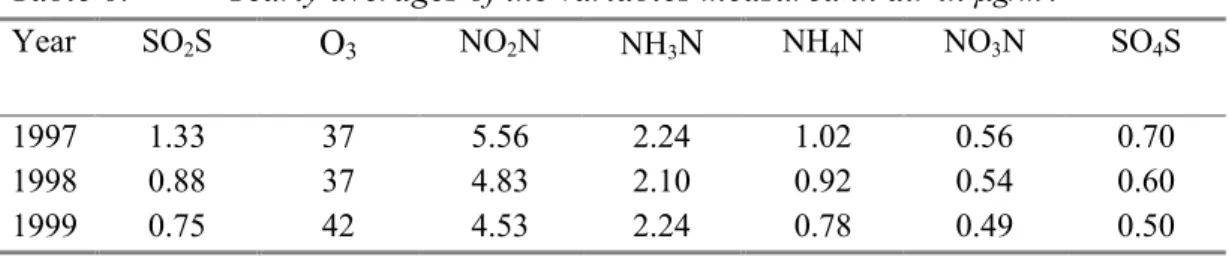
3.1.4 Air chemistry (AC)
The RIVM Laboratory of Air Research (LLO) carried out air chemistry measurements in the framework of the Dutch National Air Quality Monitoring Network. The measurements are continuous and include gaseous compounds: sulfur dioxide, ozone and nitrogen dioxide, and particulate compounds: ammonium, nitrateand sulfate. These data are collected from a station
in Witteveen, approximately 15 km from Lheebroekerzand. The air samples are taken at a height of 3.5 meters. No changes were made with regard to the previous years of monitoring the Lheebroekerzand.
3.1.5 Precipitation chemistry (DC)
In the monitoring area at station 4 (Figure 2), the RIVM-ECO collects bulk deposition samples every week. They are collected by five funnels placed approximately 1.5 m above ground level to prevent direct soil contamination. Each funnel has a collecting surface area of 380.13 cm2. Collectors are equipped with a guard ring to avoid bird droppings. Sampling bottles
(polyethylene, 5 liters) are shielded from sunlight to prevent algal growth. To recognize
control-bottles filled with aquadest. These bottles follow the whole procedure of the sampling bottles in the laboratory, the field and the transport. The method of collection and transport of the samples is described in SOP no. ECO/234. The collected rainwater of the five sampling bottles is mixed and treated to be one sample. The mixture is vacuum filtered over a 0.45 µm pore size cellulose acetate filter prior to analysis. The Laboratory of Inorganic Chemistry (RIVM-LAC) measures the precipitation volume, pH and conductivity and determines concentrations in the mixture of sodium, potassium, calcium, magnesium, cadmium, copper, lead, zinc, nickel, arsenic, chromium, aluminium, chloride, ammonium, nitrate, phosphate and sulfate. The analytical methods have been standardised according to the internal procedures of LAC. Describing SOPs are available upon request.
3.1.6 Metal chemistry of mosses (MC)
RIVM-ECO carried out the sampling of the mosses. In June 1997, May 1998 and 1999, five samples are taken of Pleurozium schreberi according the method described in SOP no. ECO/317. The samples are collected at station number 3 in Figure 2. Each sample consists of about 2 litres of moss material collected in plastic bags. All the dead material and attached litter was removed from the samples. The samples are stored frozen at a temperature of - 20 ºC until further treatment. RIVM-LAC carried out the following analyses: total sulphate, total
phosphate, aluminium, arsenic, barium, calcium, cadmium, cobalt, chromium, copper, iron, potassium, magnesium, manganese, sodium, nickel, lead, antimony, silicon, strontium, titanium, vanadium and zinc. The analytical methods have been standardised according to the internal procedures of LAC. Describing SOPs are available upon request.
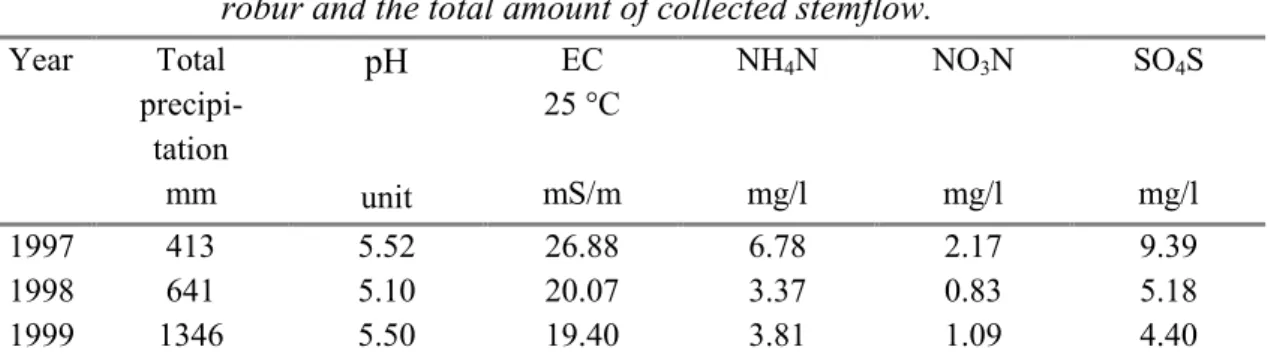
3.1.7 Throughfall and stemflow (TF,SF)
In the monitoring area at station 5 and 6 (Figure 2) samples were collected every week by RIVM-ECO. The method of collection and transport of the samples is described in SOP no. ECO/234.
Throughfall precipitation is collected by the same type of funnel as used for bulk-deposition. Five collectors are placed under oak trees (Quercus robur, station 5
Figure 2) and five under pine trees (Pinus sylvestris, station 6 Figure 2).
The same trees are used to collect stemflow precipitation. Stemflow collectors of the spiral type are attached to four of the oak trees and five of the pines. Sampling bottles of 5 litres are
installed at the base of the trunk digged in the ground to avoid large differences in temperature. The method used for attaching the spiral to the tree is not satisfying. Due to leakage, part of the stemflow is not collected. A better method is not known.
The collected rainwater of the sampling bottles is mixed and treated to be one sample. The mixture is vacuum filtered over a 0.45 µm pore size cellulose acetate filter prior to analysis. RIVM-LAC is analysing the mixtures for pH, specific conductivity, sodium, potassium, calcium, magnesium, cadmium, copper, lead, zinc, nickel, arsenic, chromium, aluminium, chloride, ammonium, nitrate, phosphate and sulphate. The analytical methods have been standardised according to the internal procedures of LAC. Describing SOPs are available upon request.
3.1.8 Soil chemistry (SC)
The sampling and measuring of the soil in the monitoring area is carried out by the RIVM Laboratory of Soil and Groundwater Research (LBG) in the framework of the project ‘National Soil Quality Monitoring Network’. The sampling frequency is once every 7 years. This
sampling is performed at the stations 4, 5 and 6 (Figure 2) and carried out in 1993.
The analysed variables are total organic carbon, pH (water and KCl extraction), cation exchange capacity, copper, lead, cadmium, zinc, chromium, iron, manganese and total phosphorous. Besides the sampling of the ‘National Soil Quality Monitoring Network’ also samples are taken by ECO (Groot et al., 1998) at station 4 (Figure 2) in 1997. Between September and December 1997 30 l soil samples were collected from the top layer
(0-20 cm). The samples were transferred to the laboratory and stored in polyethylene containers at 5 °C for further handling and analysis. All roots present in the samples were removed in the laboratory and agglomerates were broken by hand or machine. Particles larger than 4 mm were removed by sieving, after which the remaining soil was homogenised. The soil material to be used for chemical analyses was air-dried, particles larger than 2 mm were removed by sieving. The samples were analysed by LAC only in 1997 (no samples have been taken in the latter two years). The measured values are pH(CaCl2), pH(H2O), pH(KCl), total organic carbon, nitrogen
total, arsenic, cadmium, chromium, copper, iron, nickel, lead and zinc. The analytical methods have been standardised according to the internal procedures of LAC. Describing SOPs are available upon request.
3.1.9 Soil water chemistry (SW)
In 1997 this program is carried out by RIVM-ECO (De Groot et al., 1998). Pore water is collected from the same soil samples as used in the subprogram Soil chemistry. For pragmatic reasons, a somewhat modified procedure was applied for the collection of pore water, as compared to the procedure used by Janssen et al. (1996).
All roots present in the samples were removed and agglomerates were broken by hand or machine. Particles larger than 4 mm were removed by sieving, after which the remaining soil was homogenised. Two kg of soil sample was moistened with a 2 mM solution of Ca(NO3)2 to
get a pH-value of 2. Subsequently the soils were stored for three weeks at 5 °C. After this equilibrium period, pore water was obtained by centrifugation of the soils at 7500 rpm (600g) at 5 °C. Centrifugation was continued until about 150 ml of pore water was collected. If
insufficient quantities of pore water could be collected, another portion of two kg of soil was centrifuged. After centrifugation, the pore water collected was filtered over a 0.45 µm pore size filter, and the pH was measured (pH(H2O)). The pore water collected was divided over two
polyethylene bottles: one bottle of 30 ml of pore water was acidified with concentrated nitric acid to set the pH to 2, and used for metal analyses. The second bottle of 100 ml pore water was used for the determination of anions, pH and DOC.
The samples were analysed by LAC only in 1997 (no samples have been taken in the latter two years). for pH(H2O), specific conductivity, dissolved organic carbon, aluminium, arsenic,
calcium, cadmium, chloride, chromium, copper, iron, potassium, magnesium, manganese, nitrate, sodium, nickel, lead, phosphate, sulphate and zinc. The analytical methods have been standardised according to the internal procedures of LAC. Describing SOPs are available upon request. In 1998 and 1999 no samples were taken.
3.1.10 Groundwater chemistry (GW)
This programme is carried out by the RIVM-LBG in the framework of the project ‘National Monitoring Network on Groundwater Quality’ with a sampling frequency of once every 7 years. The groundwater samples are also taken at the stations 4, 5 and 6 (Figure 2). The sampling has been carried out in 1993. Measured variables are ammonium, arsenic, cadmium, calcium, chloride, chromium, copper, iron, lead, magnesium, manganese, nitrate, organic carbon, pH, phosphate, phosphorous total, potassium, sodium, water-level and zinc.
Furthermore, groundwater samples are taken in Eemster, situated approximately 4 km from the monitoring site Lheebroekerzand. The groundwater-flow in the area is from the monitoring site to the direction of Eemster. The sampling is carried out every year in the framework of the project ‘National Monitoring Network on Groundwater Quality’ by LBG. The sampling methods are described in SOPs of LBG.
In 1997, 1998 and 1999 samples are taken through a sampling tube with filters at the depth of 11.05-13.05 m. In 1998 and 1999 supplementary samples are taken at the depth of 28.60-30.60 below ground level. The measured variables, carried out by LAC, are aluminium, arsenic, barium, calcium, cadmium, chloride, chromium, copper, iron, potassium, magnesium,
manganese, ammonium, nitrate, sodium, nickel, phosphorous total, sulfate, strontium, zinc and pH. The analytical methods have been standardised according to the internal procedures of LAC. Describing SOPs are available upon request.
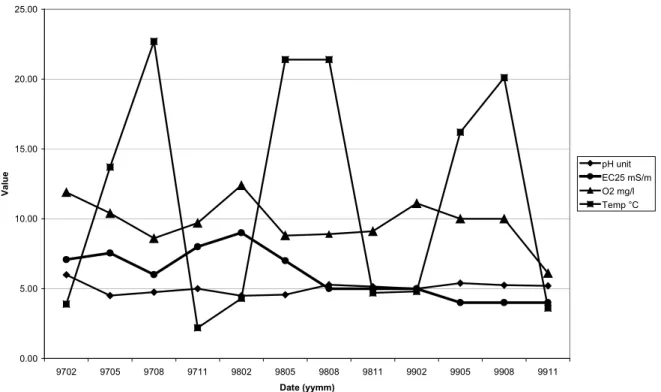
3.1.11 Lake water chemistry (LC)
The lake Kliplo is located at station number 2 (Figure 2) in the monitoring area. The monitoring of the lake Kliplo was carried out by RIVM-ECO. In 1997, 1998 and 1999 the samples are taken in February, May, August and November at a depth of 20 cm from the lake surface. Since August 1998 a different sampling-place was chosen because the previous sampling-place was impossible to reach with the necessary equipment. LAC is analysing the variables: waterlevel, color number (quantifying the amount of ‘yellow substances’ or humic compounds),
temperature, pH, conductivity, oxygen content, sodium, potassium, calcium, magnesium, cadmium, copper, lead, zinc, nickel, arsenic, chromium, ammonium, nitrate, phosphate, sulphate, chloride, aluminium, alkalinity and silicon.
The sampling method is described in SOP no. ECO/312. The analytical methods have been standardised according to the internal procedures of LAC. Describing SOPs are available upon request.
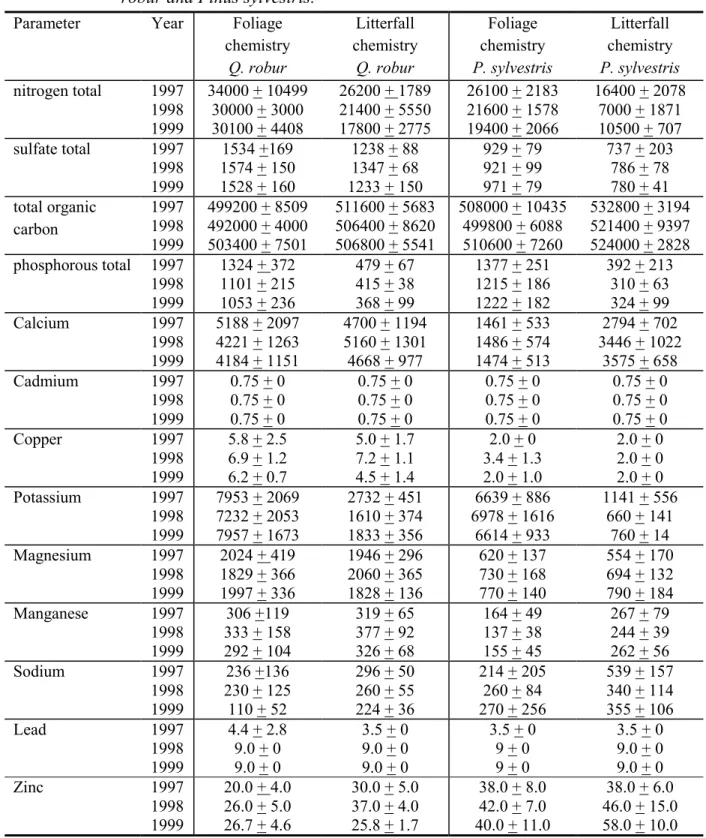
3.1.12 Foliage and litterfall chemistry (FC, LF)
The collection of leaves and needles is carried out by RIVM-ECO and is described in SOP no. ECO/278. In 1997, 1998 and 1999 foliage samples are taken in September of 10 oak trees (Quercus robur) at the stations 5 and 6 (Figure 2), and in November of 10 pine trees (Pinus
sylvestris) at the station number 4 (Figure 2). Approximately 100 leaves or needles were
gathered at the wind and light exposed side of the trees and transported to the laboratory in plastic bags. In the laboratory the samples were kept under refrigeration (-20 °C) until analysis. In the autumn of 1997, 1998 and 1999 also litter is collected in specially designed litter
containers. The litter sacs used have a depth of 0.5 m deep to prevent the litter from being blown out. Separate containers were placed under 5 oak and 5 pine trees at the stations 4 and 6 (Figure 2) from September until December. The analysis of leaves and needles is carried out by LAC. The measured variables in the leaves and needles are: oven-dry sample weight of 100 leaves or needles for foliage chemistry, litterfall weight of total amount, nitrogen total, sulphate total, total organic carbon, phosphorous total, aluminium, arsenic, barium, calcium, cadmium, cobalt, chromium, copper, iron, potassium, magnesium, manganese, sodium, nickel, lead, antimony, silicon, strontium, titanium, vanadium and zinc. The analytical methods have been standardised according to the internal procedures of LAC. Describing SOPs are available upon request.
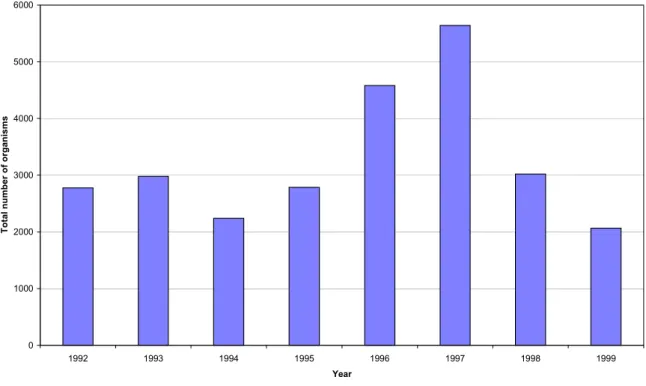
3.1.13 Hydrobiology of lakes (LB)
ZUIVERINGSSCHAP DRENTHE started the monitoring programme of the macrofauna in the lake
Kliplo in 1992 (station 2 in Figure 2). Kliplo is one of the lakes that is sampled in the framework of macrofauna monitoring in the province of Drenthe. Due to the uneven
distribution of macrofauna species, the method of sampling can only generate semi-quantitative data. However, since the sampling method is standardised, the results are given in the number of organisms collected per species per year. This makes it possible to compare the results with data of previous years. From 1992 to 1998 samples are taken by G. Duursema in May and September at a depth of approximately 1 meter. In 1997 the sampling was carried out in October instead of September. Since 1999 the monitoring of the macrofauna is carried out by M. Fagel of the ‘WATERSCHAP REEST EN WIEDEN’. In 1999 the monitoring was executed in May
and September. In Mathijssen-Spiekman et al. (1994) a description of the used sampling and determination techniques is given.
The samples of the subprogramme lake water chemistry are used for analysing the chlorophyll content by the RIVM Laboratory of Water and Drinkingwater Research (LWD). In paper LWD WV011-003 a description of the used method is given. The samples are taken by ECO in February, May, August and November according to SOP no. ECO/312.
3.1.14 Forest damage (FD)
The monitoring variables required by the ICP-IM programme have been collected from two different sets of data, all compiled from the same 25 trees. Observations of the first set consist of yearly surveys done by P. Kerssies of the State Forestry Service (SBB). The height of the trees, the crown height and crown width is not measured by SBB. RIVM-ECO executed measurements on the height of the trees in 1997, 1998 and 1999 and since 1998 ECO started with the measuring of crown-height and crown-width.
In September 1997, P. Kerssies (SBB) was not able to do the measurements. Instead of SBB, ECO measured all the variables in 1997, with exception of the variable ‘needle year’. ECO did not have the knowledge to observe this parameter properly. In 1998 and 1999 SBB did the measurements and observations as in previous years (1984-1996). The following variables have been measured: the diameter at breast height, tree class, crown condition (broken or dying), needle characteristics (coverage, year, discoloration and length), canopy cover, green needles and twigs on the ground and the presence of secondary shoots. In addition, the presence or
absence of removal damage, fungal damage, bark beetles or other insect infections, hanging twigs, sap/resin flow and dead bark is recorded.
In 1997, 1998 and 1999 ECO measured the tree height from the same 25 trees. Three different kinds of equipment are used to carry out these measurements. In principle the methods are similar.
In 1997 the height of the tree is measured as shown in Figure 3. Tree height is measured to the highest shoot in the center of the crown. The slope of measuring is
45 °. The height of the tree is the distance to the tree plus the eye-height from which is measured.
45°
Figure 3: Method of measuring tree height in 1997
In 1998 the height of the tree and the crown-height is measured with a Blume Leiss which is shown in Figure 4. By pointing the equipment to the heighest shoot in the crown from a distance of 15 meter from the tree, the height of the tree was read directly from the equipment. By adding the eye-height of the observer the actual tree height is known.
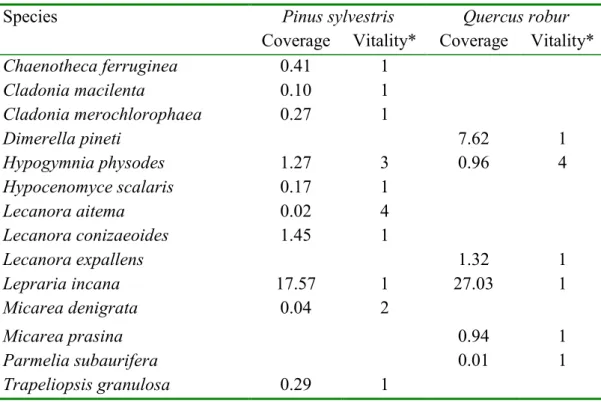
Figure 4: Method of measuring tree height in 1998 with a Blume Leiss
The equipment used in 1999 to measure the height of the tree and the crown-height is a Suunto optical height meter PM5/1520 (Figure 5).