An
internatio-nal
compari-son of four
quantitative
An international comparison of four quantitative risk assessment
approaches
An international comparison of four
quantitative risk assessment
approaches
Benchmark study based on a fictitious LPG plant RIVM Report 620552001/2011
Colophon
© RIVM 2011
Parts of this publication may be reproduced, provided acknowledgement is given to the 'National Institute for Public Health and the Environment', along with the title and year of publication.
L. Gooijer, RIVM
N. Cornil, Faculté Polytechnique de Mons
C.L. Lenoble, INERIS
Contact:
Leendert Gooijer
Centre for External Safety, RIVM
leendert.gooijer@rivm.nl
This investigation has been performed by order and for the account of the Ministry of Infrastructure and the Environment, within the framework of international benchmark.
Abstract
An international comparison of four quantitative risk assessment approaches
Benchmark study based on a fictitious LPG plant
The methods to determine external safety risks used in the United Kingdom, France, the Walloon Region of Belgium and the Netherlands are very different. The differences concern both the way the calculations are performed and the consequences calculated (such as deaths or health damage to persons). Despite the differences, the methods yield similar results in terms of the safety
distances.
This conclusion can be drawn from a benchmark study of a fictitious LPG storage plant performed by experts of these countries. However, similar results can lead to different policy implications. For instance, the safety distances in the
Netherlands and France are used as limit values, whereas in Belgium and the United Kingdom they are used as guide values.
Keywords: quantitative risk assessment, QRA, benchmark study, LPG, external safety
Rapport in het kort
Een internationale vergelijking van vier kwantitatieve risicoanalyse methoden
Benchmark studie op basis van een fictief lpg-bedrijf
De methoden die in het Verenigd Koninkrijk, Frankrijk, Wallonië (België) en Nederland worden gebruikt om externe veiligheidsrisico’s te bepalen verschillen sterk van elkaar. Dat betreft zowel de manier waarop de berekeningen worden uitgevoerd als de aard van de effecten die worden berekend (zoals dodelijke slachtoffers of gezondheidsschade aan personen). Desondanks liggen de veiligheidsafstanden die met deze methoden zijn berekend dicht bij elkaar. Dit blijkt uit een risicoanalyse die door experts uit deze landen is uitgevoerd van een fictief opslagbedrijf met lpg. Gelijksoortige uitkomsten kunnen overigens per land tot uiteenlopend beleid leiden. Zo gelden de veiligheidsafstanden in
Nederland en Frankrijk als limietwaarden, maar in België en het Verenigd Koninkrijk als advieswaarden.
Trefwoorden: kwantitatieve risicoanalyse, QRA, lpg, externe veiligheid, benchmark studie
Contents
Summary—9
1 Introduction—13
2 Brief overview of the four QRA approaches—15
2.1 France—15
2.2 United Kingdom—17
2.3 The Netherlands—18
2.4 Walloon Region – Belgium—19
3 Description of the case—21 4 Main results of the LPG case—23
4.1 Critical scenarios and dangerous phenomena—23
4.1.1 France—23
4.1.2 United Kingdom—24
4.1.3 The Netherlands—25
4.1.4 Walloon Region – Belgium—25
4.2 Individual risk—26
4.2.1 France—26
4.2.2 United Kingdom—28
4.2.3 The Netherlands—29
4.2.4 Walloon Region – Belgium—29
4.3 Societal Risk—30
4.3.1 France—31
4.3.2 United Kingdom—31
4.3.3 The Netherlands—32
4.3.4 Walloon Region – Belgium—33
4.4 Policy implications—33
4.4.1 France—33
4.4.2 United Kingdom—34
4.4.3 The Netherlands—34
4.4.4 Walloon Region – Belgium—34
5 Discussion—37
5.1 QRA approaches—37
5.2 Dangerous phenomena and effect distances—37
5.2.1 BLEVE of the sphere butane (700 m3)—38
5.2.2 Flash fire of the mounded propane vessel (2500 m3)—39
5.2.3 Summary of comparison of effect distances—40
5.3 Individual risk—40
5.4 Societal risk—40
5.5 Policy implications—41
6 Conclusions—43
References—47
Annex 1. Site description LPG case—49
Annex 3. HSE report LPG comparison study—85 Annex 4. RIVM report LPG comparison study—101 Annex 5. FPMs report LPG comparison study—125
Summary
Within the European Union the different countries use different risk assessment methods for the land use planning and the licensing of SEVESO II companies with dangerous materials. The question is if the different approaches also lead to different safety distances and different policy implications. In order to compare the Quantitative Risk Assessment (QRA) methods used in the United Kingdom, France, the Netherlands and the Walloon Region of Belgium, a benchmark exercise was performed for a fictitious LPG plant. This report contains the summary of the four approaches and the different results of the calculations and the policy implications of the results. The calculations were performed in the period of 2007-2009.
QRA approaches
INERIS (France) uses a semi quantitative risk based approach based on bow tie analyses. This results in the ‘Natrice de Mesure de Maîtrise des Risques’ (MMR matrix) and the ‘Plan de Prévention des Risques Technologiques’ (PPRT, comparable to individual risk). The MMR matrix shows the risk level (a combination of the severity and the probability) of each accidental scenario. Some cells (risk levels) of this matrix are ‘unacceptable’ and operators are required to implement new safety measures in order to reduce the probability or the severity of the scenarios involved. The PPRT shows different zones with different implications for land use. For existing constructions, possible measures proposed by the PPRT for high risk zones may be expropriation, relinquishment or reinforcement of buildings. For future constructions, possible measures proposed in the framework of a PPRT for high risk zones may be to forbid building developments or to apply specific conditions to the build of a new construction (related to the building resistance toward accidents).
In the United Kingdom the ‘protection based concept’ is used by the Health and Safety Executive (HSE) to determine three safety zones based on the hazard of the flammable substance. For LPG only a Boiling Liquid Expanding Vapour Explosion (BLEVE) is considered. These three zones are used by HSE to give an advice (against or not against) in case of a new development in those zones. Hereby, the developments are categorized into different categories related to vulnerability (e.g. the highest category concerns large hospitals, large schools and sports stadiums). The societal risk and the criteria to be used are under discussion in the United Kingdom, but for this benchmark study HSE calculated an FN-curve, with an upper and lower guide value.
The QRA in the Netherlands results in individual risk contours and an FN-curve (societal risk). The individual risk contour of 10-6 per year is the limit value:
within this contour no vulnerable objects (e.g. houses, schools, hospitals) are allowed. For the societal risk a guide value is used. The competent authority must account for the height of the societal risk in relation to socio-economic benefits. The way to perform a QRA (scenarios and failure frequencies, the software program and guidelines) has been prescribed in the legislation. RIVM is responsible for the management and development of the guideline and the software program SAFETI-NL.
In the Walloon Region (Belgium) a probabilistic approach is used as well. The Major Risk Research Centre of the Faculté Polytechnique de Mons (FPMs) calculates risk curves around the SEVESO II companies. The risk contours calculated are based on an individual suffering irreversible injury. The area
delimited by the 10-6 per year iso-risk curve is called the ‘consultation zone’. The
competent authority gives an advice for every land use project inside this zone. For the decision-making, a matrix crossing the level of risk and the type of buildings is used to grant or deny the permit for a project (e.g. houses are not allowed inside the 10-5 per year iso-risk curve, and hospitals are not allowed
inside the 10-6 per year iso-risk curve). The societal risk is not taken into
account.
The four approaches show a difference between robust, generic (standardized) methods on one side and specific methods based on expert judgment on the other side. The choice of a ‘generic’ method (in the Netherlands, the Walloon Region and the United Kingdom) means that the QRA is not very well suited for analyzing risk reducing measures in detail; a specific approach (like the French approach) is more suitable for this objective. But a generic QRA method makes the QRA more transparent and robust. Further, the use of a generic QRA method doesn’t mean a subsequent analysis is not possible at all. It is possible to see if the risks can be mitigated for example by reducing the risks of the most contributing scenarios (e.g. reducing the amount, relocation an activity).
Results of the benchmark study
To compare the different approaches, the four institutes used their own
approach to calculate the risk of a fictitious LPG plant. At this fictitious LPG plant propane and butane is unloaded from rail tank cars and road tankers and is stored in vessels.
Scenarios and effect calculation
The results of the four risk assessments show differences in the scenarios (accidents), frequencies and effect calculations. In France the storage vessels of propane and butane are not considered when mounded or when some specific conditions related to safety are fulfilled. The (un)loading activities are, in this case, predominant. But in the United Kingdom and the Netherlands the vessels dominate the risk results.
Further, the selection of phenomena shows differences. For example, in the Netherlands and the Walloon Region a BLEVE of the vessels propane is not considered, because the vessels are mounded. However, HSE takes the BLEVE of the mounded vessels into account.
To get more insight in the differences, the effect calculations of the BLEVE of the butane sphere (700 m3) and the flash fire of the mounded propane vessel
(2500 m3) were analysed. The largest distances of the BLEVE are between 380
and 920 meters. The distances of the flash fire are between 500 and 655 meters. The differences in effect distances can be explained by modelling differences (% of volume, process conditions, burst pressure of the BLEVE, parameters and software) and retained thresholds.
The thresholds (end of calculation) differ from the dose for irreversible damage (FPMs), the probit relation of heat radiation (RIVM) to the level of heat radiation used (different levels used by HSE and INERIS). The differences are also related to the different scope of the calculations. HSE and RIVM calculate the risk of people dying as a result of loss of dangerous materials. INERIS calculates the risk of people exposed to several predefined levels of intensity. In the Walloon Region, the risk is linked with the possibility of irreversible injury.
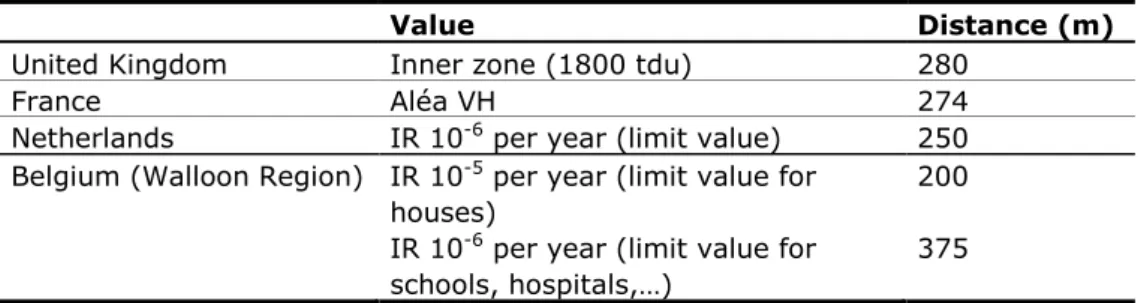
Safety distances
The relevant safety distances (guide value, limit value) calculated by the
INERIS, HSE, RIVM and FPMs are between 200 and 280 meters for houses. That means that the safety distances are of equal dimension. Given the different approaches (semi quantitative, consequence based and probabilistic) and methodologies (different effect distances and thresholds), the similarity of the safety distances is surprising.
Policy implications
As mentioned, the resulting safety distances are of equal dimension. However, this doesn’t mean the policy implications of the fictitious LPG site are the same. The decision depends on whether the development of buildings takes place within the safety distances. In France and the Netherlands a limit value is used; in the United Kingdom and the Walloon Region the safety distances are used to give an advice.
The implications of the societal risk vary. The MMR matrix in France shows the risk level of each scenario. In this benchmark four scenarios were considered as ´unacceptable´. That means that this case should not be authorized in France. Additional risk reduction measures will have to be implemented.
In the Netherlands a societal risk (FN-curve) is calculated and in the benchmark the guide value is exceeded. In the Netherlands the authority should account for the height of the societal risk.
The societal risk doesn’t have an official status in the United Kingdom. Only for this benchmark HSE calculated an FN-curve. This curve is higher than the RIVM curve, but the guide value of HSE is less strict than the Dutch guide value and the FN-curve of the HSE is considered acceptable.
In the Walloon Region the societal risk is not taken into account.
Main conclusion
This benchmark study shows that the risk assessment methods used in France, the United Kingdom, the Netherlands and the Walloon Region are very different. Not only the methods and the guide values differ, but also the effect calculations with their end values (thresholds) vary. It is surprising that the resulting safety distances are of equal dimension. In order to understand the differences in detail and to improve the foundations and the value of the risk assessment
methodologies, further international sharing of insights and methods is desirable.
1
Introduction
Within the European Union the different countries use different risk assessment methods for the land use planning and the licensing of SEVESO II companies with hazardous materials. The question is if the different approaches also lead to different safety distances and different policy implications. In order to compare the Quantitative Risk Assessment (QRA) methods used in France, the United Kingdom, the Netherlands and the Walloon Region of Belgium, a benchmark exercise was performed for a fictitious LPG plant.
The Institut National de l'Environnement Industriel et des Risques (INERIS) from France, the Health and Safety Executive (HSE) from the United Kingdom, the National Institute for Public Health and the Environment (RIVM) from the Netherlands and the Faculté Polytechnique de Mons (FPMs) from Belgium used their own QRA approach to describe the different scenarios and dangerous phenomena and to calculate the risks. Each organization wrote a report about the LPG case. The descriptions of the background information, the site
description of the case, the scenario lists and the risk outcomes are attached in the appendices.
The calculations for this benchmark study were performed in the period of 2007-2009. In February 2008, three organizations (HSE, INERIS and RIVM) discussed the different approaches and the results of the case study during a meeting in Paris. The differences and the similarities of the risk results and the policy implications were listed. The fourth organization (FPMs) joined the group in October 2008. During this project the HSE contact person left the organization. That is the reason why there is no co-author from the HSE on this report. This report contains the summary of the four approaches, their results and the corresponding policy implications. A summary of the four QRA approaches is given in chapter 2. Chapter 3 contains the description of the case. The main results are described in chapter 4: the critical dangerous phenomena and scenarios are listed, the Societal risk (SR) and the Individual Risk results are presented and the policy implications are discussed. Subsequently we pay attention to the similarities and differences based on the results in chapter 5. In the final chapter (chapter 6) the conclusions are presented.
A similar benchmark study for a flammable liquid depot was recently carried out by INERIS and RIVM [1]. In this study similar observations were made.
2
Brief overview of the four QRA approaches
Since the 1980s the United Kingdom and the Netherlands have based their external safety policy on the quantification of risks (probabilistic approach). In France before the Toulouse accident (2001), a deterministic approach was used. During the past few years, France has developed a (semi-quantitative) risk based approach. In the Walloon Region (Belgium), a probabilistic approach is used since 2003.
2.1 France Risk Criteria
In France two different public decision tools use the output of the safety report and the risk assessment, namely the ‘Matrice de Mesure de Maîtrise des Risques’ (MMR) (Risk control measure matrix, related to the permit to operate process – based on a risk level comparable to societal risk) and the ‘Plan de Prévention des Risques Technologiques’ (PPRT) (Technological Risk Prevention Plan, related to land use planning – based on risk zones (called aléa levels) and comparable to individual risk).
In these public decision tools, the probability, intensity and the severity of potential major accidents are combined. The effect distances are expressed for three (for thermal and toxic effects) or four (for overpressure effects) pre-defined levels of intensity (see Annex 2 for more detailed information).
MMR matrix
The MMR matrix shows the risk level of an accident based on the combination of its severity and its probability of occurrence. The severity of major accidents is based on the evaluation of the number of persons exposed to different levels of intensity of dangerous phenomena. It is noted that the severity is based on the persons exposed and does not depend on the number of fatalities. The
probability of occurrence ranges from A (0-10-5 per year) to E (10-2–1 per year). Table 1 MMR Matrix Probability Severity E (0-10-5-y) (10-5-10D -4-y) (10-4-10C -4-y) (10-3-10B -2-y) (10-2A -1 -y) Disastrous ALARP/ Unacceptable
Unacceptable Unacceptable Unacceptable Unacceptable
Catastrophic ALARP 2 ALARP 2 Unacceptable Unacceptable Unacceptable
Significant ALARP ALARP ALARP 2 Unacceptable Unacceptable
Serious Acceptable Acceptable ALARP ALARP 2 Unacceptable
Moderate Acceptable Acceptable Acceptable Acceptable ALARP
This matrix consists of three different areas:
The unacceptable areas where the risk of an accident is considered as unacceptable and where operators are required to implement new safety measures in order to reduce the probability or the severity of a major accident.
The ‘As Low as Reasonably Practicable’ (ALARP) areas where operators are required to continuously improve the safety in their facility. The total number of accident scenarios in each ALARP 2 box must be 5 or lower. The acceptable areas where the risk of an accident is considered acceptable. This risk matrix is applied for upper-tier SEVESO II establishments.
PPRT – Aléa maps (risk zones)
The land use planning and the land use measures are defined using aléa maps together with a specific governance process (involving local stakeholders) through the PPRT. It has been chosen here not to conduct the whole process of the PPRT. More information can be found in [1] and Annex 2. However, we will present the main recommendations for the actual land use and the land use planning that could be given on the basis of aléa maps. Aléa levels are visualized as contours on a map.
Table 2 Aléa levels
Maximum intensity
Significant lethal Lethal Irreversible In-direct
Cumulative probability
D 5E to D <5E >D 5E to D <5E >D 5E to D <5E All
‘aléa levels’ VH+ VH H+ H M+ M Low
The combination of the Intensity of the effect (first line) and the probability (second line) gives the Aléa class (third line). For example, concerning land use measures and land use planning for housing, the following recommendation can be made for the highest aléas:
red zones (VH+/VH): the risk is not acceptable and expropriation is possible; yellow/orange zones (H+/H): the risk will be not acceptable in the longer
term and relinquishment is possible;
red zone and yellow zone (VH+/VH/H+/H): no new construction allowed or specific conditions to the new construction are required (related to the building resistance toward accidents).
Regulation
The regulation related to SEVESO II facilities is gathered in the ‘Livre V du code de l’environnement’. The PPRT has been defined by the ‘Loi du 30 Juillet 2003 relative à la prévention des risques technologiques et naturels et à la réparation des dommages’ [2]. The risk matrix has been defined in the ‘Arrêté du
29 Septembre 2005’ [3]. A number of regulatory texts exist which give guidance for the realization of safety reports (see [1]).
Risk assessment methodology
In France there is no compulsory methodology for risk assessment. The operators are free to choose the methodology to use in their safety report. However, this methodology has to be appropriate and justified.
In the methodology used by INERIS in this study, the probability of each phenomenon is estimated by a semi-quantitative approach based on a specific on-site risk analysis performed by a group of experts involving the plant operators. A brief description of the methodology is given in Annex 2. This methodology allows site specific assessments.
In France, the operators also choose the models to use in order to determine the intensity of dangerous phenomena. The list of models used by INERIS in this study is given in Annex 2.
2.2 United Kingdom Risk criteria
In case of a new development in the vicinity of a SEVESO II plant, the HSE will give an advice to the local authority. This advice will be based on calculations carried out by the HSE using their own software. Two different approaches are used for this LPG case: the protection based concept and the QRA for societal risk.
Protection based concept
For pressurised flammable gases HSE does not carry out quantified risk assessments for land use planning. HSE uses a protection based concept approach based on the hazard from the flammable substance. Three zones are calculated for a new hazardous substances consent application:
inner zone (1800 tdu); middle zone (1000 tdu); outer zone (500 tdu).
Tdu = thermal dose unit. Units of (kW/m2)4/3.sec.
The zones (inner, middle and outer) are used in the process to assess planning applications for developments that may lie in those zones. Developments are categorized into four groups:
category 1: People at work, parking areas;
category 2: Developments for use by the general public – for example housing, hotels;
category 3: Developments for use by vulnerable people – for example hospitals and schools;
category 4: Very large and sensitive developments – for example large hospitals/schools and sports stadiums.
These are general definitions, and within each category there are further detailed descriptions (see [4] and [5]).
Having determined which zone the development falls into, and the category of the development, the following matrix is used to determine the type of advice.
Table 3 HSE matrix
Category Development in inner zone Development in middle zone Development in outer zone
1 DAA DAA DAA
2 AA DAA DAA
3 AA AA DAA
4 AA AA AA
DAA = Don't Advise Against development AA = Advise Against development
Societal risk assessments
The QRA approach is used for the societal risk assessments, but the methods used are not currently employed other than for internal use. This may change in
the future, because the societal risk and the criteria are under discussion in the United Kingdom1.
The societal risk is presented as an FN-curve, where N is the number of deaths and F the cumulative frequency of accidents with N or more deaths. For the societal risk two guide values are used: an upper and lower guide value. For this exercise HSE used the risk integral (RI) of 2000 for broadly acceptable risks (lower guide value), and 500,000 for intolerable risks (upper guide value) [6].
2.3 The Netherlands Risk criteria
Two different measures are used in the Netherlands’ QRA approach, namely individual risk and societal risk.
1. Individual risk represents the risk of an (unprotected) individual dying as a direct result of an on-site accident involving dangerous substances. Individual risk is visualized by risk contours on a map.
The limit value for vulnerable objects is equal to 1x10⁻⁶ per year: no
vulnerable objects are allowed within this 10-6 risk contour. For ‘less
vulnerable’ objects (like small offices) the 10-6 contour is a target value.
2. Societal risk represents the risk of an accident occurring with N or more people being killed in a single accident. The societal risk is presented as an FN-curve.
For the societal risk a guide value is used. The competent authority must account for the height of the societal risk in relation to socio-economic benefits.
Regulation
In 2004 the measures and criteria were implemented in the External Safety (Establishments) Decree [7] and obtained a legal status. Since January 2008, the guidelines for Quantitative Risk Assessment [8] and the software program to calculate the risks (SAFETI-NL) have also been prescribed by the External Safety Order [9].
QRA methodology
With the prescription of the guideline (‘Reference Manual Bevi Risk Assessments’ [8]) together with SAFETI-NL, QRA calculations for land use planning have been standardized and the results can be reproduced and are more robust and transparent. RIVM is responsible for the maintenance and development of the guideline and the software program SAFETI-NL.
The guidelines describe the standard method to perform a QRA. They give a well-defined set of scenarios (loss of containment events) for each type of installation, with a default failure frequency of each scenario. The modelling of the safety systems (e.g. emergency stop) is also largely standardized.
The scenarios are modelled with the software model SAFETI-NL. The user has to give characteristics like the material, amount and process conditions of the release, and also ignition sources, population and weather data. The effect models (calculating the release, dispersion and the different events (e.g. pool fire, jet fire, flash fire and explosion)) are fixed within SAFETI-NL. The
1 The calculation of the societal risk for this benchmark study was performed in 2007. A survey of the discussions and reports since 2007 could be found at the website of the HSE:
combination of the frequencies of the scenarios and the lethal effects, results in the individual risk and the societal risk. These risk results are the cumulative risks of all the scenarios together. The results are used in the land use planning and environmental permit approval.
2.4 Walloon Region – Belgium
First of all, it should be stressed that the land use planning policy is regional in Belgium, so each region (Flanders, Wallonia, Brussels) has developed its own methodology and regulations. The approach presented here is the one of the Walloon Region.
Risk criteria
The measure used to quantify the external risk due to SEVESO II plants is the individual risk. This is defined as the risk of an individual suffering irreversible damage due to an on-site accident involving dangerous substances. It is noted that the individual risk is not restricted to lethality.
The external risk is visualised by iso-risk contours around the SEVESO II plants. The societal risk is not taken into account.
Regulation
The land use planning around SEVSO II plants is mainly regulated in the ‘Code Wallon de l'Aménagement du Territoire, de l'Urbanisme et du Patrimoine’ (CWATUP) [10].
The area delimited by the 10-6 per year iso-risk curve is called the ‘consultation
zone’, inside which the advice from the competent authority must be taken into account for every project concerning land use.
The maps are used by the competent authorities to issue or withhold building permits in the surroundings of the plant, so that neighbouring people are not exposed to an unacceptable risk. Authorities base their decision on a matrix adopted by the regional government, crossing the level of individual risk and the type of project for which the permit is applied for (industry, residential area, hospital, et cetera). In particular, it is interesting to note that a distinction is made between houses and vulnerable buildings like hospitals.
Table 4 Matrix for the decision-making process inside the consultation zone (Walloon Region, Belgium)
Individual risk
(risk of irreversible damage) 10-3 to 10-4 per year 10-4 to 10-5 per year 10-5 to 10-6 per year Type A: Buildings and technical
units directly linked with the geography
(catchment, water tower,
wastewater treatment, windmill, et cetera)
OK OK OK
Type B: Buildings for a few people,
for the most part adult and autonomous
(workshop, logistic units, small shops, et cetera)
With
caution OK OK
Type C: Buildings for people, for the
most part adult and autonomous, but without number restriction
(accommodation, workshops or offices for more than 100 people, schools and dormitories for students aged 12 and over, et cetera)
Not allowed
With
caution OK
Type D: Buildings for susceptible
people, with restricted autonomy
(hospitals, rest homes, schools and dormitories for children under 12, prisons, et cetera) Not allowed Not allowed With caution QRA methodology
In the Walloon Region, the approach selected for the risk assessment and the determination of the consultation zones is similar to a full probabilistic approach, which is called a ‘QRA’ (Quantitative Risk Assessment). However, the approach chosen differs from a classic QRA method on several points, the most important one being that the risk is not expressed in terms of fatalities but is linked with the possibility of irreversible damage for people. The thresholds linked to the irreversible damage are: ERPG3 for toxic effects, 50 mbar for overpressure effects, and 6.4 kW/m² for thermal radiation. The frequencies used are generic ones, issued from the ‘Handboek Kanscijfers 2004’ of the Flemish competent authority [11].
In order to ensure the consistency of the QRA for all the SEVESO II plants located in the Walloon Region (90 establishments in 2008), the support of an external expert has been searched. The Major Risk Research Centre of the Faculté Polytechnique de Mons (FPMs) plays this role and calculates risk curves around the SEVESO plant. The recourse to only one expert for performing risk calculations offers the advantage of a common methodology and common assumptions for every SEVESO plant in the region. With the risk curves obtained, the Walloon Region draws the consultation zones on the local maps.
3
Description of the case
The detailed site description of the LPG plant is given in Annex 1.
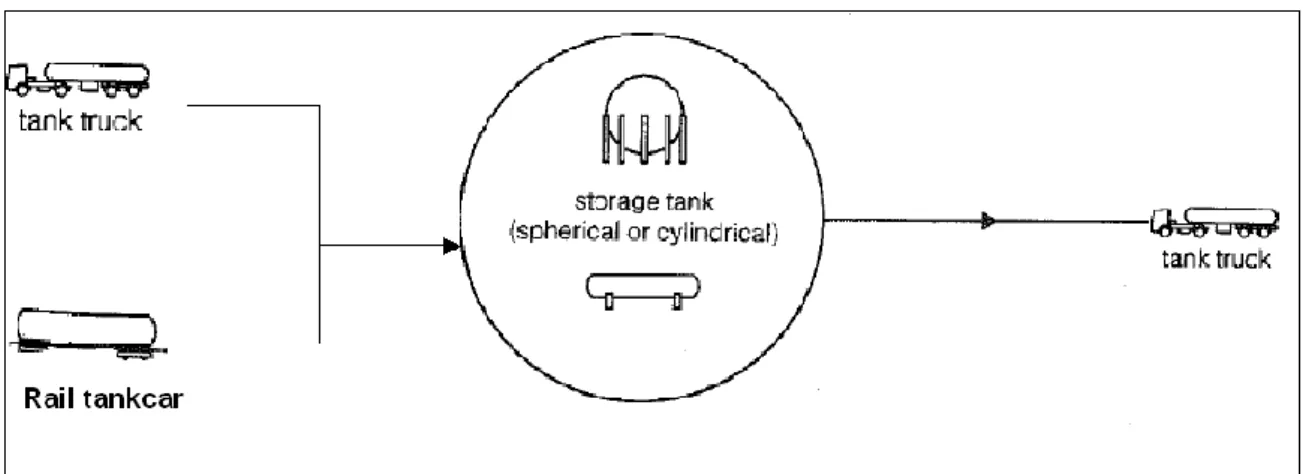
At the LPG plant propane and butane can be unloaded from rail tank cars and road tankers and stored in vessels. The unloading facilities consist of rail tank cars for the delivery of propane and road tank cars for the delivery of both propane and butane. The storage farm includes two mounded cylindrical vessels for propane and one spherical vessel for butane. Finally, the loading facility contains road tank cars able to load both propane and butane.
Figure 1 shows the main installations of the LPG establishment.
Figure 1 Illustration of the equipment that is considered in the LPG case
The LPG depot that is studied is based on:
2 cylindrical propane vessels in mounds with a capacity of 2500 m3 per
vessel;
1 spherical butane vessel with a capacity of 700 m3;
3 rail tankcar unloading stations (2 unloading arms for each station: 1 for the liquid line and 1 for the vapour line);
2 road tanker stations: 1 loading station with 1 arm for propane and
1 loading/unloading station for both propane and butane with 2 arms (1 arm for the liquid line and 1 arm for the vapour line);
a piping system equipped with:
o 2 pumps for the road tanker loading station (propane); o 1 pump for the road tanker loading station (butane); o 1 compressor.
Further, safety valves are present at various locations and are connected to a gas detection system. More information has been written in Annex 1. A fictitious population has been defined in the surroundings of the facility in order to perform societal risks assessment and MMR matrix (see Annex 2). It is noted that the population case used isn’t realistic; the population has been spread in cells of 1 km2 (density per km2) and overlap the plant.
The four parties based their risk assessment on the same (technical) description of this fictitious plant, while they used their own methodology to perform the assessment.
4
Main results of the LPG case
The main results are described in this chapter: critical scenarios and dangerous phenomena; individual risk;
societal risk; policy implications.
4.1 Critical scenarios and dangerous phenomena
This section gives an overview of the critical scenarios and phenomena of the four risk assessments. The selection was based on the contribution of the scenarios and phenomena to the individual and societal risks. The next table shows a summary of the main important scenarios of the four institutes.
Table 5 Overview of the main important scenarios
UK NL F Walloon
Region Propane vessel
(mounded)
BLEVE significant for
SR and outer zone
Rupture Significant for
IR and SR
Significant for far zone
Butane vessel (aboveground)
BLEVE significant for
inner and middle zone Significant for IR and SR Significant for IR in far zone
Rupture Significant for
IR and SR
Significant for far zone
Pump
Rupture Significant for
middle zone Pipe Rupture Most significant Transshipment Rupture (un)loading arm Most significant Significant for nearby zone It can be seen that the relevance of specific scenarios varies highly between the different methodologies. This is a clear indication that the methods differ significantly.
4.1.1 France
Based on the risk matrix (Table 13), the most critical dangerous phenomena are the following:
dangerous phenomena related to road tanker loss of containments; dangerous phenomena related to rail tank cars loss of containment; dangerous phenomena related to 6” pipe loss of containment.
The details of these phenomena are given in the next table. The numbering of the phenomena can be found in Annex 2.
Table 6 INERIS – Disastrous phenomena with highest probability
N° Dangerous phenomena description Pro- ba-bility Sign. Let. effects (distance for 5% lethality) Let. effects (distance for 1% lethality) Irrever-sible effects Severity Category
2 jet fire on road tanker transshipment post: Loss of containment on loading/unloading arm: Full bore rupture – With isolating system (20 s)
D 155 m 175 m 195 m Disastrous
6 Flash fire on road tanker transshipment post: Loss of containment on loading/unloading arm: Full bore rupture – With isolating system (20 s)
D 170 m 170 m 190 m Disastrous
30 jet fire on piping system: Loss of containment on pipe (6"): Full bore rupture – With isolating system
D 175 m 190 m 195 m Disastrous
34 Flash fire on piping system: Loss of containment on pipe (6"): Full bore rupture – With isolating system
D 180 m 180 m 200 m Disastrous
4.1.2 United Kingdom
A hazard calculation has been made using the HSE model FLAMCALC6 to provide a protection based assessment (see Annex 3).
Table 7 HSE calculations
Vessel Substance Capacity (m3)
Distance from vessel boundary (m) Inner zone (1800 tdu) Middle zone (1000 tdu) Outer zone (500 tdu)
Collection road car Propane 47 100 137 186
Delivery road car n-Butane 47 109 148 200
Delivery railcar Propane 119 159 210 282
Mounded vessel Propane 2500 mounded mounded 901
Surface sphere n-Butane 700 283 379 509
The only scenario taken into account in this approach is the BLEVE. Because the propane vessels are mounded, the inner and middle zones are not calculated. The HSE policy is to consider the BLEVE of the mounded vessel for the outer zone. Consequently, the mounded propane vessel and the butane vessel are the main scenarios for the protection based concept.
For the societal risk calculations the following scenarios have been considered: BLEVE from vessels and tankers;
releases from pipework resulting in flash fires and jet fires; coupling releases resulting in flash fires and jet fires;
instantaneous and continuous releases from the butane sphere resulting in flash fires.
For the societal risk (N >100) the BLEVE of the mounded propane vessels determines the FN-curve. The BLEVE of the mounded vessels is considered in the calculations (in contrast to the protection based concept), but with a reduced failure frequency (by a factor 10).
4.1.3 The Netherlands
In the Dutch QRA approach scenarios (loss of containments) are modelled and the risk software SAFETI-NL calculates the different event probabilities and consequences (such as BLEVE, explosion, flash fire) based on a standardized event tree. For an overview of all the scenarios see Annex 4.
The main scenarios (main contribution to the calculated risks) in the LPG case are related to the vessels of butane and propane.
Table 8 Main scenarios RIVM
Risk Main scenarios
Individual risk (IR 10-6) Butane vessel – Instantaneous release
Propane vessel – Continuous release of the complete inventory in 10 min
Propane vessel – Instantaneous release Societal risk (for N >100) Butane vessel – Instantaneous release
Propane vessel – Instantaneous release
Analysing the main events (phenomena) of the three main scenarios, gives the following effect distances.
Table 9 Main phenomena and effect distances (RIVM)
Main scenarios Phenomena Effect distance (m)
Butane vessel – Instantaneous release Flash fire (LFL) BLEVE (35 kW/m2) 850 280 Propane vessel – Continuous
release of the complete inventory in 10 min
Flash fire (LFL) 620
Propane vessel – Instantaneous release
Flash fire (LFL) BLEVE (not considered:
mounded vessel)
500 -
4.1.4 Walloon Region – Belgium
The software used (Phast Risk 6.53.1) allows to define ‘risk ranking points’, which means locations where the main scenarios contributing to the risk are identified. Every 100 m, left and right of the centre of the plant (storage) 5 points were defined. Detailed results are shown in Annex 5.
The main conclusions are:
At shorter distance of the installations (located on point 0 m), the main contributing scenario is the full bore rupture of the unloading arm of the rail tank car.
At middle distance (between 200 and 400 m), the catastrophic rupture of the pump is the main contributor to the risk (this scenario is important because its frequency is rather high and the breach diameter is large: 250 mm).
At longer distance (between 300 and 500 m), the catastrophic rupture of the butane storage (including the BLEVE) and, in a lesser extent, the
catastrophic rupture of the propane storage (without BLEVE) are predominant.
4.2 Individual risk
This section gives an overview of the individual risk results. The table below shows a summary of the most relevant safety distances for policy decision-making of the four institutes. Section 5.3 gives the limit and guide values and the policy implications of these results.
Table 10 Individual risk results
Value Distance (m)
France Aléa VH (expropriation) 274
United Kingdom Inner zone (houses)
Middle zone (schools, hospitals,…)
280 380
Netherlands IR 10-6 per year (limit value) 250
Belgium (Walloon Region)
IR 10-5 per year (houses)
IR 10-6 per year (schools, hospitals,…)
200 375
4.2.1 France
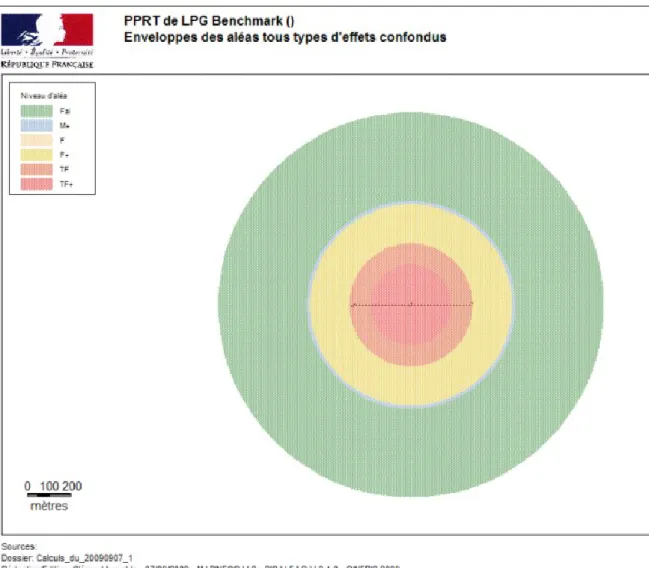
Figure 2 Map of the synthesis of aléas (INERIS)
Examples of criteria for housing (see section 2.1):
red zones (VH+/VH): the risk is not acceptable and expropriation is possible; yellow/orange zones (H+/H): the risk will be not acceptable in the longer
term and relinquishment is possible;
red zone and yellow zone (VH+/VH/H+/H): no new construction allowed or specific conditions to the new construction are required.
The distances (radius in meters) are given in the next table.
Table 11 Distances related to aléa zones (INERIS)
Aléa zones Distance (m)
VH+ 180
VH 274
H+ 450
M+ 464
Low 860
Detailed information on dangerous phenomena which have been taken into account in order to realize the aléa map is given in the Annex 2.
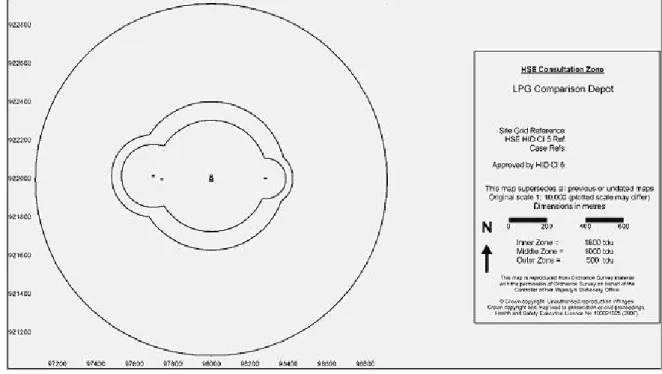
4.2.2 United Kingdom
The figure below shows the three zones calculated by HSE.
Figure 3 Land use planning zones (HSE)
The distances (radius in meter) are: inner zone (1800 tdu): 280 m; middle zone (1000 tdu): 380 m; outer zone (500 tdu): 900 m.
HSE modelled the equipment at three different locations: the delivery area in the west side, the vessels at the centre and the collection area in the east side. INERIS and RIVM modelled all the equipment at one single point.
4.2.3 The Netherlands
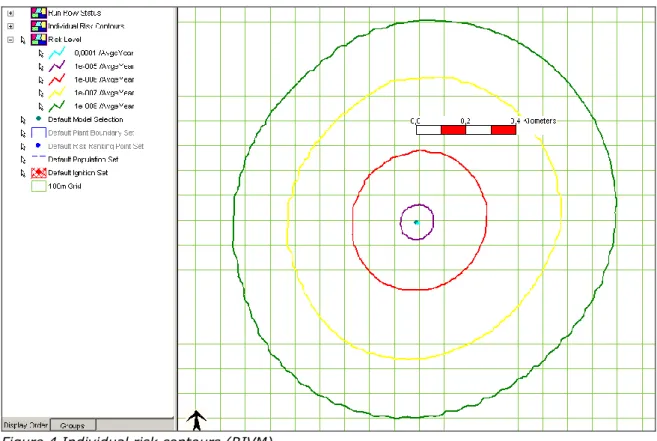
The next figure shows the individual risk contours calculated by RIVM.
Figure 4 Individual risk contours (RIVM)
The red contour is the limit value of 10-6 per year.
The distances (radius in meter) are:
IR 10-6 per year (red contour): 250 m;
IR 10-7 per year (yellow contour): 550 m;
IR 10-8 per year (green contour): 770 m. 4.2.4 Walloon Region – Belgium
FPMs calculated the risk of the LPG case for two cases: case A: all the equipment is located on the same spot; case B: equipment is located along a line.
For the comparison just the results of case A are given. The whole QRA including case B can be found in Annex 5.
Figure 5 shows the iso-risk contours of case A. The 10-6 /y curve, which is the
outer limit of the consultation zone, is red coloured. Inside the area delimited by the light blue line (10-5 /y), no houses are allowed. The hatched area indicates
the zone where delayed ignition could take place (input data).
The maximum distances to the iso-risk curves (distance between the centre of the plant and the curve) are given in the next table.
Table 12 Land use planning distances in Walloon Region (Belgium)
Iso-risk curves Maximum distance between the centre of the LPG plant (location of the storage
vessels) and the curve (in m) Case A
10-5 /y (max. individual risk
for houses and type C buildings)
200
10-6 /y (max. individual risk
for hospitals, schools and type D buildings)
375
Figure 5 Iso-risk curves for the LPG plant (case A)
4.3 Societal risk
In this section the results of the societal risk calculation are shown. In France the MMR matrix is used. Four accidents are in the ‘unacceptable’ area of the matrix.
Both the Netherlands and the United Kingdom calculated an FN-curve. The curve of RIVM exceeds the guideline, while the HSE curve does not exceed the
guideline. In section 5.4 the comparison of the two FN-curves together with the two guidelines is made.
4.3.1 France
The following table shows the MMR matrix for the case of the fictive LPG depot. The severity of a scenario depends on the number of people exposed to the various intensity levels (see Annex 2). It is noted that the definition of
population for this fictitious case was very sketchy. That’s why the outcomes of the MMR matrix are not indicative for realistic depots.
Table 13 MMR matrix for the fictive LPG depot
Probability Severity E D C B A Disastrous 1 5 – 10 14 18 – 23 – 24 -27 -28 – 29 – 33 – 35 2-6-30-34 Catastrophic 19 – 25 7 -9 -11- 15 -16 -17 Significant 3 – 12 -26 -31 4 -8 -32 Serious Moderate
The numbering of the phenomena can be found in Annex 2.
The matrix shows that four accidents are in the ‘unacceptable’ area of the matrix. These accidents concern road tankers, rail tankers and 6" pipes (see Table 6). Detailed information on accidents considered in the framework of this study is given in Annex 2. The consequences for the delivery or continuation of the permit will be discussed in section 4.4.
4.3.2 United Kingdom
The societal risk calculations have been carried out using HSE spreadsheet tools – a development tool at present. The figure below shows the societal risk curve. The X-axis represents the number of fatalities and the Y-axis corresponds to the cumulative frequency (per year) of all the scenarios together. For the scenarios see Annex 3.
Figure 6 Societal risk (HSE)
As indicated in section 2.2 the societal risk doesn’t have official relevance and is only for internal use. The red line is the criterion for ‘intolerable’ risks and the green line for broadly acceptable risks.
The risk integral (RI) is 11,463 (compared to the criteria of RI = 2000 for broadly acceptable risks and RI = 500,000 for ‘intolerable’ risks).
Nmax = the maximum number estimated to be possibly killed = 165.
4.3.3 The Netherlands
The figure below shows the societal risk curve. The X-axis represents the
number of fatalities and the Y-axis corresponds to the cumulative frequency (per year) of all the scenarios together (see Annex 4).
Figure 7 Societal risk (RIVM)
The red line is the guide value of the societal risk. Between N = 100 and 250 the guide value is exceeded.
4.3.4 Walloon Region – Belgium
The societal risk is not considered in the Walloon approach.
4.4 Policy implications
4.4.1 France
Considering the results of the approaches, the authorities may propose the following recommendations for this fictive case:
MMR matrix (societal risk): the risk is unacceptable because of the following elements:
o there are accidents in the ‘unacceptable area’;
o there are more than 5 accidents in the ‘ALARP class 2’ areas. As a consequence, the authorities will ask the operator of the plant to implement new safety measures in order to reduce the risk related to these accidents. This concerns mainly delivery operations and the 6” pipe.
PPRT: For dwellings, the conclusions of the PPRT could be the following: o in a radius of 274 m expropriation is possible;
o in a radius of 450 m relinquishment is possible;
o it is likely that new constructions would be forbidden in a radius of 450 m around the facility;
o in a radius of 860 m, some restrictions and limitations may be applied to new constructions.
However it has to be underlined that the situation is considered as unacceptable at the level of the MMR matrix. Therefore, new safety measures have to be implemented in the plant. It is likely that these new safety measures would have
a significant impact on the aléa levels: the highest risk aléa zones would be less extensive.
4.4.2 United Kingdom
The government’s conclusions of the fictitious LPG plant are based on the results of the risk calculations:
Protection based concept:
An existing situation will be allowed. When someone wants to build in one of the three zones (inner, middle and outer) the advice (positive or negative) depends on the category of development related to this zone.
o Developments for the use of the general public – for example housing – within the inner zone of 280 m will receive a negative advice. If these developments would take place in the middle or outer zone the advice will be positive.
o Hospitals and schools will be advised against in the inner and middle zones (380 m), and will not be advised against in the outer zone at a distance of more than 380 m.
Societal risk:
The FN-curve doesn’t exceed the criterion for ‘intolerable’ risks (red line) and therefore there’s no problem. The risk integral (RI) is 11,463 (compared to the criteria of RI = 2000 for broadly acceptable risks and RI = 500,000 for ‘intolerable’ risks). It is noted that the societal risk isn’t used in the formal decision making process.
4.4.3 The Netherlands
The government’s conclusions of the fictitious LPG plant are based on the results of the risk calculations:
Individual risk:
The limit value for vulnerable objects (houses, hospitals, schools) is equal to 1x10⁻⁶ per year: no vulnerable objects are allowed within this 10-6 risk
contour (250 m). Societal risk:
For the societal risk a guide value is used. This guide value is exceeded and the societal risk should be seriously taken into account in the decision-making process [7]. Technically, the situation could be refused based on the account of the societal risk. However, in practice, the account of the societal risk will probably lead to additional requirements concerning the emergency plans. The competent authority must account for the societal risk and can e.g. include emergency response plans.
If there are buildings (houses) within the 10-6 risk contour (250 m) the situation
is not allowed. If this is not the case, the authority should account for the height of the societal risk.
4.4.4 Walloon Region – Belgium
The policy conclusions are based on the matrix presented in section 2.4 and the position of the calculated iso-risk curves.
In summary, the situation is allowed if:
there is no type C object (e.g. houses) inside a 200 m distance;
there are also criteria for buildings type A and B, linked to the position of 10-3 /y and 10-4 /y iso-risk curves.
The above-mentioned distances are calculated starting from the centre of the plant. The societal risk is not quantified.
5
Discussion
This chapter describes the similarities and differences of the four risk assessments based on the results of the LPG case. In the first section the differences of the QRA approaches are shown. Then a comparison is given of the calculated effect distances, the risk results and finally the policy implications of these results.
5.1 QRA approaches
The four QRA approaches use scenarios with failure frequencies and the calculation of effect and risk distances. This comparison study shows the differences within these approaches:
In France there is no compulsory methodology for risk assessment. INERIS uses bow ties analyses to assess the accidents considered and the results are shown in a risk matrix. The approach is labelled as semi-quantitative. The probability used in the matrix is the result of expert judgment and is expressed as a frequency range. For consequences, five intensity levels are distinguished. The MMR matrix shows the risk per accident (based on exposed people). The seven different aléa zones that are distinguished are used for land use planning.
In case of a new development in the vicinity of a SEVESO plant, the HSE will give an advice to the local authority. This advice will be based on
calculations carried out by the HSE using its own software. For this LPG case HSE used a consequence based approach (protection based concept) for the land use planning. This results in the definition of three zones, on the basis of BLEVE scenarios (with a 50% capacity). The mounded propane vessels are excluded. The QRA approach used for the societal risk calculations (different scenarios with generic frequencies) is a risk based approach, but the societal risk doesn’t have an official status.
In the Netherlands the QRA calculations for land use planning have been standardized, based on prescribed guidelines. RIVM is responsible for the management and development of the guidelines and the software program. The guidelines give a set of scenarios with a default failure frequency of each scenario. Both individual risk and societal risk are based on lethality. The Dutch QRA is a risk based approach.
In the Walloon Region, FPMs determines the individual risk using a
probabilistic approach. The risk is not expressed in terms of fatalities but is linked with the possibility of irreversible injury for people. The methodology imposes a set of scenarios with generic failure frequency. The influence of protective safety systems (downstream of the loss of containment) is taken into account to determine the frequency of each phenomenon. The societal risk is not taken into account.
5.2 Dangerous phenomena and effect distances
The results of the four risk assessments as described in section 4.1 show differences in the scenarios (accidents) and effect calculations.
The main scenarios contributing to the risks show differences. In France the storage vessels of propane and butane are not considered when mounded or when some specific conditions related to safety are fulfilled. The (un)loading
activities are predominant. In the United Kingdom and the Netherlands the vessels dominate the risk results. This is an example of the different selection of scenarios.
Further, the selection of phenomena shows differences. For example, in the Netherlands and the Walloon Region a BLEVE of the propane vessels is not considered, because the vessels are mounded. However, HSE takes the BLEVE of the mounded vessels into account.
To get more insight in the differences the effect calculations of the BLEVE of the butane sphere (700 m3) and the flash fire (cloud + delayed ignition) of the
mounded propane vessel (2500 m3) or the propane pipework were analysed. 5.2.1 BLEVE of the sphere butane (700 m3)
The next table shows the results of the BLEVE of the butane vessel.
Table 14 BLEVE of the butane vessel
UK NL F Walloon region Filling ratio considered for BLEVE LUP: 50% SR: 100/75/50/25% Based on site description: For butane 55% 85% Based on site description: For butane 55% Lethal threshold LUP: 500-1000-1800 tdu SR: LD1, LD10, LD50 Probit of heat radiation (35 kW/m2 is 100% lethal) 600-1000-1800 tdu
Dose for risk effects: 2.376E6 (W/m²)4/3.s 6.4 kW/m² during 20 s (irreversible effect)
Model HSE internal Phast (DNV) INERIS internal Phast (DNV)
Distances obtained in the benchmark for the sphere 1800 tdu 283 m 1000 tdu 380 m 500 tdu 510 m For BLEVE butane with burst pressure of 12 bar(g) L10% 600 m L3% 670 m L1% 720 m 1800 tdu 330 m 1000 tdu 460 m 600 tdu 590 m
For BLEVE butane with burst pressure of 9.7 bar(g) Dose reached at 890 m (920 m for a burst pressure of 12 barg) LUP: land use planning; SR: societal risk; LD: lethal dose; L%: percentage lethality
The largest distances of the BLEVE are between 380 and 920 m. Based on the analysis of the effect calculations, differences in modelling and thresholds arise. Modelling:
- The four parties use different burst pressures for the BLEVE calculations. For example, INERIS uses 6.5 bar(g) and RIVM 12 bar(g).
- With regard to the amounts of butane, HSE and INERIS have deviated from the site description.
- Both INERIS and HSE calculate the effect distances with a home made software tool. FPMs and RIVM use Phast (Risk) of DNV Software. - Because FPMs and RIVM use the same software and the same input
calculated effect distances for the BLEVE of butane is caused by the thresholds used.
Thresholds:
- For the BLEVE, RIVM uses a probit relation of heat radiation with the lethality level of 1% as the end point of the calculations:
Pr = -36.38 + 2.56 ln (Q4/3 × t);
with heat radiation Q in kW/m2 and duration t in seconds [8].
Based on a duration of 20 seconds, the lethality level of 1% is equal to the heat radiation of 9.8 kW/m2.
- FPMs uses a heat radiation level of 6.4 kW/m² during 20 seconds as the end value for the irreversible effect of the BLEVE. This level is equal to a lethality level of 0.01% using the Dutch probit relation.
- Both HSE and INERIS use three levels of the thermal dose to determine the effect distances. HSE calculates the distances related to 500, 1000 en 1800 tdu (thermal dose unit in (kW/m2)4/3.sec) and INERIS uses 600, 1000
and 1800 tdu. So the end points of the calculations differ (500 and 600 tdu). In addition, 500 tdu relates to a lethality level of 3% based on the Dutch probit relation. The dose of 600 tdu relates to a lethality level of 7.5%.
5.2.2 Flash fire of the mounded propane vessel (2500 m3)
The next table shows the results of the flash fire of the propane vessel.
Table 15 Flash fire propane vessel
UK NL F Walloon Region Amount considered 100% (vessel) 85% Flash fire for vessel 85% (vessel) Flash fire for 10" pipe (limited drift)
85% (2125 m³) Flash fire for vessel Lethality threshold LFL LFL LFL LFL Model HSE internal Phast (DNV)
INERIS internal Phast (DNV) Effect distance in the benchmark study : propane 550 m 500 m 500 m (irrev effects), 450 m (lethal effects) 655 m
Based on the analysis of the effect calculations, differences in modelling arise: - With regard to the amounts of propane, HSE has deviated from the site
description and uses its own standards. This means a volume of 100% for the flash fire of propane, instead of a volume of 85% for propane vessel from the site description.
- Because INERIS doesn’t consider the mounded propane vessel, the effect distance is based on the flash fire of a 10” pipeline.
- Both INERIS and HSE calculate the effect distances with a home made software tool. FPMs and RIVM use Phast (Risk) of DNV Software.
- Because FPMs and RIVM use the same software, the same amount and the same threshold (LFL) for the flash fire the difference of the calculated effect distances of the flash fire is caused by the way of modelling the scenario in Phast Risk. The distance of 500 m is based on the instantaneous release of propane, while a release of the propane within 10 minutes results in an
effect distance of 620 m (see Table 9). This shows that the use of the same software program not automatically leads to the same results.
5.2.3 Summary of comparison of effect distances
In summary, the differences in effect distances can be explained by modelling differences (% of volume, process conditions, burst pressure of the BLEVE, parameters and software) and retained thresholds.
The thresholds (end of calculation) differ from the dose for irreversible damage (FPMs), the probit relation of heat radiation (RIVM) to the level of heat radiation used (different levels used by HSE and INERIS). These differences are also related to the different scope of the calculations. HSE and RIVM calculate the risk of people dying as a result of loss of dangerous materials. INERIS calculates the risk of people exposed to several predefined levels of intensity. In the Walloon Region, the risk is linked with the possibility of irreversible injury. The differences in the distances of the BLEVE are much bigger than the
differences in the flash fire calculations. Probably the calculation of the flash fire is less sensitive to input parameters and the flash fire has been calculated with a single end value (LFL).
5.3 Individual risk
The table below shows the most important risk distance (i.e. the distance related to vulnerable objects/residences) of the four institutes.
Table 16 Individual risk results
Value Distance (m)
United Kingdom Inner zone (1800 tdu) 280
France Aléa VH 274
Netherlands IR 10-6 per year (limit value) 250
Belgium (Walloon Region) IR 10-5 per year (limit value for
houses)
IR 10-6 per year (limit value for
schools, hospitals,…)
200 375
The distances are of equal dimensions. This similarity of the results is remarkable, considering the large differences in the methodologies, and is considered to be largely coincidental.
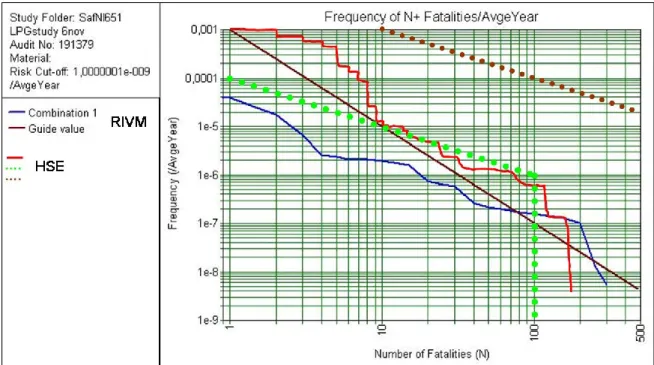
5.4 Societal risk
The societal risk calculated by HSE and RIVM results in an FN-curve. Both curves with the guidelines are shown in the figure below.
Figure 8 Societal risk of RIVM and HSE together
Explanation:
RIVM: blue curve (with line guide value); HSE: red curve (with dotted guide values).
The HSE FN-curve (red) is larger than the RIVM curve (blue); there is approximately a factor 10 of difference in frequencies. Moreover the figure shows that the guide value of RIVM (line) is stricter than the dotted line of HSE. The conclusion is that in the Netherlands the societal risk exceeds the guide value and in the United Kingdom the societal risk is considered acceptable. The MMR matrix (which can be compared to societal risk) of INERIS shows that four phenomena are in the ‘not acceptable’ zone of the matrix. This case would not be tolerated in France. Additional risk reduction measures will have to be implemented.
5.5 Policy implications
For this fictitious LPG case the following government’s conclusions are made:
France
This case should not be authorized. There are accidents in the ‘unacceptable’ areas of the MMR matrix and one of the cells in the ‘ALARP-2’ area has more than 5 accidents. Additional safety measures should be implemented.
United Kingdom
The existing situation will be allowed by the HSE. The development of housing (land use planning) will be advised against in the inner zone. The FN-curve doesn’t exceed the criterion for ‘intolerable’ risks (red line) and therefore the societal risk is acceptable (in spite of the fact that the societal risk isn’t used in the formal decision-making process at all).
The Netherlands
If there are buildings (houses) within the 10-6 risk contour the situation is not
allowed. If this is not the case, the authority should account the size of the societal risk. In this case the guide value of the societal risk is exceeded and therefore the competent authority will pay serious attention to account for the situation and can e.g. demand sophisticated emergency response plans.
Walloon Region (Belgium)
If there are buildings of type C (such as houses) within the 10-5 risk contour or if
there are buildings of type D (such as schools) within the 10-6 risk contour the
situation is, in theory, not allowed (it can be allowed in some cases with caution).
6
Conclusions
In this report a comparison is made of the Quantitative Risk Assessment (QRA) methods used in the United Kingdom, France, the Netherlands and the Walloon Region of Belgium. In order to compare the different approaches a benchmark exercise was performed for a fictitious LPG plant. INERIS from France, the Health and Safety Executive (HSE) from the United Kingdom, RIVM from the Netherlands and the Faculté Polytechnique de Mons (FPMs) from Belgium used their own QRA approaches to describe the different scenarios and dangerous phenomena and to calculate the risks.
The most important conclusions of this benchmark are summarised below:
Methodologies
1. The INERIS approach is a (semi-quantitative) risk based approach. The bow tie analysis is useful for analysing the safety measures of a
company in detail. The results of the assessment can be used to improve the process safety of a plant and to implement reinforcements to
construction around the plant.
To define the frequency of dangerous phenomena expert judgments can be used in France. Objectivity proves to be an issue here. Furthermore every risk assessment is specific and not generic.
2. The English consequence based approach for flammable materials is the protection based concept (for land use planning). Hereby only the BLEVE is considered and that makes the approach easier than a complete QRA. This gives a generic approach.
3. The Dutch QRA approach is generic and standardized, because of the use of the QRA results for land use planning decisions. For this reason, it has been decided to use a robust and transparent QRA method in the Netherlands. Consequently, the QRA of a company A is based on the same initial failure frequencies and scenarios and modelled with the same software as the QRA of a company B.
4. The Walloon Region also uses a generic approach (consideration of a list of scenarios with generic frequency associated). In the Walloon Region, the QRA takes into account the specificity of each site by considering the protective safety systems (downstream of the loss of containment). 5. The four methodologies show a difference between robust, generic
(standardized) methods on one side and specific methods based on expert judgment on the other side. The choice of a ‘generic’ method (in the Netherlands, the Walloon Region and the United Kingdom) means that the QRA is not suitable for analysing risk reducing measures in detail (therefore a specific approach (like the French approach) is needed). But a generic QRA method makes the QRA more transparent and robust. Further, the use of a generic QRA method doesn’t mean a subsequent analysis is not possible at all. It is possible to see if the risks can be mitigated for example by reducing the risks of the most
contributing scenarios (e.g. reducing the amount, relocation of an activity).