The combined EURL-Salmonella
interlaboratory comparison
study for Food and Primary
production (2017)
Detection of Salmonella in hygiene swabs
RIVM Report 2018-0021
The combined EURL-Salmonella
interlaboratory comparison
study for Food and Primary
production (2017)
Detection of Salmonella in hygiene swabs RIVM Report 2018-0021
Colophon
© RIVM 2018
Parts of this publication may be reproduced, provided acknowledgement is given to: National Institute for Public Health and the Environment, along with the title and year of publication.
DOI 10.21945/RIVM-2018-0021
This is a publication of:
National Institute for Public Health and the Environment
P.O. Box 1│3720 BA Bilthoven the Netherlands
www.rivm.nl/en
I.E. Pol-Hofstad (author), RIVM
K.A. Mooijman (author), RIVM
Contact:
Irene Pol-Hofstad
Centre for Zoonoses and Environmental Microbiology (Z&O) Irene.Pol@RIVM.nl
This investigation has been performed by order and for the account of the European Commission, Directorate-General for Health and Food Safety (DG-SANTE), within the framework of RIVM project number E/114506/17/RO European Union Reference Laboratory for Salmonella 2017.
Synopsis
The combined EURL-Salmonella interlaboratory comparison study for food products and primary production stages (2017)
Detection of Salmonella in hygiene swabs
In October 2017, a combined EURL-Salmonella interlaboratory
comparison study on the detection of Salmonella in food samples and animal primary production stage was organised. In this study, hygiene swabs were chosen to be the matrix. All the laboratories involved were able to detect Salmonella in all the contaminated hygiene swab samples; they were all successful in analysing both the blank control sample and the positive control sample correctly. One laboratory made a mistake reporting the positive control negative for Salmonella and was, therefore, scored as having a ‘moderate performance’.
Blank hygiene swab samples, not contaminated with Salmonella, were correctly analysed as negative by almost all the laboratories. One
laboratory found Salmonella present in two of the six blank samples and this was scored as a ‘poor performance’. In a follow-up study this
laboratory obtained good results for all samples.
Participation was obligatory for all EU Member State National Reference Laboratories (NRLs) responsible for the detection of Salmonella in food samples, and voluntary for NRLs responsible for the detection of
Salmonella in primary production stage samples. These latter
laboratories had already participated in the compulsory EURL study for the detection of Salmonella in primary production samples which was organised in March 2017. A total of 56 NRLs participated in this study: 33 NRLs for Salmonella in Food matrices and 23 NRLs for Salmonella in Primary Production Stage matrices (PPS). The participants came from all 28 EU Member States (MS), four of the NRLs were based in third
European countries and one was based in a non-European country. The EURL-Salmonella is situated at the Dutch National Institute for Public Health and the Environment (RIVM). An important task of the
EURL-Salmonella is to monitor and to improve the performance of the National
Reference Laboratories in Europe.
Keywords: Salmonella, EURL, NRL, interlaboratory comparison study,
Publiekssamenvatting
Het gecombineerde EURL-Salmonella-ringonderzoek Voedsel en Productie dieren (2017)
Detectie van Salmonella in oppervlaktebemonsteringsponsjes
In oktober 2017 is het gecombineerde EURL-Salmonella-ringonderzoek gehouden om Salmonella aan te tonen in sponsjes die gebruikt worden om oppervlakten van te onderzoeken materialen te bemonsteren. De sponsjes zijn gebruikt, omdat ze geschikt zijn als monster voor zowel de NRL’s Voedsel, als de NRL’s Dieren voor de voedselproductie. Om
praktische redenen zijn deze NRL’s dit jaar samengevoegd.
Alle deelnemers waren in staat om Salmonella in de sponsjes op te sporen. Ook hebben de laboratoria de meegestuurde controlemonsters correct geanalyseerd. Eén laboratorium heeft een fout gemaakt in de rapportage van het controlemonster waarin Salmonella was
aangetroffen. Hierdoor kreeg dit laboratorium een matige score. Bijna alle laboratoria konden de monsters waar geen Salmonella aan was toegevoegd (blanco), als zodanig opsporen. Eén laboratorium vond echter Salmonella in twee van de zes blanco monsters en scoorde daardoor een onvoldoende. Dit laboratorium heeft in de herkansing wel alle monsters goed beoordeeld.
Deze kwaliteitstoets is verplicht voor alle Nationale Referentie Laboratoria (NRL’s) van de Europese lidstaten die ervoor
verantwoordelijk zijn om Salmonella in voedsel aan te tonen; het is vrijwillig voor NRL’s die Salmonella aantonen in de leefomgeving van dieren die voor de voedselproductie worden gehouden. Deze laatste laboratoria hadden in maart 2017 al deelgenomen aan het verplichte EURL-ringonderzoek naar Salmonella.
In totaal hebben 56 NRL’s deelgenomen: 33 NRL’s om Salmonella in voedsel aan te tonen en 23 NRL’s om Salmonella aan te tonen in leefomgeving voor dieren die voor de voedselproductie worden
gehouden. De NRL’s waren afkomstig uit alle 28 EU lidstaten, vier NRL’s uit andere Europese landen en één NRL uit een niet-Europees land. Het Europese Referentielaboratorium (EURL) Salmonella is gevestigd bij het Nederlandse Rijksinstituut voor Volksgezondheid en Milieu (RIVM). Een belangrijke taak van het EURL-Salmonella is toezien op de kwaliteit van de nationale referentielaboratoria voor deze bacterie in Europa.
Kernwoorden: Salmonella, EURL, NRL, ringonderzoek,
Contents
Summary — 9 1 Introduction — 11 2 Participants — 13 2.1 Participants NRL Food — 13 2.2 Participants NRL PPS — 143 Materials and methods — 17
3.1 Preparation of artificially contaminated hygiene swab samples — 17
3.1.1 General — 17
3.1.2 Pre-tests for the preparation of hygiene swab samples — 17
3.1.3 Preparation of hygiene swab samples for interlaboratory comparison study — 17
3.1.4 Determination of amount of background flora in hygiene swabs — 17 3.1.5 Determination of the number of Salmonella in hygiene swab samples by
MPN — 18
3.2 Design of the interlaboratory comparison study — 18 3.2.1 Number and type of samples — 18
3.2.2 Shipment of parcels and temperature recording during shipment — 18
3.3 Methods — 19
3.4 Statistical analysis of the data — 19 3.5 Criteria for good performance — 20
3.6 Follow-up study — 20
4 Results and discussion — 21
4.1 Preparation of artificially contaminated hygiene swab samples — 21 4.1.1 Pre-tests for the preparation of hygiene swab samples 21
4.1.2 Preparation of hygiene swab samples for interlaboratory comparison study — 23
4.1.3 Background flora in the hygiene swab samples — 23 4.1.4 Number of Salmonella in hygiene swab samples — 23 4.2 Technical data interlaboratory comparison study — 24
4.2.1 General — 24 4.2.2 Accreditation — 24 4.2.3 Transport of samples — 24 4.2.4 Media — 24 4.3 Control samples — 27 4.3.1 General — 27
4.3.2 Correct scores of the control samples — 28
4.4 Artificially contaminated hygiene swab samples — 28
4.4.1 General — 28
4.4.2 Specificity, sensitivity and accuracy rates of the artificially contaminated samples — 30 4.5 PCR (own method) — 31 4.6 Performance of the NRLs — 32 4.6.1 General — 32 4.6.2 Follow-up study — 32 5 Conclusions — 35
List of abbreviations — 37 References — 39
Summary
In October 2017 the combined EURL-Salmonella interlaboratory
comparison study on the detection of Salmonella in samples from food origin and primary production stage was organised. Because of
recurrence of Avian Influenza caused by migrating birds in autumn and winter it was decided to change the order of the interlaboratory
comparison studies on the detection of Salmonella in food and in matrices of the primary production stage. In this study, hygiene swabs were chosen as matrix since it was suitable both as food matrix as well as primary production stage matrix. Participation was obligatory for all EU Member State National Reference Laboratories (NRLs) that are responsible for the detection of Salmonella in food samples. The study was voluntary for NRLs that are responsible for the detection of
Salmonella in primary production stage samples. The latter laboratories
already participated in the compulsory EURL study for the detection of
Salmonella in primary production samples organised in March 2017.
A total of 56 NRLs participated in this study: 33 NRLs for Salmonella in Food matrices and 23 NRLs for Salmonella in Primary Production Stage matrices (PPS). The participants originated from 28 EU-Member States (MS), 4 NRLs from third European countries (EU candidate or potential EU candidate MSs and members of the European Free Trade Association (EFTA)) and one NRL from a non-European country (Israel).
In this study, hygiene swabs were used, artificially contaminated with background flora as well as with a diluted culture of Salmonella Typhimurium at the EURL laboratory.
Each NRL received twenty blindly coded samples, consisting of twelve hygiene swabs artificially contaminated with background flora and two different levels of Salmonella Typhimurium (6x low (5 cfu) and 6x high (107 cfu)), six blank hygiene swabs and two control samples consisting of a procedure control blank and a control sample to be inoculated by the participants using their own positive control strain. The samples were stored at 5 °C until the day of transport. On Monday 2 October 2017 the contaminated hygiene swab samples were packed and sent to the NRLs. Upon arrival, the NRLs were asked to store the samples at 5 °C until the start of the analysis.
Method
All laboratories were asked to use ISO 6579-1:2017 and select the appropriate enrichment media in accordance with the samples being considered as food matrix or as PPS matrix.
Results control samples
All laboratories scored well analysing both the procedure control as well as their own positive control sample. One laboratory made a mistake in reporting a negative result for the positive control, while their raw data indicated a positive result. This laboratory (lab code 28, NRL Food) scored a moderate performance.
Results artificially contaminated hygiene swab samples
All laboratories detected Salmonella in the hygiene swab samples contaminated with a high level of Salmonella.
In addition, almost all laboratories detected Salmonella in all six low level samples. One laboratory (lab code 11, NRL PPS) scored one of the six low level samples negative. This is well within the criteria for good performance, which allows for three negative samples. The sensitivity score was 99,9% for these samples.
The specificity of the study is given by the correctly scored blank
samples; this was 99% for this study. Only one laboratory did not score all six blank samples negative (lab code 24, NRL Food). This laboratory reported two of the six blank samples positive for Salmonella and scored a poor performance. This laboratory participated in the follow-up study and obtained correct results for all samples.
Overall, the laboratories scored well in this interlaboratory study. The accuracy was 99,7%. Fifty-four laboratories fulfilled the criteria of good performance, one laboratory score moderate performance and one laboratory scored a poor performance.
1
Introduction
An important task of the European Union Reference Laboratory for
Salmonella (EURL-Salmonella), as laid down in Commission Regulation
No 882/2004 (EC, 2004), is the organisation of interlaboratory
comparison studies to test the performance of the National Reference Laboratories (NRLs) for Salmonella. The history of the interlaboratory comparison studies as organised by EURL-Salmonella (formerly called CRL-Salmonella) from 1995 onwards is summarised on the
EURL-Salmonella website (http://www.eurlsalomonella.eu).
In October 2017 the EURL-Salmonella organised a combined
interlaboratory study to test whether the NRLs for Salmonella in Food and Primary Production stage (PPS) could detect Salmonella at different contamination levels in hygiene swab samples. The results from
interlaboratory studies like this show whether the examination of
samples in the EU Member States (EU-MS) is being carried out uniformly and whether comparable results can be obtained by all
NRLs-Salmonella.
Because of yearly outbreaks of Avian Influenza due to migrating birds during autumn and winter, the organisation of the interlaboratory study for detection of Salmonella in primary production samples at the
beginning of the year, always faced numerous problems. Control
measures due to outbreaks of Avian influenza may include prohibition of the transport of poultry faeces. This caused problems in the availability of faeces during the pre-tests in November and December and also when preparing the study samples at the beginning of the year. Therefore the EURL decided to change the order of the interlaboratory comparison studies on the detection of Salmonella in food and in
samples from the primary production stage. To overcome the transition phase, hygiene swabs were chosen as matrix, since they are suitable both as food matrix samples as well as PPS samples.
The method prescribed for the detection of Salmonella spp. is set out in ISO 6579-1:2017.
The study design of this study was comparable to previous
interlaboratory comparison studies (Kuijpers & Mooijman, 2016; Pol- Hofstad & Mooijman, 2016; Pol-Hofstad & Mooijman, 2017). For this study, hygiene swab samples were artificially contaminated with a combination of E.coli ATCC 11775 and Citrobacter freundii ATCC 8090 to mimic background flora in natural samples. In addition, the hygiene swabs were contaminated with a diluted culture of Salmonella Typhimurium (STM) at the laboratory of the EURL-Salmonella.
In total, eighteen hygiene swab samples had to be tested: six samples per contamination level (blank, low and high concentrations of
Salmonella Typhimurium). Additionally, two control samples were
tested: one procedure control and one positive control. The number and contamination levels of the samples were in accordance with
2
Participants
2.1 Participants NRL Food
Country City Institute / NRL-Salmonella
Austria Graz Austrian Agency for Health and Food Safety (AGES IMED/VEMI)
Belgium Brussels Scientific Institute of Public Health (WIV-ISP)
Bulgaria Sophia National Diagnostic and Research Veterinary Institute (NDRVMI), National Reference Centre of Food Safety
Croatia Zagreb Croatian Veterinary Institute, Laboratory for Food Microbiology (CVI)
Cyprus Nicosia Cyprus Veterinary Services, Laboratory for the Control of foods of animal origin
Czech
Republic Prague State Veterinary Institute (SVI)
Denmark Ringsted Danish Food Administration, Microbiology Ringsted
Finland Helsinki Finnish Food Safety Authority Evira Food and Feed Microbiology Laboratory section
France Ploufragan ANSES Laboratoire de Ploufragan-Plouzané, Unité Hygiène et Qualité des Produits Avicoles et Porcins (UHQPAP)
Germany Berlin Federal Institute for Risk Assessment (BfR)
Greece Chalkida Veterinary Laboratory of Chalkida,
Hungary Budapest National Food Chain Safety Office, Food and Feed Safety Directorate
Iceland Reykjavik Matis ohf, Analysis and Infrastructure
Ireland Kildare Central Veterinary Research Laboratory CVRL/DAFM Backweston, Department of Bacteriology and Parasitology Division
Italy Legnaro PD Istituto Zooprofilattico Sperimentale delle Venezie, OIE
Latvia Riga
Institute of Food Safety, Animal Health and Environment, BIOR Animal Disease
Diagnostic Laboratory, Food Safety and Environment investigation Laboratory
Lithuania Vilnius National Food and Veterinary Risk Assessment Institute, Bacteriology Unit and Food Microbiology Unit
Luxembourg Dudelange Laboratoire National de Santé, surveillance alimentaire
Macedonia,
FYR of Skopje Food Institute, Faculty of Veterinary Medicine Laboratory for food and feed microbiology
Country City Institute / NRL-Salmonella
Netherlands,
the Bilthoven
National Institute for Public Health and the Environment (RIVM/CIb) Infectious Disease Control, Centre for Zoonoses and
Environmental Microbiology (cZ&O)
Netherlands,
the Wageningen
Netherlands Food and Consumer Product Safety Authority (NVWA), Consumer and Safety Division, Microbiology
Norway Oslo Norwegian Veterinary Institute, Bacteriology Section
Poland Pulawy
National Veterinary Research Institute (NVRI),
Department of Hygiene of Food of Animal Origin
Portugal Vairão Instituto Nacional de Investigação Agrária e Veterinária , Food Microbiology
Romania Bucharest Hygiene and Veterinary Public Health Institute (IISPV)
Slovak
Republic Bratislava State Veterinary and Food Institute Slovenia Ljubljana Institute of Microbiology and Parasitology, Veterinary Faculty (UL, NVI)
Spain Madrid, Majadahonda Centro Nacional de Alimentación (AECOSAN), Food Microbiology laboratory Sweden Uppsala National Veterinary Institute (SVA), Department of Microbiology
Switzerland Bern Institute of veterinary Bacteriology, Vetsuisse Faculty, University of Bern
United
Kingdom London
Public Health England (PHE) Food Water and Environmental Microbiology Laboratory – London
United
Kingdom Belfast
Agri-Food and Bioscience Institute (AFBI) Veterinary Science Division (VSD)
Bacteriology
2.2 Participants NRL PPS
Country City Institute
Austria Graz Austrian Agency for Health and Food Safety (AGES IMED/VEMI)
Belgium Brussels Scientific Institute of Public Health (WIV-ISP)
Bulgaria Sofia National Diagnostic and Research Veterinary Institute (NDRVMI), National Reference Centre of Food Safety
Croatia Zagreb Croatian Veterinary Institute, Laboratory for General Bacteriology and Microbiology
Estonia Tartu Estonian Veterinary and Food Laboratory
Finland Kuopio Finnish Food Safety Authority Evira Research and Laboratory Services Department
Country City Institute
France Ploufragan Anses, Laboratoire de Ploufragan-Plouzané Unité Hygiène et Qualité des Produits Avicoles et Porcins (HQPAP)
Germany Berlin Federal Institute for Risk Assessment (BfR) National Veterinary Reference Laboratory for
Salmonella
Greece Chalkida Veterinary Laboratory of Chalkida
Hungary Budapest National Food Chain Safety Office, Food and Feed Safety Directorate
Iceland Reykjavik Matís ohf, Analysis and Infrastructure
Israel Kiryat
Malachi Southern Poultry Health Laboratory (Beer Tuvia)
Italy Padova
Legnaro Istituto Zooprofilattico Sperimentale delle Venezie, OIE
Latvia Riga
Institute of Food Safety, Animal Health and Environment
BIOR Animal Disease Diagnostic
Laboratory, Food Safety and Environment investigation Laboratory
Lithuania Vilnius National Food and Veterinary Risk Assessment Institute, Bacteriology Unit and Food Microbiology Unit
Netherlands,
the Bilthoven
National Institute for Public Health and the Environment (RIVM/Cib), Centre for
Infectious Diseases Control, Centre for Zoonoses and Environmental Microbiology (Z&O)
Norway Oslo Norwegian Veterinary Institute, Section of Bacteriology
Portugal Vairão Instituto Nacional de Investigação Agrária e Veterinária , Food Microbiology
Slovenia Ljubljana Institute of Microbiology and Parasitology, Veterinary Faculty (UL, NVI)
Spain Madrid
Algete
Laboratorio Central de Veterinaria, Bacteriology 1
Switzerland Bern Institute of veterinary Bacteriology, Vetsuisse Faculty, University of Bern
United
Kingdom Addlestone Animal and Plant Health Agency (APHA), Bacteriology Department
United
3
Materials and methods
3.1 Preparation of artificially contaminated hygiene swab samples
3.1.1 General
The matrix in this interlaboratory comparison study was hygiene swabs ordered from WVR. Hygiene swabs are suitable to be used as food matrix as well as primary production stage matrix. The hygiene swabs were artificially contaminated with background flora consisted of a mixture of two bacteria and with a diluted culture of Salmonella at the laboratory of the EURL-Salmonella.
3.1.2 Pre-tests for the preparation of hygiene swab samples
Hygiene swab samples were ordered from VWR (no: vwrc710-1020; dry sponges size: 7.5 cm by 3.8 cm). Different bacteria were tested for suitability as background flora by testing interference with Salmonella confirmation tests. Two strains of Enterobacter cloacae from own culture collection (WR3 and M578), Escherichia coli (ATCC 11775),
Pseudomonas aeruginosa (ATCC 27857), Klebsiella pneumoniae
(ATCC 13883) and Citrobacter freundii (ATCC 8090) were selected for suitability tests.
The hygiene swabs were moisturised by adding 10 ml of Buffered Peptone Water (BPW) and left until totally soaked. The moisturised hygiene swabs were artificially contaminated with a suitable combination of background flora (106 cfu/swab) and with a high or a low
concentration of a diluted culture of Salmonella Typhimurium
(ATCC 14028). To test the stability of the contaminated hygiene swab samples during transport and storage, they were stored at 5 °C and 10 °C for a period up to thirteen weeks. Five samples were tested for the presence of Salmonella according to ISO 6579-1:2017 and one sample was tested for the concentration of background flora according to ISO 21528-2:2004 after zero, one, two, three, seven, ten and thirteen weeks of storage.
3.1.3 Preparation of hygiene swab samples for interlaboratory comparison study
Moisturised hygiene swabs were artificially contaminated with a suspension of background flora (consisting of a mixture of E.coli
(ATCC 11775) and Citrobacter freundii (ATCC 8090) approx. 106 cfu/ml) and with Salmonella Typhimurium by adding 0.1 ml of the appropriate dilution of an overnight culture. Two Salmonella concentration levels were used; low (5 cfu/sample) and high (107 cfu/sample). The concentration of the inoculum used to contaminate the hygiene swab was confirmed by plating the relevant dilution on XLD (Xylose Lysine Deoxycholate) agar plates. Immediately after artificial contamination, the samples were stored at 5 °C until transport to the participating laboratories on Monday, 2 October 2017.
3.1.4 Determination of amount of background flora in hygiene swabs
Moisturised hygiene swab samples were artificially contaminated with a mixture of E.coli (ATCC 11775) and C. freundii (ATCC 8090) to mimic the presence of background flora aiming for an end concentration of
106 cfu/swab. The total number of Enterobacteriaceae in hygiene swabs was investigated by following ISO 21528-2:2004. The hygiene swab samples were homogenised (kneaded) in peptone saline solution and ten-fold dilutions were analysed on Violet Red Bile Glucose (VRBG) Agar.
3.1.5 Determination of the number of Salmonella in hygiene swab samples by MPN
The level of contamination in the artificially contaminated hygiene swab samples was determined by using a five-tube most probable number (MPN) technique. For this, ten-fold dilutions of five hygiene swab
samples at each contamination level were tested representing 10 g, 1 g and 0.1 g of the original sample. The presence of Salmonella was determined in each dilution by following ISO 6579-1:2017. The MPN of
Salmonella in the original sample was calculated from the number of
confirmed positive dilutions, using an MPN program in Excel (Jarvis, Wilrich & Wilrich, 2010).
3.2 Design of the interlaboratory comparison study
3.2.1 Number and type of samples
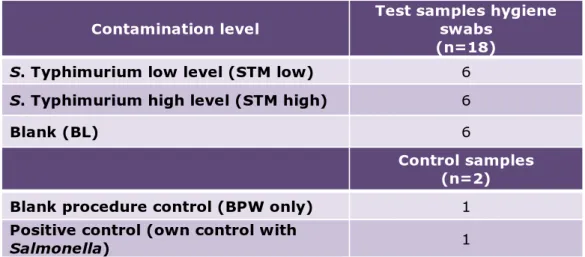
Each participant received eighteen artificially contaminated hygiene swab samples that were numbered B1 to B18. In addition, the laboratories had to test two control samples (C1 and C2). Table 3.1 gives an overview of the number and type of samples tested by the participants.
For the control samples, the laboratories were asked to use their own positive Salmonella control strain which they normally use when
analysing routine samples for the detection of Salmonella. In addition to this positive control (C2), a procedure control (C1) consisting of
Buffered Peptone Water (BPW) only had to be analysed. The protocol and test report used during the study can be found on the
EURL-Salmonella website or can be obtained from the author of this report
(EURL-Salmonella 2017a; 2017b).
3.2.2 Shipment of parcels and temperature recording during shipment
The twenty coded samples containing the contaminated hygiene swab samples, the blank samples and the control samples were placed in two safety bags. The safety bags were placed in one large shipping box together with four frozen (-20 °C) cooling devices. The shipping boxes were sent to the participants as ‘biological substances category B (UN3373)’ via a door-to-door courier service. The participants were asked to store the samples at 5 °C on receipt. To monitor exposure to abusive temperatures during shipment and storage, a micro
temperature logger was placed in between the samples to record the temperature.
Table 3.1. Overview of the number and type of samples tested per laboratory in the interlaboratory comparison study.
Contamination level Test samples hygiene swabs (n=18)
S. Typhimurium low level (STM low) 6
S. Typhimurium high level (STM high) 6
Blank (BL) 6
Control samples (n=2)
Blank procedure control (BPW only) 1
Positive control (own control with
Salmonella) 1
3.3 Methods
The method prescribed for this interlaboratory comparison study was ISO 6579-1:2017. Hygiene swabs can be considered both as a food matrix and as a primary production sample. NRLs should use the appropriate method for the chosen matrix approach (food or PPS). The method starts with a pre-enrichment in Buffered Peptone Water (BPW). Selective enrichment is carried out on Mueller Kaufmann Tetrathionate novobiocin broth (MKTTn); Rappaport Vassiliadis Soya broth (RVS) and/or Modified Semi-solid Rappaport-Vassiliadis (MSRV) agar when considering hygiene swabs as food samples. When the hygiene swabs are considered as primary production stage samples, selective enrichment is carried out on Modified Semi-solid Rappaport-Vassiliadis (MSRV) agar only. Plating-out is carried out on Xylose Lysine Deoxycholate agar (XLD) and a second medium of choice. Confirmation is performed using the appropriate biochemical and serological tests as prescribed in ISO 6579-1:2017 or using reliable, validated identification kits. Laboratories were noted that the hygiene swabs were moisturised with 10 ml BPW and that adding 90 ml of BPW would result in the primary dilution. In addition to the ISO method, the NRLs were free to use their own method, such as a Polymerase Chain Reaction (PCR) procedure.
3.4 Statistical analysis of the data
The specificity, sensitivity and accuracy rates were calculated for the artificially contaminated hygiene swab samples. For the control samples, only the accuracy rates were calculated. The rates were calculated according to the following formulae:
Specificity rate: x 100% Sensitivity rate: x 100%
samples
negative
(expected)
of
number
Total
results
negative
of
Number
samples
positive
(expected)
of
number
Total
results
positive
of
Number
Accuracy rate: x 100%
3.5 Criteria for good performance
For the determination of ‘good performance’, the criteria indicated in Table 3.2 were used. Due to the nature of the matrix used in this study, the criteria for blank samples were altered. For sterile hygiene swabs (blank samples) no positive samples are allowed.
Table 3.2. Criteria for good performance in the interlaboratory comparison study.
Minimum result
Contamination level Percentage positive No. of positive samples/ total no. of samples
Samples
Hygiene swabs artificially contaminated
S. Typhimurium high level (STM high) Min. 80% Min. 5/6
S. Typhimurium low level (STM low) Min. 50% Min. 3/6
Blank (BL) 0% 0/6
Control samples
Procedure control (BPW only) 0% 0/1
Positive control (own control with
Salmonella) 100% 1/1
3.6 Follow-up study
For the follow-up study an additional set of hygiene swab samples was prepared according to paragraph 3.1.3. Samples were stored at 5 °C at the EURL laboratory until transportation. The sample set consisted of ten sample coded B1-B10, four high contaminated samples and six blank samples. In addition, two control samples (C1 and C2) were added.
negative)
and
(positive
samples
of
number
Total
negative)
and
(positive
results
correct
of
Number
4
Results and discussion
4.1 Preparation of artificially contaminated hygiene swab samples
4.1.1 Pre-tests for the preparation of hygiene swab samples
In practice, hygiene swabs are used to sample for instance food production areas or stables. All micro-organisms present on those
surfaces will be taken up by the hygiene swabs. To mimic these practical conditions, background flora was added in addition to Salmonella
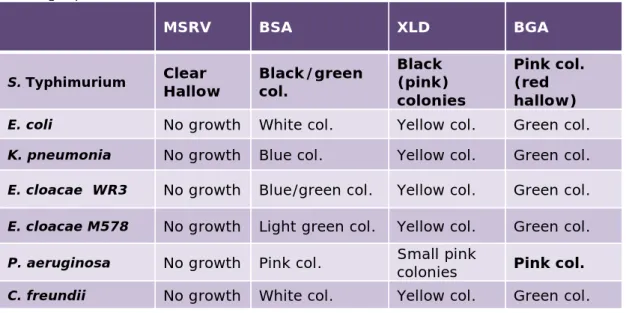
Typhimurium to the sterile hygiene swabs. To test which organisms did not interfere with Salmonella confirmation and were therefore suitable as background flora, six different organisms were tested for typical growth characteristics on a number of selective media (see 3.1.2). Results are shown in Table 4.1.
Table 4.1. Growth characteristics of micro-organisms on MSRV, BSA, XLD and BGA agar plates.
MSRV BSA XLD BGA
S. Typhimurium Clear Hallow Black/green col. Black (pink) colonies
Pink col. (red hallow)
E. coli No growth White col. Yellow col. Green col.
K. pneumonia No growth Blue col. Yellow col. Green col.
E. cloacae WR3 No growth Blue/green col. Yellow col. Green col.
E. cloacae M578 No growth Light green col. Yellow col. Green col.
P. aeruginosa No growth Pink col. Small pink colonies Pink col.
C. freundii No growth White col. Yellow col. Green col.
Table 4.1 shows that none of the tested organisms show the same growth characteristics as Salmonella Typhimurium on the tested agar plates, indicating that these organisms would not create difficulties in
Salmonella confirmation. A mixture of E.coli and C. freundii was chosen
to serve as background flora in the study samples.
To test if the contaminated hygiene swab samples were stable during transport and storage, hygiene swabs were contaminated with a high amount of background flora (approx. 106 cfu/swab) and a high and low concentration of Salmonella Typhimurium as described in 3.1.2.
Transport to and storage conditions at the receiving laboratories were mimicked by storing the samples at 5 °C and 10 °C for a number of weeks. Results can be seen in Table 4.2. In February 2017 the first tests with hygiene swabs as matrix were performed. Results show that the number of positive Salmonella samples was not affected by storage for up to three weeks at both 5 °C and 10 °C. In addition, the background flora level was also stable over the three weeks storage period. Pre-tests were repeated in August with lower contamination levels of Salmonella
Typhimurium, 6 cfu per swab sample and different selective enrichment media. Salmonella could still be detected in most of the samples at both storage temperatures. After a storage period of two weeks at 5 °C, one of the five samples was found negative when using MSRV, while all samples were positive when using RVS and MKTTn. After three weeks of storage all three enrichment media scored one of the five samples negative. The background flora remained stable over the storage period at 5 °C while it fluctuated somewhat when stored at 10 °C.
Table 4.2. Stability tests of hygiene swab samples artificially contaminated with background flora (n=1) and Salmonella Typhimurium at high and low levels (number of positive samples per total of 5 samples per level).
Date Concentration Temp (°C) Time (weeks)
0 1 2 3
Feb Background flora (cfu) 5°C 8.0x10⁶ 7.2x10⁶ 3.4x10⁶ 7.5x10⁵
10°C 7.3x10⁷ 9.7x10⁷ -
STM MSRV Low (14 cfu) 5°C 5/5 5/5 5/5 5/5
10°C 5/5 5/5 -
STM MSRV High (76 cfu) 5°C 5/5 5/5 5/5 5/5
10°C 5/5 5/5 -
Aug Background flora (cfu) 5°C 8.7x10⁶ 6.6x10⁶ 3.9x10⁶ -
10°C 1.6x10⁸ 9.8x10⁷ - STM MSRV Low (6 cfu) 5°C 5/5 5/5 4/5 4/5 10°C 5/5 5/5 - STM RVS/MKTTn Low (6 cfu) 5°C 5/5 5/5 5/5 4/5 10°C 5/5 5/5
Date Concentration Temp (°C) Time (weeks)
0 7 10 13 July Background flora (cfu) 5°C 6.8x10⁶ 4.7x10⁴ 2.0x10³ 5.5x10⁵ STM MSRV Low (11 cfu) 5°C 5/5 6/7 5/7 6/7 STM RVS/MKTTn Low (11 cfu) 5°C 5/5 6/7 5/7 6/7
Pre-test with even more prolonged storage periods for up to thirteen weeks showed that hygiene swab sample can be prepared a long period before the start of the study without an important reduction in positive samples. Salmonella proved to be very stable; only one or two samples of seven samples were found negative after seven-thirteen weeks of storage. This is still acceptable for low contaminated samples. The
background flora was more susceptible to prolonged storage, although the concentration was fluctuating strongly and counts are based on only one sample result.
4.1.2 Preparation of hygiene swab samples for interlaboratory comparison study
Samples for the interlaboratory comparison study were prepared as described in paragraph 3.1.3.
4.1.3 Background flora in the hygiene swab samples
The concentration of the background flora of the study samples was determined according to ISO 21528-2:2004 as described in 3.1.4. Results are shown in Table 4.3. The amount of background flora added to the hygiene swab samples during preparation ranged from 7.7 x 10⁵ to 7.3 x 10⁷ cfu/swab. After thirteen days of storage at 5 °C, the number of Enterobacteriaceae ranged from 1.4 x 10⁴ - 7.1 x 10⁶ cfu/swab was found.
Table 4.3. Number of Salmonella and Enterobacteriaceae in hygiene swab samples.
Samples
26 sept 2017 9 Oct 2017 (after storage at 5 °C)
Inoculum concentration Conc. STM
MPN (MSRV) MPN (MKTTn) Conc. STM (cfu/swab) Entero STM (cfu/swab) Entero
Blank 7.7 x 10⁵ 7.1 x 10⁶
Low 5 cfu 1.3 x 10⁶ 7 (2.3-22) 7 (2.3-22) 1.4 x 10⁴
High 107 cfu 7.3 x 10⁷ 92 (28-300) 92 (28-300) 4.7 x 10⁶
4.1.4 Number of Salmonella in hygiene swab samples
The hygiene swab samples were artificially contaminated at the
laboratory of the EURL-Salmonella laboratory by adding the appropriate volume of a diluted Salmonella culture. Table 4.3 shows the
contamination level of the diluted culture of Salmonella Typhimurium used as inoculum to contaminate the hygiene swabs. The low level samples were inoculated with 5 cfu, while the high level samples were inoculated with 107 cfu. After inoculation, the samples were stored at 5 °C for almost one week until transport to the participants on 2 October 2017. The final contamination level of Salmonella in the hygiene swab samples was determined by performing a five-tube Most Probable
Number (MPN) test in the week of the interlaboratory comparison study. Results show that the concentration of Salmonella in the samples was in line with the anticipated concentration (see table 4.3).
4.2 Technical data interlaboratory comparison study
4.2.1 General
A total of 56 NRLs participated in this study: 33 NRLs for Salmonella in food matrices and 23 NRLs for Salmonella in Primary Production
matrices (PPS). The participants originated from 28 EU-Member States (MS), 4 NRLs from third European countries (EU candidate or potential EU candidate MSs and members of the EFTA) and one NRL from a non-European country (Israel).
4.2.2 Accreditation
All laboratories were accredited according to ISO/IEC 17025:2005. 29 laboratories were accredited for ISO 6579:2002, 25 laboratories were accredited for Annex D of ISO 6579:2007 and 22 laboratories were accredited for ISO 6579-1:2017, 2 laboratories were accredited for NMKL 71:1999. Most laboratories used ISO 6579-1:2017 to analyse the hygiene swab samples, although 21 of these were not yet accredited for this method.
4.2.3 Transport of samples
The samples were transported using a door-to-door courier on Monday 2 October 2017. Forty-four laboratories received the parcels within one day of dispatch and eleven participants within two days. One laboratory received the parcels after three days. Participants were asked to store the parcel at 5 °C on arrival in their laboratories. The temperature during transport and storage was recorded using a temperature recorder placed between the samples in the sample bag. The temperature during
transport was predominantly between -5 °C and +6 °C. The storage temperature at the receiving laboratories ranged from 0 – 10 °C.
4.2.4 Media
Each laboratory was asked to test the samples using the prescribed method (ISO 6579-1:2017) using RVS, MKTTn and/or MSRV agar depending on the approach of the hygiene swab samples as food or primary production matrix. As selective enrichment medium, XLD agar plus a second plating-out medium of their own choice had to be used. Table 4.4 shows which second plating-out media were chosen by the laboratories.
Table 4.4. Second plating-out media used by the NRLs. Media No. of users
BGAmod 11 Rambach 12 BPLS 7 BGA 8 RS 6 SM(ID)2 3 BxLH 0 ASAP 1 BSA 4 Other 4
Explanations of the abbreviations used are given in the ‘List of abbreviations’.
Technical details on the method which deviated from the prescribed ISO method (ISO 6579-1:2017) are listed in Table 4.5 (grey-shaded cells). There were 29 laboratories reporting details of deviations. Four
laboratories (lab codes 12, 27, 29 and 35) incubated the BPW for a longer period than prescribed. Two laboratories did not provide any information on the incubation period of BPW (lab codes 43 and 47). The pH of the used BPW was too high in five cases (lab codes 10, 22, 23, 25 and 42) and one laboratory (lab code 53) did not report any information on the pH. Most deviations were made in the novobiocin concentration of MKTTn. sixteen laboratories (lab codes 3, 4, 5, 12, 17, 19, 22, 36, 38, 41, 43, 46, 47, 49, 54, and 57) used MKTTn with a deviating novobiocin concentration ranging from 0-39 mg/l. In addition, three laboratories (lab codes 3, 31 and 52) used MKTTn with a deviating pH. Also the novobiocine concentration of MSRV was not correct in five cases (lab codes 2, 4, 5, 30 and 43). In addition three laboratories used MSRV with a deviating pH (lab codes 9, 10 and 54). One laboratory (lab code 53) did not report any of the requested media details.
In comparison with previous studies this is a rather large number of deviations.
Table 4.5. Reported technical deviations from the prescribed/requested procedures. Lab code BPW RVS MKTTn MSRV Incubati on time (h:min) pH pH pH
Novo-biocin pH Novo-biocin ISO 6579-1 16–20 h 6.8–7.2 5.0–5.4 7.0–8.2 40 mg/l 5.1–5.4 10 mg/l 2 18:00 7.2 5.2 1 3 18:00 7.2 5.3 6.6 4 4 20:00 7.1 5.3 8 0,04 5.2 0,05 5 20:00 7.1 5.3 8 0,04 5.2 0,05 9 18:00 7.1 5.3 7.8 40 5.5 10 10 20:00 7.3 7.7 40 5.5 10 12 20:25 7.0 5.1 7.0 39 17 18:00 7.2 5.2 8 10 19 17:00 7 8 10 5.3 10 22 18:10 7.3 5.3 7.8 0 23 18:10 7.3 5 10 25 18:30 7.3 5.0 10 27 21:35 7.0 5.2 10 29 20:30 7.1 7.9 40/1 5.3 10 30 20:00 7.2 5.4 8.0 40 5.3 20 31 18:15 7 5.2 6.6 40 35 21:00 7.2 5.2 8 40 5.3 10 36 18:25 7.2 8.1 20mg 5.3 10 38 19:30 7.1 5.2 7.5 39 5.3 10 41 17:55 7.0 5 7.9 10 5.1 10 42 20:00 7.3 5.3 7.7 40 43 ?? 6.9 5.0 8.1 5mg/l 5.3 1000 46 17:00 7.1 5.2 8 4 5.2 10 47 ?? 7.0 5.2 8.0 4 5.2 10 49 19:00 7.1 8.1 10 mg/L 5.4 10 mg/L 52 19:40 6.9 5.3 8.3 40 53 18:30 - - 40 - 10 54 20:00 7.0 5.4 8.0 10 5.48 10 57 18:00 6.9 7.9 39 5.4 10
Grey cells = Deviating from ISO 6579-1:2017
- = No information supplied
All participating laboratories performed one or several confirmation tests for Salmonella. In Table 4.6 all reported combinations are summarised. Other methods were specified as Maldi-tof, VIDAS, microbact
Identification Galeries or Chromogenic agar method. There were ten laboratories that used only one confirmation test. Most laboratories used a combination of two or more confirmation methods.
Table 4.6: Number of laboratories using the different confirmation methods. Number
of labs Biochemical Serological Serotyping other PCR
3 X 3 X 1 X x 12 X X 4 X X x 7 X X 4 X X X 5 X X X 1 X X X X 1 X X X 2 X X X X 2 X X X X 1 X X X 2 X X 1 X X 4 X 1 X X 2 X X 4.3 Control samples 4.3.1 General
Two control samples were sent to the laboratories. One was used as a procedure control (BPW only). The other was used as a positive control to which the laboratories had to add their own positive control strain normally used in their routine analysis for the detection of Salmonella.
Procedure control blank (BPW only)
All laboratories scored good results for this control samples.
Positive control with Salmonella
As positive control, the majority of the participants used a diluted culture of Salmonella (36 laboratories). Others used a lenticule disc (10), a cultiloop (4), a freeze-dried ampoule (2), frozen culture (2), a vitroid or a capsule (1) with Salmonella. The Salmonella serovars used for the positive control sample are shown in Table 4.7.
Table 4.7. Salmonella serovars used by participants for the positive control samples.
Salmonella serovar Number of users
S. Enteritidis 20
S. Typhimurium 13
S. Nottingham 8
S. Alachua, S. Blegdam, S. Infantis, S. Bongori,
S. Harleystreet (per serovar) 2
S. Dublin, S. Tranaroa, S. Zanzibar, S. Panama,
4.3.2 Correct scores of the control samples
Table 4.8 shows the number of correctly analysed control samples for all participants, NRLs Food and NRLs PPS. No differences were found between these groups. All laboratories found 100% correct results, with accuracy rates of 100%.
One laboratory made a reporting error by reporting a negative result for the sample intended as positive control (lab code 28). This laboratory could show in their raw data that they obtained a positive result for the positive control sample, but by mistake reported this sample as negative. For this reporting error, laboratory 28 received a moderate performance.
Table 4.8. Correct scores found for the control samples by all participants and by the separate groups of NRLs Food and NRLs PPS.
Control samples All labs
n=56 NRL-Food n=33 NRL-PPS n = 23
Procedure control blank (BPW) n=1
No. of samples 56 33 23
No. of negative samples 56 33 23
Specificity in % 100% 100% 100%
Positive control (own Salmonella) n=1
No. of samples 56 33 23
No. of positive samples 56 33 23
Sensitivity in % 100% 100% 100%
All control samples n=2
No. of samples 112 66 46
No. of correct samples 112 66 46
Accuracy in % 100% 100% 100% 4.4 Artificially contaminated hygiene swab samples
4.4.1 General
Hygiene swab samples artificially contaminated with two different levels of Salmonella Typhimurium, low (approx. 5 cfu) and high (approx. 107 cfu), as well as blank samples, were analysed for the presence of
Salmonella by the participants. Table 4.9 shows the overall results
obtained by the participants.
Table 4.9. Number of positive results found for the artificially contaminated hygiene swab samples at each laboratory.
Number of positive isolations Blank
n=6 STM low n=6 STM high n=6
Criteria good performance 0 ≥3 ≥5
Lab code 24 2 6 6
Lab code 11 0 5 6
All other NRLs 0 6 6
Blank samples
All but one laboratory correctly analysed the blank samples negative for
Salmonella. Laboratory 24 found two of the six blank samples positive
for Salmonella and scored a ‘poor performance’ as a result.
Low-level contaminated Salmonella Typhimurium samples
Almost all laboratories were able to detect Salmonella in all six hygiene swab samples contaminated with a low inoculum level of approximately 5 cfu. Only one laboratory (lab code 11, NRL PPS) reported one of the six samples negative for Salmonella. In respect of low level samples, it is acceptable to score a maximum of three out of six samples as negative, so this laboratory scored well above the criteria for good performance. The results are shown in Figures 4.1 and 4.2.
Figure 4.1. Number of hygiene swab samples artificially contaminated with a low level of Salmonella Typhimurium (n=6) that tested positive per laboratory for NRLs Food.
Figure 4.2. Number of hygiene swab samples artificially contaminated with a low level of Salmonella Typhimurium (n=6) that tested positive per laboratory for NRLs PPS.
0 1 2 3 4 5 6 7 3 5 6 8 9 10 12 15 17 19 21 22 24 26 28 30 31 32 34 35 36 37 41 42 45 47 48 49 50 52 53 54 56
Lab code NRLs Food
N umb er o f p os iti ve sa m pl es ( n= 6) 0 1 2 3 4 5 6 7 1 2 4 7 11 13 14 16 18 20 23 25 27 29 33 38 39 40 43 44 46 51 55
Lab code NRLs PPS
N umb er o f p os iti ve sa m pl es ( n= 6)Low level contaminated samples
- = level of good performance
- = level of good performance Low level contaminated samples
High-level contaminated Salmonella Typhimurium samples
All laboratories were able to detect Salmonella in all six samples
inoculated with approximately 107 cfu. The results are shown in Figures 4.3 and 4.4.
Figure 4.3. Number of hygiene swab samples artificially contaminated with a high level of Salmonella Typhimurium (n=6) that tested positive per laboratory for NRLs Food.
Figure 4.4. Number of hygiene swab samples artificially contaminated with a high level of Salmonella Typhimurium (n=6) that tested positive per laboratory for NRLs PPS.
4.4.2 Specificity, sensitivity and accuracy rates of the artificially contaminated samples
Table 4.10 shows the specificity, sensitivity and accuracy rates for all artificially contaminated hygiene swab samples. The calculations were performed on the results of all participants and on the results of the separate groups of NRLs Food and NRLs PPS. Only minor differences were found between these groups. All participants performed very well in this study: the specificity rate (99%) and the sensitivity rates (low
0 1 2 3 4 5 6 7 3 5 6 8 9 10 12 15 17 19 21 22 24 26 28 30 31 32 34 35 36 37 41 42 45 47 48 49 50 52 53 54 56
Lab code NRLs Food
N umb er o f p os iti ve sa m pl es ( n= 6) 0 1 2 3 4 5 6 7 1 2 4 7 11 13 14 16 18 20 23 25 27 29 33 38 39 40 43 44 46 51 55
Lab code NRLs PPS
N umb er o f p os iti ve sa m pl es ( n= 6)- = level of good performance high level contaminated samples
- = level of good performance high level contaminated samples
level: 99,7%; high level 100%) were very high for the group of participants as a whole.
Table 4.10. Specificity, sensitivity and accuracy rates found by the participating laboratories with the artificially contaminated hygiene swab samples.
Hygiene swab samples
Total labs n = 56 NRLs-Food n = 33 NRLs-PPS n = 23 Blank n=6 No. of samples No. of negative samples Specificity in % 336 334 99% 198 196 98.9% 138 138 100% Low level (STM)
n=6 No. of samples No. of positive samples
Sensitivity in % 336 335 99.7% 198 198 100% 138 137 99.3% High level (STM)
n=6 No. of samples No. of positive samples
Sensitivity in % 336 336 100% 198 198 100% 138 138 100% All swab samples
with STM No. of samples No. of positive samples
Sensitivity in % 672 671 99.9% 396 396 100% 276 275 99.6% All swab samples
(positive and negative)
No. of samples
No. of correct samples
Accuracy in % 1008 1005 99.7% 594 592 99.7% 414 413 99.8% 4.5 PCR (own method)
This year thirteen laboratories (lab codes 16, 17, 25, 26, 27, 30, 31, 33, 34, 35, 37, 48 and 56)) also performed a PCR method on the hygiene swab samples as an additional detection technique (see Table 4.11). Most laboratories tested the samples after pre-enrichment in BPW. Laboratories 16 and 17 started the DNA extraction before pre-enrichment in BPW. All laboratories used a real-time PCR except
laboratory 30, which used a commercially available BAX system Q7. All laboratories used a validated PCR method.
The majority of NRLs found identical results with their PCR method and the bacteriological culture method. Two laboratories (lab codes 33 and 34) found one high level samples negative but also one blank sample positive, in contrast to their correct results obtained with the
Table 4.11. Details of Polymerase Chain Reaction (PCR) procedures used by NRLs-Salmonella as own method during the interlaboratory comparison study. Lab
code PCR method Validated (by)
Commer- cially available Routinely used number of test/2016 DNA extraction after enrichment in Reference
16 Real Time National N 78 -
17 Real Time National N 78 -
25 Real Time Löfström 2012 N 1000 PBW Malorny et al. 2004
26 Real Time AFNOR Y 9800 PBW
27 Real Time AFNOR Y PBW
30 BAX system Q7 AFNOR Y 632 PBW
31 Real Time AFNOR Y 2400 PBW
33 Real Time AFNOR Y 1041 PBW
34 Real Time AFNOR Y 1041 PBW
35 Real Time ISO 16140 N PBW
37 Real Time AFNOR and others Y 249 PBW
48 Real Time National N > 10000 PBW
56 Real Time AFNOR Y PBW
4.6 Performance of the NRLs
4.6.1 General
All laboratories were able to detect Salmonella in high and low concentrations in hygiene swab samples. Fifty-four of the 56
laboratories fulfilled the criteria of good performance. One laboratory scored a ‘moderate performance’ for making an error in reporting of the results of the positive control sample (lab code 28). And one laboratory (lab code 24) scored a ‘poor performance’ for falsely detecting
Salmonella in two blank hygiene swab samples. This latter laboratory
performed an extensive internal investigation to explain these deviating results. The Salmonella in the blank samples was the same serovar as used in the positive hygiene swab samples. Cross contamination in the laboratory was the most likely cause of the false positive blank samples. This laboratory participated in the follow-up study.
4.6.2 Follow-up study
The setup of the follow-up study was similar to the main study. The nature of the samples was based on the false positive blank samples found by laboratory 24. In total, this study contained twelve samples: two control hygiene swab samples (C1 and C2) and ten hygiene swab samples consisting of six blank samples (containing only background flora; 9.6 x 10⁶ cfu/swab) and four artificially contaminated swab
samples inoculated with a high level of Salmonella Typhimurium (49 cfu/swab) to test for cross-contamination. A duplicate set of samples was tested by the EURL- Salmonella for the presence of
Salmonella.
Samples were prepared according to paragraph 3.6 and stored at 5 °C until transportation on Tuesday 3 April to Laboratory 24 as described in 3.2.2. Laboratory 24 was asked to store the samples at 5 °C until the day of analyses on Monday 9 April 2018.
The results of the follow-up study showed a good performance, all
samples were analysed correctly. Most plausible explanation for the false positive blank results in the main study was cross contamination and the laboratory showed that implemented measures to avoid
5
Conclusions
All NRLs for Salmonella were able to detect high and low levels of
Salmonella in hygiene swab samples.
Fifty-four NRLs scored a ‘good performance’ and one laboratory scored a ‘moderate performance’ due to a reporting mistake in the positive control samples. One laboratory scored a ‘poor performance’ for falsely detecting Salmonella in two of the six blank hygiene swab samples. There were no differences in performances between the group of NRLs Food and NRLs PPS.
The accuracy, specificity and sensitivity rates of the NRLs with respect to the control samples after selective enrichment were all 100%.
The sensitivity rate for the hygiene swab samples artificially contaminated with a low level of S. Typhimurium was 99.7%. The sensitivity rate for the hygiene swab samples artificially contaminated with a high level of S. Typhimurium was 100%.
The accuracy rate of the NRLs in detecting Salmonella in the artificially contaminated hygiene swab samples was 99.7%.
The majority of the NRLs-Salmonella use S. Enteritidis or
S. Typhimurium for their positive control samples. But the use of a Salmonella serovar that is more rare in routine samples may be
advisable in order to make the detection of possible cross contamination easier.
Thirteen participants used a PCR technique in addition to the prescribed classical method. Eleven laboratories reported identical results for both methods. Two laboratories found one high level sample negative for
Salmonella and one blank sample positive for Salmonella.
In the follow-up study, all hygiene swab samples were analysed correctly.
List of abbreviations
AFNOR Association Française de Normalisation (French Standardization Association)
ASAP AES Salmonella Agar Plate
ATCC American Type Culture Collection
BGA Brilliant Green Agar
BGA (mod) Brilliant Green Agar (modified)
BL Blank (no colony-forming units)
BPLS Brilliant Green Phenol-Red Lactose Sucrose
BPW Buffered Peptone Water
BSA Brilliance Salmonella Agar
BxLH Brilliant green, Xylose, Lysine, Sulphonamide
cfu Colony-forming units
DG-SANTE Directorate-General for Health and Consumer Protection
EC European Commission
EFTA European Free Trade Association
EU European Union
EURL European Union Reference Laboratory
ISO International Organization for Standardization MKTTn Mueller-Kauffmann Tetrathionate-Novobiocin broth
MPN Most Probable Number
MS Member State
MSRV Modified Semi-solid Rappaport-Vassiliadis
NRL National Reference Laboratory
PCR Polymerase Chain Reaction
RIVM Rijksinstituut voor Volksgezondheid en het Milieu
(National Institute for Public Health and the Environment)
PPS Primary Production Stage
RS Rapid Salmonella
RVS Rappaport Vassiliadis Soya broth
STM Salmonella Typhimurium
SM (ID)2 Salmonella Detection and Identification-2
VRBG Violet Red Bile Glucose
XLD Xylose Lysine Deoxycholate
References
EC (2004). Commission Regulation (EC) No. 882/2004 of the European Parliament and of the Council of 29 April 2004 on the official controls performed to ensure the verification of compliance with feed and food law, animal health and animal welfare rules. Official
Journal of the European Union L 165 of 30 April.
http://eur-lex.europa.eu/LexUriServ/LexUriServ.do?uri=CONSLEG:2004R0882:
20060525:EN:PDF (access date December 2016).
EURL-Salmonella (2017a). Protocol combined Food-PPS interlaboratory
comparison study on detection of Salmonella spp. in hygiene swabs organised by EURL-Salmonella.
https://www.eurlsalmonella.eu/dsresource?type=pdf&disposition=in line&objectid=rivmp:329477&versionid=&subobjectname= (access date April 2018)
EURL-Salmonella (2017b). Test report on Interlaboratory Comparison
Study on the detection of Salmonella spp. in hygiene swabs organised by EURL-Salmonella.
https://www.eurlsalmonella.eu/dsresource?type=pdf&disposition=in line&objectid=rivmp:336129&versionid=&subobjectname= (access date April 2018).
EURL-Salmonella (2017c). History of EURL-Salmonella interlaboratory
comparison studies on the detection of Salmonella.
https://www.eurlsalmonella.eu/dsresource?type=pdf&disposition=in line&objectid=rivmp:335296&versionid=&subobjectname= (access date April 2018).
ISO 6579:2002. Microbiology of food and animal feeding stuffs –
Horizontal method for the detection of Salmonella spp. International
Organization for Standardization, Geneva, Switzerland.
ISO 6579:2002/Amd.1:2007. Amendment 1: Annex D: Detection of
Salmonella spp. in animal faeces and in environmental samples from the primary production stage. International Organization for
Standardization, Geneva, Switzerland.
ISO 6579-1:2017. Microbiology of the food chain – Horizontal method for
the detection, enumeration and serotyping of Salmonella – Part 1: Horizontal method for the detection of Salmonella spp. International
Organization for Standardization, Geneva, Switzerland.
ISO/IEC 17025:2005. General requirements for the competence of testing
and calibration laboratories. International Organization for
Standardization, Geneva, Switzerland.
ISO 16140. Microbiology of the food chain - Method validation - Part 2:
Protocol for the validation of alternative (proprietary) methods against a reference method. International Organization for
Standardization, Geneva, Switzerland.
ISO 21528-2:2004. Microbiology of food and animal feeding stuffs –
Horizontal methods for the detection and enumeration of
Enterobacteriaceae – Part 2: Colony-count method. International
Organization for Standardization, Geneva, Switzerland. ISO/TS 22117:2010. Microbiology of food & animal feeding stuffs -
Specific requirements & guidance for Proficiency Testing (PT) by interlaboratory comparison. International Organization for
Jarvis B., C. Wilrich & P.-T. Wilrich (2010). Reconsideration of the derivation of most probable numbers, their standard deviations, confidence bounds and rarity values, Journal of Applied
Microbiology, 109:1660–7. Link to MPN calculation programme:
http://www.wiwiss.fu-berlin.de/fachbereich/vwl/iso/ehemalige/wilrich/index.html (access date December 2016).
Kuijpers A.F.A & K.A. Mooijman (2016). EURL-Salmonella 8th
interlaboratory comparison study Food 2016; Detection of Salmonella in minced chicken meat. RIVM report 2017-0081,
Bilthoven, the Netherlands.
https://www.rivm.nl/bibliotheek/rapporten/2017-0081.pdf (access date April 2018).
Löfström C. & J. Hoorfar (2012). Validation of an open-formula, diagnostic real-time PCR method for 20-h detection of Salmonella in animal feeds, Veterinary Microbiology 158:431–5.
Malorny B., E. Paccassoni, P. Fach, C. Bunge, A. Martin & R. Helmuth (2004). Diagnostic real-time PCR for detection of Salmonella in food, Applied and Environmental Microbiology, 70:7046-52. Pol-Hofstad, I.E. & K.A. Mooijman (2016). The 19th EU Interlaboratory
comparison study in primary production (2016); Detection of Salmonella in chicken faeces adhering to boot socks. RIVM report
2016-0044, Bilthoven, the Netherlands.
https://www.rivm.nl/bibliotheek/rapporten/2016-0044.html (access date April 2018).
Pol-Hofstad, I.E. & K.A. Mooijman (2017). The 20th EURL-Salmonella
interlaboratory comparison study primary production (2017);
Detection of Salmonella in chicken faeces. RIVM report 2017-0083, Bilthoven, the Netherlands.
http://www.rivm.nl/bibliotheek/rapporten/2017-0083.pdf (access date 20-7-2018).