Risk assessment of fumonisin B1 in the Netherlands
M.I. Bakker, G.J.A. Speijers, W.E. Paulsch, H.P. van Egmond
This investigation has been performed by order and for the account of The Food and Consumer Product Safety Authority, within the framework of project V/310301, Natural Toxins.
Abstract
Fumonisin B1 is a mycotoxin that can be produced by certain Fusarium species. The toxin is
found, in particular, in maize and maize products, but occurrence in both wheat and wheat products, and rice and rice products, has also been reported. The intake of fumonisin B1 by the
population in the Netherlands was estimated in an exposure assessment using data on concentrations of fumonisin B1 in different food products combined with the consumption rate
of these products. From the (limited) results summarized here, wheat was found to be the main contributor (73 %) to the total fumonisin B1 intake. Since the 99th percentile of the
lifelong-average intake (0.38 µg/kg bw/day as estimated in a worst case scenario) is considerably lower than the tolerable daily intake (2 µg/kg bw/day), the current dietary intake of fumonisin B1 in
Contents
Samenvatting 4
Summary 5
1. Toxicology of fumonisin B1 6
1.1 Introduction 6
1.2 Chemistry and effects of processing 6
1.3 Absorption, distribution, metabolism and excretion 7
1.4 Toxicological studies 7
1.5 Observations in humans 8
1.6 Derivation of a TDI 8
1.7 Regulatory concentrations for fumonisins in food products 8
2. Dietary intake of fumonisin B1 10
2.1 Fumonisin B1 concentrations in different food groups 10
2.2 Concentration in individual food products 11
2.3 Calculation of dietary intake 11
2.4 Statistical analysis and modelling 12
2.5 Uncertainty in the calculated intake 13
2.6 Risk Assessment of fumonisins in the Netherlands 14
3. Conclusions 15
References 16
Mailing list 17
Appendix 1 19
Samenvatting
Fumonisine B1 is een mycotoxine dat, samen met de (in mindere mate voorkomende)
fumonisinen B2 en B3 door Fusarium verticillioides en Fusarium proliferatum wordt
geproduceerd. Fumonisine B1 wordt vooral aangetroffen op mais en maisproducten, maar ook
tarwe en rijst kunnen besmet raken. Fumonisine B1 wordt in verband gebracht met diverse
ziekten bij paarden en varkens, en het toxine is een lever-tumorpromotor in ratten en forellen. Een toelaatbare dagelijkse inname voor de som van de fumonisinen B1, B2 en B3 is recent door
het Joint Food and Agriculture Organisation/World Health Organisation Expert Committee on Food Additives vastgesteld op 2 µg/kg lichaamsgewicht.
In dit rapport is de inname van fumonisine B1 in de Nederlandse populatie geschat door de
voedselconsumptiegegevens te combineren met de (beperkte) gegevens over fumonisine B1
concentraties in voedingsmiddelen. In Nederland wordt fumonisine B1 voornamelijk (73%) via
tarwe(-producten) ingenomen. De mediane inname van fumonisine B1 is (gemiddeld over een
mensenleven) 0,03 µg/kg lichaamsgewicht/dag. Wordt uitgegaan van een ‘worst case’ scenario, waarbij onder andere ‘niet aantoonbare’ fumonisine B1-gehalten als positief worden
beschouwd, met als nominale waarde de detectiegrens, dan wordt een mediane dagelijkse inname van 0,15 µg/kg lichaamsgewicht/dag bereikt en een 99e percentielwaarde van
0,38 µg/kg lichaamsgewicht/dag. Deze laatste waarde ligt duidelijk lager dan de toelaatbare dagelijkse inname (2 µg/kg lichaamsgewicht/dag). Derhalve is de conclusie dat de huidige inname van fumonisine B1 in Nederland geen gezondheidsrisico vormt.
Summary
Fumonisin B1 is a mycotoxin that is produced, together with (the less dominant) fumonisins B2
and B3, by Fusarium verticillioides and Fusarium proliferatum. Fumonisin B1 can be
particularly found on maize and maize products, but also wheat and rice can become contaminated with the toxin. Fumonisin B1 is associated with various diseases in horses and
pigs. The toxin is a tumor promotor in the liver of rat and trout. The Joint FAO/WHO Expert Committee on Food Additives has recently established a tolerable daily intake for the sum of the fumonisins B1, B2 and B3 at 2 µg/kg bw/day.
In this report the intake of fumonisin B1 in the Dutch population was estimated in an exposure
assessment by combining food consumption data with the (limited) data on fumonisin B1
concentrations in food products. In the Netherlands the intake of fumonisin B1 occurs mainly
(73 %) via the intake of wheat (-products). The median daily intake of fumonisin B1 (averaged
for a human lifetime) is 0.03 µg/kg bw/day. When a ‘worst case’ scenario is applied where ‘non-detectables’ are considered positive, with the limit of detection as nominal values, a median daily intake of 0.15 µg/kg bw/day is reached and a 99th percentile of
0.38 µg/kg bw/day. Since the latter value is considerably lower than the tolerable daily intake (2 µg/kg bw/day) it is concluded that there is no appreciable health risk from the current dietary intake of fumonisin B1.
1.
Toxicology of fumonisin B
111.1 Introduction
Fumonisins B1 (FB1), B2 and B3 and B4 are toxic fungal metabolites produced by fungi of the
genus Fusarium. FB1 is the most significant in terms of toxicity and occurrence. The only
species that produce significant quantities of fumonisins are Fusarium verticillioides (formerly named F. moniliforme) and the related F. proliferatum. At least 10 other Fusarium species are also capable of producing fumonisins. Fusarium verticillioides and F. proliferatum are common fungi associated with maize, they are frequently isolated from both damaged and undamaged maize kernels. These species cause ‘Fusarium kernel rot’ of maize, an important disease in hot climates. A strong relationship also exists between insect damage and ‘Fusarium kernel rot’ due to other Fusarium species such as F. graminearum. Temperature stress may also play a role, especially in cultivars grown outside their area of adaptation. As Fusarium verticillioides and F. proliferatum grow over a wide range of temperatures but only at relatively high water activities ( aw > 0.9), fumonisins are formed in maize before harvest or
during the early stage of drying. Except under extreme conditions, the concentrations of fumonisins do not increase during storage. Formation of fumonisins in the field correlates with the occurrence of Fusarium verticillioides and F. proliferatum, which predominate during late maturity. Fumonisins are geographically widely distributed, and their natural occurrence in maize has been reported in many areas of the world. Of particular concern are the high concentrations found in maize produced and consumed by specific sub-populations, such as subsistence farmers. Considerable annual variations in contamination have been noted. Fumonisins occur infrequently in other foods, such as wheat, sorghum, asparagus, rice, and mung beans.
1.2 Chemistry and effects of processing
Fumonisins are a group of structurally related compounds. The structure of fumonisin B1 is
shown in Figure 1. Fumonisin B2 is the c-10 deoxy analogue of FB1 in which the corresponding
stereogenic units on the eicosane backbone have the same configuration. The full stereochemistry of fumonisins B3 and B4 is unknown yet, but the amino terminal of fumonisin
B3 hasthe same absolute configuration as that of FB1 (Bolger et al., 2001; EHC, 2000).
Figure 1. Structure of fumonisin B1
The effects of various processing procedures on the levels of fumonisin contamination have been studied. For example, maize screenings contain higher concentrations of fumonisins than whole grain. Separation and removal of screenings is a useful method for reducing the amount
1 The text of this chapter is based on the report of the 56th meeting of the JECFA (2001) CH3 O HOOC COOH OH3C O CH3 CH3 OH OH OH NH2 O HOOC COOH
of fumonisins entering storage. Steeping maize aqueous solutions during wet milling results in extraction of fumonisins and is thus effective in reducing the concentration in maize products. Fumonisins are fairly heat stable, and the toxin content is significantly reduced only during processes in which the temperature exceeds 150°C. Dry milling of maize results in distribution of fumonisins into various maize constituents. There is little degradation of fumonisins during fermentation. Alkaline cooking and heating called nixtamalization, which results in the production of hydrolysis products, does not completely detoxify maize contaminated with fumonisin. In each process, many parameters affect the fate of the fumonisins. In addition, toxic compounds resulting from the conversion of fumonisins may appear during processing (Bolger et al., 2001).
1.3 Absorption, distribution, metabolism and excretion
In all animal species studied, fumonisins are poorly absorbed from the digestive tract and are rapidly distributed and eliminated. The liver and kidney retain most of the absorbed fumonisins (FB1 mainly), and FB1 persists longer in rat liver and kidney than in plasma. In pregnant rats
and rabbits, very low concentrations of FB1 were recovered in the uterus and placenta. No FB1
was found in fetuses, indicating the absence of placental transfer. There was little evidence of significant transfer during lactation, and fumonisins do not appear to be metabolised in vivo or in vitro. Although fumonisins are not metabolised by cytochrome P450 enzymes, FB1 can alter
the activity of these enzymes through mechanisms that alter sphingolipid biosynthesis. Fumonisins are structurally related to sphingoid bases. Removal of the tricarboxylic acid side-chains, presumably by microbial flora of the gut, converts FB1 into a substrate for ceramide
synthase. The product of the enzyme reaction, like FB1, is an inhibitor of the enzyme in vitro
(Bolger et al., 2001). 1.4 Toxicological studies
The liver was a target organ for FB1 in all species tested, whereas the kidney was also a target
in many animal species. In kidney, the early effects are often increased in free sphingoid bases, renal tubule-cell apoptosis, and cell regeneration. In the liver, apoptotic and oncotic necrosis, oval-cell proliferation, bile duct hyperplasia, and regeneration are early signs of toxicity. In studies in rats and trout fed known cancer initiators and with various initiation and promotion protocols, purified FB1 enhanced liver cancer development. Brief administration of high doses
or longer administration of low doses that cause significant hepatotoxicity resulted in the appearance of foci positive for glutathione-S-transferase (placental form), hepatocellular nodules, and other precursors of liver tumour development. In rodents, there is difference in sensitivity and target organs liver and kidney depending on strain and gender. The kidney carcinomas seen in Fischer 344N male rats were a highly malignant variant of renal tubule tumour, but the significance of their aggressive nature was unclear. The No-Observed-Effect-Level (NOEL) for renal cancer in these Fischer 344N rats was 0.69 mg FB1/kg bw per day, and
the NOEL for renal toxicity in this strain was 0.2 mg/kg bw per day. The NOEL for liver cancer in male BDIX rats was 0.8 mg FB1/kg bw per day, and the NOEL in feed restricted
female B6C3F1 mice was 1.9 mg FB1/kg bw per day.
Studies in rodents, non-human primates, and other animal species given F. verticillioides culture material from an isolate that produces predominantly FB1 or maize naturally
contaminated with fumonisins showed toxic effects in the liver and kidney that were similar to those in studies with purified FB1. The NOEL for the renal and hepatic toxicity of all
fumonisins in vervet monkeys fed a diet containing the cultured material was 0.11 mg/kg bw per day. Purified FB1, F. verticillioides culture material, and naturally contaminated maize all
induced not only hepatotoxicity but also leukoencephalomalacia in equids and pulmonary oedema and hydrothorax in pigs. Both diseases appeared to occur secondarily to cardiovascular
dysfunction. Cardiovascular effects have also been seen in other species. Field outbreaks of equine leukoencephalomalacia (ELEM) and porcine pulmonary oedema (PPE) associated with the consumption of fumonisin-contaminated maize have been reported. The NOEL for FB1 in
ELEM was equivalent to 0.3 mg/kg bw per day for horses fed diets containing culture material. In pigs fed the culture material, evidence of PPE was detected at a concentration equivalent to 0.4 mg FB1/kg bw per day. For pigs fed naturally contaminated maize, the concentration of FB1
required to induce PPE was much higher, although the NOEL for liver toxicity was similar (equivalent to 0.2 mg/kg bw per day).
In a small number of genotoxicity studies in vitro and a single study in vivo, neither FB1 nor
any other fumonisin was shown unequivocally to be genotoxic. Similarly no adducts of fumonisins with DNA have been found.
While there was evidence that fumonisins are embryotoxic in vitro, no published data exist to support the conclusion that fumonisins cause developmental or reproductive toxicity in farm animals. Except in one study in hamsters, embryotoxicity occurred in laboratory animals (rats, mice, and rabbits) secondarily to maternal toxicity (Bolger et al., 2001; SCF, 2000). 1.5 Observations in humans
Consumption of mouldy sorghum or maize containing FB1 at up to 64 mg/kg was associated
with an outbreak of human disease in India involving gastro-intestinal symptoms. The grain was also reported to be contaminated with other toxigenic fungi.
The available evidence for an association between the intake of fumonisins and human cancer was limited to few correlation studies. Typically, these involved a few regions in which populations were broadly classified with regard to their risk for oesophageal or liver cancer. The regions were then compared with respect to the proportions of contaminated samples and the level of contamination. In some studies, the measures of intake of fumonisins were indirect, and the incidence of disease was related to consumption of certain foods, notably maize. Taken together, the results of these studies could be interpreted as indicating an association between fungal contamination of foodstuffs and oesophageal cancer or liver cancer. However, bias, chance, or confounding could not be excluded, and hence there was only limited evidence of an independent carcinogenic effect of fumonisins. A similar conclusion for FB1 was also drawn by
IARC (1993). A specific role for fumonisins in the development of neural tube defects has been proposed. The hypothesis includes a critical role of fumonisins in disruption of folate membrane transport, but no specific studies have yet been performed to confirm this mechanism (Bolger et al., 2001; EHC, 2000; SCF, 2000)
1.6 Derivation of a TDI
The Scientific Committee on Food (SCF/EU) of the European Commission (SCF, 2000) evaluated only FB1. They considered the mode of action and the fact that there is no adequate
evidence that FB1 is genotoxic, and concluded therefore that a threshold approach was justified.
The SCF allocated on the basis of the overall No-Observed-Adverse-Effect-Level (NOAEL) from rat studies which were equivalent to 0.2 - 0.25 mg/kg bw/day, a TDI of 2 µg/kg bw, using a safety factor of 100.
The JECFA (Bolger et al., 2001) allocated a group provisional maximum tolerable daily intake (PMTDI) for fumonisins B1, B2, and B3, alone or in combination, of 2 µg/kg bw on the basis of
the NOEL for renal toxicity in Fischer rats of 0.2 mg/kg bw per day (see Section 1.4) and a safety factor of 100.
1.7 Regulatory concentrations for fumonisins in food products
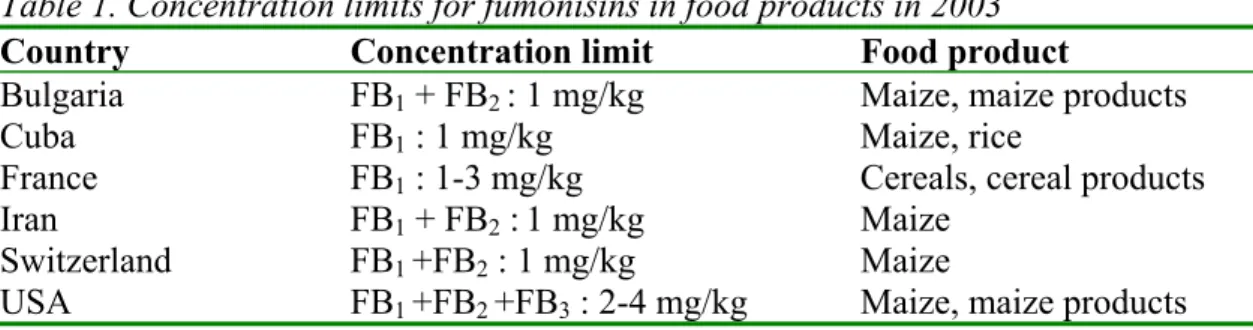
Several countries established concentration limits for fumonisins in different food products (Van Egmond and Jonker, 2003). These limits are summarized in table 1. Whereas in 1995
fumonisins were only subject of regulations in one country, this number has now increased to 6, with limits for maize ranging from 1-4 mg/kg. Although proportionally this is a very significant increase, the number of fumonisins-regulating countries is too small to draw meaningful conclusions about generally agreed limits.
Table 1. Concentration limits for fumonisins in food products in 2003
Country Concentration limit Food product
Bulgaria FB1 + FB2 : 1 mg/kg Maize, maize products
Cuba FB1 : 1 mg/kg Maize, rice
France FB1 : 1-3 mg/kg Cereals, cereal products
Iran FB1 + FB2 :1 mg/kg Maize
Switzerland FB1 +FB2 : 1 mg/kg Maize
2.
Dietary intake of fumonisin B
1Human dietary intake of chemicals is usually estimated by combining data on concentrations of chemicals in different food products and the consumption rate of these products. The methodology used for the derivation of the mean FB1 concentrations in the different food
products is described in the section below. The consumption rate of the products containing FB1 is examined with the Dutch National Food Consumption Survey (DNFCS), which
describes the consumption pattern of the Dutch population and includes information on the daily consumption over two consecutive days and a record of age, sex and body weight of 6250 individuals (Kistemaker et al., 1998).
2.1 Fumonisin B1 concentrations in different food groups
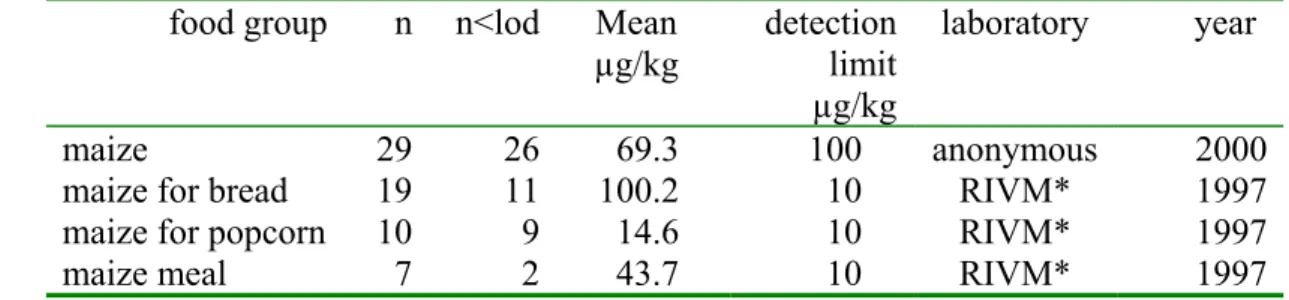
Fumonisin is predominantly found in maize and maize products, but also in wheat, wheat products and rice. In the Netherlands FB1 concentrations were monitored in maize (Table 2).
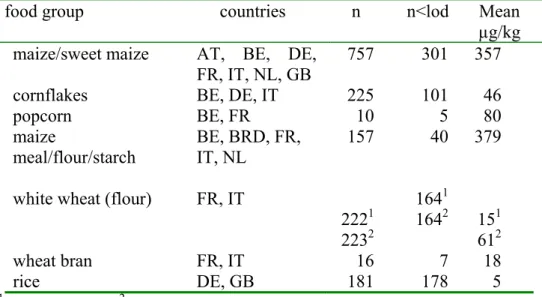
The percentage of non-detects in these samples is high. Furthermore, the number of samples measured in the Netherlands is relatively low and the only cereal that was analysed was maize. Therefore, the Dutch concentration data were combined with concentrations in food products sampled in other EU countries, reported by the EU (SCOOP, 2003). The criteria we used for these concentration data were: (1) the food (product) must be consumed in the DNFCS, (2) the data must be complete; i.e. the limit of detection, maximum and mean values should be given, (3) at least one positive sample for a food group must be present in all the data. Details of these calculations are described in Appendix 1. In Table 3 the calculated mean FB1 concentrations in
the different food groups are shown. For wheat, two concentrations were derived: one excluding the outlier of 10,000 µg/kg determined in France (while the rest of the French wheat samples contained less than 750 µg/kg), and one with the outlier included (see Table 3).
Table 2. Number of samples (n), number of samples below limit of detection (n<lod) and mean FB1 concentrations (taking all samples into account, samples < lod were assigned the value
0.5× lod) in maize measured in the Netherlands food group n n<lod Mean
µg/kg detection limit µg/kg laboratory year maize 29 26 69.3 100 anonymous 2000
maize for bread 19 11 100.2 10 RIVM* 1997
maize for popcorn 10 9 14.6 10 RIVM* 1997
maize meal 7 2 43.7 10 RIVM* 1997
Table 3. Number of samples (n), number of samples below limit of detection (n<lod) and mean FB1 concentrations (taking all samples into account, see Appendix 1) in
different food groups, reported by the EU (SCOOP, 2003)
food group countries n n<lod Mean
µg/kg maize/sweet maize AT, BE, DE,
FR, IT, NL, GB
757 301 357
cornflakes BE, DE, IT 225 101 46
popcorn BE, FR 10 5 80 maize meal/flour/starch BE, BRD, FR, IT, NL 157 40 379
white wheat (flour) FR, IT
2221 2232 1641 1642 151 612 wheat bran FR, IT 16 7 18 rice DE, GB 181 178 5
1without outlier, 2with outlier
2.2 Concentration in individual food products
Since only a limited number of all food products were sampled, there were no concentration data available for all consumed products as described in detail in the DNFCS database.
The food products present in the database were classified into the seven food groups mentioned in Table 3, or classified as not relevant. By multiplying the content of a specific food group in the consumed food product (e.g. wheat content of bread = 0.6) with the average FB1
concentration of the food group, the FB1 concentrations of the various food products were
calculated. Although there is some information on the loss of FB1 during food processing (see
Section1.2), this was not taken into account due to the lack of accurate data on the concentration reduction during cooking and baking, etc.
Data on the cereal content of the products were derived from the Conversion model Primary Agricultural Products (CPAP, Van Dooren et al., 1995), or were based on cooking recipes or on the content of similar food products in the same food category.
2.3 Calculation of dietary intake
The dietary intake of FB1 during two days by the participants of DNFCS was calculated by
combining the consumption of the participants with the calculated FB1 concentrations, using
the Dutch data and EU data, and the low wheat concentration (i.e. the wheat concentration without outlier). The contribution of each food group to the total average intake of FB1 during
Table 4. Short-term (two-day) intake of FB1 per food group and the relative contribution of the
different food groups to the average total FB1 intake
food group Average food consumption (g/day/person) Average intake (ng/day/person) contribution of food group to total intake (%) maize 0.7 242 9 cornflakes 0.5 21 < 1 popcorn 0.2 12 < 1 maizemeal 1.3 390 15 white wheat (flour) 129.4 1966 73 wheat bran 0.1 2 < 1 rice 7.7 42 2 total 2675 100
It appears that the majority of the intake of FB1 occurs via the consumption of wheat (Table 4).
The total average two-day intake calculated in this manner is 2.7 µg/day/person (0.05 µg/kg bw/day).
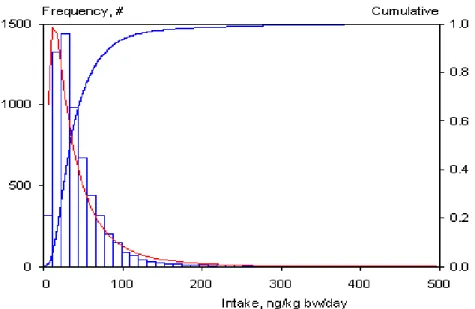
2.4 Statistical analysis and modelling
The frequency distribution shown in Figure 2 gives insight in the total variation in daily intakes. This variation has two components: a between-days and between-individuals variation. The high tailing value of the distribution (Figure 2) should therefore be carefully interpreted, as it contains a one-day event of an individual. Therefore, this distribution is not suitable for a comparison with the tolerable daily intake (TDI), because the latter is intended for long-term exposure. The long-term exposure distribution, representing inter-individual differences, was estimated by using the Statistical Exposure Model (STEM; Slob, 1993).
Figure 2. Frequency distribution of fumonisin B1 intake per kg body weight per day, consisting
of daily average intakes at two consecutive days for 6250 individuals recorded in the Food Consumption Survey database
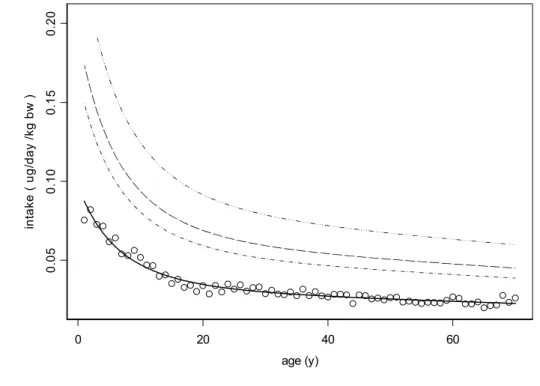
Analysing the data displayed in Figure 2 by STEM yields the results as presented in Figure 3, showing that the median intake decreases with age. The percentiles depicted in the figure represent the variation between individuals after correcting for the between-days variation. However, since the TDI is established for a lifelong intake, we should not look at the intake at a specific age such as shown by Figure 3, but at the exposure during the whole life of an individual. The lifelong-averaged intake is such a measure. For the median of the population, the age dependent median intake from age 1 to 70 yrs (Fig. 3) is integrated and expressed on a daily basis. It is thus assumed that exposure concentrations in food remain unchanged throughout one’s life. This means that the potential effect of the current exposure conditions is evaluated as if it would be effective on a lifelong period. The-lifelong averaged median intake is 0.03 µg/kg bw/day, while the 99th percentile is 0.10 ng/kg bw/day.
0 20 40 60 age (y) 0. 05 0. 10 0. 15 0. 2 0 in ta ke ( ug/ d a y / kg bw )
Figure 3. Daily intake of FB1 (using low wheat concentration) per kg bodyweight as
a function of age. Each circle denotes the age class mean. The line represents the estimated geometric mean intake estimated by fitting a regression function. The dashed curves denote the 90th, 95th and 99th percentiles, indicating the long-term variation between individuals
2.5 Uncertainty in the calculated intake
The uncertainty in the calculated intake of FB1 stems from the uncertainty in the calculated
average concentrations in the food groups and from the uncertainty in the consumption rate. The latter is considered relatively low, since wheat, the food group which gives the highest contribution to the total FB1 intake, is frequently consumed by a high percentage of the Dutch
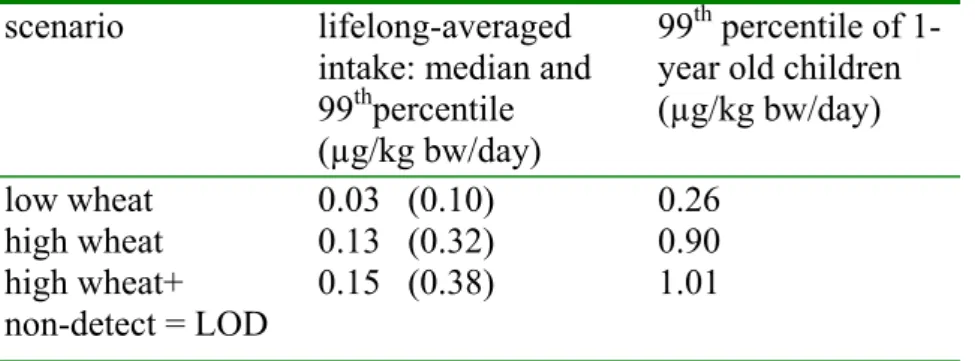
people. Therefore, the consumption of wheat is reliably estimated by the DNFCS. However, the uncertainty in the calculation of the average concentrations in the food groups may be considerable. As mentioned above, the wheat data included an outlier, which is omitted in the calculation. Including the outlier the lifelong-averaged median intake as well as the 99th
percentile of the 1-year olds increases with almost a factor of four (Table 5). In this scenario, the contribution of wheat to the total intake of FB1 is 92 %. Another important source of
uncertainty is the high percentage of non-detects. A worst case calculation, using the values of the detection limits for the non-detects (instead of half the detection limit) and the high wheat concentration, gives a lifelong-averaged median intake of 0.15 µg/kg bw/day (Table 5).
Since there are not many data available on fumonisin concentrations in wheat, it is recommended to do additional research. This could be carried out by analysing fumonisins in (24 h) duplicate diet samples, or by measuring fumonisin in wheat in the Netherlands.
It should be noted that the year-to-year variation of FB1 may be considerable due to different
weather conditions. Since food products were sampled usually during two or three years the range of concentrations measured may be wider. Furthermore, the number of collected samples is limited and the calculated mean concentrations may not be representative for the food products consumed by the Dutch population. Similarly, the concentration data from other countries may not be representative for the Dutch situation.
FB1 on foodstuffs is generally accompanied by fumonisins B2 and B3, in a ratio of about 8:3:1
(Sydenham et al., 1993). The intake of FB1 should therefore be increased with 50 % to obtain
the intake of all three the fumonisins.
Table 5. Lifelong-averaged median intake and 99th percentile of FB1 and 99th percentile of
1-year old children calculated with three scenarios scenario lifelong-averaged
intake: median and 99thpercentile (µg/kg bw/day)
99th percentile of 1-year old children (µg/kg bw/day) low wheat high wheat high wheat+ non-detect = LOD 0.03 (0.10) 0.13 (0.32) 0.15 (0.38) 0.26 0.90 1.01
2.6 Risk Assessment of fumonisins in the Netherlands
To assess the risk of the fumonisins intake in the Netherlands, the estimated intake is compared to the TDI , which is 2 µg/kg bw/day for FB1 (SCF) and the same value for the total of B1, B2
and B3 (Bolger et al., 2001).
The lifelong intakes are all lower than the TDI, also if the values are 50 % higher due to the presence of fumonisin B2 and B3. Also, the 99th percentiles of the 1-year-old children are for all
three scenarios lower than the TDI. Therefore it can be concluded that there is no risk for the public health from the presence of fumonisins B1-B3 on foodstuffs in the Netherlands.
3.
Conclusions
The intake of fumonisins occurs mainly via wheat and wheat products. So, although the concentration of FB1 in maize is much higher than that in wheat, it appears that wheat and not
maize is the main source of fumonisin intake in the Netherlands. Since there are not many data on wheat, it is recommended to do extra investigations into the presence of fumonisin in wheat or in (24 h) duplicate diet samples. The estimated intake of FB1, but also of the total FB1, B2
References
Bolger, M., Coker, R.M., DiNovi, M., Gaylor, D., Gelderblom, W., Olsen, M., Paster, N., Riley, R., Shephard, G. and Speijers, G.J.A. (2001). In: Safety evaluation of certain mycotoxins in food: Fumonisins. Prepared by the 56th Meeting of the joint FAO/WHO Expert Committee on Food Additives (JECFA), WHO Food Additives Series No 47. Pp 104 – 275, World Health Organization, Geneva, International Programme on Chemical Safety. EHC (2000). Fumonisin B1. Environmental Health Criteria 219, Pp 1 - 150. International
Programme on Chemical Safety. World Health Organization, Geneva.
IARC (1993). Toxins derived from Fusarium moniliforme: Fumonisins B1 and B2 and fusarin
C. In : Some naturally occurring substances: Food items and constituents, heterocyclic aromatic amines and mycotoxins. International Agency for Research on Cancer, IARC Monograph on the Evaluation of Carcinogenic Risk to Humans, volume 56, pp, 445 – 466, International Agency for Research on Cancer, Lyon.
Kistemaker, C., Bouman, M. and Hulshof, K.F.A.M. (1998). Consumption of separate products by Dutch population groups - Dutch National Food Consumption Survey 1997 – 1998 (in Dutch). Zeist, TNO-Nutrition and Food Research Institute, TNO-report V98.812.
SCF (2000). Opinion of the Scientific Committee on Food on Fusarium toxins Part 3:
Fumonisin B1, 17 October 2000, SCF/Cs/CNTM/myc/24 Final, European Commission,
Brussels.
SCOOP (2003). Report on tasks for scientific cooperation. Reports of experts participating in task 3.2.10, April 2003. Collection of occurrence data of Fusarium toxins in food and assessment of dietary intake by the population of EU Member States. D. Subtask III: Fumonisins. European Commission, Directorate-General Health and Consumer Protection, Brussels, 485-577. (http://europa.eu.int/comm/food/fs/scoop/index_en.html, september 2003)
Slob, W. (1993). Modeling long-term exposure of the whole population to chemicals in food. Risk Analysis 13: 525-530.
Sydenham, E.W., Shephard, G.S., Thiel, P.G., Marasas, W.F.O., Theeder, J., Sanhueza, M.A., Gonzalez, D.A., Resnik, S. (1993). Fumonisins in Argentina field-trial corn. J. Agric. Food Chem. 41: 891-895.
Van Dooren, M.M.H., Boeijen, I., Van Klaveren, J.D. and Van Donkersgoed, G. (1995). Conversion of consumer food to primairy agricultural products (in Dutch). Wageningen, State Institute for Quality Control of Agricultural Products (RIKILT), report 95.17.
Van Egmond, H.P. and Jonker, M.A. (2003). Current Mycotoxin Limits and Regulations in Food. Accepted for publication in: Mycotoxins in food: detection and control. N. Magan and M.Olsen (Eds.) Woodhead Publishing Ltd. London, 2004.
Mailing list
1 Ir. J.F. de Leeuw, Director General of Food and Consumer Product Safety Authority (VWA) 2 Prof. P. Peters, Food and Consumer Product Safety Authority (VWA)
3 Ir. J.I.M. de Goeij, Director General Health, Ministry of Public Health, Welfare and Sport (VWS)
4 Dr. D.G. Groothuis, Food and Consumer Product Safety Authority (VWA) 5 Drs. H.J. Jeuring, Food and Consumer Product Safety Authority (VWA) 6 Prof.dr. J.A. Knottnerus, Chairman of Health Council of The Netherlands 7 Dr. M. Spanjer, Inspectorate for Health Protection and Veterinary Public Health
(VWA/KvW)
8 Dr. F. Verstraete, EU-EC, DG-SANCO
9 Dr. J. de Stoppelaar, Food and Health Protection Directorate (VGB), Ministry of Public Health, Welfare and Sport (VWS)
10 Mrs. N. Scheidegger, Ministry of Agriculture, Nature and Food Quality (LNV) 11 Drs. M. Elema, Product Board of Grains, Seeds and Pulses
12 Dr. K.F.A.M. Hulshof, TNO Nutrition and Food Research
13 Deposit of Netherlands Publications and Netherlands Bibliography 14 Dr. M. Sprenger, Director General of the RIVM
15 Prof.dr. D. Kromhout, Director of the Nutrition and Consumer Safety Division (RIVM/VCV)
16 Dr. A. Opperhuizen, Head, Laboratory for Toxicology, Pathology and Genetics, (RIVM/TOX)
17 Prof.dr. H. van Loveren, Laboratory for Toxicology, Pathology, and Genetics, (RIVM/TOX)
18 Dr. F.X.R. van Leeuwen, Centre for Substances and Integrated Risk Assessment, (RIVM/SIR)
19 Dr. J. Meulenbelt, National Poisons Information Centre (RIVM/NVIC)
20 Dr. L.A. van Ginkel, Acting Head, Laboratory for Food and Residue Analyses, (RIVM/ARO)
21 Drs. A.G.A.A.C. Knaap, Centre for Substances and Integrated Risk Assessment, (RIVM/SIR)
22-25 Authors
26 Bureau of the Director General and Communications (RIVM/SBC) 27 Library RIVM
28 Library RIVM/SIR 29 Library RIVM/ARO 30 Report Registration RIVM 31-35 Sales department RIVM 36-46 Stock RIVM/ARO
Appendix 1 Derivation of mean fumonisin B
1concentrations in different food groups
The concentrations in maize and maize products measured in the Netherlands were combined with mean concentrations in food groups (maize, maize products, wheat and rice) reported by other countries reported by the EU (SCOOP, 2003) by calculating the weighed mean (Table 1.1). Non-detects were assigned a value of 0.5 × LOD.
Table 1.1.Fumonisin B1 concentrations in different food groups reported by different countries.
Concentrations printed in bold are used in the exposure calculations. food group country n n < lod mean
µg/kg AT 171 154 57 BE 5 5 83 FR 304 51 207 BE 43 43 3 IT 37 0 2208 NL 29 26 69 GB 139 2 803 (sweet) corn total 728 281 369 corn flakes BE 12 12 29 BE 205 88 37 IT 8 1 233 total 225 101 44 popcorn BE 5 5 0.1 FR 5 - 160 total 10 5 80 wheat (flour) FR* 161 127 14 FR** 162 127 76 IT 61 56 18 total 222 223 183183 15*61** bran FR 7 - 8 IT 9 7 25 total 16 7 18 rice DE 81 78 6 GB 100 100 5 181 178 5