Report 601780002/2009
RIVM Report 601780002/2009
Estimation of emissions and exposures to PFOS used in
industry
An inventory of PFOS used in metal plating and fire fighting
Y. Bruinen de Bruin P. Zweers
J. Bakker M. Beekman
Contact:
Yuri Bruinen de Bruin
Expertise Centre of Substances - Integration and Exposure yuri.bruinen.de.bruin@rivm.nl
This investigation has been performed by order and for the account of VROM - Ministry of Spatial Planning, Housing and the Environment, within the framework of Socio-economic Analysis in REACH
© RIVM 2009
Parts of this publication may be reproduced, provided acknowledgement is given to the 'National Institute for Public Health and the Environment', along with the title and year of publication.
Abstract
Estimation of emissions and exposures to PFOS used in industry
An inventory of PFOS used in metal plating and fire fighting
By order of the Dutch Ministry of Spatial Planning, Housing and the Environment (VROM), the RIVM compiled an inventory of perfluoroctane sulfonate (PFOS) used in two specific applications. These are in use as mist suppressants/wetting agents in industrial chromium plating and as agents in fire-fighting foam. The primary aim of the inventory, with respect to the latter application, was to estimate existing stocks in the Netherlands.
In the Netherlands, the metal plating industry uses an estimated amount of 390 kg PFOS annually as a mist suppressant/wetting agent. The largest standing stocks of PFOS-containing fire-fighting foam are found at airports and chemical-industrial locations, such as petrochemical and paint manufacturing plants. The data compiled in the inventory were provided by suppliers.
The European Commission requested all Member States to compile an inventory of PFOS focusing on similar specific applications. The use of PFOS is restricted due to the risks it presents to both human and environmental health.
The methodologies used for data collection and analysis can be applied for other purposes, such as REACH (Registration, Evaluation, Authorisation and Restriction of Chemicals).
Key words:
data collection, exposure estimation, release estimation, exposure methodology, PFOS, REACH, chemical use
Rapport in het kort
Schatting van industriële emissies en blootstelling aan PFOS
Een inventarisatie van PFOS gebruik in de metaalbewerking en brandbestrijding
In opdracht van het ministerie van Volkshuisvesting, Ruimtelijke Ordening en Milieu (VROM) heeft het RIVM het gebruik in Nederland van de stof perfluoroctaansulfonzuur (PFOS) geïnventariseerd voor twee specifieke toepassingen. Het gaat om PFOS als nevelonderdrukker en bevochtigingsmiddel voor verchromingsdoeleinden, en om het gebruik ervan in blusschuim. Bij de laatste functie gaat het vooral om een schatting van de nog bestaande voorraden in Nederland.
In Nederland wordt per jaar naar schatting 390 kilo PFOS gebruikt voor deze toepassingen in de metaalbewerkingsindustrie. De grootste voorraden van blusschuim met PFOS zijn aanwezig op vliegvelden en op chemische industriële locaties, zoals verffabrieken en de petrochemische industrie. Het onderzoek is gebaseerd op gebruiksgegevens die leveranciers hebben aangeleverd.
De Europese Commissie heeft alle lidstaten van de Europese Unie gevraagd het gebruik van PFOS voor genoemde toepassingen te inventariseren. Vanwege de risicovolle eigenschappen van PFOS is het gebruik ervan aan banden gelegd.
De dataverzamelings- en analysemethodieken in dit rapport kunnen voor andere doeleinden worden gebruikt, zoals voor REACH. REACH staat voor Registratie, Evaluatie, Authorisatie en Restrictie van Chemische Stoffen.
Trefwoorden:
data verzamelen, blootstellingsschatting, emissieschatting, blootstellingsmethodologie, PFOS, REACH, stoffengebruik
Contents
Summary 6
1 Introduction 7
2 Method 8
2.1 Literature search 8
2.2 Contacting branch organizations and suppliers 8
2.3 Analyzing literature and industry data to estimate releases and stocks 9
3 Results 10
3.1 PFOS emissions into the environment from the non-decorative metal
plating industry 10
3.1.1 Process description 10
3.1.2 Estimated amounts placed on the Dutch market 10
3.1.3 Estimated releases into the environment 10
3.2 Estimation of existing stocks of PFOS containing fire-fighting foam 11
3.2.1 Process description 11
3.2.2 Estimated amounts placed on the Dutch market 11
3.2.3 Estimated existing stocks per branch 12
4 Discussion 14
4.1 Use and emissions from the metal plating industry 14
4.2 Assessment of national PFOS containing fire-fighting stocks 15
5 Conclusion 17
Acknowledgements 18
References 19
Annex I. Theoretical concepts for the estimation of industrial PFOS emissions and
stocks of PFOS containing fire-fighting foam 20
I.1 Estimation of PFOS emissions during metal plating 20
I.2 Estimation of PFOS containing fire-fighting stocks 20
I.2.1 Estimation of total volume that is still present on the Dutch market using data from
the past market leading supplier of large quantities. 20
I.2.2 Estimation of the fraction of delivered refilling quantities per branch on the Dutch
market using data from the market leading supplier of small quantities. 21
I.2.3 Estimation of national amounts per branch combining data from market leading
Summary
Directive 2006/122/EC of the European Parliament and the Council dated 12 December 2006 concerns the restriction of the placement on the market and use of perfluorooctane sulfonates (PFOS). This directive is part of Directive 76/769/EEC relating to restrictions on the marketing and use of certain dangerous substances and preparations. The latter will be replaced by Annex XVII of REACH (Registration, Evaluation, Authorisation and Restriction of Chemicals) starting on the 1st of June 2009. In Appendix I of
the guideline 2006/122/EG it is mentioned that at the end of 2008 each EU Member State has to provide the European Commission with an inventory on 1) the amounts and releases of PFOS used as mist suppressants for non-decorative hard chromium (6+) plating and wetting used in controlled electroplating systems and
2) existing stocks of fire-fighting foams containing PFOS. In reaction to this requirement, this document concerns the assessment of amounts and releases of PFOS and the size of foam stocks in the Netherlands. Assessment of total stocks was done by using sales data and extrapolation based on market shares. Substantial effort was put into the data collection and many contacts were made with industry. The obtained information on sales volumes and use served as a basis to estimate emissions and stocks on national scale. Assumptions were made on the distribution of annual sales volumes, release and use. In addition, sales volumes were extrapolated to represent nation wide market quantities.
It is estimated that the worst-case maximum PFOS use for non-decorative hard chromium (6+) plating is less
then 0.4 ton per year (390 kg/year). Highest stored volumes of PFOS containing fire-fighting foam were found to be still present at airports and chemical industrial related locations being about 3300 m3 and
3200 m3 respectively, on a total of 18540 m3.
The approach described in the current document is subject to uncertainty. More accurate estimations with known uncertainty can only be made on the basis of more data. Additional data of better quality are probably difficult to collect.
1
Introduction
Directive 2006/122/EG (Directive 2006/122/EC, 2006) concerns the restriction of the placement on the market and use of perfluorooctane sulfonates (C8F17SO2X, of which X = OH, metal salt (O-M+), halogenide,
amide and other derivates among which are polymers), further referred to as PFOS.
In Appendix I of the Directive 2006/122/EC it is mentioned that not later than 27 December 2008 each EU member state hands over to the Commission an inventory on:
• the amounts and releases of PFOS used as mist suppressants for non-decorative hard chromium (6+)
plating and wetting used in controlled electroplating systems and
• existing stocks of fire-fighting foams containing PFOS (i.e., foam present in firefighting storage equipment such as bottled foam and pipelines).
For the latter, it is important to bear in mind that existing fire-fighting foam that contains PFOS can still be used during a limited time frame in order to prevent possible further emissions into the environment. Foam that has been placed onto the market prior to December 2006 can still be used until 27 June 2011.
With this document the Netherlands fulfills the requirements mentioned in Directive 2006/122/EC. The approach to collect and analyze information and data used to estimate the required amounts and releases are described in the following chapters. The final estimates are summarized in chapter 5.
2
Method
Risk assessment information was collected to find information on the use and exposure of PFOS and PFOS related substances. The search strategy and information selection faced three stages being 1) literature search based on predefined terms and selection of a number of information resources facilitating a more focused search, 2) contacting branch organizations, (past) suppliers of PFOS for non-decorative metal plating, (past) suppliers of PFOS containing fire-fighting foam, and respective users on use quantities, 3) analysing literature and use data made available by industry facilitating quantitative estimation of emissions and stocks on a national scale.
2.1
Literature search
The first search criterion consisted of a selection of initial information resources most known to the authors to contain relevant information. Cross reference database search options offered by NLM’s PUBMED, Scirus, European Commission and European Agencies’ websites and institutional websites from WHO and RIVM were used. Information resources were screened by the use of one or a combination of the search terms ‘chromium’, ‘(non)decorative’, ‘environment’, ‘exposure assessment’, ‘fire-fighting foam’, ‘health’, ‘human’, ‘metal plating’, ‘mist suppressant’, ‘Perfluorooctane Sulfonates’, ‘PFOS’, ‘RAR’, ‘risk assessment’, and ‘workers’.
Collected information on the use of PFOS was split into two parts, i.e. one dealing with non-decorative material surface treatment processes with chromium (6+) and one dealing with fire prevention and
management.
2.2
Contacting branch organizations and suppliers
Branch organizations and associations allotting the specific domain of metal plating and fire-fighting applications were contacted for information on the quantities and releases of PFOS during metal plating with Chromium (6+) and existence of stocks of PFOS containing fire-fighting foam in urban areas and important
infrastructural locations such as petroleum industry, airports, harbors, railways, etc. Communication structures for obtaining data on the use of PFOS for metal plating and in fire-fighting foams are illustrated in Figure 1 and Figure 2, respectively.
Figure 1. Communication structure used to obtain data on the use of PFOS in the metal plating industry.
Figure 2. Communication structure used to obtain data on the use of PFOS in fire-fighting foams and existing stocks.
Fire-fighting branch organization (Internet reference 2)
Supplier fire-fighting foam (large quantities)
Supplier fire-fighting foam (refilling quantities) Branch organization starting website (Internet
reference 1)
VOM (Dutch Association of surface treatment industries)
NGO-SBG (Society of enterprises active in
the field of galvanization
VNCI (Dutch Association of Chemical Industries)
FME (Association of metal and electro
technological industries)
Market leading supplier of PFOS solution for non decorative metal
plating
2.3
Analyzing literature and industry data to estimate releases
and stocks
The data made available by past suppliers contained information on clients, locations and amounts. Data on PFOS in fire-fighting foam were stored in a for this task developed database (Microsoft Access, 2008). Calculations were done using Excel (Microsoft Excel, 2008) to estimate the total PFOS emissions during metal plating and PFOS containing fire-fighting stocks. The latter stock is presented as a total stock (national scale) and is - as a second step - categorized into stock estimations per branch. An in-depth description of the methodology with corresponding equations is described in Annex I. The results of the calculations are presented in the next chapter.
3
Results
This chapter describes the results obtained by applying the methodology described in Annex I. This chapter presents the results of estimated PFOS emissions into the environment from the metal plating industry and the estimates of existing stocks of PFOS containing fire-fighting foam per branch category.
3.1
PFOS emissions into the environment from the
non-decorative metal plating industry
3.1.1 Process description
PFOS-related substances are used to lower the surface tension of metal plating solutions in order to prevent the formation of mists containing potentially harmful components from the baths. As such they are used in chromium plating, in anodizing and in acid pickling. Within the Netherlands, a major supplier of PFOS related substances for the Dutch metal plating industry supplied the substance tetraethylammoniumheptadecafluorooctanesulphonate (further referred to as TEA-PFOS) – a member of the PFOS family - as mist suppressant for the Dutch metal plating industry, more specifically for the non-decorative chromium surface treating industry. This substance is specifically selected for its resistance in a corrosive environment. Its use reduces the emission of aerosols formed during the surface treatment process from the chromium baths and remains sufficiently stabile in the corrosive solution within the chromium baths. The emissions of corrosive and carcinogenic material are minimized on the basis of economic analysis (Personal communication with a supplier of Fumetrol 140 on 29.07.2008). Contacted industry considered the use of an alternative substance, however, the bottleneck is the resistance against a corrosive environment caused by the chromium acidic electrolyte driving the stability of the mist suppressing property.
The substance TEA-PFOS is also being used for decorative chromium surface treatment applications. The market leader in the Netherlands announced that the use of PFOS for the production of non-decorative (and decorative) surface treatments will be terminated in 2008 for those applications that are not exempted as referred to in Directive 2006/122/EC. The market leader indicated the existence of a PFOS-free alternative for metal plating surface treatment applications.
3.1.2 Estimated amounts placed on the Dutch market
In 2006, the market leading supplier in the Netherlands placed 1560 kg of a solution (Fumetrol 140) containing TEA-PFOS (CAS: 56773-42-3, EINECS: 260-375-3) on the Dutch market for metal plating surface treatment mainly intended for the use of non-decorative purposes. The producer was located in
market is released into the environment, the emission is estimated to be in the range of 65 – 390 kg/year. Given the limited data which has been provided, the worst-case approach is preferred. This resulted in a total yearly worst-case emission of 390 kg for the Netherlands (see Annex I Eq. 1).
3.2
Estimation of existing stocks of PFOS containing
fire-fighting foam
3.2.1 Process description
Fluorised surfactants are used for specific fire-fighting applications. Surfactants need to quickly spread the water-based foam on top of burning hydrocarbon containing materials in order to avoid that the foam will arrive under the fire level. In this manner, the fire’s oxygen supply is being blocked avoiding eventual burn-back. Both the surfactants as the foaming creating substances have to be stable under extreme conditions and have to resist the process of oxidation. Because the use of fire-fighting foam is limited to incidences foam products need to be long lasting and are being sold with a period of guarantee of 15-20 years. Industrial plants, areas and infrastructural sensitive locations like airports, tunnels and harbors, frequently contain storage locations of fire-fighting foam on PFOS basis in case of incidences.
3.2.2 Estimated amounts placed on the Dutch market
The market leader in the Netherlands placed between 1997 and 2002 in total more then 1 million kg of PFOS containing fire-fighting foam on the Dutch market. Sales volumes, however, decreased from 2001 onwards due to new legal requirements. As a first step, it was assumed that sales volumes are best represented by a lognormal distribution (having zero as an absolute minimum and infinity as a theoretical maximum (Ott, 1990). Consequently, on the basis of four sales volumes provided by the supplier (see Table 1) the annual mean, standard deviation and 95th percentile were found to be 239 m3, 0.001m3 and
309 m3, respectively.
Table 1. Four consecutive sales volumes of PFOS containing fire-fighting foam placed on the Dutch market by the market leader.
Year Sales volume (m3)
1997 246 1998 212 1999 295 2000 212
As a next step, the 95th percentile is taken as a worst-case estimate of sales volume in the Netherlands. By
assuming a shelf-life of 20 years – which is the maximum guarantee period – the total sales volume over a period of 20 years is estimated to be 20* 309 = 6180 m3 of PFOS containing fire-fighting foam (see Annex I
Eq. 2). The market leader had, however, an approximate market share of 25-50% in this period for the Dutch market (data supplied by the supplier). Assuming that the market share was 25% - and 75% of the fire-fighting foam was supplied by others -, this equals to a maximum of 6180/25 *100 = 24720 m3 of PFOS
3.2.3 Estimated existing stocks per branch
It is estimated that 75 % of all stocks are still existing (expert judgment). This estimate is made by the market leading PFOS containing foam supplier and is based on the frequency of orders by clients to the suppliers after usage of foam, like in the case of an incident or fire-fighting training exercise. In reality the foam lasts longer then 20 years (Personal communication with a supplier of Fumetrol 140 on 29.07.2008). This translates into an estimate of 24720 m3 * 0.75 = 18540 m3 of PFOS containing fire-fighting foam that is
still present in the Netherlands (see Annex I, Eq. 3).The rest of the foam (25%) is used. It is, however, unknown under which conditions the foam is used, i.e., under controlled conditions with assumed appropriate risk management measures, like collection and treatment of used foam in the case of an emergency exercise with negligible or low emissions into the environment, or uncontrolled with probably emissions into the environment like in the case of real incidences, like a fire.
The market leader also sold PFOS containing fire-fighting foam to smaller refilling distributors (assumed to include in the above estimate). One of the market leading smaller distributors, sold small (refilling) volumes PFOS containing fire-fighting foam throughout the Netherlands with an estimated market share of 40-60% for the period prior to 2002. The sales data were analysed by adding a category or branch label to each sale volume (see Table 2). Percentages of category sales were then calculated by dividing each category sales volume by the total sales volume of all branch categories (see Annex I, Eq. 4). The estimations of sales percentages of refilling PFOS containing fire-fighting foam are presented in Table 2 per branch category.
Table 2. Categorized estimation of sales volume percentages of refilling PFOS containing fire-fighting foam.
Branch category Percentage1
(%)
Aviation/airport 17.9
Industry of chemicals 17.5
Fire prevention/protection 11.2
Industry of coatings/paints 8.2
Ministry of defence/military purposes 8.1
Transportation, storage, and distribution of chemicals (containers,trucks,boats) 6.1 Engineering industry (construction, material and products) 4.9
Industry of petrochemicals 4.6
Waste industry 3.4
Food Industry 2.4
Industry of consumer products 2.2
Packaging industry 2.0
Car industry 1.8
Insulation producing industry 1.8
Public buildings, hospitals and universities 1.1
Other 6.8
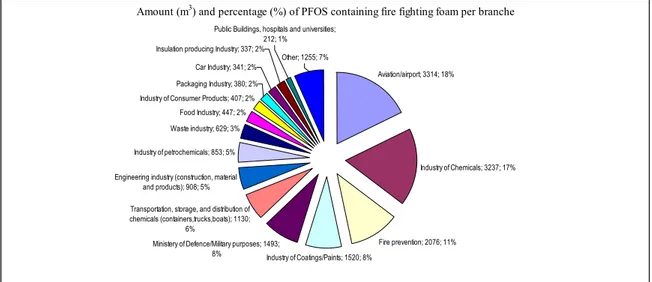
Amount (m3) and percentage (%) of PFOS containing fire fighting foam per branche
Industry of Chemicals; 3237; 17%
Fire prevention; 2076; 11% Industry of Coatings/Paints; 1520; 8%
Ministery of Defence/Military purposes; 1493; 8%
Transportation, storage, and distribution of chemicals (containers,trucks,boats); 1130;
6% Engineering industry (construction, material
and products); 908; 5% Industry of petrochemicals; 853; 5%
Waste industry; 629; 3% Food Industry; 447; 2% Industry of Consumer Products; 407; 2%
Aviation/airport; 3314; 18% Other; 1255; 7%
Public Buildings, hospitals and universities; 212; 1% Insulation producing Industry; 337; 2%
Car Industry; 341; 2% Packaging Industry; 380; 2%
Figure 3. Estimated amount (m3) and percentage (%) of PFOS containing fire-fighting foam per branch category.
Highest volumes were found to be still present within the category aviation/airport – mainly existing of airports – of more then 3300 m3 and the chemical industry of more then 3200 m3. Percentages < 1% were
4
Discussion
Assessment of emissions and stocks can be done using direct (measurements) and indirect (modeling) methods. Substantial effort was put into the data collection phase making many contacts with industry. The obtained information on sales volumes and use is essential to estimate emissions and stocks. In order to come up with estimates on a national scale assumptions were made on the distribution of annual sales volumes, release and use. In addition, sales volumes were upgraded to represent nation-wide market quantities. The approach described in the current document is, however, subject to uncertainty which is difficult to quantify. More accurate estimations with known uncertainty can only be made on the basis of more data. This process, however, is time consuming and additional data of better quality are difficult to collect.
4.1
Use and emissions from the metal plating industry
The emission of PFOS (TEA-PFOS) from the metal plating industry using chromium (6+) is based on sales
volume data provided by industry assuming 100% release into the environment. Industry indicated that the provided volumes are mainly used for non-decorative metal plating purposes. In the light of the worst-case approach used in this report, it is assumed that the provided data only accounts non-decorative purposes. Because of limited availability of sales data – only for the year 2006 - the assumption was made that the 2006 data are also representative for other years. In reality, sales volumes are subject to fluctuations and therefore this assumption introduces uncertainty to some extent. Also the 100% emission assumption introduces uncertainty. It is even unrealistic and it can be assumed that the emissions are in reality substantially lower, possibly being a fraction of this amount. The release is also estimated on a national scale being the Netherlands. In reality, however, emissions occur on the production locations. Without more data on the metal plating process this uncertainty can, however, not be quantified.
Other EU Member States, however, faced similar challenges and also made estimations of PFOS use within the metal plating industry on the basis of various assumptions. Within the UK the amount of PFOS has been estimated to be less then 0.5 ton per year (RPA, 2004). The Dutch estimated amount of about 0.4 ton (390 kg) per year is in the same order of magnitude and in general agreement with the British estimation. In terms of EU production and use of PFOS related substances, the total EU-wide estimated use quantities by the metal plating industry is between 8.6 and 10 tonnes per year (RPA, 2004).
Brooke et al. (2004) produced emission data of PFOS salt type solutions and assumed that due to its relatively simple formulation process – mainly existing of dilution processes - emissions only occur during their use. Local emissions were estimated to be 180 mg/day to waste water and 0.33 mg/day to air. Brooke et
(2004), however, slightly larger compared to the regional scale surface. Solid quantitative conclusions can, however, not be made since both methods are too different.
Assuming that placement on the Dutch market equals the actual use and that no reactions occur of PFOS during the non-decorative chromium process, the assumption is that placement on the Dutch market equals environmental release. Environmental releases include emissions to air, water, soil, and waste. Emissions to air are expected to be low. Air concentrations during work on production sites of chromium plating were assumed to be 3.9 ng/m3 according to Brooke et al. (2004). Although air concentrations are low, inhalation
exposure cannot be excluded. In fact, Olsen et al. (2003) measured PFOS concentration in body serum of workers on a Perfluorooctanesulfonyl Fluoride Production Site of 0.941 ml/l (Geometric mean). Although the latter production site is different compared to chromium plating sites, occupational exposure and intake of PFOS via inhalation cannot be excluded for chromium plating workers. Most emissions are, however, expected to occur to waste water, mostly via the process of drag out (Brooke et al., 2004; OECD, 2004). How much of the PFOS can or is filtered out of the waste water via the application of risk management measures, like the placement of an active charcoal filter, is not known. Consequently, also emissions in the form of waste can not be excluded. Data reviewed within the frame of this task, however, is lacking specifications to assess compartment specific emissions. As a result, possible health risks related to industrial chromium plating cannot be indicated, however, can also not be excluded.
4.2
Assessment of national PFOS containing fire-fighting stocks
The existing stocks of PFOS containing fire-fighting foam in the Netherlands is based on sales volume data provided by two market leading suppliers, i.e., one supplier of large quantities and one supplier of smaller quantities mainly used for refilling purposes. Large quantity sales data covered multiple years (in total four) providing set of data to derive a sales volume distribution. This distribution is, however, subject to uncertainty and can only be improved by getting more (detailed) data on sales volume.
In the light of a realistic worst-case approach, the subsequent 95th percentile was taken as highest annual
sales volume of PFOS containing fire-fighting foam and multiplied by the maximum guarantee period of 20 years. In this way the theoretical maximum stock was estimated. The Scientific Committee on Health and Environmental Risks (SCHER) assumed a use rate of 15% for estimating environmental releases from the use of PFOS containing fire-fighting foam (SCHER, 2004). On the basis of additional assumptions on the actual foam use - based on expert judgment – in this work a lower estimate based on data supplied by the PFOS fire-fighting foam supplier was made of the total stock of foam that still exists in the Netherlands, being 75%.
To enable additional estimations of branch specific stocks, detailed company specific sales data provided by the market leading refilling supplier were used to categorize sales volume percentages branch-wise. These percentages were then multiplied by the estimation of the total stock in the Netherlands to obtain branch specific stock estimations. Also this approach is subject to unknown uncertainty and can only become more realistic with detailed data.
Directive 2006/122/EC specifies that PFOS containing foam placed on the market prior to December 2006 can still be used until 27 June 2011. On the basis of 25% use of PFOS containing fire-fighting foam since 2000 until 2008, a period of 8 years, this translates to a use quantity of 24720-18540/8 = 772.5 m3/year.
period, of 18540 – (3*772.5) = 16222.5m3 that will still be present in the Netherlands. By multiplying this
number with the percentages presented in Table 2, branche-specific estimations of the PFOS containing fire-fighting foam stocks can be made.
5
Conclusion
Directive 2006/122/EC of the European Parliament and the Council dated 12 December 2006 concerns the restriction of the placement on the market and use of PFOS. In appendix I of the guideline 2006/122/EC it is mentioned that at the end of 2008 each EU Member State has to provide the European Commission with an inventory on 1) the amounts and releases of PFOS and related substances used as mist suppressants for non-decorative hard chromium (6+) plating and wetting used in controlled electroplating systems and 2) existing
stocks of fire-fighting foams containing PFOS. In reaction to this requirement, this document concerns the assessment of consequent emissions and stocks in the Netherlands.
On the basis of information provided by industry and assumptions on the distribution of annual sales volumes, release and use, it is estimated that the maximum (worst-case) PFOS emission for non-decorative hard chromium (6+) plating is less then 0.4 ton per year (390 kg/year). Highest stored volumes of PFOS containing fire-fighting foam, were found to be still present (annum 2008) at airports and chemical industrial related locations being about 3300 m3 and 3200 m3, respectively, on a total of 18.540 m3.
The assessment described in the current document is considered as a best estimate for the described emissions and stocks bearing in mind that there is limited data available. More accurate estimations with known uncertainty can only be made on the basis of more data. Additional data of better quality are probably difficult to collect.
Acknowledgements
This project has been supported by the Ministry of Spatial Planning, Housing and the Environment (VROM). We would like to thank Dr. Cees Luttikhuizen (VROM) for the support and input we received during this project. We also gratefully would like to thank Dr. Elbert Hogendoorn from RIVM’s Expertise Centre of Substances for the data and information he provided during the start of this project.
References
Brooke D., Footitt A., Nwaogu T.A. (2004) Envionmental Risk Evaluation Report: Perfluorooctanesulphonate (PFOS), Environmental Agency.
Directive 2006/122/EC of the European Parliament and of the Council (2006). Amending for the 30th time
Council Directive 76/769/EEC on the approximation of the laws, regulations and administrative provisions of the Member States relating to restrictions on the marketing and use of certain dangerous substances and preparations (perfluorooctane sulfonates) Official Journal of the European Union, L 372/32 EN.
Internet reference 1: http://brancheorganisaties.startkabel.nl/. Internet reference 2: http://www.vebon.org/#pagina=849.
OECD (2004) Environmental Health and Safety Publications, Series on Emission Scenario Documents No. 12 Emission Scenario Document on Metal Finishing, Environment Directorate, Organisation for Economic Co-operation and Development, ENV/JM/MONO(2004)23.
Olsen, G.W., Logan P.W., Hansen K.J., Simpson C.A., Burris J.M., Burlew M.M., Vorarath P.P., Venkateswarlu P., Schumpert, J.C. Mandel J.H. (2003) An Occupational Exposure Assessment of a
Perfluorooctanesulfonyl Fluoride Production Site: Biomonitoring. American Industrial Hygiene Association Journal, Vol 64(5), pp.651-659.
Ott WR (1990) A physical explanation of the lognormality of pollutant concentrations. J Air Waste Manage Assoc 40: 1378–1383.
RPA - Risk and Policy Analysts Limited (2004). Risk Reduction Strategy and Analysis of Advantages and Drawbacks for Perfluorooctane sulphonate (PFOS), Final Report J454/PFOS RRS.
SCHER – Scientific Committee on Health and Environmental Risks. (2004) Opinion on RPA´s report Perfluorooctane Sulphonates Risk reduction strategy and analysis of advantages and drawbacks. Final report. TGD - Technical Guidance Document on Risk Assessment (2003), Part II, EUR 20418 EN/2.
6
Annex I. Theoretical concepts for the
estimation of industrial PFOS emissions and
stocks of PFOS containing fire-fighting foam
I.1 Estimation of PFOS emissions during metal plating
Data were made available by the market leading supplier on a PFOS containing solution for the metal plating industry using chromium (6+). These data were used to estimate the total emission of PFOS into the
environment according to Equation 1 (Eq. 1).
release market PFOS total PFOS
f
f
C
V
E
=
*
*
Eq. 1 in which:EPFOS = Estimated maximum worst-case emission of PFOS into the environment [kg]
Vtotal = Total volume of solution placed on the Dutch market by the market leader [kg]
CPFOS = Concentration of PFOS related substance in solution (%)
fmarket = Fraction of Dutch market share based on the low end of the estimated range
frelease = Fraction of release (unrealistic worst-case)
I.2 Estimation of PFOS containing fire-fighting stocks
Data that were made available by the market leading suppliers of PFOS containing fire-fighting foam were used to estimate of total volumes for several industry branches that still exist on the Dutch market. The estimation was made in three subsequent steps using specific equations.
I.2.1 Estimation of total volume that is still present on the Dutch market using data from the past market leading supplier of large quantities.
Vtotal = Estimated realistic worst-case total volume that is still existing on the Dutch market [m3]
Vsale = Estimated realistic annual worst-case sales volume (95th percentile) [m3]
tguarantee = Maximum guarantee period representing maximum shelf life
fmarket = Fraction of Dutch market share based on the low end of the estimated range (personal
communication, 2008)
fremaining = Fraction of remaining fire-fighting foam (personal communication, 2008)
I.2.2 Estimation of the fraction of delivered refilling quantities per branch on the Dutch market using data from the market leading supplier of small quantities.
Fractions of delivered PFOS containing fire-fighting foam per branch were calculated by Equation 3 (Eq. 3).
01
.
0
*
1 ) ( ) ( ) (∑
==
n i i branch i branch i branchV
V
f
Eq. 3 in which:fbranche(i) = Fraction of delivered refilling quantities per branch i on the Dutch market
Vbranche(i) = Refilling volume per branch [m3]
I.2.3 Estimation of national amounts per branch combining data from market leading suppliers of large and refilling quantities.
By multiplying the total volume of foam placed on the Dutch market by branch fractions, the volumes per branch that still exist are estimated using Equation 4 (Eq. 4).
) ( ) (i total
*
branchi branchV
f
Q
=
Eq. 4 in which:Qbranche(i) = Estimated realistic worst-case volume per branch that still exists on the Dutch market [m3]
Vtotal = Estimated realistic worst-case total volume that is still existing on the Dutch market [m3]