RIVM report 609021041/2007
The dispersal of fumigants around ocean shipping containers
E. Schols, E.M. van Putten
This study was conducted on behalf of the VROM Inspectorate as part of the project M/609021 ‘Support for enforcement VROM Inspectorate’.
National Institute for Public Health and the Environment (RIVM), Postbus 1, 3720 BA Bilthoven, Telephone: 030 - 274 91 11; fax: 030 - 274 29 71
Contact: E. Schols
Centre for Inspectorate Research, Emergency Response and Drinking Water e-mail: emile.schols@rivm.nl
Abstract
The dispersal of fumigants around ocean shipping containers
The National Institute for Public Health and the Environment advises establishing a restricted area around containers treated with detergents. No one should be allowed to enter this area without breath protection equipment. A restricted area of 50 metres around the containers should be established for large amounts of detergents, such as up to 5 kg methyl bromide or vikane. When smaller amounts (up to 1 kg for methyl bromide) are applied or occur, an area of 20 metres will be sufficient. Within these distances, concentrations may occur that are harmful to human health. This advice has been given to the Dutch Inspectorate of Housing, Spatial Planning and the Environment in response to the request made by the Inspectorate to simplify the existing rules on distances that vary depending on the substance and the use.
High concentrations of detergents exist in containers for export to foreign countries. The recommended distances should be applied for the use of methyl bromide, phosphine and vikane. Containers under the present rules are only treated with these detergents when the receiving country requires such a treatment. In the Netherlands the use of these substances is only applicable under strict regulations. The restricted areas should be established at the start of the treatment because of possible leakage from the containers. Before shipment of the
containers they are cleared of the detergents by opening the doors and letting the detergents evaporate. This process causes concentrations around the containers that are harmful to human health.
Import containers may also contain detergents. In practice, other detergents than the three used for export containers are found in import containers in the Dutch harbours. Since the
concentrations in import containers are substantially lower, a distance of 20 metres will be sufficient to protect people from hazardous concentrations due to leakage or evaporation. Another recommendation is to prohibit (starting) the release of the detergents under calm weather conditions. High concentrations may then occur for some time and at longer distances. Key words: methyl bromide, phosphine, vikane, pest control, containers
page 4 of 67 RIVM report 609021041
Rapport in het kort
De verspreiding van gassingsmiddelen rond containers
Het RIVM adviseert de VROM-Inspectie om een zone rondom ‘gegaste’ havencontainers te creëren waar alleen mensen met adembeschermingsapparatuur mogen komen. Voor grote hoeveelheden ontsmettingsmiddelen (tot 5 kg voor de stoffen methylbromide en
sulfurylfluoride) geldt een afstand van 50 meter tot de container. Bij kleinere hoeveelheden (tot 1 kg) volstaat 20 meter. Binnen deze zones zijn de concentraties van vrijkomende gassen schadelijk voor de volksgezondheid. Aanleiding voor dit advies was de wens de regelgeving over ontgassing te vereenvoudigen en zo de handhaving te verbeteren.
De hoge concentraties komen meestal voor bij exportcontainers. Die moeten soms voor vertrek met bestrijdingsmiddelen worden behandeld om de inhoud of het pakkingsmateriaal te
ontsmetten (gassen). De maatregel geldt vanaf het moment waarop het gassen aanvangt. De ontstane gassen worden vervolgens verwijderd voordat de containers de haven verlaten (ontgassen).
De genoemde afstanden zijn gebaseerd op de concentraties die in Nederland bij het gassen en ontgassen vrijkomen. Als internationale voorschriften het gebruik van methylbromide, fosfine en sulfurylfluoride voorschrijven, gelden in Nederland wettelijke gebruiksvoorschriften. In importcontainers, die soms nog resten ontsmettingsmiddelen bevatten, zijn de concentraties lager en volstaat een afstand van ten minste 20 meter, aldus het advies. Deze kleinere
hoeveelheden zijn nog hoog genoeg om de gezondheid schade toe te brengen, zodat enige afstand tot de containers is geboden. Kort na aanvang van de ontgassing kunnen namelijk relatief hoge concentraties voorkomen. Bovendien kunnen gassen lekken uit de nog gesloten containers, waardoor in de nabijheid hoge concentraties circuleren.
Een andere aanbeveling is de ontgassing bij windstil weer te verbieden. Dit voorkomt dat de gassen in hoge concentraties op het terrein blijven hangen.
Dit onderzoek is uitgevoerd in opdracht van de VROM-Inspectie.
Trefwoorden: gassing, ontgassing, importcontainers, exportcontainers, methylbromide, sulfurylfluoride, fosfine, afstandseis, gebruiksvoorschriften
Contents
SUMMARY... 7
ABBREVIATIONS... 8
1. INTRODUCTION... 9
1.1 IMPORTANCE OF THE RESEARCH... 9
1.2 ASSIGNED TASK AND RESEARCH AIMS... 9
1.3 RESEARCH QUESTIONS... 9
1.4 OUTLINE OF THE REPORT... 10
2. EXISTING DATA... 11
2.1 RESEARCH ON FUMIGATION... 11
2.2 PUBLIC HEALTH NORMS FOR FUMIGANTS... 11
2.3 EXISTING LEGISLATION AND REGULATIONS... 13
3. MEASUREMENT METHODS ... 15
3.1 DIFFERENT MEASUREMENT METHODS USED... 15
3.2 BADGES IN COMBINATION WITH GC-MS ANALYSIS... 15
3.3 TEDLAR BAGS IN COMBINATION WITH GC-MS ANALYSIS... 16
3.4 CANISTERS IN COMBINATION WITH GC-MS ANALYSIS... 17
3.5 ACTIVE CHARCOAL TUBES IN COMBINATION WITH GC-MS ANALYSIS... 17
3.6 SENSORS... 18
4. PROJECT APPROACH ... 19
4.1 PROJECT APPROACH IN BRIEF... 19
4.2 EXPERIMENTAL DESIGN FOR DEGASSING ACTIVELY FUMIGATED CONTAINERS... 19
4.3 EXPERIMENTAL SETUP FOR THE IMPORT CONTAINERS STUDY... 23
5. RESULTS ... 25
5.1 RESULTS OF THE STUDY OF ACTIVELY FUMIGATED CONTAINERS... 25
5.1.1 Results of the study on 17 August 2006...25
5.1.2 Results of the study on 30 August 2006...28
5.2 RESULTS WITH THE IMPORT CONTAINERS... 31
5.2.1 Results of the study with badges for methyl bromide ...31
5.2.2 Results of the measurements with import containers on 19 September 2006...34
5.2.3 Results of the measurements with import containers on 30 September 2006...35
5.2.4 Results of the measurements with import containers on 27 October 2006...36
6. INTERPRETATION AND DISCUSSION... 39
6.1 PROGRESSION OF THE CONCENTRATIONS OF FUMIGANTS WITH THE ACTIVELY FUMIGATED CONTAINERS.... 39
6.2 COMPARISON OF THE MEASUREMENT METHODS... 39
6.3 MEASURED CONCENTRATIONS IN RELATION TO DISTANCE AND NORMS... 41
6.3.1 Measurements on 17 August 2006 ...41
6.3.2 Measurements on 30 August 2006 ...42
6.3.3 Measurements with badges around import containers ...42
6.3.4 Measurements on 19 and 30 September 2006 and 27 October 2006 ...43
6.4 MODELLING THE DISPERSAL... 44
7. CONCLUSIONS AND RECOMMENDATIONS ... 49
7.1 CONCLUSIONS... 49
page 6 of 67 RIVM report 609021041
REFERENCES ... 55
APPENDIX 1 SUMMARY OF THE MEASUREMENT RESULTS ... 57
APPENDIX 2 METHYL BROMIDE: TOXIC FOR PEOPLE AND THE ENVIRONMENT... 59
APPENDIX 3 RESULTS OF THE OLM MEASUREMENTS ON 30 AUGUST 2006 ... 62
APPENDIX 4 MODEL INPUT DATA ... 65
Summary
On behalf of the VROM Inspectorate, the RIVM conducted a study into the concentrations of fumigants that occur near containers undergoing degassing. Degassing means that containers which have been treated with gaseous pesticides are opened so that these gases can ‘blow away’. The study focused on determining the distance at which the concentrations of these gases were still above the norm that is used to protect the population against hazardous effects. Research was conducted on export containers and import containers.
In the research involving export containers, two sets of three empty containers were fumigated with methyl bromide, phosphine and sulfuryl fluoride using the normal method for export containers. After at least 24 hours, the degassing procedure began by opening the doors. The concentrations of the fumigants were measured downwind. The majority of the fumigants appeared to be released soon after opening the containers, leading to high concentrations downwind that lasted for several minutes.
The measurement results were supplemented with model calculations to determine the distance at which the concentrations exceeded a norm. Concentrations around the limit value can occur up to 20 metres away from the container (phosphine). At a 50 metre distance, the
concentrations were no more than 20% of the norm.
With import containers, the quantities in the containers were lower, but there were also more uncertainties, such as uncertainties about the specific gases that were used.
From these data, the RIVM has derived separation distances from containers that are
undergoing degassing; within these distances, people should not be allowed without personal protection equipment (respiratory protection). The RIVM recommends basing the separation distance on the quantity and type of substance used in the containers. The specific
recommendations are:
- 20 metres if the quantity of substances in the containers to be degassed is no more than 1 kg of methyl bromide or sulfuryl fluoride or 10 g of phosphine;
- 50 metres if the quantity of decontamination substances in the containers to be degassed is no more than 5 kg of methyl bromide or sulfuryl fluoride, or up to 60 g of phosphine; - For larger quantities, degassing can take place only in consultation with the VROM
Inspectorate.
These separation distances are in force until the containers are free of the hazardous substances used for fumigation (are declared to be ‘gas free’).
These conclusions apply during weather with good possibilities for dispersal. The RIVM recommends that degassing be forbidden during other types of weather, for example when wind speeds are lower than 0.5 metre per second (wind speed 0 on the Beaufort scale in the current weather report).
page 8 of 67 RIVM report 609021041
Abbreviations
ATSDR Agency for Toxic Substances and Disease Registry, see http://www.atsdr.cdc.gov/
CTB Board for the Authorisation of Pesticides ECT Europe Container Terminals
GC-MS Gas chromatograph - Mass spectrometer
MAC value Maximum acceptable concentration of a substance at the workplace. The MAC value is defined as the maximum concentration of a gas, fume or aerosol of a substance in the air at the workplace that is generally not harmful to the health of the employees or their offspring if inhaled during the period of employment.
MeBr Methyl bromide
MPR Maximum Permissible Risk
NIOSH National Institute for Occupational Health and Safety
OLM Online monitoring apparatus
PH3 Phosphine
PHAST Process Hazard Analysis Software Tool
RIVM National Institute for Public Health and the Environment SO2F2 Sulfuryl fluoride (Vikane)
VI VROM Inspectorate
1.
Introduction
1.1
Importance of the research
In some cases, containers with export goods must be treated against spoilage or contamination of goods, pallets and/or wood packaging material. Some countries require treatment with pesticides such as methyl bromide or phosphine. If containers in the Netherlands must be fumigated, then stringent regulations apply to protect employees and the population against exposure to excessive concentrations of these hazardous substances. For example, there are demands on the required distance between the containers to be fumigated and houses or other buildings occupied by people. These separation distance requirements are based largely on model calculations. Dispersion models have a high level of uncertainty if used for calculating dispersion across a short distance from a source and around obstacles.
For fumigated import containers, there are no separation distance requirements in force for the degassing procedure. Import containers that have been fumigated or are suspected of being fumigated are degassed – preferably at a safe location and using a safe method. In practice, import containers are fumigated with a wide range of substances and sometimes with mixtures of substances.
Consequently, little factual data are available about the concentrations of substances that occur surrounding containers in practice; therefore it can not be determined whether the separation distance requirements currently used in practice are adequate.
1.2
Assigned task and research aims
The VROM Inspectorate strives to acquire more understanding of the concentrations that can actually occur surrounding containers during the degassing of both export and import
containers. With this understanding, the VROM Inspectorate can determine whether the current guidelines for separation distance offer sufficient protection for public health. The VROM Inspectorate requested the RIVM to establish a measurement programme that provides insight into the concentrations occurring at varying distances during the degassing of export and import containers.
1.3
Research questions
The RIVM has formulated the following research questions: – with respect to export containers:
1. What concentrations of fumigants occur, especially downwind, of export containers that are being degassed?
2. Are there observable differences in the dispersion of different fumigants?
3. How do the concentrations relate to the available and applicable norms for the general public?
page 10 of 67 RIVM report 609021041 4. At which distances do the concentrations fall below these norms, given the weather
conditions during the measurements?
5. Are the results that were collected under the practical conditions during the research usable for making an estimate of the situation during other weather conditions and for a representative part of the time?
– with respect to import containers:
6. What concentrations of fumigants occur in the situation in practice on the terrain of European Container Terminals (ECT) in the vicinity of import containers that are being degassed?
7. How do these concentrations relate to the available and applicable norms for the exposure of the public?
8. At which distances are the concentrations below these norms, given the weather conditions during the measurements?
9. Are the results that were collected under the corresponding practical conditions usable for making an estimate of the situation during other weather conditions and for a representative part of the time?
10. Are the results of the various sampling and analysis techniques for methyl bromide sufficiently comparable with each other?
– with respect to containers undergoing degassing:
11. What separation distance requirements can be established so that the norms for the exposure of the public are satisfied?
1.4
Outline of the report
This report concerns practical experiments about the dispersal of fumigants around containers undergoing degassing. In chapter 2, currently known data are collected, such as the results from previous studies, the regulations concerning fumigation and the applicable norms for fumigants. Chapter 3 contains a description of the available measurement methods for the various
fumigants. The experimental design is described in chapter 4, the results in chapter 5 and an interpretation of these results in chapter 6. The final chapter presents the conclusions.
2.
Existing data
2.1
Research on fumigation
In the past, the RIVM has conducted various studies concerning fumigated containers. In 2000, research was conducted into the concentrations of methyl bromide surrounding a fumigated container and into the leak tightness of containers (Knol, 2000a and 2000b). In this study into the concentrations of methyl bromide surrounding a container undergoing degassing, two containers were degassed (dosage 45 gm-3). The progression in the methyl bromide
concentrations in the containers was determined by periodically measuring the concentrations in the closed container during a 24-hour period. In addition, the concentration of methyl bromide was measured at distances of 10 m and 50 m from the container. In one container, 5% of the fumigated quantity was observed after 24 hours, in the other container this was still 100%. During degassing, the methyl bromide concentrations for one of the containers at 10 m exceeded the MAC value, and at 50 m were below the MAC value.
In the study of the leak tightness of containers (Knol, 2000b), two randomly chosen containers were fumigated with methyl bromide, where a dosage of 45 g m-3 was used. The concentrations in the containers were measured during a 24-hour period.
Results of this study were as follows:
- the methyl bromide gas introduced into the container became completely mixed only several hours after fumigation began;
- in one container the concentrations decreased to 62% of the original concentration, and in the other container to 4%;
- the containers, which superficially appeared to be identical, therefore had differing air change rates.
Other research has shown that goods inside fumigated containers can absorb the fumigants and can continue to emit these substances for a long time (Knol, 2005a and 2005b).
2.2
Public health norms for fumigants
In terms of exposure and effects, the situation concerning containers undergoing degassing involves the exposure of the public for periods ranging from several minutes to several hours, in addition to the fact that workers can also be exposed. Table 1 includes the available norms for the fumigants investigated. This table includes the directly available norms in addition to other norms such as intervention values (concerning exposure during calamities. Source: VROM Inspectorate, 2006), MAC values (to protect workers during their entire working lives) or chronic or sub-chronic norms).
For methyl bromide, there is an available norm which stipulates the maximum exposure of the public for short periods. This concerns an hourly average concentration of 10 mg m-3. This value is based on acute effects for the public, and is therefore very useful in this study as a reference value.
page 12 of 67 RIVM report 609021041 For chloropicrine, 1, 2-dichloroethane and sulfuryl fluoride, no norms are available concerning the exposure of the public during periods ranging from several hours to minutes for normal working conditions. The only norms available are intervention values for calamities and working safety norms (MAC values).
For phosphine, the best available norm is that for 24-hour exposure. Table 1 Summary of public health norms
Substance Concentration Norms to protect public health ppm mg m-3 Methyl bromide 2.5 25 50 250 0.075 0.02 0.25 10 100 200 1000 0.3 0.1 1
Maximum hourly average for the public (see Appendix 2) Information guideline1 (intervention value 1 hour) Alarm limit value1 (intervention value, 1 hour)
Life-threatening limit value1 (intervention value, 1 hour) Other, less useable norms:
subchronic exposure (Knol, 2005b) chronic exposure (MTR3)
MAC value4 (with skin indication) Chloropicrine 0.03 0.3 1.5 0.1 0.2 2 10 0.7
Information guideline1 (intervention value 1 hour) Alarm limit value1 (intervention value, 1 hour)
Life-threatening limit value1 (intervention value, 1 hour) Other, less useable norms:
MAC value 1,2-dichloroethane 40 120 480 0.01 1.5 3 200 500 2000 0.05 7 14
Information guideline (intervention value 1 hour) Information guideline (intervention value 1 hour) Life-threatening limit value (intervention value, 1 hour) Other, less useable norms:
Chronic limit value (Baars et al., 2001) MAC value
MAC value, 15 minute average Sulfuryl fluoride 3
5
12 20
Short-term limit value for bystanders (EU, 2006) Other, less useable norms:
MAC value2 Phosphine 0.01 0.01 1 7 0.0002 0.1 0.2 0.02 0.017 2 10 0.00025 0.14 0.28
Limit value for 24-hour exposure (RIVM, 2000) Limit value for 2-week exposure (RIVM, 2000) Alarm limit value1 (intervention value, 1 hour)
Life-threatening limit value1 (intervention value, 1 hour) Other, less useable norms:
Chronic limit value (RIVM, 2000) MAC value
MAC value, 15 minute average 1
The intervention values are values that are used in case of calamities; therefore they do not apply as accepted exposure concentrations during regular activities (VROM Inspectorate, 2006).
2
The Health Council of the Netherlands has proposed lowering the MAC value to 2.4 ppm (10 mg m-3) (Gezondheidsraad, 2004).
3
Maximum Permissible Risk (VROM, 1999).
4
2.3
Existing legislation and regulations
In the statutory usage regulations for methyl bromide (CTB, 2006), there are three separation distance requirements with respect to the space within which no people are allowed during the entire period of fumigation and degassing. The standard requirement is 100 m. There are two exceptions to this rule:
• When fumigating containers, all activities in the open air on company terrain between 10m and 100 m of the fumigation location are permitted as long as the concentration of methyl bromide remains below the statutory limit value of 0.25 ppm (1 mg m-3).
• If less than 25 kg of methyl bromide is used for fumigation, the separation distance
requirement of 100 m is reduced to 50 m at locations where such a fumigation does not take place more frequently than six times per year.
For fumigation with phosphine, there is also a separation distance requirement of 100 m (CTB, 2006). This distance may be reduced to 50 m if less than 1 kg of phosphine is used at locations where such fumigation does not take place more than six times per year.
For fumigation with sulfuryl fluoride, this substance is currently not approved (CTB, 2006). A request for approval is being considered. The applicant has proposed a distance separation requirement of 10 m for all fumigations with this substance; this is indicated as a safe distance by the applicant.
3.
Measurement methods
3.1
Different measurement methods used
In this study, different measurement methods were used for measuring the concentrations of the various fumigants. Table 2 summarizes the methods used.
Table 2 Summary of measurement methods used
Sampling method Component Analysis method
Badges Methyl bromide GC-MS
Tedlar bags Methyl bromide, chloropicrine, 1,2-dichloroethane, phosphine, sulfuryl difluoride
GC-MS
Canisters Methyl bromide, chloropicrine, 1,2-dichloroethane, phosphine, sulfuryl difluoride
GC-MS
Active charcoal tubes Methyl bromide, 1,2-dichloroethane
GC-MS
Sensors Methyl bromide Sensors
In this chapter, the methods will be described. For methyl bromide, various measurement methods are available. An additional aim was to compare the various methods with each other.
3.2
Badges in combination with GC-MS analysis
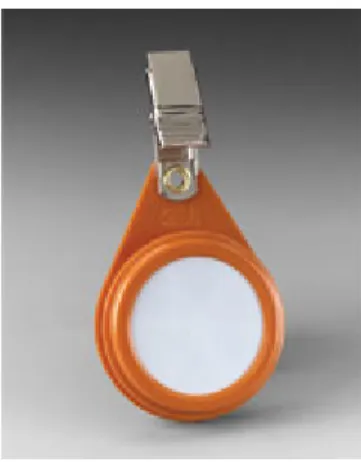
With the aid of 3M3500 Organic VaporMonitors (‘badges’), passive sampling can be conducted. This technique provides an average concentration over time for volatile organic components. The main advantage of this measurement method is that the badges are easy to use: they are light, handy in use and do not require any power source for the sampling.
A badge is constructed of a bed of activated charcoal, which is covered with a
semi-permeable membrane. The membrane ensures
that the various gases contact the activated Figure 1 A badge for passive sampling
charcoal with a known rate of diffusion. The sampling duration can range from several hours to several weeks.
page 16 of 67 RIVM report 609021041 Processing and analysing the samples
Processing begins by adding 1.6 ml cold dichloromethane to the badge. The extraction takes 30 minutes, during which the badge is regularly agitated. A portion of the extract is then placed in a 2 ml vial (a flask with a rubber stop), and analysis is conducted using GC-MS.
Characteristics
The characteristics of this technique are the following: time averaged (hours to weeks) sampling, easy to use, suitable for ascertaining concentrations on the order of μg m-3
to mg m-3.
3.3
Tedlar bags in combination with GC-MS analysis
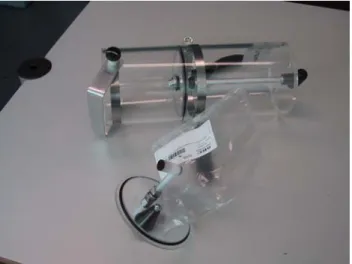
Figure 2 A Vac-U-tube with a Tedlar bag
A Tedlar bag is a bag with an
0.7 litre capacity made of inert material; with a manually operated pump, it can be used to collect air samples. The air sample can be analysed with GC-MS for various substances, including most volatile hydrocarbons.
Sampling takes place within several seconds; consequently, the ascertained values are instantaneous concentrations.
Analysis
Of the air that is present in the Tedlar bag, 50 ml is pumped onto a cold trap, after which the samples are analysed by means of thermal desorption with GC-MS.
Characteristics
The characteristics of this technique are the following:
- instantaneous and easy sampling, suitable for ascertaining concentrations on the order of µg m-3 to mg m-3;
- no pre-treatment of samples is required;
- suitable for ascertaining concentrations for a wide range of substances if the concentrations do not vary strongly (for example in a closed space).
3.4
Canisters in combination with GC-MS analysis
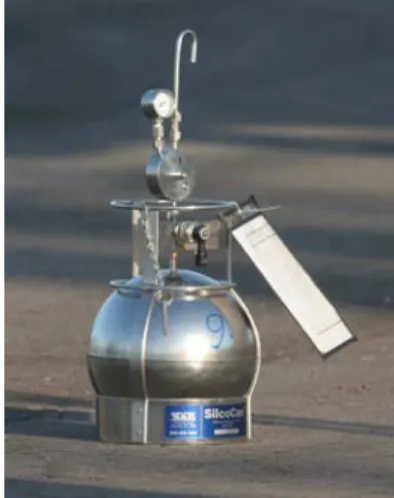
Canisters are metal balls that can be depressurized; the metalon the inside is provided with a non-absorbent coating. By opening a valve on the canister, air is pulled in until the pressure is equalized. A restrictor on the intake tube was used for this experiment which was adjusted so that the sampling lasted about two hours. A nanometer shows whether there is still low pressure in the canister.
If the canister is placed on the ground, the sampling height is about 35 cm.
Analysis
The analysis is conducted in the same way as with a Tedlar bag
Figure 3 A canister Characteristics
The characteristics of this technique are the following:
- time-averaged and easy sampling, suitable for ascertaining concentrations on the order of µg m-3 to mg m-3;
- no pre-treatment of the sample is required.
3.5
Active charcoal tubes in combination with GC-MS
analysis
Figure 4 Active charcoal tube with pump
Sampling with active charcoal tubes was
conducted according to the NIOSH method 2520 with SKC-226-38-02 Petroleum charcoal-set tubes. These tubes are especially suitable for methyl bromide. By using Side-kick pumps, air was pulled through the active charcoal tubes for two hours, initially at a flow rate of
1.000 ml min-1 and later at 50 ml min-1. The relative humidity was higher than 50%, but it was not necessary to place a dryer in front of the samplers.
The characteristics of this technique are the following:
- time-averaged and easy sampling;
- suitable for ascertaining concentrations on the order of µg m-3 to mg m-3.
page 18 of 67 RIVM report 609021041 Processing and analysing the samples
A loaded active charcoal tube is opened, and the contents are emptied entirely into a 10 ml vial. depending on the quantity of charcoal (400 mg or 200 mg) 4 or 2 ml cold dichloromethane is added, respectively, after which the vial is sealed with a crimp cap. After 30 minutes, during which the vial is regularly agitated, a portion of the fluid is transferred to a 2 ml vial; analysis then takes place using GC-MS.
3.6
Sensors
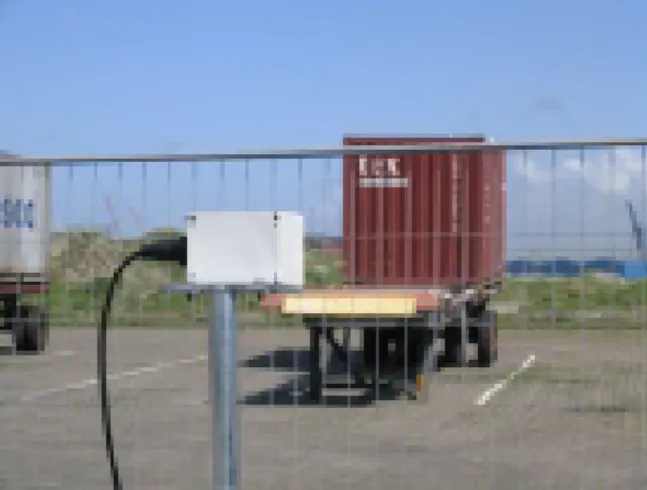
In the present study, the results of the measurements with the above mentioned apparatus are compared with the results of the online monitoring apparatus (hereinafter to be called the ‘OLM unit’). This apparatus was tested by ECT regarding its suitability for measuring high concentrations of fumigants, with an eye towards monitoring the area surrounding fumigated containers.
The measurements were conducted by the supplier.
One of the OLM units used here comprised four different semiconductor sensors.
Figure 5 An OLM unit near containers (photograph: Comon Invent)
These sensors respond – non-specifically – to low concentrations of oxidizing and/or reducing gases. However, by using multiple semiconductor sensors together and a type of ‘fingerprint’ of substances, the concentration of a specific substance can be determined to a certain extent. The OLM units used were ‘characterized’ in this way for methyl bromide.
Characteristics
The characteristics of this measurement method are the following:
- a continuous measurement method with continuous indication of the concentration; - rapid response to concentration changes;
- intended as a monitoring instrument; - sensitive for other substances.
4.
Project approach
4.1
Project approach in brief
The measurement programme was conducted with the aim of acquiring insight into the concentrations that occur during degassing of containers.
The research was conducted with actively fumigated containers, where the fumigation took place in a comparable fashion to export containers in the Netherlands. This study was conducted in a controlled fashion to the extent that the conditions could be influenced. In the study, three containers were fumigated with methyl bromide, three with phosphine and three with sulfuryl fluoride (Vikane) in accordance with the method used in practice. A certified fumigation company conducted these fumigations. During the degassing, concentrations of the fumigants were determined at various distances up to approximately 50 metres downwind. In order to create a worst case situation, we chose to fumigate three containers simultaneously with the same substance; the distance to where the concentrations were detected downwind, would be – under comparable weather conditions – a maximum dispersal distance. A possibly larger dispersal distance would occur only under other weather conditions.
The research with import containers was conducted in the situation in actual practice. During seven weeks, the time-averaged methyl bromide concentrations in a fumigation area 1 at ECT were ascertained, and on various days other measurements were conducted in order to acquire a picture of the dispersal around the containers. The research focused on the concentrations of known fumigants such as methyl bromide, phosphine, sulfuryl fluoride, 1,2-dichloroethane and chloropicrine.
4.2
Experimental design for degassing actively fumigated
containers
Three sets of containers were placed on the terrain of the ECT company, which is located on the Maasvlakte near Rotterdam. These containers were rented by the VROM Inspectorate and were the type of containers normally used. The containers were empty and therefore did not contain any goods. These containers were fumigated with methyl bromide, sulfuryl fluoride and phosphine according to the standard operational method by certified fumigation companies (Holland Fumigation for methyl bromide and phosphine, SGS-Sanitec for sulfuryl fluoride). The fumigations with phosphine took place on 9 and 20 August 2006; the fumigations with methyl bromide and sulfuryl fluoride took place on 16 and 28 August 2006. The intended concentrations for each container concerned 48 g m-3 for methyl bromide and 65 g m-3 for sulfuryl fluoride. In the containers that were fumigated with phosphine, two ‘cords’
1
A marked and fenced-off area where containers with these fumigants are degassed in such a way that people cannot be exposed to high concentrations.
page 20 of 67 RIVM report 609021041
Figure 6 Placement of containers in the experiment; the photograph on the left shows three containers; the photograph on the right shows one group of three opened containers.
were placed; 30 g phosphine was formed from each cord. In a 66 m3 container, this would result in a maximum concentration of 1 g m-3.
On 17 and 30 August 2006, the degassing began. This meant that the degassing began eight days after the fumigation with phosphine, one day after fumigation with methyl bromide and two days after fumigation with sulfuryl fluoride. In the containers that were fumigated with phosphine, air samples were taken on various days in Tedlar bags in order to track the progression of the concentrations in the containers. Preceding the fumigation, measures had been taken so that air samples could be taken from the containers to monitor the phosphine concentrations without having to open the containers.
During the fumigation, various measurement methods (see chapter 3) were used to measure the concentration of the fumigants downwind from the containers. Immediately before the
degassing began, air samples were taken from the containers using the Tedlar bags in order to measure the concentrations in the containers. Because high concentrations were sometimes measured at the back of the containers during the first measurement series on 17 August, we began to suspect that some of the containers were leaking. Therefore, during the second measurement series on 30 August, air samples were taken at the back of the containers before the containers were opened. The sampling was conducted with the Vac-U-tube in Tedlar bags; the analysis was conducted with GC-MS.
During the degassing, the concentrations of the various substances were measured downwind. Samples of methyl bromide were taken with badges, active charcoal tubes, canisters and sensors (OLM units). Samples of phosphine and sulfuryl fluoride were taken with canisters. The sampling height ranged from 40 to 60 cm.
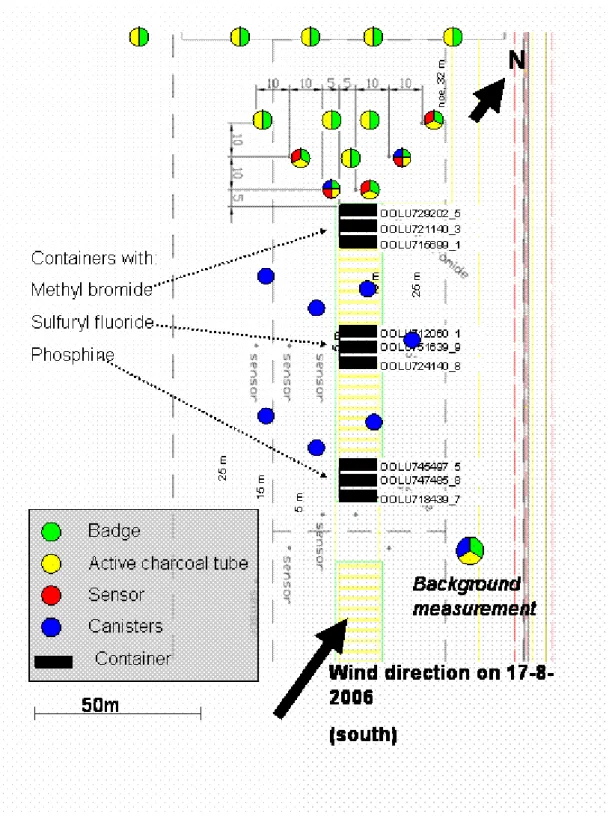
The measurement setup, besides being dependent on the number of available apparatus, was especially dependent on the wind direction. On 17 August, a southwest wind was expected; on 30 August a west wind was expected. The measurement setups are shown schematically in Figure 7 and Figure 8. The measurement setup on 17 August was based on an expected southeast wind. While setting up the apparatus, the measurement strategy was modified in accordance with the south wind that was ascertained at the location. During the experiment, the wind turned out to blow directly from the south.
page 22 of 67 RIVM report 609021041
4.3
Experimental setup for the import containers study
The study of the import containers was carried out under the practical conditions of containers undergoing degassing as these occurred at the time. The study aimed to ascertain the general dispersal distance surrounding the import containers undergoing degassing. The study was conducted with two different measurement strategies.
Firstly, badges (see section 3.2) were placed at various distances from the containers undergoing degassing. The badges continuously sampled the air around the containers for a period of several weeks and thereby provided a picture of the average concentration of methyl bromide during the measurement period. The placement of the badges is shown in Figure 9. The measurements were conducted during two sequential periods of three and four weeks respectively: 7 through 28 September and 28 September through 27 October 2006. The badges were suspended on the fences around the degassing area (at approximately 150 cm above the ground), on tripods (50 cm above the ground) and on concrete blocks (approximately 40 cm above the ground). Funnel-shaped rain caps were suspended above the badges. This did not affect the sampling. During the sampling period, the VROM Inspectorate kept track of which containers were moved and recorded which fumigants had been used in the containers.
Figure 9 Placement of the badges for measuring the concentration of methyl bromide
Secondly, the concentrations of the fumigants were measured inside the fumigation area. This was done twice downwind from containers (with high concentrations of certain substances) which had just been opened and once with containers that had already been open for a few days. This concerned the following measurements:
page 24 of 67 RIVM report 609021041 - measurements around a container, with high concentrations of chloropicrine, undergoing
degassing (19 September 2006);
- measurements around a container, with high concentrations of phosphine, undergoing degassing (30 September 2006). In this 33 m3 container, phosphide was being transported as a mole control agent. The chemical was not adequately packaged, because high
concentrations of phosphine were measured in the container;
- measurements conducted around containers undergoing degassing which had already been open for some time (27 October 2006).
The sampling for chloropicrine on 19 September and phosphine on 30 September was conducted with canisters (the only available time-averaged measurement method for these substances). During the sampling on 27 October, the active charcoal tubes were also used to detect other components. The measurement setups, together with the results, are presented in section 5.2.
5.
Results
5.1
Results of the study of actively fumigated containers
5.1.1 Results of the study on 17 August 2006
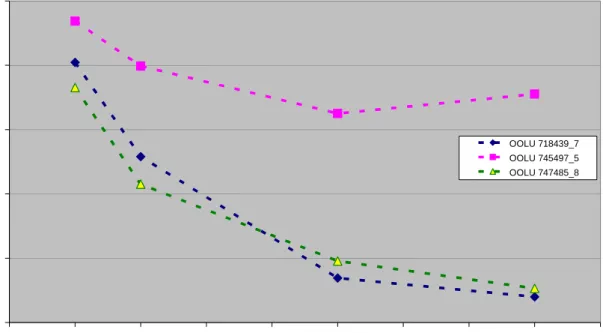
Figure 10 shows the progression of the measured concentrations of phosphine in the three fumigated containers during the period 10 through 17 August. The fumigation had taken place on 9 August 2006.
The measured concentrations in the containers immediately preceding the opening are shown in Table 3. 0 100 200 300 400 500
9-aug 10-aug 11-aug 12-aug 13-aug 14-aug 15-aug 16-aug 17-aug 18-aug
PH 3 mg/ m 3 OOLU 718439_7 OOLU 745497_5 OOLU 747485_8
Figure 10 Progression of the measured concentrations of phosphine (in mg m-3) in the fumigated containers, from the fumigation to the degassing, first series, 8-17 August 2006
page 26 of 67 RIVM report 609021041 Table 3 Measured concentrations in the containers on 17 August 2006 immediately before the containers were opened
Fumigated with Container Concentration (g m-3) Total quantity in the container (66 m3) OOLU729202_5 69 4.6 kg OOLU721140_3 37 2.4 kg Methyl bromide OOLU715699_1 34 2.2 kg OOLU712060_1 28 1.8 kg OOLU751639_9 78 5.1 kg Sulfuryl fluoride OOLU724140_8 49 3.2 kg OOLU745497-5 0.05 3 g OOLU747485-8 0.04 3 g Phosphine OOLU718439-7 0.36 24 g Weather data
The weather conditions were as follows: Wind direction : south
Wind speed : 3 Bft (4 m s-1)
Temperature : 22°C
Precipitation : none
Fractional cloud cover : heavily overcast (6/8 to 8/8). Results of measurements around the containers
The sampling duration was approximately two hours for all measurement methods.
Appendix 1 presents the measurements in table form. The measured concentrations are shown in Figure 11. Only the concentrations above the limit of quantification are shown.
There were three badges on which the concentrations of methyl bromide were measured above the limit of quantification (approximately 0.02 mg m-3). These badges were located on a single line downwind of the containers fumigated with methyl bromide. The measured, two-hour average concentrations ranged from 3 mg m-3 at a distance of approximately 10 m to 1 mg m-3 at a distance of approximately 35 m.
At the same location where a badge measured a methyl bromide concentration of 1.5 mg m-3, the canister measured a concentration of 2.6 mg m-3. These measurements differ by a factor of 1.7.
None of the measurements with the active charcoal tubes showed concentrations of methyl bromide above the limit of quantification (0.02 mg m-3). This led us to suspect that this was due to the sampling method and that an excessively high suction rate was used. The advantage of a high suction rate is that more of a substance can absorb onto the active charcoal, which reduces the limit of quantification. However, methyl bromide is a volatile component that possibly also desorbs. During tests where known concentrations of methyl bromide were used, it indeed turned out that excessively low concentrations were found at the suction rate of 1,000 ml min-1 which was used in the sampling. At a suction rate of 50 ml min-1, the correct concentrations were found. This lower suction rate was used for all other experiments.
Figure 11 Measured concentrations on 17 August 2006, averaging time two hours, concentrations in mg m-3
page 28 of 67 RIVM report 609021041 With the canisters, two locations downwind from the containers fumigated with sulfuryl
fluoride were determined to be above the limit of quantification (approximately 0.02 mg m-3). Immediately behind the containers, a concentration of 20 mg m-3 was measured; at
approximately 10 m from the open doors of the container, a concentration of 0.2 mg m-3 was measured.
No concentrations of phosphine were shown to be above the limit of quantification (about 0.02 mg m-3).
5.1.2 Results of the study on 30 August 2006
Concentrations inside the fumigated containers
The concentrations inside the containers immediately before degassing (opening the doors) are shown in Table 4. For each set of three containers an air sample in a Tedlar bag was taken behind the containers immediately before degassing. This was done because during the first measurement series taken behind the containers that were fumigated with sulfuryl fluoride, high concentrations of this substance were found. These measurements are also shown in Table 4. Table 4 Measured concentrations in and behind the containers (in g m-3 in the containers and
mg m-3 behind the containers) on 30 August 2006 immediately before opening the containers
Fumigated with Container Concentration in the container
(g m-3)
Total quantity in the container (66 m3) Concentration behind the containers (mg m-3) OOLU729202_5 33 2.2 kg OOLU721140_3 3 0.2 kg Methyl bromide OOLU715699_1 59 3.9 kg 0.3 OOLU712060_1 15 1.0 kg OOLU751639_9 36 2.4 kg Sulfuryl fluoride OOLU724140_8 10 0.7 kg 0.4 OOLU745497_5 0.10 7 g OOLU747485_8 0.01 1 g Phosphine OOLU718439_7 0.003 0 g 0 Weather data
The weather conditions were as follows: Wind direction : west
Wind speed : 3 Bft (4 m s-1)
Temperature : 16oC
Precipitation : none
Fractional cloud cover : heavily overcast (6/8 to 8/8).
Results of measurements with badges, active charcoal tubes and canisters
The sampling duration was approximately two hours for all measurement methods. In Appendix 1, all measurement data are presented in table form. Table B.1.3 shows the following:
- the methyl bromide concentrations measured by badges at distances of up to
25 metres are approximately half of the concentrations measured with active charcoal tubes. At the 50 metre distance, the concentrations are comparable;
- the methyl bromide concentrations measured with the canisters are a factor of 4 higher than the concentrations measured with the active charcoal tubes.
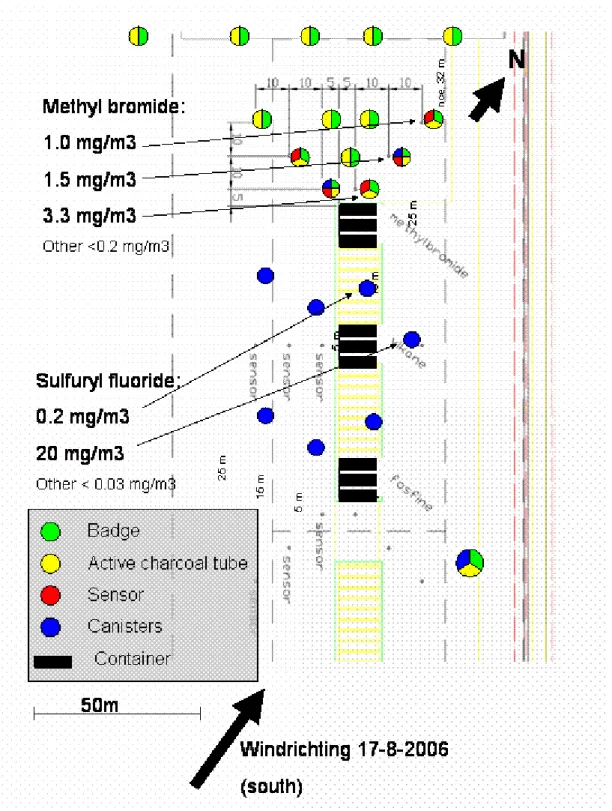
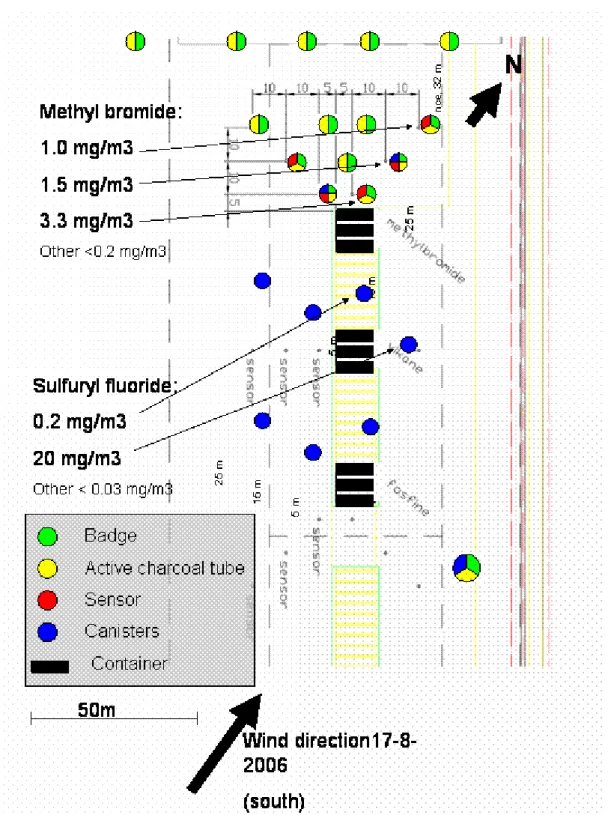
Figure 12 shows a map with the measured methyl bromide concentrations that globally correspond with the measurements made with the active charcoal tubes.
Figure 12 Measured concentrations of methyl bromide (mg m-3) on 30 August 2006, based on the results for the active charcoal tubes, two-hour average concentrations
page 30 of 67 RIVM report 609021041
Based on the concentrations measured with the active charcoal tubes, the following conclusions can be drawn for the two-hour average concentrations:
- up to 15 metres, the concentrations amounted to several mg m-3 of methyl bromide; - at a 50 metre distance, the methyl bromide concentrations were approximately 0.5 mg m-3. Table 5 summarizes the concentrations of sulfuryl fluoride measured with the canisters. The concentrations are on the order of several mg m-3 for two-hour averages. No phosphine concentrations higher than 25 µg m-3 were ascertained.
Table 5 Two-hour average sulfuryl fluoride concentrations, measured with canisters (in mg m-3)
Distance to container (m) Concentrations (mg m-3)
5 10
20 4
30 2
Results of measurements with OLM units
Figure 13 shows the results from one of the OLM units; the results of all units are shown in Appendix 3 (see section 3.6). The four units for which the results are listed were placed at distances of 5, 10, 15 and 20 metres downwind of the containers that were fumigated with methyl bromide. Figure 13 shows the response of the four sensors that comprise an OLM unit. The figure shows the response of the individual sensors during the time period 12:15 hrs to 12:25 hrs. The following can be seen:
- over time, the responses of the four sensors in an OLM unit are comparable;
- the signal increases rapidly beginning at 12:17 hrs (when the containers were opened) and from 12:19 hrs (2 minutes after opening) declines gradually;
- at 12:25 hrs (8 eight minutes after opening the containers) the signal is still about half of the peak value.
Figure 13 Result of a measurement with an OLM unit on 30 August 2006 (from 12:15 to 12:25 hrs)
Table 6 Methyl bromide concentrations as measured by the OLM units between 12:18 and 12:20 hrs (peak concentrations)
Methyl bromide concentration Distance to the container
m mg m-3 ppm 5 800 200 10 140 35 15 100 25 20 28 7
The supplier of the OLM units derived the methyl bromide concentration from the signals between 12:18 and 12:20 hrs (Bootsma, 2006). The results of this derivation are shown in Table 6. Based on these results, a two-hour average concentration from Figure 13 was ascertained by determining the average signal value in a time period, maintaining a linear correlation between signal and concentration as reported in Table 6 and then averaging. In Appendix 3, this procedure is worked out in detail. In this way, a two-hour average
concentration at a 5 metre distance from the container was calculated, which was above 50 mg m-3.
Figure B3.1 in Appendix 3 shows how the four OLM units displayed the same progression, where the peak level declines according to the distance to the container. Figure B3.2 in Appendix 3 shows the following:
- there was a rapid response from the sensors around the time the containers were opened (approximately 12:17 hrs);
- one hour after opening the containers, the signal from the sensors was at 20% of the peak value;
- four hours after opening the containers, the sensor signal returned to the initial value.
5.2
Results with the import containers
5.2.1 Results of the study with badges for methyl bromide
During the periods 7 September -28 September and 28 September-27 October 2006, badges were placed around degassing containers to measure the methyl bromide concentrations. The placement of the badges is shown in Figure 9. The badges were placed around the containers at distances ranging from 5 to 50 metres from the containers.
Table 7 provides a summary of the containers that were located in the fumigation area during the study. The VROM Inspectorate took samples from various containers in Tedlar bags to determine the concentration of the fumigants. Various containers that were not sampled stood in the fumigation area for less than a day. It is plausible that these containers did not contain fumigants in relevant quantities.
page 32 of 67 RIVM report 609021041 Table 7 Summary of degassing import containers located in the fumigation area
Container Date in Date out Number
of days IN
Prefix Number Fumigants (before the degassing
began)
1 31-8-2006 4-9-2006 4 SEAU 867270-4 Not relevant, removed before beginning the test
2 29-8-2006 6-9-2006 8 TRIU 592153-0 Not relevant, removed before beginning the test
3 4-9-2006 7-9-2006 3 UESU 456228-3 Not relevant, removed before beginning the test
4 6-9-2006 7-9-2006 1 CLHU 221301-2 Not relevant, removed before beginning the test
5 22-8-2006 14-9-2006 23 CBHU 176013-9 All components <25 ppm 6 13-9-2006 18-9-2006 5 PONU 049401-7
7 13-9-2006 18-9-2006 5 TGHU 414266-0 8 13-9-2006 18-9-2006 5 PONU 950569-0
9 6-9-2006 20-9-2006 14 TTNU 314298-5 Toluene, ethyl benzene and 1-ethyl-3-methyl benzene 10 18-9-2006 20-9-2006 2 HJCU 802551-7
11 22-9-2006 22-9-2006 0 GATU 123411-0 12 21-9-2006 25-9-2006 4 XXXX 005647-4
13 29-8-2006 29-9-2006 31 UESU 463584-1 Benzene and toluene 14 18-9-2006 3-10-2006 15 TCKU 254402-5 15 18-9-2006 3-10-2006 15 YMLU 497287-4 16 2-10-2006 5-10-2006 3 XINU 119793-4 17 2-10-2006 5-10-2006 3 TGHU 41 0828-5 18 4-10-2006 5-10-2006 1 EMCU 317382-0 19 9-10-2006 9-10-2006 0 KKFU 159514-9 20 9-10-2006 9-10-2006 0 KKFU 140337-5
21 2-10-2006 10-10-2006 8 GSTU 432714-7 No analysis data 22 10-10-2006 14-10-2006 4 TEXU 360046-1
23 26-9-2006 18-10-2006 22 NIOU 217725-4 No analysis data 24 26-9-2006 18-10-2006 22 CCLU 420627-0 No analysis data 25 19-10-2006 20-10-2006 1 CBHU 182163-5
Container Date in Date out Number of days IN
Prefix Number Fumigants (before the degassing
began)
27 24-10-2006 26-10-2006 2 PONU 760679-9 28 25-10-2006 26-10-2006 1 MSKU 283745-5 29 25-10-2006 26-10-2006 1 KNLU 431880-8
30 25-10-2006 27-10-2006 2 OBOU 602379-3 All components <25 ppm 31 14-9-2006 31-10-2006 47 GLDU 402540-9 Chloromethane (50 mg m-3),
methyl bromide (656 mg m-3), tetrachloromethane (0.4 mg m-3), 1,2-dibromoethane (2 mg m-3)
The summary shows that only a single container which contained methyl bromide (GLDU 402540-9) was placed in the fumigation area during this period. This container with methyl bromide was placed in the fumigation area on a day with an east-northeast wind. With this wind direction, only a single badge was located downwind from this container at a distance of
approximately 10 metres.
Figure 14 provides a summary of the 24-hour average wind direction during this period; Appendix 5 contains a more detailed summary of the weather data. The wind direction varied normally during the study. Consequently, the badges periodically stood downwind of degassing containers. 0 2 4 6 8 10 12 N NO O ZO Z ZW W NW Eerste meetperiode Tweede meetperiode
Figure 14 Number of days with a 24-hour average wind direction from the reported compass points during the first measurement period (7 – 28 September) and the second measurement period (29 September – 27 October)
Following analysis of the badges, no badges were found with methyl bromide concentrations above the limit of quantification (0.001 mg m-3). Even with the badge that was located
downwind from the container with methyl bromide (GLDU 402540-9), no detectable quantities of methyl bromide could be shown.
First period Second period
page 34 of 67 RIVM report 609021041
5.2.2 Results of the measurements with import containers on
19 September 2006
On 19 September 2006, the concentrations of methyl bromide and chloropicrine were measured near two import containers in which these substances were used (sampling with Tedlar bags). The concentrations inside the containers are shown in Table 8.
Table 8 Measured fumigants inside the import containers on 19 September 2006
Concentrations in the containers (mg m-3) Total quantities in the containers (g)
methyl bromide chloropicrine methyl bromide chloropicrine
Container 1 (66 m3) 54 3.6 Container 2 (33 m3) 320 1.5 11 0.05
Weather data during the measurements: Wind speed : 3 Bft (4 m/s) Wind direction : SW (225 degrees)
Temperature : 18oC
Precipitation : none
Cloud cover : partly cloudy (4/8)
Figure 15 lists the measured concentrations around the containers. The two-hour average methyl bromide concentrations ranged from 0.01 to 0.04 mg m-3 at a distance of up to 25 m. For chloropicrine, at 25 metres a concentration of 0.1 mg m-3 was found; at other measuring points, no concentrations of chloropicrine higher than the limit of quantification were ascertained.
Chloropicrine concentrations (mg m-3) Methyl bromide concentrations (mg m-3) Figure 15 Two-hour average concentrations of chloropicrine and methyl bromide
5.2.3
Results of the measurements with import containers on
30 September 2006
On 30 September 2006, the phosphine concentrations around an open import container were measured. This import container (33 m3) held 56 g phosphine (1.7 g m-3). This large quantity was the result of the product being carried in the container (phosphide), which had begun to leak, resulting in the formation of phosphine. This container was therefore not a fumigated container, but one with a leaking product. The concentration measurements were conducted while repackaging the product in another container. The measurements began immediately before the container was opened.
Weather data during the measurements: Wind speed : 3 Bft (4 m/s)
Wind direction : SSW (200 degrees)
Temperature : 20 oC
Precipitation : none
Cloud cover : partly cloudy (3/8)
Figure 16 lists the two-hour average phosphine concentrations. Within a radius of 5 metres, a concentration of more than 2 mg m-3 was measured. Up to a distance of 15 to 20 metres, the concentrations amounted to approximately 0.1 mg m-3.
Figure 16 Two-hour average phosphine concentrations (mg m-3) downwind of an open import container on 30 September 2006
page 36 of 67 RIVM report 609021041
5.2.4 Results of the measurements with import containers on
27 October 2006
On 27 October 2006, the concentration of various fumigants was measured around containers undergoing degassing in the fumigation area. The containers had been opened for some time before the measurements began.
Weather data:
Wind speed : 3 Bft (4 m/s)
Wind direction : WSW (245 degrees)
Temperature : 12 oC
Precipitation : none
Cloud cover : partly cloudy (4/8)
Table 9 provides a summary of the containers that were located in the fumigation area at that time, with the corresponding fumigant.
Figure 17 shows the location of the containers and the measurement apparatus. Canisters and active charcoal tubes were used for the measurements. The distance to the containers was 5 to 25 metres. The measurement duration was two hours. None of the measurement apparatus indicated concentrations for methyl bromide, phosphine, 1,2-dichloroethane and chloropicrine that were above the limit of quantification (approximately 0.02 mg m-3).
Table 9 Containers in the fumigation area and the fumigants encountered
Date in Date out Prefix Number Fumigants encountered
CRXU457593-2 None TRLU315343-8 None HJCU769522-1 None PONU815353-1 Phosphine TTNU308214-5 None
14-9-2006 31-10-2006 GLDU 402540-9 Chloromethane, methyl bromide, tetrachloromethane,
1,2-dibromoethane
6.
Interpretation and discussion
6.1
Progression of the concentrations of fumigants with the
actively fumigated containers
With the containers that were actively fumigated, the fumigation procedures were considered to be successful. On 17 August (the first experiment), the average concentrations were 97% of the fumigation concentration for methyl bromide and 79% for sulfuryl fluoride. On 30 August (the second experiment), these percentages were lower: 66% and 31%, respectively. However, a normal progression of the fumigation concentration during the 24-hour waiting period is not known. There are various possible explanations for the difference between the intended and realized concentrations.
- Fumigation did not take place precisely enough, so that there was a large fluctuation around the intended fumigation concentration. This was also shown from the fact that one of the containers fumigated with methyl bromide had a nearly 50% higher concentration - even after standing for one full day - than the intended fumigation concentration;
- Containers can leak, as shown in previous experiments as well as in the present study. Regarding leakage, during the present experiment we noted the following: behind one of the containers that was fumigated with sulfuryl fluoride, concentrations of several mg m-3 were ascertained, even though the containers were still filled with gas and were closed.
Most of the fumigations with phosphine were also successful. When the containers were opened, the phosphine concentrations varied from several mg m-3 to several hundred mg m-3. With the first fumigation, during the days when the containers were filled with gas, air samples were taken from the container and the phosphine concentration was analyzed. The
concentration one day after fumigation was the highest, amounting to 500 mg m-3, or 50% of the maximum concentration to be achieved.
6.2
Comparison of the measurement methods
In the present study, various measurement methods were used in order to compare the results of methods with each other. In the following section, various findings are discussed.
During the first experiment on 17 August, no methyl bromide concentrations were found with the active charcoal tubes at locations where such concentrations were expected and where concentrations ranging far above the limit of quantification were found with the other methods. An investigation into this problem indicated that the absence of methyl bromide in the charcoal tubes was the result of the suction rate that was used. This suction rate was too high, causing the volatile methyl bromide to be insufficiently absorbed onto the active charcoal. After reducing the suction rate, good results were achieved in both the laboratory and in the field.
During the experiment on 17 August (duration of measurement: 2 hours) there were two measurement points at which both badges and canisters were located. At one of these
page 40 of 67 RIVM report 609021041 (the wind direction turned out to be different than expected). At the other measurement point, the concentration on the badge was approximately 60% of the canister concentration (the difference was less than a factor of 2). This is an acceptable result.
During the experiment on 30 August (duration of measurement: 2 hours) various measurements were conducted with badges in duplicate. The results of these measurements were very good: the duplicate measurements differed by no more than 0.1 mg m-3. The agreement with the results of the active charcoal tubes was acceptable. However, the difference with the results of the canisters was large: the measurements of the active charcoal tube and the canister differed by a factor of 4, and therefore from badge to canister there was a difference of a factor of 8. The deviation in this case appeared to be systematic. Methyl bromide is a heavy gas and therefore a higher concentration is expected closer to the ground than higher above the ground. The
difference in sampling height - as with the experiment on 17 August - was less than 30 cm. Possibly there was an effect due to the humidity, for which the active charcoal tubes and the badges are susceptible, but which did not affect the sampling of the canisters. No other reasons could be found to explain the differences.
During the measurements in the vicinity of the import containers, badges were suspended for several weeks around the degassing containers. None of the badges showed concentrations above the limit of quantification. This can be largely explained by the fact that during the period of seven weeks, only a single container with a high methyl bromide concentration was placed in the fumigation area. A badge was located at 10 metres downwind from this container. No methyl bromide was found in this badge either. An explanation could be that this badge was not positioned in line with the container at the time when the largest quantities of methyl
bromide were released. This could not be determined; the available data did not contain sufficient details.
The available measurements for the OLM units indicate the following:
- immediately after opening the containers, there was a rapid change in the sensor output, which can be related to a change in the methyl bromide concentration;
- based on the estimated concentration for the peak and the graph for the progression of the concentration on 30 August (Figure B3.2), a two-hour average methyl bromide
concentration for OLM unit 208 was estimated, which is approximately a factor of 25 higher than the concentration measured by the badges and canister (see Appendix 3). The sensors appeared to quickly track the changes in concentration. The absolute measured concentration levels deviated strongly from the results with the other methods. The RIVM did not investigate whether the lower measurement range was sufficient to warn for exceedances of relevant norms, and did not look at the response to other components.
6.3
Measured concentrations in relation to distance and
norms
6.3.1 Measurements on 17 August 2006
During the experiment on 17 August, the wind direction turned out to behave differently than expected. Therefore, at the experimental setup around the containers fumigated with methyl bromide, concentrations above the limit of quantification were found only at the outermost measurement points. The measured concentrations were in the order of mg m-3. The nearest measurement points to these were approximately 10 m away. This indicates that a narrow plume formed which passed over several measurement points, and passed alongside the other points. The measurement duration was two hours, which means that with a constant emission and a usual variation in wind direction, a portion of the released methyl bromide should also have passed over other measurement points. Our conclusion is that the largest quantity must have been released in a short time period. This conclusion is supported by the measurement data from the OLM units in the experiment on 30 August, which indicated the release of a large quantity from the containers within half an hour after they were opened.
For methyl bromide, the ascertained concentrations could be compared with the public health norm for the maximum hourly average. With the data from the OLM unit – for the experiment on 30 August – it was concluded that the two-hour average concentration was determined for 90% by the concentrations during the first hour (see Appendix 3). This means that the average concentration during the first hour was 1.8 times the two-hour average concentrations. At a distance of approximately 10 metres, this means that there was a one-hour average
concentration of 6 mg m-3 and at a 30 metre distance, 2 mg m-3. Related to the norm for the maximum hourly average concentrations of 10 mg m-3, this means that these were high concentrations (60% and 20% of the norm, respectively), but they did not exceed the norm. In comparison with the MAC value, the two-hour average concentrations can be divided by four, because the MAC value applies to eight-hour averages. This means that at a 10 metre distance, the concentration was near the MAC value (1 mg m-3) and at a 30 metre distance it was 25% of the MAC value, without taking account of the small contribution of the remaining six hours.
For sulfuryl fluoride, no public health norms are available. The concentration of sulfuryl fluoride at 10 metres downwind from the container amounted to 0.2 mg m-3 and was a factor of 10 below the MAC value (without converting the two-hour average concentration into an eight-hour average concentration). The concentration immediately behind the container (20 mg m-3) was comparable to the MAC value, without taking the duration of exposure into consideration. This high concentration was attributed to a leak in one or more of the containers. If there was a leak, then the ascertained concentration around the container could occur for as long as the container was undergoing fumigation.
The measured phosphine concentrations near the actively fumigated containers were below the norms. The limit of quantification of the measurement method is approximately equal to the public health norm for the 24-hour limit value. The container with leaking phosphide, around which measurements were conducted on 30 September, contained more phosphine than the actively fumigated containers. Around this container, concentrations near the limit value were measured at distances up to 20 metres (see section 6.3.4)
page 42 of 67 RIVM report 609021041
The dilution of the quantity of methyl bromide in the three containers (9.2 kg) at a 10 metre distance downwind amounted to 0.4x10⁻⁶ (see note 2). For sulfuryl fluoride (10,2 kg) the dilution amounted to 0.02x10⁻⁶ and for phosphine more than 0.7x10⁻⁶ (could not be determined with precision).
6.3.2 Measurements on 30 August 2006
During the second experiment, more measurement data became available because the wind direction behaved as predicted. The dispersal around the containers fumigated with methyl bromide was comparable with the results of the experiment on 17 August: based on the results for the active charcoal tubes, concentrations around 4 mg m-3 were found at a distance of approximately 10 m and concentrations around 1 mg m-3 were found at a 30 metre distance. The difficulty with this interpretation is that the results for the badges were lower (within acceptable limits) and for the canisters they were higher (by a factor of 4).
The measurements with the OLM units indicate that the degassing took place during a short period: immediately after opening, there was a large peak of several hundred mg m-3 (to a distance of 15 metres). After one hour, slightly higher concentrations were still being observed, and after four hours the sensor signal returned to the baseline. Averaged over time, the OLM units indicated higher methyl bromide concentrations than the other measurement methods. The downwind concentrations of sulfuryl fluoride varied from approximately 10 mg m-3 at a 5 metre distance to 2 mg m-3 at a 30 metre distance. Also on 30 August, concentrations above 0 were measured behind the closed containers. However, the concentrations were lower than those measured on 17 August (0.4 compared to 20 mg m-3).
Once again, no phosphine concentrations were measured, due to the low quantity in the containers.
The dilution of the quantity of methyl bromide in the three containers (6.3 kg) at a 10 metre distance downwind amounted to 0.6x10⁻⁶ (a concentration of approximately 4 mg m-3). For sulfuryl fluoride (4 kg) the dilution amounted to 2.5x10⁻⁶ and for phosphine more than 2.5x10⁻⁶ (could not be determined with precision).
6.3.3 Measurements with badges around import containers
The measurements with badges of methyl bromide concentrations around the import containers did not provide any usable results. During the seven week period of the study, there was only one container with high methyl bromide concentrations that was placed in the fumigation area. When this container was opened, only a single badge was located more or less downwind. This badge was located at a 10 metre distance. Considering the other experiments, this badge should have shown methyl bromide if it was downwind from the container. However, no methyl bromide was shown. An explanation for this could be that during this degassing, large
quantities of methyl bromide were released during a short time and passed alongside the badge.
2