with use levels provided by industry.
A pilot study
RIVM report 320026002/2011
D. Wapperom | G. van Donkersgoed |
N. Koopman | E.M. Niekerk |
C.T.M. van Rossum | J.D. van Klaveren |
M.I. Bakker
National Insitute for Public Health and the Environment
Exposure assessment of food additives
with use levels provided by industry
A pilot studyReport 320026002/2011
Colophon
© RIVM 2011
Parts of this publication may be reproduced, provided acknowledgement is given to the 'National Institute for Public Health and the Environment', along with the title and year of publication.
exposure assessment, colours, use levels, food, E120, E133
D. Wapperom
G. van Donkersgoed
N. Koopman
E.M. Niekerk
C.T.M. van Rossum
J.D. van Klaveren
M.I. Bakker
Contact:
M.I. Bakker
RIVM-SIR
martine.bakker@rivm.nl
This investigation has been performed by order and for the account of Ministry of Health, Welfare and Sports, within the framework of project V320026 (Beleidsadvisering
Abstract
Exposure assessment of food additives with use levels provided by industry
A pilot study
The exposure levels to food colourings can be assessed more accurately by using data forthcoming from the food industry. This is the conclusion made by the RIVM from a pilot study in which the dietary intake of two food colourings was estimated using the used levels as provided by manufacturers. The reason for initiating this study was the frequent overestimation of exposure to additives in food. Previously, maximum permitted levels (MPLs) were used in the assessment, but these are often higher than the actual levels used. In addition, it was assumed that the amounts of food colouring used covered an entire food category (e.g. all soups) instead of one specific product (e.g. tomato soup). In the present study, data on specific products were used. These data were subsequently linked to the consumption of foods containing the food colouring. Food consumption information was derived from the Dutch National Food Consumption Survey (DNFCS)-Young Children 2005/2006. It is expected that this new assessment method will result in lower and more realistic exposure estimates.
This pilot study was carried out on the initiative of the Federation of the Dutch Food and Grocery Industry (FNLI) and the Dutch Ministry of Health, Welfare and Sport (VWS). The industry reported used levels of the food colourings E120 (Carmine red) and E133 (Brilliant blue). The reported data were considered suitable for the assessment of exposure levels provided that they were sufficiently representative for the foods consumed in the
Netherlands. Furthermore, the possibility of communicating with food manufacturers is a prerequisite for success as questions on the details of the levels used are likely to arise. The monitoring system could also be used to assess levels of other groups of additives and can be adapted for use in other European Member States.
Rapport in het kort
Blootstellingberekeningen van additieven met behulp van gebruikswaarden verkregen uit de industrie
Een pilotstudy
Door gebruik te maken van door de voedingsindustrie aangeleverde gegevens kan de blootstelling aan kleurstoffen nauwkeuriger worden geschat. Het RIVM concludeert dit na een pilotstudy waarin de blootstelling van Nederlandse kinderen aan twee kleurstoffen geschat wordt met behulp van door fabrikanten opgegeven gebruikte hoeveelheden in voedingsproducten. De aanleiding voor deze studie was dat blootstelling aan additieven vaak wordt overschat. Voorheen werden voor de schatting van inname van additieven vaak de maximaal toegestane hoeveelheden voor een product gebruikt, die meestal hoger zijn dan de door de fabrikanten gebruikte hoeveelheden. Daarnaast was vaak een
uitgangspunt dat deze hoeveelheden voor de gehele voedselcategorie (zoals alle soepen) gelden, in plaats van voor bepaalde typen producten (zoals tomatensoep). In het huidige onderzoek zijn de specifieke gegevens van de producttypen gebruikt. De nieuwe data van de hoeveelheden kleurstoffen zijn vervolgens gekoppeld aan de mate waarin mensen kleurstofbevattende producten consumeren. Deze laatste gegevens zijn ontleend aan de consumptiedata uit de Voedselconsumptiepeiling onder jonge kinderen (2005/2006). Met deze methode worden de blootstellingschattingen naar verwachting lager en realistischer.
Dit onderzoek is in samenwerking met de industrie uitgevoerd op initiatief van de Federatie Nederlandse Levensmiddelen Industrie (FNLI) en het ministerie van Volksgezondheid, Welzijn en Sport (VWS). Hiervoor heeft de industrie data aangeleverd van het gebruik van de kleurstoffen E120 (karmijnrood) en E133 (briljantblauw) in voedselproducten. Deze data blijken geschikt te zijn om de blootstelling te monitoren, op voorwaarde dat ze de in Nederland veel geconsumeerde voedselproducten goed vertegenwoordigen. Daarnaast is een goede communicatie tussen het RIVM en de industrie belangrijk om eventuele onduidelijkheden in de verkregen data op te helderen. De methode lijkt bruikbaar om uiteenlopende additieven te kunnen monitoren en kan in principe door alle Europese lidstaten worden gebruikt.
Contents
Summary—6 1 Introduction—7 2 Method—8 2.1 Introduction—8 2.2 Selection of additives—8 2.3 Food consumption data—8 2.4 Use levels—82.5 Methods for estimating exposure—10 2.6 Linking of concentrations to foods—11
3 Results—16
3.1 Response—16
3.2 Use levels for intake calculations—16 3.3 Exposure estimates—20
4 Discussion—23
4.1 Evaluation of pilot study—23
4.2 Towards a new monitoring system—26
5 Conclusions and recommendations—30
References—31
Appendix 1. Template for actual use levels, to be completed by members of FNLI—32
Appendix 2. Adjustments made to the provided use levels—33
Appendix 3. Food groups as used in the EFSA ANS panel for the exposure estimation of food colours—34
Summary
Exposure assessment of food additives with use levels provided by industry
A pilot study
A method was tested for the monitoring of the dietary exposure to food additives in the Netherlands, using use levels provided by the food industry. This pilot study was carried out on an initiative of the Federation of Dutch Food and Grocery Industry (FNLI) and the Dutch Ministry of Health, Welfare and Sports (VWS). Motive was the overestimation of additives in present exposure estimates. In this pilot study members of the Federation of Dutch Food and Grocery Industry were requested to provide use levels of three food colours. Obtained use values of E120 (Carmine) and E133 (Brilliant Blue) were linked to the consumption data of the Dutch National Food Consumption Survey Young Children (2005/2006). Exposure estimates of these two food colours were calculated with two methods employing different levels of aggregation of food categories and using the obtained use levels, Maximum Permitted Levels (MPLs) or a combination of both. The disaggregation of food categories and the use of use levels instead of MPLs caused a major decrease in the exposure estimates of E120 and E133, respectively.
The delivered data appeared suitable for exposure assessment provided that they are sufficiently representative for the foods consumed in the Netherlands. The
representativeness of the data should be confirmed before starting the assessment. Market share data may be used for this purpose.
To reduce the uncertainties in the dataset the clarity of the template to be completed by the data providers should be improved. For example, it should be emphasized that the collection of zeroes is important. Furthermore, the possibility to communicate with the manufacturers is a prerequisite for a successful method as questions about the provided use levels are likely to arise.
The monitoring system could also be used for other groups of substances than food colours. Nevertheless, the linking of concentration data to consumption data (including the level of detail needed) for these other groups should be investigated in case studies. A tiered approach is proposed, in which the aggregation level of the food groups and the use levels are introduced into the different tiers. It is recommended that international
developments be closely followed to possibly employ newly developed methods in the proposed tiered approach.
1
Introduction
Article 27 of the European Regulation on additives (1333/2008) states that ‗Member States shall maintain systems to monitor the consumption and use of food additives on a risk-based approach and report their findings with appropriate frequency to the Commission and the Authority‘. On an initiative of the Federation of Dutch Food and Grocery Industry (FNLI) and the Dutch Ministry of Health, Welfare and Sports (VWS) the RIVM was
requested to develop and test a system for the monitoring of the dietary exposure to food additives in the Netherlands according to this regulation, using use levels provided by the industry.
Some basic principles for the monitoring system are:
The burden on the business community and other parties should be as low as possible. The system should be risk-driven. This means that exposure assessments should not be made for all additives, but only for those which may pose a health risk.
The system should give a realistic estimate of the usual intake of additives. This will be done by employing use levels of additives when available, instead of maximum
permitted levels, and by using disaggregated food categories.
The system needs to be suitable for application in the different Member States. This will likely increase the comparability of the results and the acceptance of the Commission and EFSA.
The present document only addresses food additives, but the methodology may also be applied to other substances (e.g. enzymes and flavourings, addressed in Directive 1332 and 1334, respectively).
This report describes a pilot study to test this monitoring system. In this pilot study, the industrial community (i.e. members of the FNLI) were asked to report their use levels of three selected food colours. With these data the RIVM estimated the dietary exposure of the Dutch population to these colours. During the project, the progress and results of the study were discussed within a working group consisting of members of FNLI, VWS, the Dutch Food and Product Safety Authority (NVWA) and the RIVM.
The aim of the pilot study is to propose a monitoring system based on use levels. Relevant questions to be answered are:
Are the delivered data suitable for exposure calculations?
Are the provided use levels sufficiently representative for the consumed foods?
Can foods/food categories be linked in a generic manner or is a case-by-case approach needed?
2
Method
2.1 Introduction
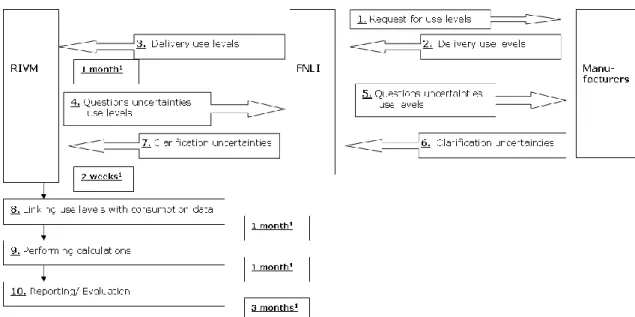
The procedure followed in the pilot study was as follows:
1. Selection of additives for monitoring by The Netherlands Nutrition Centre Foundation, the Ministry of VWS, FNLI and RIVM.
2. Request for use levels to FNLI members by FNLI in a format developed by the RIVM. 3. Delivery of concentration values by manufacturers to FNLI, and via FNLI to the Centre
of Substances and Integrated Risk Assesment (SIR) at the RIVM. 4. Linking of use levels and food consumption data by RIVM-SIR.
5. Estimation of exposure to the food colours with the MCRA-Observed Individual Means (OIM) method and comparison of the results with the currently used methods at EFSA‘s ANS Panel by RIVM-SIR1.
The process is described in figure 1 and will be explained in more detail in the different sections below.
2.2 Selection of additives
The selection of the additives was not based on the eventual risk, but on their different use pattern. The following three were selected with a high, middle and low use, respectively: 1. E120 Carmine red;
2. E133 Brilliant blue; 3. E180 Litholrubine BK.
2.3 Food consumption data
In this report the food consumption data of Dutch National Food Consumption Survey (DNFCS)-Young Children 2005/2006 were used, which contains data of 1279 children in the age of 2 to 6 years. This consumption survey was authorized by VWS and the RIVM. Parents (or caretakers) of respondents were selected from representative consumer panels. Survey data were collected by means of a written general questionnaire and subsequently through two food records. Dieticians entered the data from the diaries into the EPIC-Soft computer program. For more details, see the report on this survey (Ocké et al., 2008), the website www.rivm.nl/vcp/en or www.voedselconsumptiepeiling.nl.
2.4 Use levels
Use levels were retrieved at the manufacturers by the FNLI using a template made by the RIVM (see Appendix 1). This template was sent to all FNLI members who produce food products which could contain one of the three food colours.
The units in which the concentration values should be reported were specified in the template (mg/100 gram product). Manufacturers were asked to select the food category from a drill down menu in the template which was an adjusted version of the classification in Annex II to European Directive 1333/2008. In addition the manufacturers were
1RIVM-SIR is certified under the quality management system ISO 9001:2008. This quality system
requested to describe the product as accurate as possible, for example by reporting the name as used in the Commodities Act.
A mean concentration value for each product group was calculated from the provided use levels (not weighed for market shares or consumed amounts of the products). Sometimes data of the same product were found more than once in the dataset. Then the
concentration value of one of these products was used in de calculation. When the values of these products were not similar, the average concentration value was used.
2.5 Methods for estimating exposure
Two methods were used to estimate the exposure: a deterministic method used by EFSA‘s ANS Panel (referred to as ANS method) and the OIM method provided at the Monte Carlo Risk Assessment platform (MCRA-OIM method).
The ANS method, used for the exposure assessment of food colours in the ANS Panel until mid-2011, consists of the use of the data collected and categorized in the EXPOCHI2 project (Huybrechts et al., 2010). In the EXPOCHI project foods have been categorized into categories specifically for the exposure estimation of food colours (see Appendix 3). For each category the mean and 95th percentile of the consumption is given. For the Dutch
children the data of the National Food Consumption Survey Young Children were summarized in this way.
In the stepwise approach used by the ANS Panel the mean exposure for the total
population is estimated by summing the mean intakes from the different food categories, calculated by multiplying the mean food consumption by the MPL (Tier 2) or maximum reported use level (Tier 3) of the food colour (EC, 1997). The total high level exposure is calculated by adding up the 95th percentile exposure of the highest contributing category
and the mean estimated exposure of the other categories.
The MCRA-OIM method used version 7.0 of MCRA (de Boer and van der Voet, 2011). In short, daily consumption patterns of the children (e.g. 2 days × 1,279 Dutch children aged 2 to 6 years = 2,558 measurements) were multiplied with the mean food colour
concentration per food group, and summed over food groups consumed per day per individual. In this way, the whole diet was addressed when assessing the exposure to food colours. The estimated exposures were adjusted for the individuals body weight. The usual intake, i.e. the corrected intake distribution from which the within-individual variation is removed was not calculated, as the intake distributions of the food colours could not be transformed to a normal distribution with the BBN module in MCRA3.
For both methods four scenarios were run:
1. using the Maximum Permitted Levels (scenario 1);
2. using the maximum reported use levels, completed with MPLs (scenario 2); 3. using the mean reported use levels, completed with MPLs (scenario 3); 4. using the mean reported use levels, without MPLs (scenario 4).
These four scenarios progress from conservative to less conservative/more realistic, and can be interpreted as ‗tiers‘. In a tiered approach, often used in exposure assessment, with each increasing tier the calculations progresses from relatively fast screening methods to more complex time-intensive calculations and from conservative to less conservative methods. An assessment starts at the lowest tier; the estimated exposure at this tier is
2 In the EU project EXPOCHI (Dietary Exposure Assessments for Children in Europe) a large number of
national/regional food consumption databases for children were collected. The data were put into a template to estimate exposure of food colours by the ANS Panel.
3 Usually, for substances exerting a chronic toxic effect, the usual intake is calculated: For long-term
exposure the within-person variation (the variation between the exposure on the two days of one individual) should be subtracted from the total variation in the calculated exposures. The within-person is of no relevance when estimating the long-term exposure, as, in the long run the variation in exposure between different days of one individual will level out. To this aim the betabinomial normal model (BBN) can be used, but only in case that the transformed intake distribution is a normal distribution.
compared to the Acceptable Daily Intake (ADI). If the ADI is not exceeded, the exposure assessment stops, whereas if the ADI is exceeded, the calculation is performed at a higher tier.
2.6 Linking of concentrations to foods
2.6.1 Concentration data
Before the concentration values could be used in these analyses, some adjustments had to be made, for example because concentrations referred to the decorations and not to the total product or some questionable high values were provided (described in Appendix 2).
2.6.2 ANS method
The food categories defined in EXPOCHI were assigned a positive value when the food colour is permitted in the product according to Directive 94/36/EC. In the EXPOCHI project (Huybrechts et al., in press) consumption data are reported on group level and no detailed information about the consumed products are available. Depending on the scenario the MPLs, the maximum or mean reported use levels (whether or not completed by MPLs) were assigned to the food categories. Food groups and the corresponding MPLs and use levels are listed in Table 1 and 2.
2.6.3 MCRA-OIM method
The MCRA-OIM method uses the detailed DNFCS consumption data. These did not exactly match the provided use levels. Since a very large amount of different foods are consumed, it was not expected that use levels of all these products were collected. Moreover, the consumption data were collected in 2005 and 2006, while the provided use levels were from a recent date. In the meantime the market has changed: a number of products in the use levels set were not available in the time the consumption data were collected.
For this reason the linking process between the consumption and use levels was started at group level. The product groups were based on the same food groups as in the ANS method.
E120
The categorization of the use levels was based on the ANS (EXPOCHI) food groups. These food groups are similar to the food groups of directive 94/36/EC. Some extra food groups were created because some use levels or consumed products were difficult to categorize in the ANS groups, these groups were: ‗dessert sauces‘, ‗sweet sandwich fillings‘, ‗filet americain‘ and ‗soy products‘. In addition two extreme high concentration values for Tandoori Marinade/Melange were reported. Since the high concentration value will increase the mean value of the food group sauces and seasonings extremely, an extra category was created to link the product directly to the consumption data.
The food groups used and the corresponding MPLs and use levels are listed in Table 1 and 2.
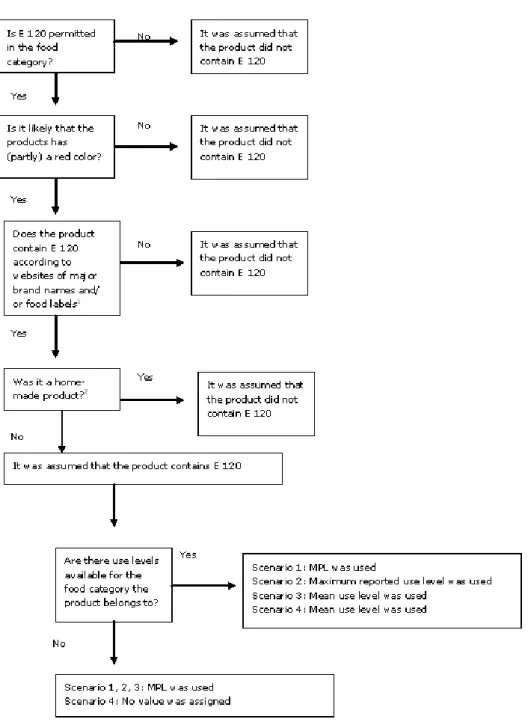
The food consumption data were categorized in the same food groups as the use levels by a nutritionist following the flow-scheme presented in Figure 2.
Food groups which may contain E120 were examined further. In these groups many foods will still be present which do not contain E120. For example food colours are categorized in the food group ‗sauces and seasonings‘. However, based on its colour it is not likely that
white cheese sauce contains E120. For each consumed product it was assessed whether it was likely that it contained E120; this was the case when the food (probably) had a red colour.
The data on consumed products were not collected with the aim to gather important characteristics for exposure assessment of food colours. For this reason sometimes important information was lacking. For example it was expected that tomato soup contained E120. However, it was not possible to distinct tomato soup of other kind of vegetable soups, since they were both reported as ‗soup with vegetables‘.
The consumed products were described with a food name and sometime a brand name. For some food groups additional information was available from the DNFCS regarding the taste or preparation methods. This information was to decide whether the product could have a relevant colour: for the food groups ‗dairy products‘, ‗breakfast cereals‘, ‗edible ice‘ and ‗fine bakery‘ wares information was available about the taste. When the taste of the product was described as (dried) fruit, jam or as unknown it was possible that the product had a red colour and it was assumed that it contained E120.
When foods (possibly) contain food colours according to our above-described criteria are frequently consumed, the contribution of these foods to the total exposure may be high. Therefore it can be useful to collect more information about the occurrence of food colours in these products. In this pilot study this was, for example the case for lemonades made from concentrates. Websites of major brand names and several food labels were consulted and none of these indicated use of food colours in concentrates for lemonades. Therefore it was assumed that lemonades were free of E120 and E133.
Furthermore it was assumed that home-made soups did not contain E120.
In general, when there was any doubt whether a product did or did not contain a certain food colour, the product was linked to a positive value.
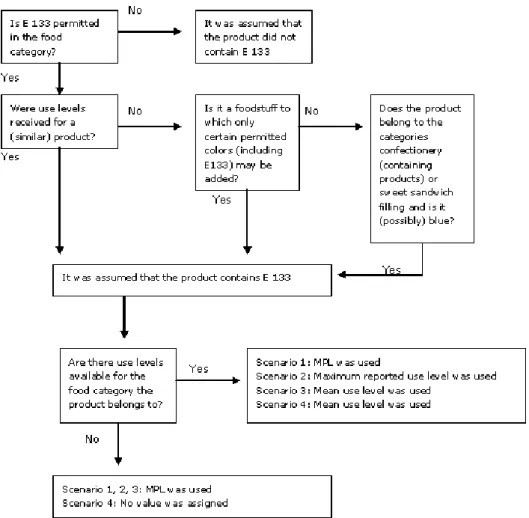
E133
As E133 occurs in less products than E120, a different approach was used for this food colour (see Figure 3). If use levels were received for a product, these were linked to similar products which could be blue (sports drinks and edible ices). According to Directive
94/36/EC in some foodstuffs only certain permitted colours may be added. In canned processed mushy and garden peas one of the permitted colours is E133, therefore it was assumed that all consumed canned mushy and garden peas contain E133. Since it was expected that the categories ‗sweet sandwich fillings‘ and ‗confectionery‘ contain blue products, these categories were examined. All products in these categories which were (possibly) blue were assumed to contain E133.
1 Time is an indication between beginning and end of the process, not the hours of work.
Figure 2 Flow-scheme used for the linking of E120 use levels to consumed foods in the DNFCS-Young Children
Figure 3 Flow-scheme for the linking of E133 use levels to foods consumed in the DNFCS-Young Children
3
Results
3.1 Response
In total 37 companies responded to the request for data. This is about 40% of the FNLI members which were asked to deliver data. Of these companies 32 delivered data of E120, 2 of E133. For E180 no use levels were provided. 5 companies stated to use none of the three food colours.
3.2 Use levels for intake calculations
The use levels and MPLs used in both methods for E120 and E133 are listed in Table 1 and 2, respectively. The differences between the food groups used in the different methods are indicated in the tables. For the MCRA-OIM a few new food groups were created. On the other hand, some food groups were not used in the MCRA-OIM method. This was the case when food colours were not expected in any of the products in the food group. For
example in none of the products in the food groups ‗soups‘ E133 was expected.
The food colour E180 can be used to colour edible cheese rind. For this food colour no use levels were provided. Moreover, edible cheese rind did not occur in the consumption data. Consequently, the exposure to this food colour was not estimated.
Except for Tandoori Marinade/Melange all maximum reported use levels were lower than the MPLs. Some values were adjusted before using them in the calculations, see Appendix 2. For most products groups the maximum use levels were a factor 3 lower than the MPLs. The largest difference was seen for non-alcoholic flavoured drinks, the maximum use level was a factor 100 lower than the MPL. Within products groups use levels varied
considerably. The range of the use level for confectionery was 4 mg/kg to 100 mg/kg. For desserts including flavoured milk products this was 0.1 to 53 mg/kg.
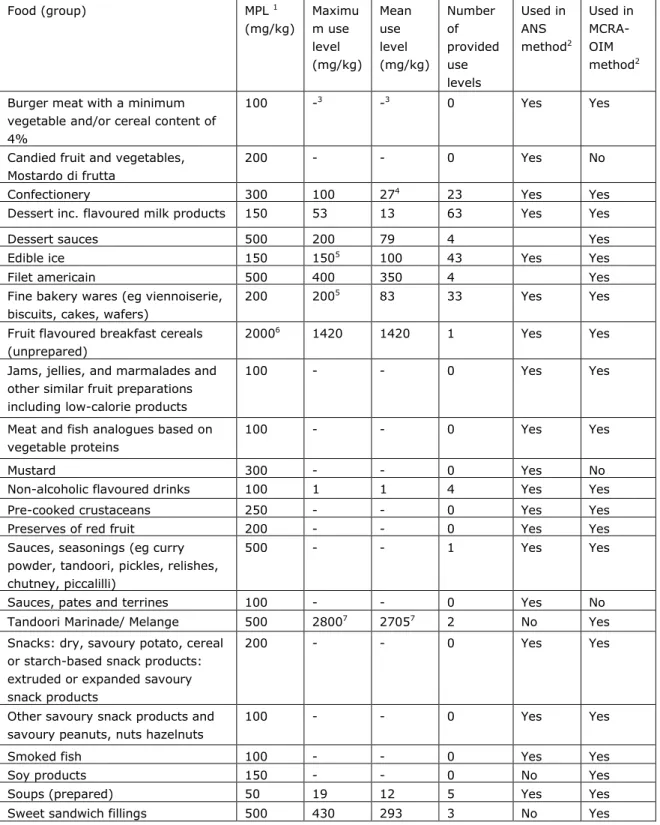
Table 1 Concentration values of E120 per food group as used in the calculation with the MCRA-OIM method in the four different scenarios
Food (group) MPL 1 (mg/kg) Maximu m use level (mg/kg) Mean use level (mg/kg) Number of provided use levels Used in ANS method2 Used in MCRA-OIM method2
Burger meat with a minimum vegetable and/or cereal content of 4%
100 -3 -3 0 Yes Yes
Candied fruit and vegetables, Mostardo di frutta
200 - - 0 Yes No
Confectionery 300 100 274 23 Yes Yes
Dessert inc. flavoured milk products 150 53 13 63 Yes Yes
Dessert sauces 500 200 79 4 Yes
Edible ice 150 1505 100 43 Yes Yes
Filet americain 500 400 350 4 Yes Fine bakery wares (eg viennoiserie,
biscuits, cakes, wafers)
200 2005 83 33 Yes Yes
Fruit flavoured breakfast cereals (unprepared)
20006 1420 1420 1 Yes Yes
Jams, jellies, and marmalades and other similar fruit preparations including low-calorie products
100 - - 0 Yes Yes
Meat and fish analogues based on vegetable proteins
100 - - 0 Yes Yes
Mustard 300 - - 0 Yes No
Non-alcoholic flavoured drinks 100 1 1 4 Yes Yes Pre-cooked crustaceans 250 - - 0 Yes Yes Preserves of red fruit 200 - - 0 Yes Yes Sauces, seasonings (eg curry
powder, tandoori, pickles, relishes, chutney, piccalilli)
500 - - 1 Yes Yes
Sauces, pates and terrines 100 - - 0 Yes No Tandoori Marinade/ Melange 500 28007 27057 2 No Yes
Snacks: dry, savoury potato, cereal or starch-based snack products: extruded or expanded savoury snack products
200 - - 0 Yes Yes
Other savoury snack products and savoury peanuts, nuts hazelnuts
100 - - 0 Yes Yes
Smoked fish 100 - - 0 Yes Yes
Soy products 150 - - 0 No Yes
Soups (prepared) 50 19 12 5 Yes Yes Sweet sandwich fillings 500 430 293 3 No Yes
1 European Parliament and Council Directive 94/36/EC
2 The categories used for the ANS and MCRA-OIM method are in general similar. However for the
MCRA-OIM method some extra categories were created based on the received concentration data. On the other hand, some food categories were not used in the MCRA-OIM method, since no foods with a colour of relevance did occur in the food consumption data.
3 When use levels were not provided, MPLs were used in the calculation.
4 Most of the products in this food group are mixes of sweets with different colours. Only a part of the
different sweets contain food colour. The use level refers to the mean level of food colour in the total mix.
5 Some use levels were replaced by the MPL as a consequence of uncertainties in the received data.
Therefore, the maximum use level is equal to the MPL.
6 The MPL as given in the Directive is 200 mg/kg, which applies to the prepared product (porridge),
while the consumption data refer to the consumed quantity of cereal and milk. In this calculation it is assumed that the prepared product contains 10% (w/w) cereals. Therefore the MPL for the cereal has been multiplied by 10.
7 Reported use levels were higher than the MPL for seasonings (500 mg/kg). In the calculations the
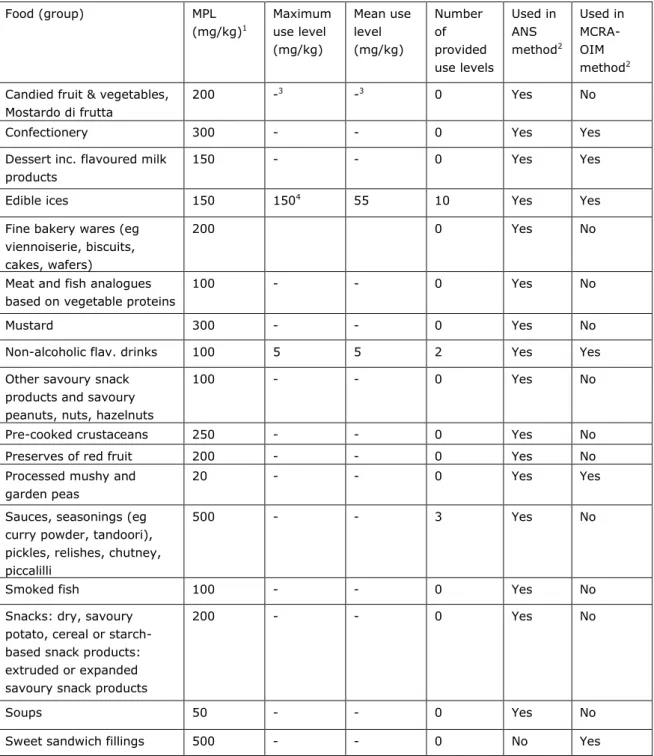
Table 2 Concentrations values of E133 per food group as used in the calculation with the MCRA-OIM method in the four different scenarios
Food (group) MPL (mg/kg)1 Maximum use level (mg/kg) Mean use level (mg/kg) Number of provided use levels Used in ANS method2 Used in MCRA-OIM method2
Candied fruit & vegetables, Mostardo di frutta
200 -3 -3 0 Yes No
Confectionery 300 - - 0 Yes Yes Dessert inc. flavoured milk
products
150 - - 0 Yes Yes
Edible ices 150 1504 55 10 Yes Yes
Fine bakery wares (eg viennoiserie, biscuits, cakes, wafers)
200 0 Yes No
Meat and fish analogues based on vegetable proteins
100 - - 0 Yes No
Mustard 300 - - 0 Yes No
Non-alcoholic flav. drinks 100 5 5 2 Yes Yes Other savoury snack
products and savoury peanuts, nuts, hazelnuts
100 - - 0 Yes No
Pre-cooked crustaceans 250 - - 0 Yes No Preserves of red fruit 200 - - 0 Yes No Processed mushy and
garden peas
20 - - 0 Yes Yes
Sauces, seasonings (eg curry powder, tandoori), pickles, relishes, chutney, piccalilli
500 - - 3 Yes No
Smoked fish 100 - - 0 Yes No
Snacks: dry, savoury potato, cereal or starch-based snack products: extruded or expanded savoury snack products
200 - - 0 Yes No
Soups 50 - - 0 Yes No
Sweet sandwich fillings 500 - - 0 No Yes
1 European Parliament and Council Directive 94/36/EC.
2 The categories used for the ANS and MCRA-OIM method are in general similar. However for the
MCRA-OIM method some extra categories were created based on the received concentration data. On the other hand, some food categories were not used in the MCRA-OIM method, since no foods with a colour of relevance did occur in the food consumption data.
3 When use levels were not provided, MPLs were used in the calculation.
4 Some use levels were replaced by the MPL as a consequence of uncertainties in the received data.
3.3 Exposure estimates
E120
The exposure estimates of E120 assessed with the different methods and scenarios are listed in Table 3. The exposure estimates calculated with the MCRA-OIM method were on average 25% lower than those calculated with the ANS method.
Compared to the scenario 1 (MPLs), the exposure estimates calculated with maximum use levels (scenario 2) are a factor 2 lower. In scenario 3 (mean use levels) the results decreases further, and are a factor 3.5 lower than those calculated with the MPLs. When only mean use levels are used and lacking data were not replaced by MPLs (scenario 4) the results slightly decreased.
The main contributors to total exposure of E120 according to the two different methods and four scenarios are listed in Table 4. There are differences in the main contributors per scenario and method. When calculations are performed with the MPLs or maximum use levels the food group ‗desserts including flavoured milk products‘ is the most important contributor for both methods. When the mean use levels are used the main contributor for the ANS method is ‗sauces, seasonings‘ and for the MCRA-OIM method is ‗fruit flavoured breakfast cereals‘.
E133
The exposure estimates calculated with the MCRA-OIM method were on average a factor 10 lower than the exposure estimates calculated with the ANS method.
In the ANS method results decrease on average 20% when maximum use levels are used instead on MPLs. When mean use levels are used results do not decrease further. When lacking data are not replaced by MPLs, exposure estimates become very low.
In the MCRA-OIM method results remain the same when maximum use levels are used. When mean use levels are used the results decrease with a factor 1.25. When lacking data are not replaced by MPLs, exposure estimates become very low.
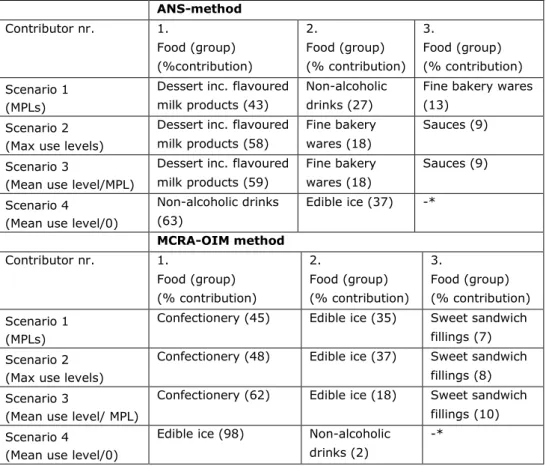
The main contributors to the total exposure of E133 according four different methods are listed in Table 6.
The most important contributor is the group ‗desserts including flavoured milk products‘ for the ANS method and the group ‗confectionery‘ for the MCRA-OIM method. In the scenario where no MPLs were used to complete the data, the most important contributor for the ANS method is the group ‗non-alcoholic flavoured drinks‘ and for the MCRA-OIM method it is the group ‗edible ice‘.
Table 3 Results exposure to E120 assessed with the ANS and MCRA-OIM method with four scenarios
Table 4 Main contributors of E120 according to the ANS and MCRA-OIM method with four different scenarios ANS-method Contributor nr. 1. Food (group) (% contribution) 2. Food (group) (% contribution) 3. Food (group) (% contribution) Scenario 1 (MPLs) Dessert inc. flavoured milk products (41) Non-alcoholic drinks (26) Fine bakery wares (13) Scenario 2 (Max use levels)
Dessert inc. flavoured milk products (33) Fine bakery wares (29) Sauces (15) Scenario 3 (Mean use level/ MPL)
Sauces (27) Fine bakery wares (22)
Dessert inc. flavoured milk products (15) Scenario 4
(Mean use level/0)
Sauces (35) Fine bakery wares (28) Dessert inc. flavoured milk products (19) MCRA-OIM method Contributor nr. 1. 2. 3. Scenario 1 (MPLs) Dessert inc. flavoured milk products (45) Non-alcoholic drinks (24) Fruit flavoured breakfast cereals (12) Scenario 2 (Max use levels)
Dessert inc. flavoured milk products (40) Fruit flavoured breakfast cereals (20) Edible ice (8) Scenario 3 (Mean use level/ MPL) Fruit flavoured breakfast cereals (34) Dessert inc. flavoured milk products (16) Savoury sauces (10) Scenario 4 (Mean use level/0)
Fruit flavoured breakfast cereals (43) Dessert inc. flavoured milk products (21) Sauces (13)
Method ANS MCRA-OIM
Scenario P50 exposure (mg/ kg bw/ day) P95 exposure (mg/ kg bw/ day) P50 exposure (mg/ kg bw/ day) P95 exposure (mg/ kg bw/ day) Scenario 1 (MPLs) 3.6 6.6 3.0 7.5 Scenario 2
(Max use levels/MPL)
1.6 4.6 1.1 3.4
Scenario 3
(Mean use level/MPL)
0.9 3.9 0.5 2.7
Scenario 4 (Mean use level/0)
Table 5 Results exposure to E133 assessed with the ANS and MCRA-OIM method with four scenarios
Method ANS MCRA-OIM
scenario P50 exposure (mg/ kg bw/ day) P95 exposure (mg/ kg bw/ day) P50 exposure (mg/ kg bw/ day) P95 exposure (mg/ kg bw/ day) Scenario 1 (MPLs) 3.4 6.4 0.2 0.9 Scenario 2
(Max use levels/MPL)
2.5 5.5 0.2 0.9
Scenario 3
(Mean use level/MPL)
2.5 5.5 0.1 0.6
Scenario 4 (Mean use level/0)
0.1 0.3 0.0 0.2
Table 6 Main contributors to the total exposure of E133 according to the ANS and MCRA-OIM method with four different scenarios
ANS-method Contributor nr. 1. Food (group) (%contribution) 2. Food (group) (% contribution) 3. Food (group) (% contribution) Scenario 1 (MPLs)
Dessert inc. flavoured milk products (43)
Non-alcoholic drinks (27)
Fine bakery wares (13)
Scenario 2 (Max use levels)
Dessert inc. flavoured milk products (58)
Fine bakery wares (18)
Sauces (9)
Scenario 3
(Mean use level/MPL)
Dessert inc. flavoured milk products (59)
Fine bakery wares (18)
Sauces (9)
Scenario 4 (Mean use level/0)
Non-alcoholic drinks (63) Edible ice (37) -* MCRA-OIM method Contributor nr. 1. Food (group) (% contribution) 2. Food (group) (% contribution) 3. Food (group) (% contribution) Scenario 1 (MPLs)
Confectionery (45) Edible ice (35) Sweet sandwich fillings (7) Scenario 2
(Max use levels)
Confectionery (48) Edible ice (37) Sweet sandwich fillings (8) Scenario 3
(Mean use level/ MPL)
Confectionery (62) Edible ice (18) Sweet sandwich fillings (10) Scenario 4
(Mean use level/0)
Edible ice (98) Non-alcoholic drinks (2)
-*
4
Discussion
4.1 Evaluation of pilot study
4.1.1 Provided use levels
Representativeness of data
About 40 % of the FNLI-members which were asked to deliver data responded. To get a data set representative for the foods consumed in the Netherlands it is considered necessary to increase this number in the future. Although this has not been performed in the present pilot, in further studies it should be assessed whether the obtained data sufficiently cover the foods consumed in the DNFCS, taking into account that products with a relatively small market share may influence the exposure when they have a relatively high concentration of food colour. For the assessment of the representativeness of the data, information on market share of the products manufactured by the different FNLI-members is required. It may be possible to obtain information on market share from the DNFCS.
In addition it is very important to obtain the ‗zeroes‘, i.e. the products in which the food colour of interest has not been used. For a complete data collection, an obligatory delivery of usage data by the manufacturers is desirable.
Uncertainties in provided use levels
There are some uncertainties in the provided use levels. Some concentrations highly exceeded the MPLs. On inquiry it appeared that most of these values referred to the decoration or coating of the products. Apparently, this was not sufficiently clear from the request for data nor from the information in the template. Furthermore information about the proportion of decorations and coatings in the total products was not provided. For some products this was obtained in a small weighing experiment (n=1). For the other products with a use level referring to the decoration/ coating (ice-creams), these values were replaced by MPLs.
For edible ices 40 of the 41 provided use levels referred to the total colouring formulation used. Only a part of this colouring formulation is food colour. Of 13 ices it was reported that the proportion food colour in the colouring formulation was 6-7%, for the other ices we assumed that 100% of the colouring formulation consisted of food colour. The latter is very likely an overestimation.
Furthermore the use levels of E120 in Tandoori Marinade/ Melange were almost 7 times higher than the MPL of sauces and seasonings. After finishing the exposure calculations it appeared that the use levels of these products were not reported correctly. The correct maximum use level is 183 mg/kg, which is below the MPL.
To reduce the uncertainties, it is important that the template clearly indicates that the levels in the end product should be given, or otherwise, data should be given to be able to calculate the concentration in the end product, such as the proportion of the coloured matter in the product.
Furthermore, it is recognised that the possibility to communicate with the data providers is of major significance to obtain a reliable data set. The advantage of the system tested in this pilot is that the exposure assessors were able to get in contact with the data providers via FNLI. When using data from international branch organizations such as NATCOL or
Food Drink Europe (as EFSA is doing) this is often not possible as these central organizations collect data from their members and do not have precise information on these data. Another advantage of using nationally obtained data is that they are country-specific, whereas data obtained from international branch organizations will be not. A disadvantage of using national data is that there will be no information on imported foods. The importance of this lack of information should be considered when the
representativeness of the data is studied (see above).
4.1.2 The method of linking
ANS versus MCRA-OIM method
The template of the ANS method contains foods on an aggregated food category level and assumes that when a food colour is permitted, the colour is actually used in all products of the food category. In the calculations with the MCRA-OIM method the consumption data can be linked with the use levels at a higher level of detail. The most important difference is that in the MCRA method the colour of the product was taken into account, thereby reducing the number of food products with a positive concentration value. However, it requires expertise and time to assess the colour of the consumed products, as the data of the DNFCS 2006-2007 contain circa 8600 different products. Although it may be expected that with ongoing experience the time needed for a proper linking will likely reduce, it still will require a relatively large effort as a case-by–case approach will be needed.
In a number of cases it is uncertain which foods contain food colours. In red products, such as red sweets it is clear that they possibly contain E120. For other products this may be less obvious: For example E120 occurs in orange coloured breakfast cereals and E133 in processed garden peas. For this reason this ‗visual‘ method of linking is difficult to use in an objective way. However, it is expected that this process will become more
straightforward after gaining more experience.
The EXPOCHI categorization has been developed for food colours. For additives other than food colours different categorization methods will be needed. Moreover, a ‗visual‘
assessment of the products will not help to distinguish food products containing the additive from those which do not. For these additives it may be needed to obtain
information on product labels from a commercial database (e.g. Mintel www.mintel.com or INNOVA www.innovadatabase.com) to come to a realistic estimate. It is proposed to test the exposure assessment of such additives in future case studies.
4.1.3 Exposure estimates
Conservativeness/uncertainty
Since the use levels did not exactly match the consumption data, the linking was performed on food group level. Especially for E120 this was done in a conservative way. When there was any doubt about the occurrence of a food colour in a product, a positive value was assigned to the food. Besides that, some values were replaced by MPLs, because of uncertainties in the use levels. Consequently in some scenarios exposure estimates will be overestimated.
The aim of this pilot study is to propose a monitoring system based on use levels. Calculations were performed to assess the feasibility of the method and to compare the results of two different methods and four scenarios. Results should not be interpreted as a
risk assessment, as it was not the aim of this study. For this reason exposure estimates were not compared with ADIs.
In the present pilot the mean concentration was calculated for each food group without weighing the market share of the products. Using market share information (whether or not from DNFCS data) to calculate weighed mean concentrations would lead to a more realistic exposure estimate.
As fully probabilistic exposure calculations can be performed with MCRA, it is possible to use all individual concentration data points (either weighed or not) instead of using a mean concentration. In that case, the uncertainty in the concentration data can be taken into account in the exposure calculation and be expressed as confidence intervals.
ANS method at RIVM and at EFSA
EFSA‘s ANS Panel reported exposure estimates of Brilliant Blue in 2010 (EFSA, 2010). These estimates can be compared to the estimates using the ANS-method at the RIVM. In the EFSA opinion the exposure to E133 in the ten EXPOCHI countries (including the Netherlands) was estimated to range from 0.5-3.5 mg/kg bw/day at the mean and from 1.2-7.2 mg/kg bw/day at the 95th percentile using MPLs (Tier 2) and from 0.2-2.1 mg/kg/d
to 0.6-4.8 mg/kg bw/day at the 95th percentile using maximum reported use levels (Tier
3). The values reported in scenario 1 (corresponding with Tier 2) of the current pilot study were 3.4 mg/kg bw/day at the mean, and 6.4 mg/kg bw/day for the 95th percentile. For
scenario 2, corresponding with Tier 3, these were 2.5 mg/kg bw/day at the mean and 5.5 mg/kg bw/day 95th percentile. All values are within the ranges estimated by the ANS
ANS versus MCRA-OIM method
For E133 the differences between the results of the two methods were very large:
Exposure estimates calculated with the ANS method were about a factor of 10 higher than those calculated with the MCRA-OIM method. For the food colour E120 differences were less striking. This is logical: When calculating the intake of a food colour that is only used in a few products, the aggregation level of the foods is important. For example according to the calculations with the ANS method the food group ―Desserts inc. flavoured milk products‖ is the most important contributor to the total intake of E133, whereas little dairy products are expected to have a blue colour. Therefore the intake of E133 via ―Desserts inc. flavoured milk products‖ is very likely overestimated in the ANS method. This
difference in linking method explains the different contributors to the total intake between the methods.
MPLs versus use levels
In both methods the E120 exposure estimates calculated with the MPLs (scenario 1) were a factor 2 and 3.5 higher than those calculated with the maximum (scenario 2) or mean (scenario 3) use levels, respectively. Not much changed when calculations were performed with use levels only and without replacement by MPLs (scenario 4). This indicates that for the most important food groups data were available. For E133 the differences between the values of the MPLs and use levels were smaller than for E120. However when only use levels (without MPLs) were used (scenario 4) exposure estimates became far lower than for scenario 3. This may imply that not much data were provided and therefore many gaps had to be replaced by MPLs. However, as we received more data for E120, it is more likely that we received few data for E133 because the colour is only used in few products. In that case the exposure estimates calculated without replacement by MPLs would be more realistic. In fact in this scenario it is assumed that food colours do not occur in food groups where no data is received. This underlines the need for a representative and complete dataset, including the ‗zeroes‘.
4.2 Towards a new monitoring system
4.2.1 Use levels versus measured concentration data
Using use levels in intake estimations appears to be suitable for use in a new system described in Regulation 1333/2008, provided that there are sufficient data available. In this pilot study use levels as provided by industry were used in the exposure estimations. Another option would be to use analytical concentration data, especially for the food products for which no use levels were reported by the manufacturers (e.g. products imported from other countries). An advantage of this option is the possibility to select products to analyze, it is not dependent on response and no gaps in data have to be replaced by MPLs. On the other hand, analytical methods for additives may not always readily available.
4.2.2 International developments
EFSA has published the Comprehensive European Food Consumption Database in which food consumption surveys of 22 countries (including the Netherlands) have been made available4. For storage in this database the food consumption surveys were classified
according to FoodEx, the food classification system developed at EFSA. FoodEx is a hierarchical coding system based on 20 main food categories that are further divided into subgroups and foods with a maximum of 4 levels.
Currently, at the ANS Panel the food products in the Comprehensive Database, coded with the Foodex system, are being linked to the Food Categorization System of the European Commission, used for legislation purposes. This project is expected to be finished in the first months of 2012. The ANS Panel will use this linking table and the Comprehensive Database for their future exposure estimates of food additives and nutrient sources. The level 2 of FoodEx will be used, except for beverages which will be coded at level 3.
As the new methodology of ANS contains about 160 categories instead of the 67 categories defined in the EXPOCHI project, this will likely lead to less conservative exposure
estimates. Furthermore, when needed the ANS Panel can obtain the individual data of the consumption surveys included in the Comprehensive Database.
In the new ANS methodology (from 2012) the exposure estimation is now calculated for 2 scenarios:
Scenario 1 refers to applications for the authorisation of a new food additive;
Scenario 2 refers to a modification of the proposed uses or use levels of an already authorised food additive.
Exposure estimates are performed for scenario 1 using MPLs and for scenario 2 using the maximum reported use levels, both combined with national consumption data from the Comprehensive database for five population groups: toddlers, other children, adolescents, adults, elderly and very elderly.
It may be efficient to use the methodology of the ANS Panel as a new monitoring system, using the surveys present in the Comprehensive Database. When the individual food consumption data will be used, this may be done with the MCRA platform, as is shown in the EU project ACROPOLIS5. In this project MCRA is being used to estimate aggregate exposure to pesticides with food consumption surveys of different Member States which were classified with FoodEx.
In the EU-project FACET, software is being developed for the estimation of the exposure to food additives, flavours and food contact materials. The goal of the project is the creation of a food chemical exposure surveillance system, which will meet the needs of the EU regulatory authorities in the protection of consumer health. The FACET project ends mid-2012. It is recommended to closely follow this project and obtain the software to explore how this can be used in the new monitoring system.
4.2.3 Proposal for a tiered approach in the new system
In the introduction of this report a number of conditions for a new monitoring system were given. The system should: 1) be a low burden for the business community, 2) be risk-driven, 3) give a realistic estimate, 4) be applicable in the different Member States and 5) be applicable to other substances.
The current pilot study shows that industry is able to provide useful concentrations with a relatively low effort, in other words, the first condition is met. A risk-driven monitoring system (condition 2) may be created by selecting those substances for a refined exposure 5 www.acropolis-eu.com
assessment which exceed the ADI in (re-)evaluations performed by EFSA. Whether an exposure estimate is realistic (condition 3) is dependent on the level of detail of the linking process and the quality and representativeness of the concentration data. For the
establishment of the required level of detail a tiered approach can be used, in which the level of detail progresses from the lower to the higher tiers, and the overestimation
decreases with every step in the tier. A proposal for a tiered approach in the new system is described below.
The method used in this pilot study is, in principle, applicable in different Member States (condition 4) and to other substances (condition 5), but should be tested for these applications.
The approach proposed for the new monitoring system is tiered with respect to both the level of food categorization and the value selected for the concentration of the substance in the food. It is clear that a more disaggregated food categorization leads to lower intake estimations, but with the level of detail the required data quality and the work increases. The following tiered approach is proposed,
Tier 1: Aggregated food categories and MPLs;
Tier 2a: Aggregated food categories and typical or maximum use levels;
Tier 2b: Partly disaggregated food categories and typical or maximum use levels; Tier 3: Individual food consumption data and typical or maximum use levels.
The choice between typical and maximum use levels should be based on the
representativity of the data: When representative data are present, a typical value can be used, whereas the use of maximum reported use levels is recommended in all other cases. Note that for each tier it is necessary to have reliable and recent food consumption data for the population group at interest.
This approach is close to the new methodology used by EFSA‘s ANS Panel. An important difference between the EFSA approach and the one proposed here is the use of typical rather than maximum use levels when representative data are present. Furthermore, the addition of Tier 2b, with ‗partly disaggregated‘ food categories is distinctive. The term ‗partly disaggregated‘ means that categories should be disaggregated when it is clear that different use levels are present for a food product or groups of foods within one category. Example: the food group ‗desserts including flavoured milk products‘ is a broad food group with a mean use level of 13 mg/kg. This group contains the products ‗flavoured milk drinks‘, ‗pudding‘ and ‗other desserts‘ with mean use levels of 8, 24, and 11 mg/kg, respectively. The high use levels of pudding increase the mean use level linked to the whole group, while pudding is least consumed of these three products. When the food group is disaggregated in the food groups ‗flavoured milk products‘, ‗pudding‘ and ‗other desserts‘ linking can be performed at a higher level of detail and exposure estimates very likely will decrease to a more realistic value.
The idea behind the Tier 2b is to make a ‗quick win‘, thus without much effort a
disaggregation of the foods should be performed. A strict description of this Tier is difficult, although necessary to avoid ‗subjective‘ estimates. Experience with more case studies will be needed to obtain this.
In Tiers 2 and 3, when the obtained use levels are considered to be representative for the consumed foods in the DNFCS, food products for which no use levels are reported can be
assumed to not contain any food colour. In other cases these food products should be assigned the MPL.
4.2.4 Other issues
Other issues that were not considered during this pilot but should be considered in the new monitoring system are:
How will concentration data need to be collected and where will they be stored? How to deal with confidentiality of the data?
How to act when concentrations obtained from industry appear to be higher than the MPL?
5
Conclusions and recommendations
5.1 Conclusions
The reported data appeared suitable for exposure assessment provided that they are sufficiently representative for the foods consumed in the Netherlands.
The representativeness of the data should be confirmed before starting the exposure calculations. Data of market shares can be used for this purpose.
The monitoring system could also be used for other groups of substances than food
colours. Nevertheless, the food linking (including the level of detail needed) for these other groups should be established in case studies.
5.2 Recommendations
A tiered approach is proposed, in which the aggregation level of the food groups and the use levels are introduced into the different tiers. The option of a refinement of the aggregated categories on a case-by-case basis is recommended as a Tier 2b.
To reduce the uncertainties in the dataset, a clear instruction should be given to the manufacturers on how to use the template. Especially on measurements performed in parts of products such as decorations and coatings. Furthermore it would be practical if manufacturers could indicate the proportions of the decorations and coatings of these products and the proportion non-prepared/ prepared product. Finally, it should be emphasized that the collection of zeroes is very important.
The possibility to communicate with the manufacturers is a prerequisite for this method as questions about the provided use levels are likely to arise.
The international developments at EFSA (ANS Panel) and the FACET project should be closely followed and developed methods that can be employed in the monitoring system should be obtained.
References
Heijden, L.J.M. van der, Donders-Engelen, M.R. Hulshof, K.F.A.M (1997). Maten, gewichten en codenummers 1997. Wageningen University & Research centre Division Human
Nutrition and TNO Nutrition and Food Research Institute Zeist. Wageningen
Boer, W.J. de, Voet H. van der (2010). MCRA 7, a web-based program for Monte Carlo Risk Assessment. Reference Manual, documenting MCRA release 7.0. Bilthoven, Wageningen, Biometris, Wageningen UR and National Institute for Public Health and the Environment (RIVM).
Commision of the European Communities (1983). Food-science and techniques. Report of the Scientific Committee for food (fourteenth series). Report EUR 8752. Available online: http://ec.europa.eu/food/fs/sc/scf/reports/scf_reports_14.pdf
European Commission (1997) Reports on tasks for scientific co-operation (SCOOP) Task 4.2: Report on methodologies for the Monitoring of Food Additive Intake across the European Union.
EFSA Panel on Food Additives and Nutrient Sources added to Food (ANS) ; Scientific Opinion on the re-evaluation of Brilliant Blue FCF (E133) as a food additive. EFSA Journal 2010;8(11):1853. [36 pp.]. doi:10.2903/j.efsa.2010.1853. Available online:
www.efsa.europa.eu/efsajournal
European Parliament and Council Directive "European Parliament and Council Directive 94/36/EC of 30 June 1994 on colours for use in foodstuffs". Official Journal of the European Communities 1994;L 237/13.
Huybrechts I, Sioen I, Boon PE, Ruprich J, Lafay L, Turrini A, Amiano P, Hirvonen T, De Neve M, Arcella D, Moschandreas J, Westerlund A, Ribas-Barba L, Hilbig A, Papoutsou S, Christensen T, Oltarzewski M, Virtanen S, Rehurkova I, Azpiri M, Sette S, Kersting M, Walkiewicz A, Serra-Majem L, Volatier JL, Trolle E, Tornaritis M, Busk L, Kafatos A, Fabiansson S, De Henauw S, Van Klaveren J, 2010. Dietary Exposure Assessments for Children in Europe (the EXPOCHI project): rationale, methods and design. Archives of public Health. In press.
Ocké MC, van RossumCTM, Fransen HP, Buurma EJM, de Boer EJ, Brants HAM, Niekerk EM, van der Laan JD, Drijvers JJMM, Ghameshlou Z (2008). Dutch National Food Consumprion Survey – Young children 2005/2006 (350070001). Bilthoven: National Institute for Public Health and the Environment (RIVM). Available at <www.rivm.nl>
Appendix 1. Template for actual use levels, to be completed by
members of FNLI
The columns on E133 and E180 have been removed for this example.
Name of com-pany Brand name product Pro-duct de-script ion
EAN- code NAME in Annex II
(drill-down) E120 (mg/ 100g product) Used in this concen-tration since Remarks MaNy Food (fictive example ) MaNy MaNy strawberry jam Jam 123456789
04.2.5.2 Jam, jellies and marmalades and sweetened chestnut puree as defined
by Directive 2001/113/EEC 1.23
24-10-2010
Appendix 2. Adjustments made to the provided use levels
1. The concentration value of the fondant cake referred to its glazing instead of the total product. A small experiment proved that the percentage glazing of this product is approximately 20% (w/w). Therefore the concentration value was divided by 5. 2. For edible ices 40 of the 41 provided use levels referred to the total colouring
formulation used. A part of this formulation is food colour. Of 13 ices the proportion food colour in the colouring is 6-7%. The use level of the food colours was calculated, assuming that the proportion food colour was 7%. For the other ices the proportion food colour was unknown. For these ices we assumed that total colouring consist of food colour.
3. The concentration value of the ice cream ‗Split‘ referred to its coating instead of the total product. Our small experiment showed that this ice cream consist for 50% (w/w) of this coating. Consequently the concentration value was divided by 2.
4. For some ice creams concentration values were provided which were far higher than the MPL. It is very likely that this value applies to the decoration or coating of the product rather than to the whole product. Since we had no information about the proportions, we were not able to convert the values. Therefore values of 5 different ices were replaced by the MPL.
5. Concentration values of food colours in soups were measured in unprepared powder. Information about the preparation of the soups was obtained from the report ‗Maten, Gewichten en codenummers 1997 (van der Heijden et al.,1997)‘ and from websites of the manufacturers. The provided concentration values were converted into
concentrations of the prepared product.
6. Four products in the group ‗fine bakery wares‘ had a concentration value expressed as ‗lower than ...‘. The exact value was unknown. For three of the products the upper value was used. In one product the upper value exceeded the MPL with almost a factor of 10; therefore the MPL was assigned to this food.
7. Two extremely high concentration value of E120 were reported for Tandoori Marinade/Melange In the MCRA-OIM method this product is directly linked to the consumption data of this food product. Since this is not possible in the ANS method, these values were replaced by the MPLs of ‗sauces and seasonings‘.
Appendix 3. Food groups as used in the EFSA ANS panel for the
exposure estimation of food colours
1 Non-alcoholic flavoured drinks
2 Candied fruits & vegetables, Mostardo di frutta
3 Preserves of red fruits
4 Confectionery
5 Decorations & coatings
6 Fine bakery wares (eg viennoiserie, biscuits, cakes, wafers)
7 Edible ices
8 Flavoured processed cheese
9 Desserts inc. flavoured milk products
10 Sauces, seasonings (eg curry powder, tandoori), pickles, relishes, chutney, piccalilli
11 Mustard
12 Fish paste and crustacean paste
13 Pre-cooked crustaceans
14 Salmon substitutes
15 Surimi
16 Fish roe
17 Smoked fish
181 Other savoury snack products and savoury peanuts, nuts or hazelnuts 182 Snacks: dry, savoury potato, cereal or starch-based snack products:
extruded or expanded savoury snack products
19 Edible cheese rind and edible casings
20 Complete formulae for weight control intended to replace total daily food intake or an individual meal
21 Complete formulae and nutritional supplements for use under medical supervision
22 Liquid food supplements/dietary integrators
23 Solid food supplements/dietary integrators
24 Soups
25 Meat and fish analogues based on vegetable proteins
26 Spirituous beverages (inc. products less than 15% alcohol by volume), except any mentioned in Schedule 2 or 3
27
Aromatized wines, aromatized based drinks and aromatized wine-product cocktails as mentioned in Reg 1601/91, except any mentioned in Schedule 2 or 3
28 Fruit wines (still or sparkling), Cider (except cidre bouche) and perry, Aromatized fruit wines, cider and perry
29 Malt bread
30 Beer, Cidre bouche
31 Butter (including reduced-fat butter and concentrated butter)
32 Margarine, minarine, other fat emulsions, and fats essentially free from water
33 Sage Derby cheese
34 Ripened Orange, Yellow and broken-white cheese; unflavoured
35 Red Leicester cheese; Mimolette cheese
36 Morbier cheese
37 Red marbled cheese
38 Vinegar
39
Whisky, Whiskey, grain spirit (other than ….), wine spirit, rum, Brandy, Weinbrand, grape marc, grape marc spirit (other than …) Grappa invecchiata, Bazaceira velha as mentioned in Reg (EEC) No. 1601/91 40 Aromatized wine-based drinks (except bitter soda) and aromatized
wines as mentioned in Reg (EEC) No. 1601/91
41 Americano
42 Bitter soda, bitter vino as mentioned in Reg (EEC) No. 1601/91 43 Liqueur wines and quality liqueur wines produced in specified regions 44 Vegetables in vinegar, brine or oil (excluding olives)
45 Extruded, puffed and/or fruit-flavoured breakfast cereals
46 Fruit-flavoured breakfast cereals
47 Jams, jellies, and marmalades as mentioned in Directive 79/693/EEC and other similar fruit preparations including low-calorie products
48 Sausages, pates and terrines
49 Luncheon meat
50 Breakfast sausages with a minimum cereal content of 6%; Burger meat with a minimum vegetable and/or cereal content of 4%
51 Chorizo sausage; Salchichon
52 Sobrasada
53 Pasturmas (edible external coating)
54 Dried potato granules and flakes
55 Processed mushy and garden peas (canned)
56 Aperitif wines, spirit drinks including products with less than 15% alcohol by volume
57 Cocktail cherries and candied cherries
58 Bigarreaux cherries in syrup and in cocktails
59 Kippers
60 External coating of sugar confectionery for the decoration of cakes and pastries
61 External coating of confectionery
62 Decoration of chocolates
63 Liqueurs
64 Liqueurs, including fortified beverages with less than 15% alcohol by volume
65 Edible cheese rind
66 Saucisses de Strasbourg
with use levels provided by industry.
A pilot study
RIVM report 320026002/2011
D. Wapperom | G. van Donkersgoed |
N. Koopmans | E.M. Niekerk |
C.T.M. van Rossum | J.D. van Klaveren |
M.I. Bakker
National Insitute for Public Health and the Environment