PLANETARY SECURITY:
IN SEARCH OF DRIVERS OF
VIOLENCE AND CONFLICT
Part I: National-scale databases and reliability issues
Background Report
Hans Visser, Sophie de Bruin, Joost Knoop,
Willem Ligtvoet and Arno Bouwman
Planetary security: a search for drivers of violence and conflict. Part I: National-scale databases and reliability issues
© PBL Netherlands Environmental Assessment Agency The Hague, 2018
PBL publication number: 3404 Corresponding author hans.visser@pbl.nl Authors
Hans Visser, Sophie de Bruin, Joost Knoop, Willem Ligtvoet and Arno Bouwman Graphics
PBL Beeldredactie
Production coordination PBL Publishers
This publication can be downloaded from: www.pbl.nl/en. Parts of this publication may be reproduced, providing the source is stated, in the form: Visser H. (2018), Planetary security: in search of drivers of violence and conflict. Part I: National-scale databases and reliability issues. PBL Netherlands Environmental Assessment Agency, The Hague.
PBL Netherlands Environmental Assessment Agency is the national institute for strategic policy analysis in the fields of the environment, nature and spatial planning. We contribute to improving the quality of political and administrative decision-making by conducting outlook studies, analyses and evaluations in which an integrated approach is considered paramount. Policy relevance is the prime concern in all of our studies. We conduct solicited and
Contents
Summary and findings
1 Introduction 7
1.1 Setting the scene 7
1.2 Conceptual approach, quantitative analyses 9
1.3 Aim of the study and outline of Parts I and II 12
2 Human security indicators, based on country statistics 15
2.1 National-based indicators: pros and cons 15
2.2 Databases 18
2.2.1 CRED and Munich Re: disaster databases
2.2.2 FAO: food security and water-related issues
2.2.3 World Bank: economic development
2.2.4 Transparency International and World Bank: corruption and governance
2.2.5 United Nations: human development and population dynamics
2.2.6 Institute for Economics & Peace: conflict-related indicators
2.2.7 Uppsala Conflict Data Program and UNODC: conflict- and violence-related deaths
2.2.8 Sustainable Development Solutions Network: World Happiness
2.2.9 IDMC, UNHCR, UN-DESA and IOM: IDPs, refugees and migrants
2.2.10 Joint Research Centre: basic indicators for human security and global risks
2.3 Summary of indicators for the Planetary Security Initiative 41
2.4 Software implementation 46
3 Human security composite indicators 47
3.1 From indicators to composite indicators 47
3.2 Human security composites 48
3.2.1 Joint Research Centre: human security global risk
3.2.2 Central Emergency Response Fund: global emergencies
3.2.3 The Fund for Peace: fragile states
3.2.4 Germanwatch, BEH Stuttgart and UNISDR: disaster risks
3.2.5 Institute for Economics & Peace: Global Peace Index
3.3 Summary of composite indicators for the Planetary Security Initiative 56
3.4 Software implementation 57
4 Temporal and spatial coherence 59
4.1 Nature of temporal patterns 59
4.2 Nature of spatial patterns 64
5 Sources of uncertainty, quality assurance 65
5.1 Data quality and statistical capacity 65
5.2 Missing data 68
5.3 Definitions and their interpretation 69
5.4 Temporal positioning 71
5.5 Indicators in absolute terms, relative terms or both? 72
5.6 Composite indicators and uncertainties 75
6 Composite indicators compared as 'ring test' 77
7 Conclusions 83
References 85
Appendix A Metadata for World Bank indicators 91
Appendix B Software script in S-PLUS (R) 107
Summary and findings
The potential links between climate change, weather patterns, migration and conflict have received growing attention from scientists, media and global institutions over the last decade. But despite the increasing role that climate change has played in global security analyses and conventions, research on these topics has not fully matured or reached consensus on the existence of causal relationships. As for drivers of conflicts, violence and migration multiple explanations are found in the literature, varying from poverty and inequality, availability of resources (fertile land, ores, oil, water), grievances and greed, ineffective governance and corruption, to water-related impacts of climate change.
To deepen scientific insights in these complex processes and to strengthen the knowledge–policy interface, PBL Netherlands Environmental Assessment Agency participates in the Planetary Security Initiative. Recent studies highlighted the central role of water — too little, too much, too dirty — and the links between water security and
conflicts. See the following reports: 'The geography of future water challenges' (Ligtvoet et al., 2018) and 'Linking water security threats to conflict' (De Bruin et al., 2018). In the present study, we choose a wider scope. We explore and analyse a broad range of global databases containing human security indicators on country scale, varying from socio-economic indicators, climatic/weather indicators, indicators for food production to political indicators (corruption, governance, conflicts and violence). We publish our results in two parts. The present report — Part I — gives an overview of indicators, indicator
frameworks and related composite indicators in the context of climate change, human security and conflicts. Part II deals with the statistical analysis of these data in order to explore the drivers of violence and conflict in more detail.
The results reported here show the availability of a wealth of indicators and indicator frameworks, published by a great variety of organisations: national and international institutes (such as the EU Joint Research Centre, UNHCR, FAO or the World Bank), universities, think tanks and reinsurance companies. These databases have multiple applications:
• monitor human security issues such as formulated in the Sustainable Development Goals (SDGs),
• support research in the field of disaster risk reduction (such as for the UN Office for Disaster Risk Reduction and the Sendai Framework),
• support climate change adaptation research (e.g. IPCC, 2018, Chapters 3, 4 and 5), • identify hotspots of conflict and violence, this to prioritise humanitarian aid programs, • feed statistical analyses and integrated assessment models that aim to analyse and
predict impacts of climate change (poverty, water-related tensions, migration flows, conflicts).
Examples of institutes that base their humanitarian aid program on humanitarian risk indicators, are the World Bank and the Central Response Fund (CERF). CERF is part of the
UN Office for the Coordination of Humanitarian Affairs (UN-OCHA). The Netherlands is a major funder of CERF and donated USD 750 million over the 2006–2018 period.
We give an overview of the following data sources, without being complete: databases on natural disasters (CRED, Munich Re, GermanWatch, UNISDR), indicators on food security and water (FAO), demography and youth bulges (UN Development Programme), indicators on economic development, corruption and governance (World Bank, Transparency
International), world happiness perception data (Sustainable Development Solutions
Network), conflict-related indicators (UCDP, the Institute for Economics & Peace), indicators for migration, refugees and displaced people (UNHCR, IDMC, UN-DESA, IOM), and human security indicators (INFORM database of the EU Joint Research Centre, the CERF risk indices, Fragile States indicators of the Fund for Peace).
All these institutes and databases are briefly reviewed along with relevant metadata. In addition, we show how these indicators and indicator frameworks — all gathered on country basis — have been integrated into one database for 191 countries in the world, in line with database set-up chosen by the JRC for their INFORM database. All software implementations are within the statistical package S-PLUS, which is closely related to R. Occasionally, changes had to be made manually, for example, to merge databases properly (e.g. a computer sees 'Cote d'Ivoire', 'Côte d'Ivoire' and 'Ivory Coast' as three separate countries).
An important question is the reliability of all these data. Reliability of data is important since poor numbers will be found in poor and fragile countries with low levels of
statistical capacity. However, these countries might need humanitarian/financial aid the most. The importance of this issue has been illustrated by Morten Jerven in his 2013 book entitled ‘Poor numbers: how we are misled by African development statistics and what to do about it’. To get a grip on reliability issues we identified a number of uncertainty sources and propose ways to check the quality of specific indicators, with special reference to individual countries. One suggestion is to incorporate the World Bank national-based statistical capacity indicator in statistical analyses.
Furthermore, we show how all sources of uncertainty interact by comparing a range of composite indicators published by various institutes. These comparisons are based on visual presentations (scatterplot matrices based on 191 countries) and corresponding statistics (correlation matrices). The results vary across the composites chosen. For example, indicators for governance and corruption show surprising high correlations (correlations between 0.63 and 0.98). However, those for the impacts of natural disasters correlate low to very low (correlations between 0.15 and 0.52). These low correlations can be explained from deviating choices made by institutes as for disaster impacts (people affected, people killed and/or economic damage), in combination with absolute or relative impact measures (i.e., impacts relative to population size or GDP). Finally, we compare three composite indicators for 'total risk' as published by CERF, JRC and the Fund for Peace. These three composites show a strong coherence (correlations ≥ 0.84), which is an important positive finding since financial aid in humanitarian crises are based on these indicators.
1 Introduction
1.1 Setting the scene
The potential links between climate change, weather patterns, migration and conflict have received growing attention from scientists, media and global institutions over the last decade. The global risk report 2016 by the World Economic Forum presented the failure of climate change mitigation and adaptation and water crises as respectively the first and third most impactful global risks posing significant threats to people, institutions and industries (World Economic Forum, 2016). But despite the increasing role of climate change in global security analyses and conventions, research on climate, weather and conflict has not fully matured or reached consensus on the existence of causal
relationships.
An influential study by Hsiang and Burke (2014) found evidence that climatic events, both slow and fast onset events, influence numerous types of conflict at all scales based on the examination of 50 quantitative empirical studies. However, the study’s conclusion that there is strong support for causal associations between climatological changes and conflict has been questioned and criticised by a leading group of scientists, for three reasons. Buhaug et al. (2014) argue that (i) there is a considerable overlap between the case studies used, (ii) the studies used are too heterogeneous to assume causal
homogeneity, and (iii) the studies used are not representative for the overall field of inquiry.
The discussion between Hsiang and Burke (2014) and Buhaug et al. (2014) is an exemplary example of the lack of consensus on direct and causal relationships. But quantitative evidence of risks related to climate and conflict dominate in current discussions about security implications, and are of major importance for policymakers (Detges, 2017). There is increasing evidence though that the effects of climate change, mainly manifested via water-related hazards, negatively affect human security in various ways and that these impacts will increase (Adger et al., 2014). Especially poor people in fragile countries are likely to be hit, increasing social and economic inequality (World Bank Group, 2016).
In this report, a broad range of global databases have been quantitatively linked on country level, in order to analyse relationships between socio-economic indicators, climatic/weather indicators, indicators for food production and political indicators, and to assess reliability of databases covering corresponding topics. Since climate change and weather manifest itself mainly via water-related hazards, special attention has been given to water-related indicators. Examples are the impacts of weather-related disasters (droughts and floods), a measure for aridity and the accessibility of clean water sources per capita.
Relationships between socio-economic, environmental and political variables are complex and context specific. Maps and graphs based on statistical analysis can tell stories that make this information easier to understand. Figure 1.1 provides an in-depth example.
The graph shows areas with varying amounts of precipitation, climate hot spots, locations of oil and natural gas extraction, locations of silver, gold and uranium mines, human-made water canals and pumps, locations of frozen and active conflicts, military presence of army from the USA, Europe and Africa, locations of UN peace keeping operations, main migration routes, and more.
Figure 1.1 Sub-Saharan Africa including infrastructures, military presences, oil and natural gas extraction, mines, rainfall, climate hotspots, conflicts and migration (PSI, 2015).
But like all scientific methods, quantitative statistical analyses have their limitations, as no method is superior to all other forms of research on climate and conflict. It is
therefore important to combine insights from qualitative and quantitative forms of research. This report is directed to the quantitative, statistical approach, but is linked to the PBL hotspot study entitled ‘The Geography of Future Water Challenges’,
commissioned by the Interdepartmental Water Cluster (IWC). See Ligtvoet et al. (2018) and the more qualitative reports on climate, water and conflict relationships: Ligtvoet et al. (2017) and De Bruin et al. (2018).
We note that the study presented here has strong links to the Sustainable Development Goals (SDGs), shown in Figure 1.2. Many water-related indicators show such links (Ligtvoet et al., 2018, pages 12 and 13). A number of other indicators addressed in this report, have such connections as well. We name Good Health and Well-being (SDG 3),
Reduced inequalities (SDG 10) and Peace, Justice and strong Institutions (SDG 16). Also see the PBL infographic publication on SDGs.
Next to that, this report has links to the IPCC special report on the impacts of global warming of 1.5 ºC above preindustrial levels and related global greenhouse gas emission pathways, in the context of strengthening the global response to the threat of climate change, sustainable development, and efforts to eradicate poverty (IPCC, 2018). Many indicators discussed in this report are linked to adaptation and governance issues addressed in the IPCC Chapters 3, 4 and 5.
Figure 1.2 Overview of the 16 Sustainable Development Goals (SDGs) as presented on the UN
Sustainable Development knowledge platform. Many of the global indicators and global composite indicators presented in this report are related to these SDGs, notably to SDGs 1, 2, 3, 4, 5, 6, 8, 10, 13, 15 and 16, and may well serve for monitoring purposes.
1.2 Conceptual approach, quantitative analyses
What are the major origins and drivers of the various types of conflict? Sorting out the main causes of conflict and war is difficult and often shaped by ideological beliefs. Even today, historians and political scientists still debate the primary causes of the First World War (Collier, 2007).
There are several types of conflict, ranging from state failure, international and civil war to local conflict, riot and revolution. There are numerous theories that explain the various types of conflict, which mostly focus on economic conditions and a range of factors that can foster grievances and greed, creating the incentive for people to initiate or join a conflict. People
and the organisations they belong to, need reasons to start a conflict, whether these are legitimate or not. Limited prospects for development, poverty, large economic and social inequality (e.g. discrimination), grievances due to former conflict, and unequal distribution of resources can all be motives for rebellion against authorities (Collier, 2007; Bara, 2014). These perceived reasons to start a conflict may only materialise under certain circumstances. A united and competent regime will be able to handle potential insurgents as well as shocks such as natural disasters, while under weakened and paralysed regimes, insurgencies may lead to civil war or oppression (Goldstone et al., 2010; Besley and Persson, 2011).
In this report, several conditions affecting conflict risk in a broad sense are introduced that are deliberated in academic and popular literature. A number of these conditions or 'drivers' are summarised in the lower left part of Figure 1.3. This graph is taken from Ligtvoet et al. (2018) and illustrates how conflict and violence relates to (i) water-related impacts and climate change, and (ii) migration and displacement. However, the graph shows that other drivers, such as governance quality, economic inequality or the history of local and regional conflicts in countries, also are connected to violence and conflict.
In part, these connections are illustrated in the report of De Bruin et al. (2018) where water security threats are explored in relation to conflict. Here, 10 pathways are identified that clearly show how water security and other drivers of conflict such as inequality, grievances, (local) poverty or economic shocks are interwoven.
The approach in the present study is to identify a hierarchy in conflict drivers - shown in Figure 1.3 - using various statistical techniques, ranging from scatterplot matrices and correlation matrices to non-linear regression tree analysis in a multivariate setting of potential drivers. Such a hierarchy might allow a prioritisation in diplomatic and security policy agendas as formulated within the Planetary Security Initiative. This initiative was launched in 2015 by the Netherlands Ministry of Foreign Affairs.
It has to be noted that the outbreak of a conflict is multifaceted and the effects and complex interactions of conflict variables are context specific. This makes predicting conflicts hard and controversial (Cederman and Weidmann, 2017). Therefore, our aim is to identify direct, intermediate and more fundamental drivers of conflict and violence rather than predicting such outbreaks, as done by Fearon (2010), Goldstone et al. (2010), Hegre et al. (2011, 2016), Ward et al. (2013), Halkia et al. (2017) and Witmer et al. (2017). Here, we interpret the term 'driver' not persé in terms of a 'causal relation', but more in terms of conditions that relate to violence and conflict. The topic of causality in relation to our findings will be
Figure 1.3 Scheme taken from Ligtvoet et al. (2018, p. 74), illustrating the complex relationships between (i) violent conflicts and its potential drivers, (ii) migration and displacement and (iii) water-related impacts and climate change. In this report, we try to find a hierarchy in drivers: from drivers that show direct and intermediate relationships to violence and conflict, to those that are more fundamental in nature.
1.3 Aim of the study and outline of Parts I and II
The aim of this study is fivefold:1. To give an overview of available human security indicators and frameworks, on an aggregated country basis. Special attention is given to temporal and spatial coherence patterns and quality assurance of the databases. Indicator frameworks are important to identify countries with high security risks, leading to priorities for humanitarian help (e.g. the UN Central Emergency Fund). Another application, although not explicitly addressed in this study, is the monitoring of the
Sustainable Development Goals as formulated by the United Nations (Figure 1.3 and the UN website).
2. To support the storylines of the project on water-related hotspots, in particular, the models used for mapping future water challenges (Ligtvoet et al., 2018), those used for linking water security threats to conflict (De Bruin et al., 2018), and related PBL activities under the Planetary Security Initiative (e.g. Ligtvoet et al., 2017).
3. To perform a comparative study of composite risk indicators focusing on security threats and conflicts.
4. To perform statistical analyses of conflict drivers as proposed in the related literature. Special attention is paid to water-related indicators: water availability, water-related disasters, sanitation, infrastructure and drylands. These analyses are not directed towards the prediction of conflict outbreaks such as described by Cederman and Weidman (2017), but are meant to identify those conflict drivers that show a direct, intermediate or more fundamental relationship to conflict indicators. We address three conflict indicators: (i) the Global Peace Index, (ii) the number of people displaced by conflicts, including refugees, and (iii) the number of people who died due to violence and conflict.
5. To evaluate findings. Are statistical inferences substantiated by the literature on conflict, human security and climate change? What have we learned?
The current report, Part I of this study, focuses on the database (aims 1, 2 and 3), including the reliability issues. Chapter 2 describes the leading institutions and their databases covering all aspects of human security, and Chapter 3 discusses the composite indicator frameworks based on these databases. Chapter 4 addresses the temporal and spatial dependencies, and Chapters 5 and 6 describe the quality of composite indicators. Part II of this study is presented in a report entitled 'Statistical inferences using machine learning techniques' (separate publication). It provides statistical analyses (aims 4 and 5), an overview of conflict drivers given in the literature, and derives three indicators for the intensity of conflict and violence, followed by a description of the statistical
methodology used. Those three indicators serve as dependent variables in the statistical analyses. Figure 1.4 below gives an overview of the drivers chosen. These drivers are discussed and non-linear relationships are studied, applying a machine learning technique, called Regression Trees.
Figure 1.4 Overview of the conflict drivers addressed in Part II of this study. This 'driver carrousel' is a more detailed version of that shown in the lower left part of Figure 1.3. Factors (1) through (8) are used in a non-linear statistical context by use of so-called Regression Trees. Factors (9) through (13) are treated separately.
(Violent)
Conflict
7 Infant mortality and malnutrition 8 Water-related impacts &climate change interferences, 9 Intern.
10 Geography, 11 Religion & ethnicity, 12 Migration, 13 history of conflict 4 Demographics & education 3 Effective governance & corruption 2 Grievances & discrimination 1 Economic inequality & poverty 5 Availability of resources (oil, fertile land, ores) 6 Conflicts in neighboring countries
2 Human security indicators,
based on country statistics
2.1 National-based indicators: pros and cons
Throughout this report, we use indicators and composite indicators based on country
statistics. This choice has the important advantage of having numerous indicators available—
often publicly—for human security and conflict studies. A second advantage is the global scope of data. Most indicators are available for around 190 countries in the world (or fewer countries, when those with small populations are left out).
Therefore, this study does not suffer from the so-called 'streetlight effect', as described in a recent study by Adams et al. (2018, plus discussions), who argue that claims regarding climate-conflict links are overstated because of sampling bias. This sampling bias comes from analysing only country or regional data for which climate and/or conflicts are extreme and disregarding other regions that are more 'in the middle'. Since we treat all countries on all continents equally, this study circumvents such a bias.
However, choosing countries as the main scale unit has drawbacks too. The first drawback is illustrated in Figure 2.1. The world map is distorted since all countries are plotted on equal level, with identical areas. The map shows for example that, due to the large number of countries in Africa (55) and the small number of countries in North America (23) and South America (12), the African continent will be awarded more weight in the statistical analyses in Part II of this study, simply because 55 >> (12 + 23). The only exception here is if 'the number of people per country' is used as an explanatory variable in a statistical regression setting. This number is correlated with 'area', a variable not explicitly used in our analyses. A second drawback of a national-based approach is that patterns of poverty, corruption or conflicts may play on local, subnational scales rather than on a national scale. This holds especially for intrastate conflicts (rebel and guerrilla groups), where local factors play a dominant role, such as easy access to exploitable resources (oil, mining, water), social inequality and corruption, and rough terrain (for hiding). Countries may contain regions with varying degrees of autonomy, and not only one type of political system or one official regime, at any given time. These aspects are studied in detail by Buhaug (2005, Chapters 5 and 6). Another approach, on subnational levels, is given by the Joint Research Centre (JRC) in its INFORM index for risk management (see Figure 2.2).
Figure 2.1 The traditional world map is distorted, this to symbolise that all countries are treated as equally important in statistical analyses (all countries are given equal areas). For example, countries in Africa are awarded more weight in the analyses than those in North and South America (55 countries and 35 countries, resp.).
In contrast, we use countries as whole entities. One argument — apart from the widespread availability of national-scale statistics, and the absence of local quality data — is that we do not aim to predict the onset and/or duration of any conflict, be it intrastate or interstate. We aim to quantify the peacefulness or non-peacefulness of countries as a whole, and to find indicators that show direct or more fundamental relationships to the level of violence and conflicts.
Figure 2.2 The INFORM index for risk management allows for subnational analyses. See report
2.2 Databases
2.2.1 CRED and Munich Re: disaster databases
In 1988, the Centre for Research on the Epidemiology of Disasters (CRED) launched the Emergency Events Database (EM-DAT). EM-DAT was created with the initial support of the World Health Organization (WHO) and the Belgian Government.
The main objective of the database is to serve the purposes of humanitarian action at national and international levels. The initiative aims to rationalise decision making for disaster preparedness, as well as to provide an objective base for vulnerability assessment and priority setting.
EM-DAT contains essential core data on the occurrence and effects of over 22,000 mass disasters in the world from 1900 to the present day. The database is compiled from various sources, including UN organisations, non-governmental organisations, insurance companies, research institutes and news services.
There are a great number of publications that base their analyses on data from EM-DAT. We refer to the EM-DAT website: http://www.emdat.be/publications . PBL publications based on EM-DAT are Visser et al. (2012) and Visser et al. (2014).
The CRED database comprises eight categories of disasters:
1. Hydrological hazards. These are coastal, river and flash floods (or, more generally, hazards caused by the occurrence, movement, and distribution of surface and subsurface freshwater and saltwater).
2. Climatological hazards. These are droughts and heat waves (or, more generally, hazards caused by long-lived, meso- to macro-scale atmospheric processes ranging from intra-seasonal to multi-decadal climate variability).
3. Meteorological hazards. These are storms and cyclones (or, more generally, hazards caused by short-lived, micro- to meso-scale extreme weather and atmospheric conditions that last from minutes to days).
4. Geophysical hazards. These are earthquakes and tsunamis (or, more generally, hazards originating from solid earth. This term is used interchangeably with the term geological hazard).
5. Biological hazards. These comprise all forms of epidemics (or, more generally, hazards caused by the exposure to living organisms and their toxic substances— such as venom, mould—or vector-borne diseases that they may carry. Examples are venomous wildlife and insects, poisonous plants, and mosquitoes carrying disease-causing agents such as parasites, bacteria, or viruses, such as malaria). 6. Technological hazards. These are technological disasters such transportation
accidents or industrial explosions.
7. Complex hazards. Complex disasters are major famine situations for which drought was not the main causal factor.
8. Extra-terrestrial hazards. This category covers hazards caused by asteroids, meteoroids and comets. The database contains only one such a disaster.
Categories 1, 2 and 3 are denoted in this report as ‘weather-related’, categories 1, 2 and 4 (tsunamis only) as ‘water-related’. Furthermore, we denote categories 4 to 8 as ‘non-weather-related disasters’ (although categories 5 and 7 have some relation to weather conditions).
The database consists of five impact indices: (i) people killed, (ii) people injured, (iii) total people affected, (iv) people becoming homeless and (v) direct economic damage. We note that global time series for economic damage and total people affected are shown in Figure 4.2A. Idem for total people killed and the number of reported disasters in Figure 4.2B. For the Planetary Security Initiative, we downloaded the full data set (1900-2015), which contains all disaster categories, all impacts and all countries in the world. Since data before 1980 are unreliable, our data start in 1980 (Visser et al., 2012). Examples are given in Figure 2.3A.
Disaster data from CRED are open access. However, other data sets exist as well, be it on a commercial basis. We name Munich Re and Swiss Re. As for Munich Re, data cannot be approached directly, but summary statistics and global maps are available from their
website. See for example Figures 2.3B and 23C, and the NatCatSERVICE website. Important publications are Topics Geo 2016 and Topics Geo 2017, available from the same website. We use data from Munich Re in Section 5.3 and Figure 5.3 to show how disaster data from CRED and Munich Re relate. An example for the year 2015 is given in Figure 2.3B. Next to that the Munich Re website allows for interactive plotting of four disaster categories where the period can be chosen between 1980 and 2016. Figure 2.3C gives an example of all meteorological, hydrological and climatological events that occurred on a global scale over the 1980–2016 period.
Figure 2.3A Examples of global drought impacts (lower left panels) and global flood impacts (upper
right panels). Data are taken from the CRED Emergency Event Database EM-DAT and averaged over the 1996–2015 period. Graph taken from Ligtvoet et al. (2018).
Figure 2.3B Natural disasters for the year 2015. Disasters are categorised into four groups: geophysical (red), meteorological (green), hydrological (blue) and climatological (orange). Source: Munich Re.
Figure 2.3C Weather-related disasters in the 1980–2016 period. Disasters are given in three
categories: meteorological (green), hydrological (blue) and climatological (orange). This graph is made by an interactive tool where averaging period and type of disasters can be varied. Source: Munich Re.
2.2.2 FAO: food- and water-related issues
The Food and Agriculture Organization of the United Nations (FAO) is the global organisation for food and agriculture founded in 1943 and funded by the United Nations (UN). The main aim of this globally leading organisation is the achievement of food security for all, including the present and future sustainable management of resources and economic and social progress. The FAO is active, all around the world, in food security and distribution projects and performs studies on food security, including an annual report about the state of food security and nutrition in the world.
The FAO developed a set of indicators aiming to capture various aspects of food (in)security. The indicators are classified along four dimensions of food security; availability, access, utilisation and stability (Table 2.1). The database brings together indicators from among others the FAO, the World Health Organization (WHO), the World Bank (WB) and UNICEF. The indicators have been chosen based on expert judgement and the availability of data with sufficient coverage.
2.2.3 World Bank Group: economic development
The World Bank Group is a family of five international organisations that make leveraged loans to developing countries. It is the largest development bank in the world and is an observer at the United Nations Development Group. The bank is based in Washington, D.C. and provided around USD 61 billion in loans and assistance to developing and transition countries in the year 2014. The bank's mission statement is to achieve the twin goals of ending extreme poverty and building shared prosperity. Total lending, as of 2015, over the last 10 years through Development Policy Financing, was approximately USD 117 billion. Its five organisations are the International Bank for Reconstruction and Development (IBRD), the International Development Association (IDA), the International Finance Corporation (IFC), the Multilateral Investment Guarantee Agency (MIGA) and the International Centre for Settlement of Investment Disputes (ICSID). The first two are sometimes collectively (and confusingly) referred to as the World Bank.
The World Bank's (IBRD and IDA) activities are focused on developing countries, in fields such as human development (e.g. education, health), agriculture and rural development (e.g. irrigation and rural services), environmental protection (e.g. pollution reduction, establishing and enforcing regulations), infrastructure (e.g. roads, urban regeneration, and electricity), large industrial construction projects, and governance (e.g. anti-corruption, legal institutions development). The IBRD and IDA provide loans at preferential rates to member countries, as well as grants to the poorest countries. Loans or grants for specific projects are often linked to wider policy changes in the sector or the country's economy as a whole. The World Bank Group is one of the most powerful international organisations. The
organisation has often been criticised for the dominant influence of the United States (Wade, 2002), and not taking local cultures, rights and needs into account (Sarfaty, 2017).
The World Bank Group has on open access policy on data and presents a number of development indicators on a global basis, along with tables, graph facilities and metadata. Data are on country basis and often start in the year 1960. See Table 2.2.
2.2.4 Transparency International and World Bank: corruption and governance The indicator that is used for governance in Part II of this study is a composite indicator compiled using the Corruption Perceptions Index by Transparency International
(Transparency International, 2018) and Governance Effectiveness part of the worldwide governance indicators developed by the World Bank (Kaufman and Kraay, 2015). The rationale of this choice is given in Part II. The underlying indicators are described here. Governance is a concept defined in many different ways. The definition followed by the World Bank for their world governance indicators is as follows (Kaufman and Kraay, 2015):
Governance consists of the traditions and institutions by which authority in a country is exercised. This includes the process by which governments are selected, monitored and replaced; the capacity of the government to effectively formulate and implement sound policies; and the respect of citizens and the state for the institutions that govern economic and social interactions among them.
Transparency International – Corruption Perception Index
Transparency International has been funded in 1993. Today, the organisation is present in more than 100 countries, advocating against the abuse of public office for private gain. Transparency International aims to be politically non-partisan and is committed to advancing accountability, integrity and transparency worldwide. The organisation is funded by
government, multilateral institutions, foundations, the private sector and private citizens. Every year, the Corruption Perceptions Index (CPI) is published, which ranks 180 countries and territories by their perceived levels of public sector corruption according to experts and business people. The CPI scores and ranks countries based on how corrupt a country’s public sector is perceived to be. It is a composite index, a combination of surveys and assessments of corruption, collected by a variety of reputable institutions such as Freedom House.
Robustness checks were performed by the JRC in 2012 (Saisana and Saltelli, 2012). World Governance Indicators
The World Governance Indicators (WGI) project reports aggregate and individual governance indicators for 200 countries and territories over the 1996–2016 period. The set of worldwide governance indicators comprises the following six dimensions (indicators):
• Voice and Accountability (VA)
• Political stability and Absence of violence (PA) • Government Effectiveness (GE)
• Regulatory Quality (RQ) • Rule of Law (RL)
• Control of Corruption (CC)
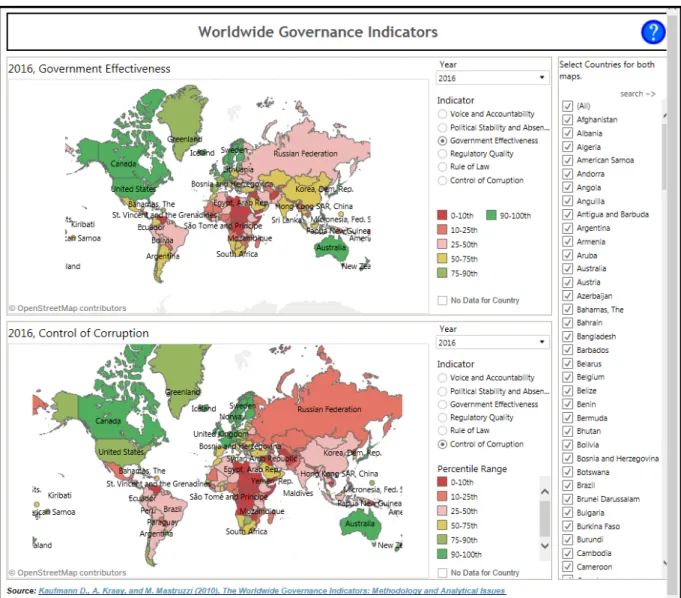
For the JRC governance composite the indicator ‘Government Effectiveness’ was chosen. It reflects the perceptions of the quality of public services, the quality of the civil service and the degree of its independence from political pressures, the quality of policy formulation and implementation, and the credibility of the government's commitment to such policies. Data can be downloaded or shown in tables and graphs such as shown in Figure 2.4.
Figure 2.4 Two governance indicators on a global scale for the year 2016. Data are taken from the
World Bank. This site allows for interactive plotting of the six governance dimensions.
We note that governance should not be interpreted as the level of democracy of countries. An indicator for the latter is the Polity score. Polity scores range from -10 up to +10, where values from -10 to -6 point to autocracies, -5 up to +5 to anocracies, and values from 6 to 10 to democracies (systemicpeace.org/polity).
2.2.5 United Nations: human development and population dynamics
The United Nations Development Programme (UN-DP) is the UN body governing, promoting, implementing and assessing the sustainable development goals (SDGs, Figure 1.2), defining the global 2030 agenda. The UN-DP also monitors human development on a country level: first published in 1990 and annually since then. The Human Development Reports have introduced a new approach for human well-being, an approach beyond economic development. The Human Development Report focuses on people, their functioning, capabilities and their voice and autonomy (UN-DP, 2016). See Figure 2.5A.
Figure 2.5A UN-DP theoretical approach towards Human Development.
Human development is quantified based on five composite indicators. The Human Development Index (HDI) integrates three basic dimensions of human development; life expectance at birth, schooling (mean years and expected years) and the gross national income per capita. The second composite indicator, the inequality-adjusted HDI, discounts the HDI according to the extent of inequality. The Gender Development Index compares female and male HDI values; the Gender Development Index analyses women’s
empowerment. The last composite indicator of human development is the Multinational Poverty Index, which measures assessing variables that go beyond poverty measured in monetary terms, such as access to public services and certain types of housing.
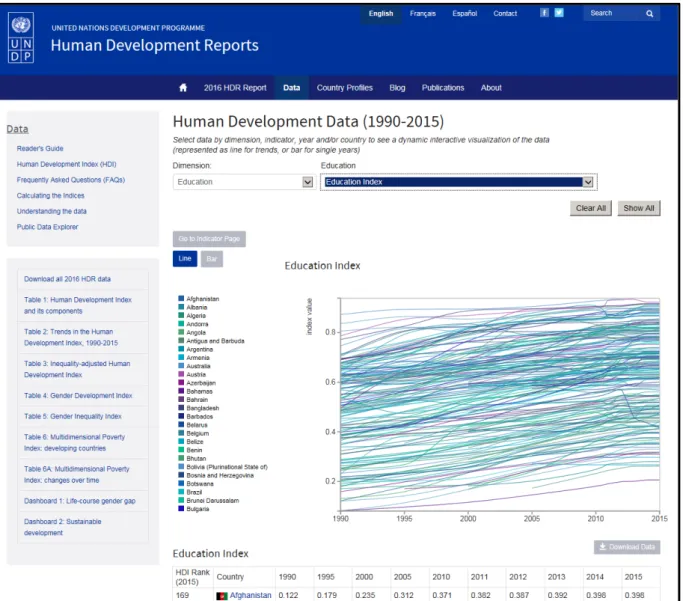
The data for the UN-DP reports come from a range of UN organisations (including the FAO, WHO, UNICEF and UN Women), as well as from CRED EM-DAT, EUROSTAT, Gallop, ICF Macro Demographic & Health Services, the Syrian Centre for Policy Research, Luxembourg Income Study, Inter-Parliamentary Union, International Monetary Fund, the World Bank, International Labour Organization, Internal Displacement Monitoring Centre and the International Centre for Prison Studies. See Figure 2.5B for an example.
Figure 2.5B Data from the UN Development reports can be downloaded from here: http://hdr.undp.org/en/data# . The site allows for interactive plotting of data.
Leading population data are supplied by the United Nations population division and published as World Population Prospects 2017. The 2017 Revision of World Population Prospects is the 25th round of official United Nations population estimates and projections that have been prepared by the Population Division of the Department of Economic and Social Affairs of the United Nations Secretariat.
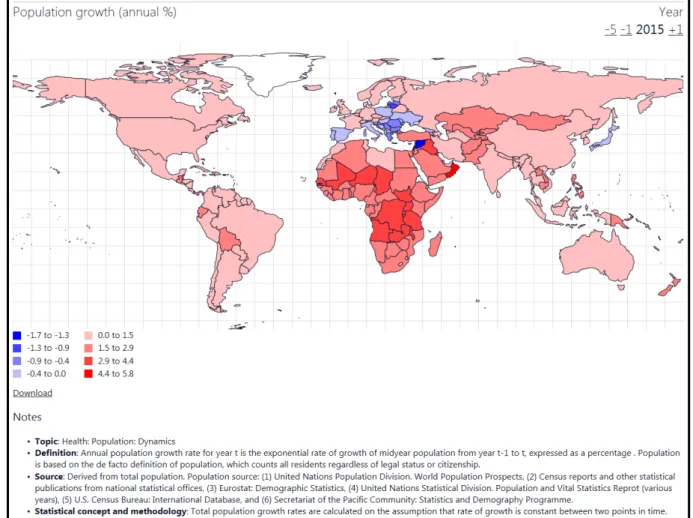
The main results are presented in a series of Excel files, displaying key demographic indicators for each development group, income group, region, sub-region and country or area, for selected periods or dates within the 1950–2100 period. Data can be downloaded here. Figure 2.5C gives an example of annual population growth, for the year 2015.
Figure 2.5C National-based population growth for the year 2015. Data are in %. Source:
https://www.populationpyramid.net/hnp/population-growth/2015/
Another characteristic of population, its age structure, has been identified by several studies as a risk factor for conflict. Countries that have a large youth population relative to the older generations (also called a ‘youth bulge’), are found to face higher risks of conflict, especially under conditions of economic stagnation (Urdal, 2011; LaGraffe, 2012; Hegre et al., 2013). Youth bulges have been linked to rioting and revolution in societies with little economic prospects for young people. A study by Nordas and Davenport (2013) found that large youth cohorts increase the repression of state authorities, since the younger population is more likely to challenge authority.
Figure 2.5D gives an example of such ‘age pyramids’, for China, Nigeria, the Netherlands and Syria. Youth bulge indicators directly follow from these age pyramids, i.e. a relatively large percentage of young people in the age group 15 to 24.
Figure 2.5D Four age pyramids with quite different shapes. Data can be found here. The
percentage of population younger than 20 years of age is around 23% for China, 54% for Nigeria, 49% for Syria and 23% for the Netherlands.
2.2.6 Institute for Economics & Peace: conflict-related indicators
The institute for Economics & Peace is a non-profit and independent think tank founded in 2007 and funded by Australian IT entrepreneur and philanthropist Steve Killelea. The institute focusses on developing metrics to analyse peace and uncovering the relationships between business, peace and prosperity. IEP has four areas of key research: measuring peace, positive peace1, the economics of peace and risks. The main product of the institute is their annual Global Peace Index (GPI), ranking the relative peacefulness of 162 of the world’s nation states.
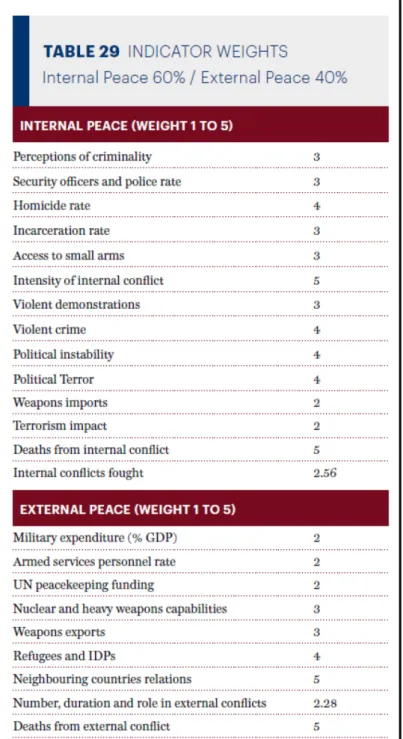
The GPI is based on 23 indicators in three overarching categories: ongoing domestic and international violence; societal safety and security and militarisation. See Table 2.3. The indicators have been selected and weighted by experts from all around the world and are sourced from the latest available data, from a wide range of international institutes: the Uppsala Conflict Data Program (UCDP), International Institute for Strategic Studies (IISS), qualitative assessments by The Economist Intelligence Unit (nine indicators), qualitative assessments by Amnesty International and the US State Department annual reports, Global Terrorism Index, World Prison Brief, Institute for Criminal Policy Research at Birkbeck, United Nations Office, The Military Balance, IISS on Drugs and Crime (UNODC), surveys on Crime Trends and the Operations of Criminal Justice Systems (CTS), Stockholm International Peace Research Institute (SIPRI) and the UN Register of Conventional Arms.
1 Positive peace goes beyond just the absence of violence: ‘Positive Peace represents the capacity for a society to meet the needs of its
Table 2.3 Indicators underlying the Global Peace Index. These indicators are available for 163 countries. See Appendices A and B in IEP (2017).
2.2.7 Uppsala Conflict Data Program and UNODC: conflict- and violence-related deaths
The Uppsala Conflict Data Program (UCDP) is an online, open-source database keeping track of the state of armed conflict in the world. The UCDP has been established in the mid 1980s by the department of Peace and Conflict Research of the Uppsala University. The database is widely used and updated several times a year, containing information since 1946. The UCDP distinguishes three types of conflict: state-based, non-state violence and one-sided violence. The database also contains detailed information on armed conflict, peace agreements and other aspects of organised violence. The UCDP is mainly funded by external organisations: various research foundations and government organisations have supported the program, as well as the Bank of Sweden Tercentenary Foundation, the Swedish Research Council beside the Uppsala University.
The results of the UCDP are published in the annual report series States in Armed Conflict (1987–2012), in the SIPRI Yearbook since 1988, the Journal of Peace Research since 1993 and in the Human Security Reports since 2005. Numerous articles and databases make use of the UCDP Data Program. See Figure 2.6A
Figure 2.6A The website of the Uppsala Conflict Data Program (UCDP) gives interactive information
on conflict-related deaths, divided into three categories: state-based violence, non-state violence and one-sided violence. Information is given on maps and as time series. Source: the UCDP website .
UCDP collects information about conflict via diverse sources. For each country, a specified set of sources is selected, including major newswires (Reuters, AFP, Xinhua, EFE) and BBC monitoring (local media). A second source is information from publications of academic
articles, case studies, NGO reports and books. When data is not clear or contradiction exist, regional experts are consulted.
For the present study we used three UCDP data sets on deaths from violent conflict, on a country basis: (i) deaths due to state-based conflicts, also denoted as 'battle-related deaths', (ii) deaths due to non-state violence and (iii) deaths due to one-sided violence. Sample period is 1989 to 2016, for all three databases. Definitions are as follows (taken from Melander, 2015):
• State-based conflict is armed conflict between two national governments (i.e., interstate conflict) such as the one between Ethiopia and Eritrea in 1998-2000, or between a government and rebel organisation (i.e., intrastate conflict) such as the conflict between the Government of Colombia and the Revolutionary Armed Forces of Colombia (FARC).
• Non-state conflict refers to armed conflict between two organised actors, neither of which is a nation state. Examples of non-state conflicts include the conflict between the Islamic State (IS) and the Kurdish Democratic Union Party (PYD) in Syria, as well as that between Hindus and Muslims in India.
• One-sided violence is when an organised actor (a nation state or some organised non-state actor) kills unarmed civilians, such as the violence committed by the government and associated militias in Rwanda in 1994, and the violence committed more recently, in Nigeria, by Jama'atu Ahlis Sunna Lidda'awati wal-Jihad, commonly known as Boko Haram.
In addition to these conflict-related databases, we downloaded a database on violence-related deaths compiled by the United Nations Office on Drugs and Crime (UNODC in short). The database contains intentional homicides on country basis. See Figure 2.6B for the relationship between homicides and the UCDP databases. Sample period is 2003–2015. UNODC gives the following definition and limitation:
• Intentional Homicide means unlawful death purposefully inflicted on a person by another person. Data on intentional homicide should also include serious assault leading to death and death as a result of a terrorist attack. It should exclude attempted homicide, manslaughter, death due to legal intervention, justifiable homicide in self-defence and death due to armed conflict.
• When using the figures, any cross-national comparison should be conducted with caution, because there are differences in legal definitions of offences between countries, between methods of offence counting and recording, and between shares of criminal offences that are not reported to the police or remain undetected by law enforcement authorities.
Part II of this study uses homicides on a country basis and averaged over the years 2011– 2015. If data are missing, the average is taken over the years where data are available.
Figure 2.6B UNODC definitions of violent deaths. Data used here are for 'Intentional homicide'.
Details are given on the UNODC website.
2.2.8 Sustainable Development Solutions Network: World Happiness
The UN Sustainable Development Solutions Network (SDSN) has been operating since 2012 under the auspices of the UN Secretary-General. Annual reports present country specific scores of happiness, based on among others income, work, community and governance, values and religion, as well as internal factors such as mental health, education, and gender and age.
SDSN mobilises global scientific and technological expertise to promote practical solutions for sustainable development, including the implementation of the Sustainable Development Goals (SDGs) and the Paris Climate Agreement. SDSN aims to accelerate joint learning and promote integrated approaches that address the interconnected economic, social, and environmental challenges confronting the world. SDSN works closely with United Nations organisations, multilateral financing institutions, the private sector, and civil society. Since 2012 SDSN publicises an annual report on global happiness (social well-being). See
http://worldhappiness.report/ . For this report we download their happiness index for 115 countries.
2.2.9 IDMC, UNHCR, UN-DESA and IOM: IDPs, refugees and migrants
The Internal Displacement Monitoring Centre (IDMC) and the United National Refugee Agency (UNHCR) both keep track upon displacement. The UNHCR, created in 1950 during the aftermath of the Second World War, is the UN organisation protecting and assisting refugees around the world. With a budget of 7.7 billion, programmes supporting operations and emergency programmes are financed. The UNHCR is for 87% funded by governments and the European Union and collects her data about the global numbers of refugees, by registering the number of people and using biometrics to optimise numbers. The numbers are published annually in the UNHCR’s Global Report. These reports include financial, regional, and thematic information about refugees and projects.
The IDMC is a non-profit organisation, set up in 1998, carrying out research on the drivers, patterns and impact of internal displacement resulting from conflict and violence, disasters and climate change, and development investments. The IDMC is funded by a range of government organisations and NGOs, including USAID, the European Commission and UNHCR. Data is collected by monitoring displacement situationally (when it comes to conflicts or to disaster-induced events). The IDCM uses data sources including government authorities, UN organisations, related global databases, NGOs and news media. Report are published annually, per country presenting the number of displaced people, distinguishing between new and existing displacements. A Displacement Data Exploration Tool can be found here: http://www.internal-displacement.org/database/displacement-data-exploration-tool.
An example is given in Figure 2.7.
The International Organization for Migration (IOM) was founded in 1951, out of the chaos and displacement of Western Europe following the Second World War. Mandated to help European governments to identify resettlement countries for the estimated 11 million people uprooted by the war, it arranged transport for nearly a million migrants during the 1950s. From its roots as an operational logistics organisation, it has broadened its scope to become the leading international organisation working with governments and civil society to advance the understanding of migration issues, encourage social and economic development through migration, and uphold the human dignity and well-being of migrants.
The broader scope of activities has been matched by rapid expansion from a relatively small organisation into one with an annual operating budget of an estimated USD 1.4 billion and some 9,000 staff working in over 150 countries, worldwide. IOM currently has 165 Member States and a further 8 states holding Observer status. Since 2000, IOM has been producing world migration reports. This World Migration Report 2018, the ninth in the world migration report series is meant to better contribute to increase the understanding of current and strategic migration issues throughout the world.
IOM defines migrants as any persons who are moving or have moved across an international border or within a nation state — away from their habitual place of residence — regardless of (1) these people’s legal status, (2) whether the move was voluntary or involuntary, (3) what the reasons for the move were, or (4) the length of their stay.
We note that data for total internal migration in countries are difficult to find. Next to internal displacements due to natural disasters or conflicts, other (economic) drivers exist, leading to urbanisation trends in many countries. Urbanisation trends are estimated by the United Nations Population Fund (UNFPA) but overlap with other displacements.
Box 2.1 UNHCR definition of refugees and migrants
With more than 65 million people forcibly displaced, globally, and boat crossings of the Mediterranean Sea still regularly in the headlines, the terms ‘refugee’ and ‘migrant’ are frequently used interchangeably in both the media and public discourse. However, there is an important difference between the two.
Refugees are persons fleeing armed conflict or persecution. There were 21.3 million
refugees worldwide, at the end of 2015. Their situation is often so perilous and
intolerable that they cross national borders to seek safety in nearby countries, and thus become internationally recognised as ‘refugees’ with access to assistance from nation states, UNHCR, and other organisations. They are recognised as such precisely because it is too dangerous for them to return home, and they need sanctuary elsewhere. These are people for whom denial of asylum, potentially, has deadly consequences.
Refugees are defined in and protected under international law. The 1951 Refugee Convention and its 1967 Protocol, as well as other legal texts, such as the 1969 OAU Refugee Convention, remain the cornerstones of modern refugee protection. The legal principles they enshrine have permeated into countless other international, regional, and national laws and practices. The 1951 Convention defines who is a refugee and outlines the basic rights that nation states should afford refugees. One of the most fundamental principles laid down in international law is that refugees should not be expelled or returned to situations where their lives and freedom would be under threat.
Migrants choose to move, not because of a direct threat of persecution or death, but
mainly to improve their lives by finding work, or in some cases for education, family reunion, or other reasons. Unlike refugees, who cannot safely return to their home country, migrants face no such impediment. If they would choose to return, they would continue to receive the protection of their national government.
For individual governments, this distinction is important. Countries deal with migrants under their own immigration laws and processes. Countries deal with refugees according to the norms of refugee protection and asylum that are defined in both national
legislation and international law. Countries have specific responsibilities towards anyone seeking asylum within their territory or at their borders. UNHCR helps countries deal with their asylum and refugee protection responsibilities.
2.2.10 Joint Research Centre: basic indicators for human security and global risks The Joint Research Centre (JRC) is the European Commission’s science and knowledge centre. It was founded over 50 years ago and is currently located in five EU countries. All JRC data is fully accessible. One of the tools published by the JRC is the Global Conflict Risk Index (GCRI), an early warning system designed to provide policymakers with a global risk assessment, on a country level. This index shows the statistical risk of violent conflict in the next 1 to 4 years, based on 5 dimensions compiled of 24 indicators.
The five dimensions are centred around the domains of politics, security, society, economy, geography and environment. The 24 indicators come from open-source databases, such as those of UN organisations, UCDP, World Bank, FAO and the World Resources Institute (Collier, 2007; Smidt, 2016). The data were recently updated, up to the year 2017. See Table 2.4A.
Table 2.4A Overview of 24 indicators contained in the JRC Global Conflict Risk database.
INFORM is another global, open-source risks assessment developed by the JRC, to indicate the level of humanitarian crises and disasters on a country scale. Table 2.4B shows the underlying structure of the composite indicators, combining hazards and exposure with vulnerability and cooping capacity on a country level. This tool is used for informed decision making, particularly by the European Commission. The components consist of data from, among others, the FAO, the HIIK conflict barometer, EM-DAT CRED, the World Bank and several UN organisations.
Table 2.4B Overview of 53 INFORM indicators and their composites. Indicators 19 and 20 are taken from the GCRI database shown in Table 2.4A.
2.3 Summary of indicators for the Planetary Security
Initiative
One way of presenting the complex relations between environmental security, human security, political security and governance is given by Ligtvoet et al. (2017). See Figure 2.8. To ease analysis within the PBL projects on water-related studies and projects within the Planetary Security Initiative we have summarised the relevant indicators from Sections 2.2.1 to 2.2.9 within this frame work.
The results are summarised in four tables:
• Table 2.5: 16 indicators concerning environmental security, • Table 2.6: 16 indicators concerning human security,
• Table 2.7: 28 indicators concerning political security,
• Table 2.8: 17 indicators concerning adaptive capacity and governance.
Figure 2.8 Conceptual representation of the interactions between the physical environment,
human security and political conflict. Interactions are complex and context sensitive. Graph taken from Ligtvoet et al. (2017, p. 3).
Table 2.5 Indicators selected for Environmental security, as shown in the lower left corner of the scheme shown in Figure 2.8.
Name of core indicator Category Source
1 Primary economic damage from floods, drought or tsunamis, as percentage of GDP (PPP) Water-related disasters database EMDAT from CRED Annual averages over the 1996– 2015 period 2 Number of people affected by floods, drought or
tsunamis, as percentage of population
3 Number of people killed by floods, drought or tsunamis, as percentage of population
4 Primary economic damage from geophysical, weather-related, biological and technological disasters, as percentage of GDP (PPP)
Disasters from all sources 5 Number of people affected by geophysical,
weather-related, biological and technological disasters, as percentage of population
6 Number of people killed by geophysical, weather-related, biological and technological disasters, as percentage of population
7 Energy import/export as percentage of total energy use (based on oil equivalent computations)
Resources IEA, World Bank, 2014
8 Ores and metals exports, as percentage of merchandise exports
World Bank 9 Natural resources rents
10 Forest area as percentage of total land area 11 Agricultural land as percentage of total land area
12 Available drinking water per capita (m3) FAO Aquastat
13 Endangered mammals Ecosystems UNEP World
Conservation Monitoring Centre 14 Endangered plants
15 Endangered birds
Table 2.6 Indicators selected for Human security, as shown in the lower right corner of the scheme shown in Figure 2.8.
Name of core indicator Category Source
1 Public aid per capita Socio-economic OECD DAC
2 Net ODA received World Bank
3 Annual population growth as percentage (derived from exponential growth curve)
World Bank
4 Annual growth rate GDP as percentage World Bank, OECD
5 Children underweight, under 5 years of age Health UNICEF 6 Child mortality, under 5 years of age
7 Prevalence of HIV-AIDS, over 15 years of age
WHO 8 Tuberculosis prevalence
9 Malaria mortality rate
10 Prevalence of undernourishment Food security FAO
11 Domestic food price index
12 Domestic food price volatility index 13 Agricultural drought probability
(average 1985–2014)
14 Agriculture, value added (% of GDP) World Bank
15 Access to improved water source (% of population with access)
Water-related security
WHO/UNICEF 16 Access to improved sanitation facilities
Table 2.7 Indicators selected for Political security, as shown in the upper corner of the scheme shown in Figure 2.8.
Name of core indicator Category Source
1 Level of perceived criminality in society Internal conflict drivers
EIU Country Analysis team 2 Number of internal security officers and police
per 100,000 people
UNODC survey
3 Number of homicides per 100,000 people UNODC survey
4 Number of people jailed within the national population, per 100,000
International Centre for Prison studies
5 Ease of access to small arms and light weapons
EIU Country Analysis team 6 Intensity of organised internal conflict EIU Country Analysis team
7 Likelihood of violent demonstrations EIU Country Analysis team
8 Level of violent crime EIU Country Analysis team
9 Political instability EIU Country Analysis team
10 Political terror scale Gibney et al. (2011)
11 Weapons imports per 100,000 people SIPRI arms database
12 Impact of terrorism IEP
13 Number of deaths from organised conflict (internal)
IISS armed conflict database
14 Internal conflicts fought IEP and UCDP
15 Military expenditure (% GDP) External
conflict drivers
ISS Military Balance 2016 16 Number of armed services personnel per
100,000 people
ISS Military Balance 2016
17 UN peacekeeping funding IEP and UN
18 Nuclear and heavy weapons capabilities IEP, SIPRI, UN
19 Weapons exports per 100,000 people SIPRI arms database
20 Refugees and Internal Displaced People (IDPs) UNHCR
21 Relationships with neighbouring countries EIU Country Analysis team 22 Number, duration and role in external conflicts UCDP
23 Number of deaths from organised external conflicts
IISS, EIU and the Iraq Coalition Casualty Count 24 Number of people under 14 as percentage of
the total population
Demographic UN-DP and World Bank
25 Population size UN-DP and World Bank
26 Unemployment
Socio-economic
UN-DP
27 GDP per capita PPP World Economic Outlook
Table 2.8 Indicators selected for Adaptive capacity and Effective governance, as shown in the middle of the scheme shown in Figure 2.8.
Name of core indicator Category Source
1 Corruption perception index Governance Transparency
International
2 Government effectiveness World Bank
3 Hyogo framework for action (DRR implementation)
ISDR 4 Access to electricity (% of population) Communication
and infrastructure
World Bank
5 Internet users (per 100 people) World Bank
6 Mobile cellular subscriptions (per 100 people)
World Bank 7 Road density (km of road per 100 sq.
km land)
Open Street Maps
8 Education Index Human
development
UN-DP
9 Adult literacy rate UNESCO
10 Number of people living on less than 3 US dollars a day, as percentage of total population
11 Urban population as percentage of total World Bank
12 Human happiness SDSN
12 Health expenditure per capita Access to health system
WHO 13 Physicians density
14 Measles immunisation coverage
15 Ease of doing business index Economic development
World Bank
16 Gini Coefficient World Bank
2.4 Software implementation
All data described in Sections 2.2 and 2.3, but one, are public domain and have been downloaded from the institutes’ websites. Exception is the NatCat natural disaster database of Munich Re. However, we were able to download Munich Re country statistics from a GermanWatch publication (Section 3.2.4).
To couple these databases/indicators into one new database, we have chosen a common set of country names, those chosen by JRC for their INFORM and GCRI databases (191
countries). Next to that we have chosen a common year for which the data have been derived, in this case the year 2016. We were able to download 2016 data for most indicators. However, there are exceptions such country data for clean water and improved sanitation. These data are for the year 2015. In a few cases, such as the number of homicides, we had to take data from the 2011–2015 period, because data on specific countries over specific years were lacking.
The coupling of data has been performed in S-Plus (version 8.2). The script is given in Appendix B. We note that the script language of S-Plus equals the script language of R. We denote the database by the acronym 'PSI', where PSI stands for 'Planetary Security
Initiative'.
We note that the PSI database is not unique in the sense that a wide range of indicators are combined into one dataset. Two other databases are published by The Economist (2018) and by Rosling et al. (2018). However, the set-up chosen in these publications differs the one chosen here, i.e. Figure 2.8 and Tables 2.5 through 2.8.
3 Human security composite
indicators
3.1 From indicators to composite indicators
Thus far we showed national-based indicators in the field of human security. However, many researchers combine two or more indicators into a new composite indicator. An example has been given in Table 2.3. Here, 23 indicators—covering the field of violence and conflict—were combined into one new composite, denoted as Global Peace Index. Each indicator has been awarded a weight chosen by a team of experts. Before averaging, indicators were scaled (normalised) between 1.0 and 5.0 to make them comparable.
It is important to note that this procedure of combining indicators involves a number of steps and decisions that shape the new composite indicator. Different decisions on weighing, normalisation or imputation (interpolation of missing data) may lead to composites that show deviating patterns, when compared. Patterns may deviate even more, if institutes take differing decisions on expressing indicators either in absolute or relative terms, as we show in Section 5.5.
It is important to realise these aspects, since indicators presented by different researchers or institutes may or may not show deviating global patterns. Chapter 5 compares composite indicators with similar descriptions (‘governance’, ‘impact of natural disasters’, ‘vulnerability’, ‘risk of conflict’) and highlights the role of various procedures.
Typical examples of the various procedures are: (i) logarithms taken from the original data, to diminish the effect of outliers, and (ii) the way indicators are aggregated: arithmetic mean versus geometric mean. And, if the mean is calculated over M indicators — where a small number of indicators have data missing — is the result missing or calculated over the data available?
For an overview of techniques, we refer to Saisana et al. (2005), JRC-OECD (2008) and the
COIN website of JRC. Description of procedures applied by JRC, such as for their INFORM database, is given by JRC (2017b, Chapters 4 and 6).