PBL Netherlands Environmental Assessment Agency, November 2010
Policy Studies
Improving air quality in the Netherlands also depends on choices in climate policy Measures to prevent climate change could contribute to improving air quality in the Netherlands. In 2020, climate policy in the Netherlands could reduce emissions of sulphur dioxide (SO2) from 48 to about 32 kiloton, and emissions of nitrogen oxides (NOx) from 199 to about 184 kiloton. In addition, the cost of climate and air quality policies could be reduced by a few percent provided policies are more closely attuned. Energy savings and use of wind energy both contribute to improving air quality. However, the benefits to air quality are likely to be less if the Netherlands purchases CO2 credits from abroad. Furthermore, measures such as carbon capture and storage and increasing small-scale production of bio-energy may also increase air pollution but could be prevented by setting more stringent air quality limit values.
This study has been carried out in the framework of the Dutch research programme on Air and Climate (BOLK). This programme was set up by the Dutch Ministry of Housing, Spatial Planning and the Environment (VROM) to investigate the extent to which climate policy can contribute to improving air quality in the Netherlands in 2020. The Ministry uses this information in the preparation of climate and energy policies and strategies and in setting the Dutch position with regard to the revision of national emission ceilings under EU air policy for 2020.
Co-impacts of climate policies
on air polluting emissions in
the Netherlands
Final report of the Dutch
Research Programme on Air
and Climate
Co-impacts of climate policies on air
polluting emissions in the Netherlands
Final report of the Dutch Research
Programme on Air and Climate (BOLK)
Coordination and editors
Co-impacts of climate policies on air polluting emissions in the Netherlands Final report of the Dutch Policy Research Programme on Air and Climate (BOLK)
© PBL Netherlands Environmental Assessment Agency, November 2010
The study was conducted in collaboration with the Energy research Centre of the Netherlands (ECN), with contributions from CE Delft, Ecofys, the Netherlands Organisation for Applied Scientific Research (TNO), and the Copernicus Institute of Utrecht University (UU). PBL publication number 500146003/2010
ECN Report ECN-O-10-008
Corresponding Author: Pieter Hammingh; pieter.hammingh@pbl.nl ISBN: 978-90-78645-53-5
Parts of this publication may be reproduced, providing the source is stated, in the form: PBL
Netherlands Environmental Assessment Agency: Title of the report, year of publication.
This publication is being financed by the Netherlands Ministry of Housing, Spatial Planning and the Environment (VROM) in the framework of the Dutch programme entitled Policy Research Programme on Air and Climate or in Dutch Beleidsgericht Onderzoeksprogramma Lucht en Klimaat (BOLK).
This publication can be downloaded from our website: www.pbl.nl/en. A hard copy may be ordered from: reports@pbl.nl, citing the PBL publication number.
The PBL Netherlands Environmental Assessment Agency is the national institute for strategic policy analysis in the field of environment, nature and spatial planning. We contribute to improving the quality of political and administrative decision-making by conducting outlook studies, analyses and evaluations in which an integrated approach is considered paramount. Policy relevance is the prime concern in all our studies. We conduct solicited and unsolicited research that is both independent and always scientifically sound.
Office The Hague Office Bilthoven
PO Box 30314 PO Box 303
2500 GH The Hague 3720 AH Bilthoven
The Netherlands The Netherlands
Telephone: +31 (0) 70 328 8700 Telephone: +31 (0) 30 274 274 5
Fax: +31 (0) 70 328 8799 Fax: +31 (0) 30 274 44 79
E-mail: info@pbl.nl Website: www.pbl.nl/en
5
Inhoud
Findings 7
Co-impacts of climate policies on air polluting emissions in the Netherlands 9 Final report of the Dutch Research Programme on Air and Climate (BOLK) 9 Summary 9
Introduction 11
Co-impacts of climate packages on air polluting emissions 12 Co-impacts of specific climate measures on air pollution 14 Optimising co-benefits and reducing disbenefits 16 Reducing disbenefits from specific climate measures 18
The reports of the Dutch Research Programme on air and climate 20 Understandings 21
Policy and scientific context 23
1.1 Synergies and trade-offs between climate and air quality policies 23 1.2 Developments in climate policies 24
1.3 Developments in air quality policies 29 1.4 Methodologies for quantifying co-impacts 30
2 New insights into co-impacts of specific greenhouse gas mitigation measures on air pollutants 33
2.1 Small to medium-scale bio-energy applications and fossil CHP 33 2.2 Biofuels in road transport 38
2.3 CCS in power generation and industry 45
2.4 Integrating new insights into option descriptions 51
3 Analysis of co-impacts of climate policy packages on air polluting emissions 53 3.1 Impacts of climate policies on energy and greenhouse gas emissions 53 3.2 Co-impacts of envisaged climate packages on air polluting emissions 57 3.3 Co-impacts of climate target packages on air polluting emissions 59
4 Optimising co-benefits and reducing disbenefits 63
4.1 Develop long-term vision and harmonised strategy on air and climate 63 4.2 Co-impacts, uncertainties, and revision of national emission ceilings 63 4.3 Reducing air pollution risks from specific climate measures 64
Appendices 68
A.1 Biomass activities, emissions factors and emission control technologies 68 A.2 Air polluting emissions from bio-energy production chains 70
A.3 Key parameters of CO2 capture in the Dutch industrial sector 71 A.4 Updated Dutch climate and energy options 72
Acknowledgements 73
Co-impacts of climate policies on air polluting emissions in the Netherlands
Co-impacts of climate policies on air polluting emissions in the Netherlands 9
Summary
Measures that reduce greenhouse gas (GHG) emissions can also contribute to improving air quality in the Netherlands. The BOLK Programme shows substantial net co-benefits from the three climate packages for 2020 under consideration especially for sulphur dioxide (SO2) and nitrogen oxides (NOx) emissions, the co-benefits are smaller for particulate matter emissions (PM10). However, there are limited disbenefits for non-methane volatile organic compounds (NMVOC) and ammonia emissions (NH3; see Table S1).
Measures that stimulate energy saving, energy efficiency, and the use of wind, solar and geothermal energy always benefit air quality.
The net co-benefits for SO2 emissions in this study have been found to result from climate measures that stimulate fuel switches from coal to gas and biomass, more nuclear and wind power, energy savings and application of carbon capture and storage (CCS). The net co-benefits for NOx emissions result from energy savings in the residential, industrial, and transport sectors.
Limited disbenefits for NOx and NH3 emissions have been found to result from CCS and bio-energy use in small to medium-scale stationary installations. To reduce the potential risks of certain climate measures for air quality, the Dutch Government could decide to tighten the emission limit values for the relevant installations or to introduce technology standards.
Limited disbenefits for NMVOC emissions have been found to result from an increase in small to medium-scale combined heat and power installations (CHP), and biomass and biogas combustion installations. To reduce NMVOC emissions from these installations, technical measures such as oxidation catalysts are available. But more research is needed on the effects on catalyst materials of impurities in the flue gas from biogas and biomass combustion.
The co-impacts of the envisaged Dutch climate package – Clean and Efficient – are smaller than the policy package needed to meet EU and Dutch targets (see Table S1), because the envisaged climate package as defined in 2009 has a smaller set of climate measures. With those measures, the envisaged policy package does not meet either European or Dutch climate and energy targets for 2020. The indicative EU and Dutch target packages include additional measures to reduce GHG emissions that are based on national insights on cost and co-impacts, and that meet exactly the EU and the Dutch targets, respectively.
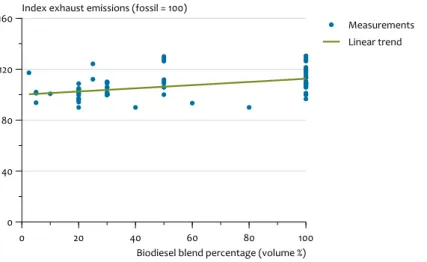
Use of biofuels in road transport up to the EU target for 2020 is expected to have negligible effects on exhaust air polluting emissions. Some potential risks of failure of emission control devices have been identified with the use of high biodiesel blends. To abate those risks, both biofuel quality and emissions from vehicles using biofuels should be monitored effectively, which allows for timely measures where necessary.
Co-impacts of climate policies
on air polluting emissions
in the Netherlands
Co-impacts of climate policies on air polluting emissions in the Netherlands 10
Climate policies in 2020, may lead to net cost savings for new air quality policy of up to 100 million euros per year. These cost savings are a few percent of the indicated costs in 2020 of current Dutch air quality policies (around 3 billion euros in 2020) or the additional Dutch climate packages (3-9 billion euros in 2020).
Because not all climate measures have co-benefits for air polluting emissions, climate policy packages by definition do not necessarily lead to improvement in air quality. To guarantee that a certain emission level or air quality standard will be met everywhere in a certain year, specific air quality policies (air quality limit values, emission limit values, emission ceilings) will still be needed. The greatest uncertainty in the estimates of the co-impacts is caused by the fact that climate policy
measures needed to meet climate and energy targets have not yet been approved by the Dutch cabinet and parliament.
Other uncertainties in the co-impact estimates are related to the future prices for carbon dioxide (CO2) in the EU Emission Trading System, the amount of foreign CO2 credits that will be bought, the amount of electricity that will be exported, and the real life efficiency of individual climate and energy meas-ures and instruments.
How to incorporate these uncertainties into the revision of the national emission ceilings for air pol-lutants is an important element to be considered by policymakers involved in this process. The risk is that if the anticipated co-benefits for air polluting emissions in 2020 do not occur, additional national air pollution abatement measures will have to be implemented in order to meet the national emis-sion ceilings based on too optimistic assumptions on the co-benefits of climate policy. The risk for countries assuming large co-benefits is that eventually more stringent air pollution measures may be needed than those needed elsewhere.
The estimated co-benefits for Dutch NOx and SO2 emissions in this study are lower than European estimates previously provided by the European Commission within the framework of the revision of the national emission ceilings. The differences are explained by different assumptions for 2020 on electricity export, the distribution of climate measures over the sectors, economic growth rate, and the application of CCS. The sensitivity of the co-impacts for these types of assumptions needs to be checked because larger co-benefit estimates used by the European Commission may lead to stricter national emission ceilings.
The comparability with the estimates of the European Commission for the co-impacts is especially hampered by the use of different assumptions for economic growth. The European Commission uses a post-crisis scenario with moderate economic growth, while the Dutch analysis in this report is based on a pre-crisis scenario with relatively high growth. To improve the comparability, a new Dutch study on co-impacts has started that will use a moderate (post-crisis) view on economic growth.
Impacts of climate policy on GHG and co-impacts on air polluting emissions in the Netherlands, 20201
GHGs NOx SO2 NH3 PM10 NMVOC
Megaton Kiloton
Dutch baseline emissions 2020 254 199 48 129 35 165
Emissions including Dutch
envisaged package 218-241 192-195 42-47 129-131.5 34.4-34.6 165 Emissions including EU target package 172 185 38 129-131.5 34 168 Emissions including Dutch target package 150 184 32-37 129-131.5 34 169
1 The Dutch baseline emissions for 2020 include only current climate (Kyoto) and air pollution legislation (Daniels and van der
Maas, 2009). Green colours refer to an emission reduction (co-benefits), red colours to an emission increase (disbenefits).
Co-impacts of climate policies on air polluting emissions in the Netherlands 11
Introduction
Synergy between climate and air quality policies becomes increasingly important
Climate and air pollution policies are linked because Greenhouse gases (GHG) and air pollutants have a number of common sources, such as combustion of fossil fuels and agricultural activities. Despite these links, policies on climate change and air pollution have often been developed separately. Currently, a more integrated approach towards climate and air quality policy is becoming increasingly important. In particular, climate policy plays an important role in the revision of the UNECE Gothenburg Protocol (GP) and the EU NEC Directive (NECD). These revisions aim at setting stricter national emission ceilings for 2020 for nitrogen oxides (NOx), sulphur dioxide (SO2), ammonia (NH3) and non-methane volatile organic compounds (NMVOC). Also, a national emission ceiling for particulate matter (PM2.5) will be established. Both revisions had been delayed because of increasing awareness of the implications on air pollution of the ongoing EU policy process on climate and energy. For instance, European analysis by the International Institute of Applied System Analysis (IIASA, Austria) had shown that integrating climate and air pollution policies substantially reduces air pollutants and results in overall cost savings. These benefits in turn are additional incentives in developing climate policies. The ongoing EU policy process on climate and energy led to the adoption of the European climate and energy package in April 2009. That package sets an EU-wide target to cut GHG emissions to at least 20% below 1990 levels by 2020. Other EU-wide and national targets were set, to improve energy efficiency and increase the proportion of renewable energy in total energy consumption and in transport by 2020.
Several member states have formulated additional targets to mitigate climate change. For example, in 2008, the Dutch Government set a national target of 30% reduction in GHG emissions in 2020 compared to 1990, and stricter targets to improve energy efficiency and the share of renewable energy, compared to those of the EU. All of these targets will contribute to decreasing GHG emissions, as well as decreasing dependence on imported energy, decreasing air polluting emissions, and to stimulating technological developments. Co-impacts of climate policies on air polluting emissions Climate policies also often lead to less air pollution as well. These co-benefits for air polluting emissions originate mostly from energy savings, improved energy efficiency, a switch from coal to gas, and use of renewable energy such as wind, solar and hydropower. There is considerable awareness about the co-benefits from such measures. However, there are also a number of climate measures of which little is known about the co-benefits or disbenefits, together referred to as co-impacts. These measures include use of biofuels in transport, use of biomass, biofuels and biogas in (small scale) stationary installations, combined heat and power generation, and CO2 capture and storage (CCS). National co-impacts of climate policies on air polluting emissions are also influenced by the amount of climate measures that countries might take in another country, through the flexible
mechanisms. Any co-impacts associated with these climate measures also occur elsewhere.
Reliable estimates of co-impacts essential for revision of national emission ceilings
Previous European analysis have shown that inclusion of the co-impacts of climate and energy policies lead to more stringent national emission ceilings for the Netherlands than those calculated without these policies (Amann et al., 2008). Although analysis of the first phase of the Dutch Research Programme on Air and Climate (BOLK) has confirmed the net beneficial effects of envisaged climate policies on mainly SO2 and NOx emissions, these estimates are surrounded by large uncertainties (Hammingh et al., 2008). These uncertainties imply that if climate policies do not deliver the estimated net co-benefits, attaining the national emission ceilings might be at risk, or the costs for air pollution mitigation may increase. To further optimise synergies and to prevent trade-offs between climate and air pollution policies, the first phase report of the Dutch research Programme (Hammingh et al., 2008) recommended refining and updating the analysis of the co-impacts of climate policies on air pollutants in the Netherlands.
Photo 1 Climate policies that stimulate wind energy decrease emissions of GHG and air pollutants
Co-impacts of climate policies on air polluting emissions in the Netherlands 12
Aim of this report
This report presents the updated analysis of the co-impacts on air polluting emissions of the envisaged Dutch climate package ‘Clean and Efficient’ (in Dutch: ‘Schoon en Zuinig’) by the Dutch cabinet (VROM, 2007). This package however, does not lead to meeting EU climate and energy targets for the Netherlands or the more challenging Dutch targets (Van Dril, 2009). Therefore, the co-impacts have been analysed of two indicative packages that do meet the EU and Dutch targets. These packages are referred to as ‘EU target package’ and ‘Dutch target package’, respectively.
In this study, the national analysis methodology has been used, which comprises national projections of energy use and emissions, and national insights in costs and effects of additional emission reduction measures. Results obtained using this national analysis methodology, have been compared with those obtained with the European analysis methodology that is used in the framework of the revisions of the GP and the NECD.
Moreover, this study presents summaries of separate in-depth studies into the co-impacts of specific climate measures in the Netherlands, see list of BOLK reports at the end of this section. These cover the application of bioenergy in small to medium-scale combustion installations and in combined heat and power installations, biofuels in road transport, and CCS in power generation and industry. Finally, recommendations for policymakers are made to optimise synergies and to prevent trade-offs between climate and air pollution policies.
Co-impacts of climate packages on air polluting
emissions
Envisaged Dutch climate packages have net co-benefits for SO2 and NOx emissions
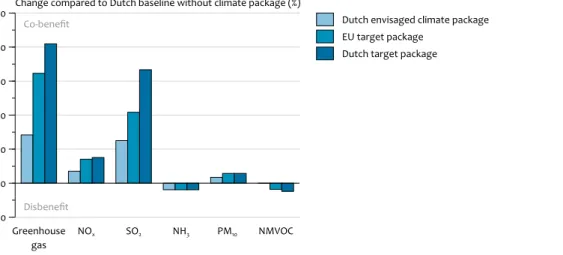
The results of this second phase of the Dutch Research Programme on Air and Climate (BOLK) confirm that the envisaged Dutch climate (policy) package ‘Clean and Efficient’ reduces emissions of GHG and the air pollutants SO2, NOx and PM10 in the Netherlands (Table 1 and Figure 1). The range in the estimated emission reductions accounts for uncertainty in the price of CO2 in 2020 in the EU Emissions Trading Scheme or EU ETS (between 20 and 50 euros/tonne CO2), the amount of biofuels (between 10 and 20% in 2020) and a range in the effectiveness of individual climate and energy measures and instruments (lower and higher assumptions for the effectiveness in 2020).
The net co-benefits for NOx emissions are dominated by emission reductions from energy savings, mainly in stationary energy use. This is achieved by measures such as improved efficiency of appliances in households and service sectors, heat demand reduction in the built environment and in ETS sectors, and recycling of plastics. It also includes emission reduction in transport by measures such as road pricing for cars, increased road fuel taxes, speed limits on motorways and stimulating more fuel-efficient car tyres. There are some small increases in NOx emissions (disbenefits) that result from CCS measures in power, biogas production and the use of co-digestion of manure. The co-benefits for SO2 emission
Figure 1 Greenhouse gas NOx SO2 NH3 PM10 NMVOC -10 0 10 20 30 40
50 Change compared to Dutch baseline without climate package (%) Dutch envisaged climate package EU target package
Dutch target package
Maximum net (co-)impacts on greenhouse gas and air polluting emissions from climate policies by 2020
Co-benefit
Disbenefit
Impacts of climate policy on GHG and co-impacts on air polluting emissions in the Netherlands, 20201
GHGs NOx SO2 NH3 PM10 NMVOC2
Megaton Kiloton
Dutch baseline emissions 2020 254 199 48 129 35 165
Emissions including Dutch envisaged package 218-241 192-195 42-47 129-131.5 34.4-34.6 165
Emissions including EU target package 172 185 38 129-131.5 34 168 Emissions including Dutch target package 150 184 32-37 129-131.5 34 169
1 The Dutch baseline emissions for 2020 include only current climate (Kyoto) and air pollution legislation (Daniels and van der
Maas, 2009). Green colours refer to an emission reduction (co-benefits), red colours to an emission increase (disbenefits).
2 NMVOC = non-methane volatile organic compounds
Co-impacts of climate policies on air polluting emissions in the Netherlands 13 result from energy savings, CCS in power generation and an
increase in renewable energy. The limited co-benefits for PM10 emissions result mainly from reduced traffic volume in road transport.
The disbenefits of the envisaged Dutch package are less substantial than the co-benefits. NH3 emissions could increase to a limited extent with the application of CCS in power plants and biomass use in stationary installations. However, these increases can be abated with existing abatement technology at limited costs.
European and Dutch target packages lead to more substantial co-benefits
Even with strict implementation of the envisaged Dutch climate package (leading to an estimated GHG emission of 218 Mt in 2020), the European and Dutch targets are not met for GHG emission reductions (~172 megaton and 150 megaton, respectively in 2020), neither are the energy targets for energy efficiency (annually 1.4% and 2%, respectively) and share of renewable (annually 14% and 20% respectively). To meet the targets, the Dutch Government will need to develop additional climate and energy policies.
In order to estimate the co-impacts on air pollution of an additional Dutch climate and energy package that meets the European or Dutch climate and energy targets, two cost-optimal climate and energy packages have been constructed using the national insights in costs and effects of additional emission reduction measures (Section 1.4). Both packages lead to more substantial net co-benefits for SO2 and NOx emissions than those of the envisaged Dutch climate package (Table 1). Even though more energy saving and renewable energy measures are incorporated, the renewable energy target of the Dutch cabinet cannot be met with the options currently available and the maximum feasible share is about 18%.
The net co-benefits for NOx emissions mainly result from the stricter energy savings measures compared to those taken in the envisaged package. Some disbenefits on NOx emissions result from CCS application, renewable energy (biomass in small to medium scale installations), and non CO2 GHG measures (co-digestion of manure).
The SO2 co-benefits result from switches from coal to gas and to bio-energy in both centralised power plants and in CHP, increased use of nuclear and renewable energy and more energy savings. The co-benefits from the target packages for PM10 emissions are limited and result from volume reductions in transport, energy savings and fuel switches. The increase in ammonia emissions originates mainly from increase in post-combustion CO2 capture. Non-methane volatile organic compounds emissions (NMVOC) may increase more substantially because of an increased number of combined heat and power installations (CHP) with gas engines (without additional NMVOC mitigation measures) and increased use of biomass in stationary installations.
NOx co-benefits from envisaged climate policies higher
according to European assessment
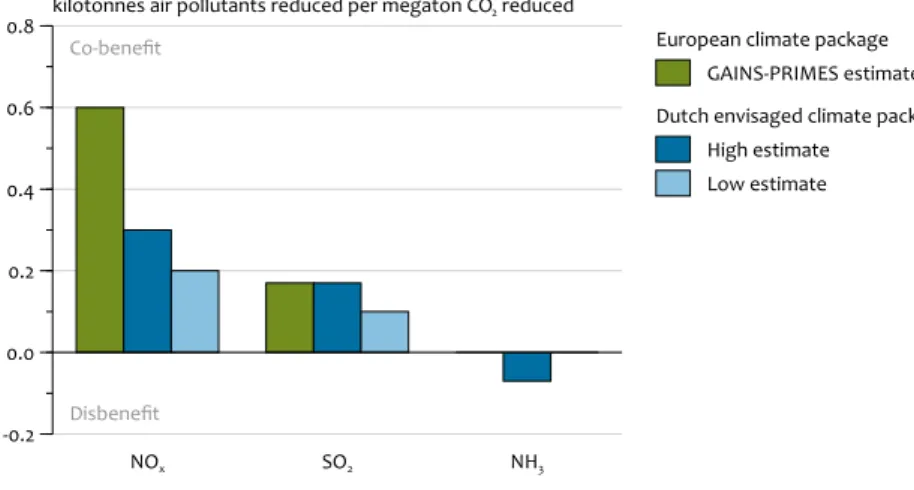
The estimates for co-impacts of envisaged climate policies on air polluting emissions from this study have been compared to the available estimates from a European analysis (CIAM, 2008). The European analysis, in the framework of the revisions of the GP and the NECD, is carried out by amongst others IIASA and the National Technical University of Athens (NTUA). Important models in the European analysis methodology are the GAINS and PRIMES models (Amann et al., 2007a, 2008; IIASA, 2010; Capros et al., 2008a, b, c). The comparison shows that the European analysis estimates higher co-benefits for NOx and SO2 emissions than this study (see Figure 2) and estimates no net disbenefits for NH3 emissions. Incorporating the European estimates for co-impacts in the revision of the NEC, may lead to more strict national emission ceilings for the Netherlands, than if national estimates for co-impacts would be used.
The differences between the Dutch and European analysis result from differences in the assumptions on the effects of climate policies on projected coal and gas use in power generation, CCS application, and oil use in transport. The European assessment assumes larger decreases in coal and gas use than the Dutch assessment due to decommissioning of Dutch coal and gas fired power plants and hence relatively large co-benefit ratios for NOx and SO2 per megaton CO2 reduction. In the Dutch assessment, coal and gas use do not decrease as much as the European
Figure 2 NOx SO2 NH3 -0.2 0.0 0.2 0.4 0.6
0.8 kilotonnes air pollutants reduced per megaton CO2 reduced European climate package GAINS-PRIMES estimate Dutch envisaged climate package
High estimate Low estimate
Co-impacts ratios for air pollutants by European and Dutch climate packages in 2020
Co-benefit
Co-impacts of climate policies on air polluting emissions in the Netherlands 14
assessment because the Dutch expect the export of electricity to grow towards 2020 (Daniels & Van der Maas, 2009). The expected growth in export of electricity is a consequence of the projected decrease in national electricity demand due to climate policies, and the scheduled construction of a number of new power plants. The Dutch electricity sector experiences some competitive advantages such as: ease of access to cheap cooling water from the sea, low supply coast of coal due to proximity to harbours, and availability and relatively easy access to geological CO2 storage capacity in empty gas fields.
The smaller co-benefit ratio for NOx in the Dutch assessment is also caused by the assumed application of CCS at a few coal fired power plants, which is not assumed in the European assessment. This study shows that CCS application leads to extra NOx and NH3 emissions but to less SO2 emissions. A further explanation for the lower co-benefit for NOx emissions in the Dutch assessment compared to those of the European assessment, is that the Dutch estimates include larger reductions in oil use in road transport due to stricter CO2 standards (95 g CO2 per km) in 2020 and a higher share of biofuels (20%1). However, both efficiency improvement and biofuel use have little effect on NOx emissions from road transport. Tail-pipe air polluting emissions from cars and trucks are regulated by the Euro standards.
Co-impacts of specific climate measures on air pollution
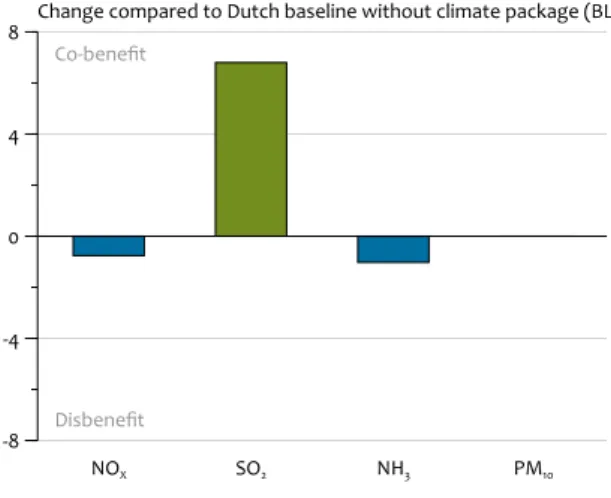
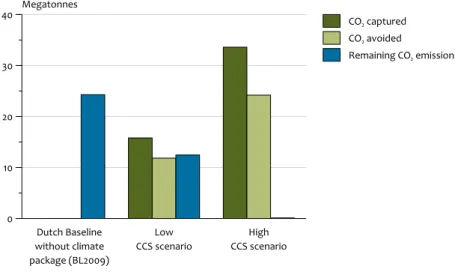
Bioenergy use in stationary installations increases most air polluting emissions except for SO2A dedicated what-if scenario study was used in a detailed analysis of the co-impacts on air pollution of increasing small to medium-scale bioenergy use in the Netherlands from 2 to about 6% of the total primary energy use in 2020 (Boersma et al., 2009). The scenarios include co-firing biomass in large-scale power plants (2.2% of primary energy use) because this is one of the more substantial and cheaper biomass options. Further, assumptions have been made for a low and high expansion of medium-scale biomass combustion, biomass use in household stoves and biogas production. These are called the low and high bioenergy scenarios, respectively.
The study results for the high bioenergy scenario indicate increases in most air pollutants in 2020, compared to the baseline. As shown in Figure 3, NOx increases by less than 1% (~1 kiloton), PM10 by about 3% (~1 kiloton), NMVOC by up to 4% (~6 kiloton). SO2 emissions decrease by about 3% (~1.5 kiloton). These effects are explained by the fact that small to medium-sized installations emit relatively higher amounts of air pollutants (per unit of heat or electricity) than do large installations. Small installations use less advanced combustion technologies and flue gas cleaning systems as a result of technological restraints and cost considerations. If small installations are also located nearer to residential areas and with lower chimneys, the contribution to local air pollution can become even more substantial. In a recent decree on emission limit values for small to medium installations, the Dutch Government has anticipated the envisaged effects by setting stricter emission limit values for installations using fossil and bio energy fuels (VROM, 2009). SO2 emissions decrease because biomass generally contains less sulphur than do fossil fuels.
Substituting biomass for coal in power plants has limited effects on air pollution
Replacing part of the coal with biomass in power plants may not reduce NOx and NH3 levels (Boersma et al., 2008). The present extensive flue gas cleaning in these installations should be sufficient to clean flue gases originating from different type of fuels. Because generally biomass contains less sulphur, emissions of SO2 are expected to decrease. Wood burning is major contributor to particulate matter and NMVOC emissions
In spite of a trend towards the use of certified household wood burners with improved emission performance, wood burners could be responsible for up to 5% of particulate emissions (PM10) in the Netherlands in 2020 with a twofold increase in this type of energy use. Also, emission factors for NOx and NMVOCs are relatively high for domestic wood burners. Stimulating the use of certified burners is one of the more cost-effective measures for reducing air pollution from these sources. Figure 3 NOx SO2 NH3 PM10 NMVOC -8 -4 0 4
8 Change compared to Dutch baseline without climate package (BL2009) (%)
Indicative co-impacts on air polluting emissions of a high bioenergy scenario by 2020
Co-benefit
Co-impacts of climate policies on air polluting emissions in the Netherlands 15 Increases in small-scale CHP generation could increase
NMVOC emissions
Stimulating small to medium-size combined heat and power generation fuelled by biogas or natural gas contributes to meeting energy efficiency targets. An analysis showed that switching from separate power and heat generation to small to medium scale CHP generation (up to 40 PJ fuel input) could increase NMVOC emissions by about 3% (6 kiloton). This assumes no additional control measures. Small reductions are estimated in NOx and SO2 emissions but no noticeable changes in PM10 and NH3 emissions.
Biofuels in road transport expected to have small co-impacts for air pollutants
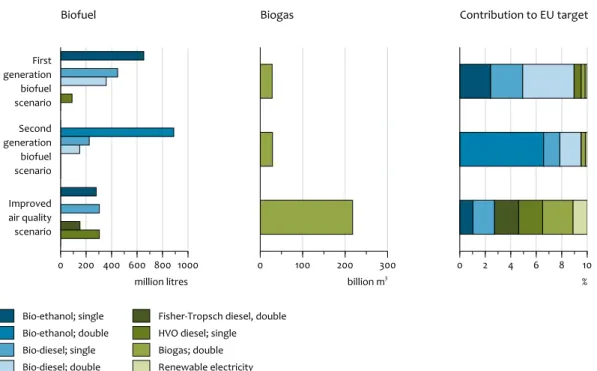
The effect on NOx and PM10 emissions of the mandatory 10% share of biofuels in road transport in 2020 have been analysed in three biofuel scenarios (Verbeek et al., 2009). One scenario assumes that more mature first generation biofuels from energy crops will be in use in 2020. The second scenario assumes that sustainability issues favour production of second generation biofuels from lignocellulosic origin. The third scenario includes a larger share of specific biofuels (such as synthetic biofuels and biogas) and electric vehicles that potentially lead to less air polluting emissions.
Analysis of the three scenarios showed that the effects on national NOx and PM10 emissions in 2020 are probably less than 1% (for effects on NOx emissions, see Figure 4). The reason is that a greater part of the biofuels requirement can be achieved with low blend biofuels (up to 10% ethanol and 7% biodiesel blended into fossil fuels). These are not expected to lead to significant changes in exhaust emissions from new cars in the future because these vehicles already need to pass type approval tests that include use of low blend biofuels. Another part of the explanation is that some contribution of second generation biofuels is assumed in 2020. These biofuels count double for the EU target. Hence, they reduce the need for high biofuel blends that have higher risks of increasing air pollution. This also means that if renewable energy targets for road transport are increased substantially in the future and more high biofuel blend are used, air polluting emissions may change more substantially unless additional measures are taken.
Natural gas, biogas, electric vehicles and synthetic biofuels are better for air quality
Of the three biofuels scenarios, the scenario with the largest share of natural or biogas, (plug-in) electric vehicles and synthetic biofuels is expected to lead to the least air polluting emissions from road transport. The lower air polluting emissions are partly due to the cars running on natural/biogas and synthetic biodiesel replacing fossil diesel powered cars with relatively higher NOx and PM10 emissions. The extra electric cars result in lower air pollutant emissions locally but emissions from the power sector increase somewhat. Potential failure risks of emission control devices with high biodiesel blends
There are technical risks with the functioning of emission control devices using high biofuel blends (FAME) in diesel engines. Failures of “after-treatment” devices are related to possible inadequate responses of catalyst and dust particulate filters. This may be due to changing flue gas composition and/or to problems such as injector fouling and catalyst poisoning that may be caused by impurities in biofuels. No substantial technical risks are currently foreseen with high blends of ethanol, hydro-treated vegetable oil (HVO), synthetic biodiesels such as biomass-to-liquid (BTL) or Fischer-Tropsch (FT) diesel. Similarly, there are no such risks with engines with factory-installed natural gas/biogas fuel systems.
CCS in power generation and in industry may lead to short-term increases in air pollutants
If CCS would be applied in four new coal power plants in 2020 in the Netherlands, NOx, PM10 and NH3 emissions may increase (Figure 5) compared to plants without CCS (Horssen et al., 2009). At the same time, SO2 emissions will most likely decrease. NOx and PM10 emissions increase due to additional energy consumption of the CO2 capture units. NH3 is emitted as a result of the degradation of CO2 solvents (amines). SO2 concentrations in flue gases have to be reduced for the CO2 capture unit to function properly. There are standard NOx and NH3 emission reduction measures available to abate possible increases at limited costs. These costs are not a bottleneck in CCS implementation. Figure 4 First generation biofuel scenario Second generation biofuel scenario Improved air quality scenario -8 -4 0 4
8 Change compared to Dutch baseline without climate package (BL2009) (%)
Indicative co-impacts on NOx emissions in scenarios to achieve the EU biofuel target for 2020
Co-benefit
Co-impacts of climate policies on air polluting emissions in the Netherlands 16
Large-scale CCS in the power sector in 2050 leads to substantial reductions in air pollutants
A number of CCS scenarios for the power sector for 2030 and 2050 indicate dramatic reductions in emissions of SO2 (>90%), NOx (>65%), NMVOC (>40%) and particulate matter (>30%) compared to a business-as-usual (BAU) scenario without CCS. This is mainly due to a switch from pulverised coal power plants without CCS (in the BAU scenario) to the cleaner coal gasification power plants (IGCC) with CCS combined with natural gas power plants (NGCC) without CCS. SO2 emissions are estimated to decrease the most. NOx emissions also decrease because of the favourable NOx performance of IGCC and NGCC. However, NOx emissions do not decrease as substantially as SO2 because of the extra energy consumption of the capture units.
CCS in industry has limited effect on reducing in air polluting emissions
There is a potential for CO2 capture of about 5 Mt per year in the Dutch industrial sector in 2020 for costs of around 40 euros per tonne of CO2 avoided. This covers hydrogen production and iron and steel production. CO2 capture at other industrial sources such as refineries and ethylene production is expected to be more expensive. CO2 capture at iron and steel production is expected to decrease SO2 emissions (a few hundred ton maximum) and particulate matter emissions. The effect on NOx emissions largely depends on the future choices on the combination of the combustion concept and CO2 capture technology used in an iron and steel plant.
Optimising co-benefits and reducing disbenefits
To optimise the co-benefits of climate policies for air quality and to prevent disbenefits, climate and air quality policymakers need to work closely together. This study provides information for that process. It provides estimates for the potentially substantial co-impacts of climate policies in the Netherlands on air polluting emissions. In addition, it appoints the substantial uncertainties that surround the estimates for those co-impacts. Recommendations are givenhow to reduce or prevent disbenefits of specific climate measures. These points are discussed in detail below. Develop long-term vision and harmonise strategies on air quality and climate
In many countries and institutions, climate and air pollution policies initially tended to be developed more or less independently. Climate policy in the Netherlands focuses heavily on reducing GHG emissions, sometimes without taking into account the effects it may cause on other fields of environmental policy, such as air pollution. Air quality policy has not always taken into account climate policy processes. For instance, the European revision of national air pollutant emission ceilings initially started without any real consideration of the implications for the ongoing EU policy process on climate and energy. Another emerging issue requiring attention is the potential effects of air pollution measures on short-term global warming.
The lack of coordinated climate and air pollution policies has drawbacks from both an economic and an environmental standpoint. Industry, for instance, may be faced with situations in which carbon reductions need to be made in one year and reductions in conventional air pollutants in another year (Climate Institute, 2010). This reduces the opportunities industries may have (under coordinated policies) to take more cost-effective measures to reduce CO2 and air polluting emissions simultaneously. Eurelectric (2008) stated, for instance, that uncoordinated climate and air policies are a hindrance to long-term planning and investment in industry. Lack of coordinated policy can lead to climate policy packages with measures that are not optimal for reducing air pollutants. This study confirms trade-offs with a number of climate measures such as bioenergy in small to medium installations, stimulating small to medium-scale combined heat and power generation, and some types of CCS. These trade-offs imply that climate policies and targets for the short or longer term alone do not guarantee decrease in air pollutant emissions. Clear intermediate air pollution targets, such as national emission ceilings, are a better guarantee. With better coordination, climate packages can be chosen that contribute (partly) to decreasing air pollutant emissions
Figure 5 NOX SO2 NH3 PM10 -8 -4 0 4
8 Change compared to Dutch baseline without climate package (BL2009) (%)
Indicative co-impacts on air polluting emissions of a high CCS scenario by 2020
Co-benefit
Co-impacts of climate policies on air polluting emissions in the Netherlands 17 as well and so also to reducing the cost of air pollution
policies. These benefits in turn are additional incentives in developing climate policies.
Lack of policy coordination yields less overall environmental protection for the societal resources expended and does not contribute to societal support for climate and air policies. The lack of coordination may result from lack of a shared long-term vision and a harmonised strategy towards short to long-term targets (Maas et al., 2009). In aiming for more integrated policy, an initial step would be to develop a shared long-term vision and harmonised strategy towards short to long-term climate and air quality targets.
Co-impacts, uncertainties and revision of national emission ceilings
In the ongoing revision of NECs from the GP and the NECD for 2020, co-impacts of European climate and energy policies are to be incorporated in air pollutant emission projections for 2020, also called baselines. The UNECE and EC use the GAINS and PRIMES models to construct air polluting emission baselines. These baselines, and their estimated effects on air quality, are the starting point in the revision. Subsequently, a number of ambition levels for an improved air quality, will be translated (with the GAINS model) into indicative national emission ceilings for all the countries under the GP and the NECD. That information will be used within the negotiation processes towards a new GP and NECD.
The comparison of GAINS-PRIMES baselines (CIAM, 2008) and Dutch baselines with and without an envisaged climate package reveals the differences in co-impact estimates. That shows that the GAINS-PRIMES estimates larger co-benefits for Dutch NOx and SO2 emissions compared to the Dutch estimates. The differences are explained by different assumptions for 2020 on electricity export, the distribution of climate measures over the sectors, economic growth rate, and the application of CCS. Because larger co-benefit estimates may contribute to stricter national emission ceilings, it is important to check the validity of the assumptions that are used in the supportive European analysis for the policy processes towards new NECs.
In February 2010, UNECE proposed using the newest PRIMES 2009 baseline (Maas, 2010). This baseline includes not only most of the agreed European climate and energy package but also takes into account the post-crisis effects on economic growth (assumes relatively low economic growth in the Netherlands of 1.4% up to 2020). This leads to relatively low baseline emissions especially for SO2 (33 kiloton) and NOx (166 kiloton) in the Netherlands in 2020. It remains to be seen whether additional ambition levels for an improved air quality lead to a proposal for a new GP with even lower national emissions ceilings for the Netherlands.
The Dutch estimates for a baseline that includes most of the agreed European climate and energy policies (i.e. the EU target package) indicates that SO2 and NOx baseline emissions in the Netherlands could decrease to about 40 and 190 kiloton, respectively, in 2020. If the stricter climate and energy targets of the Dutch Government (i.e. the Dutch
target package) are taken into account, the baseline SO2 and NOx emissions could decrease by a further few kilotons. Taking into account these co-impacts of climate policies in 2020, may lead to cost savings for additional air quality policy of up to 100 million euros per year. These cost savings are a few percent of the indicated costs in 2020 of current Dutch air quality policies (about 3 billion euros in 2020) or the additional Dutch climate packages (about 3-9 billion euros in 2020). The estimated co-impacts from the European and the Dutch analysis should be considered as indicative and should be interpreted with caution. A first reason for caution is that the co-impacts of the target packages are not based on a complete and agreed Dutch climate and energy policy plan that meet the targets. Instead, the analysis has been carried out using assumptions on possible (mostly technical) options and a cost-optimal order in which options (measures) are taken. The list of possible options can never be complete since other technical measures may emerge or new policy measures with different costs and effects may be developed. Also, the cost-optimal order in which options are assumed to be taken may be quite different in reality because reasons other than cost-effectiveness can play a determining role. Such reasons could be related to energy security, or to the distribution of reduction efforts over sectors or GHGs. A second reason for caution is that the analysis includes only (additional) national climate and energy measures in the ETS and non-ETS sectors. In reality, the Netherlands could decide to combine additional national policies with the purchase of CO2 credits abroad to meets non-ETS targets. These credits can be purchased through the Clean Development Mechanism (CDM) or Joint Implementation (JI). To meet the EU greenhouse gas target, the Netherlands can purchase credits for about 4 Mt CO2 equivalents per year in 2020. For the more stringent national target, the Netherlands is allowed to buy a maximum of about 25 Mt CO2 equivalents per year. A disadvantage of buying a large amount of credits (abroad) is that it is more difficult for the Netherlands to achieve its national targets for renewable energy and energy efficiency. With regard to the ETS sector, Dutch participants in the EU-ETS are not forced to take measures (national) but are free to buy credits in the EU-ETS. Moreover, some credits may be bought through CDM and JI. Any co-impacts associated with foreign credits will also occur abroad.
A third reason for caution is that the Dutch analysis was carried out with a baseline that uses relatively high economic growth of 2.9% up to 2020. That growth is currently seen as less realistic in the light of the effects of the economic crises. Velders et al. (2010) show that lower economic growth could have substantial impact on future emissions because of fewer activities and less energy used. If the assumption on economic growth (in emission baselines) is reduced from 2.5 to 1.5% per year between 2010 and 2020, national NOx and SO2 baseline emissions could reduce by about 10 and 2 kiloton, respectively. The volume effects of lower economic growth also affect climate and energy measures needed to meet the targets. Probably fewer measures will be needed to achieve GHG and energy targets in 2020, and subsequently less co-benefits.
Co-impacts of climate policies on air polluting emissions in the Netherlands 18
To understand the net effects on air pollutant baseline emissions, a national baseline needs to be prepared for air polluting emissions. This should integrate post-crisis (lower) economic growth and preferably all necessary climate and energy measures or several policy packages.
Reducing disbenefits from specific climate measures
Air pollutant reduction technologies to reduce disbenefits of bio-energyThe number of small to medium-scale combustion installations (up to 20 megawatt thermal using fossil and bio energy fuels) is expected to grow as a result of climate policies. Despite a recent Dutch degree with tighter emission limits for medium combustion installations (1-20 MWth), an increase in these type of installations still carries the risk of increasing most air polluting emissions. Emissions of NMVOC in small to medium scale biomass and biogas combustion (10-14 g NMVOC per gigajoule) are relatively high compared to large scale power plants (1-2 g NMVOC per gigajoule; see Section 2.1).
Moreover, NOx, PM10 and NMVOC emissions are high from bio-oil or (waste/animal) fat-fired stationary diesel engines and household wood stoves. To reduce the potential risks for air quality, the Dutch Government could decide to tighten the emission limit values for the relevant installations or to introduce technology standards. Prior to taking further actions on smaller to medium scale installations, detailed data need to be collected on the number and size of current and new installations, fuel types, actual emissions, existing and new emission control technologies and various costs.
To reduce NMVOC emissions in small to medium scale installations, technical measures such as oxidation catalysts are available. But more research is needed on the effects on catalyst materials of impurities in the flue gas from biogas and biomass combustion (Kroon, 2010). The most effective measure to reduce particulate matter and NMVOC emissions from household wood burners (in residential areas) is to install certified stoves (Boersma et al., 2009).
Legislation plays a key role in reducing risks for disbenefits from biofuels.
Based on a literature review, Verbeek et al. (2008 and 2009) concluded that there is a risk of an increase in air polluting emissions from vehicles running on low or high biofuel blends. The risks are expected to be the greater with high biodiesel blends for truck engines. These high biodiesel blends are not recommended at all for passenger cars because the technical adjustments required are relatively more expensive than required for trucks. In order to reduce the risks, high biodiesel blends need to be included in type approval procedures for new dedicated trucks with advanced emission control (EGR, SCR, diesel particulate filters) that are build to run on high biodiesel blends.
Guidelines could be given, for example, that include a selection of trucks that are properly modified for high biodiesel blends. Such modifications include adjusted fuel storage and pump systems, increased lube oil storage and oil filter size, and dedicated software for the emission control devices. Moreover, truck fleets running on high biodiesel blends need to be monitored on emission control system performance, failure rates and durability. The fuel quality (low and high blends) needs to be monitored extensively.
Photo 2 Dutch Minister Van der Hoeven (Economic Affairs) purchases CO2-credits in Latvia. (Photo: Goos van der Veen/Hollandse Hoogte).
Co-impacts of climate policies on air polluting emissions in the Netherlands 19 The risks are generally lower for vehicles running on ethanol
blends, because high blend ethanol (E85) has already been included in the type approval procedure for flexi-fuel vehicles. For the low blends, E5 has been implemented and the manufacturers have made a commitment to levels up to E10 for new vehicles. Ethanol blend quality - both low and high blends - needs to be monitored including the long-term durability of fuel systems, engines and emission control devices.
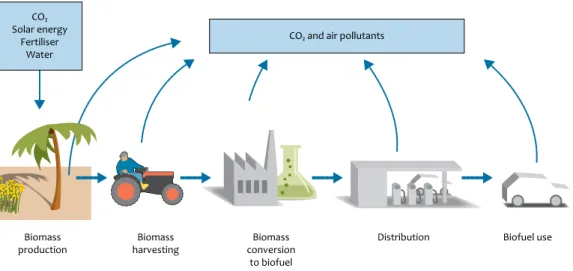
Air polluting emissions from the bioenergy production chain may need attention
The contribution of bioenergy production chains (biomass, biogas and biofuels) to total Dutch air polluting emissions in 2020 is estimated to be limited. The renewable energy targets for electricity and heat production and road transport require that only a limited part of the fossil fuels to be replaced by bio-energy fuels. If renewable energy targets are increased requiring more bioenergy to be produced, more changes can occur in parts of the bioenergy production chains for some air pollutants in and outside the Netherlands. This means that air pollution from bioenergy production chains needs to be considered in the development of renewable energy strategies. These strategies may include tighter emission limit values for parts of the production chain of biomass, biogas and biofuels.
Need to monitor air polluting emissions in CCS pilot projects Air pollutant emission profile of power plants and industries equipped with CCS are difficult to estimate. Many studies are based on assumptions on technological configurations and performances rather than on measurements. Little information is available on technologies in the laboratory or pilot phase and environmental performance is often discussed qualitatively, if at all. For more accurate estimates, measurements in demonstration projects using carbon capture technologies are required. These measurements are needed to improve analysis of the effects on air pollutants from the future application of CCS in power and industries for 2020 and beyond.
Current legislation does not prevent disbenefits from CCS A issue emerging from this study is that current legislation does not always prevent the risk of an increase in absolute emissions, for example of NOx emissions with CCS application in the power sector. Current European and Dutch legislation for power plants (e.g., the European Industrial Emission Directive and the Dutch NOx emission trade system) sets relative emission limit values for air pollutants per unit flue gas (M3) or per unit primary energy used. Because both flue gas quantities and primary energy use increase in a fossil fuel installation equipped with CCS, absolute emissions of some air pollutants may also increase. This could affect local air quality and the attainability of national emissions ceilings or sectoral targets for air polluting emissions.
Figure 6 CO₂ and air polluting emissions from biofuel production chains
Biomass
production harvestingBiomass conversionBiomass to biofuel
Distribution Biofuel use
CO₂ Solar energy
Fertiliser Water
CO₂ and air pollutants
Note
1 The Dutch and the European target (10%) are the same for the share of renewable energy in road transport energy consumption in 2020. However, the feasibility of a mandatory 20% biofuels share is being explored by the Netherlands.
Co-impacts of climate policies on air polluting emissions in the Netherlands 20
The reports of the Dutch Research Programme on air
and climate
Boersma, A.R., J. Pels, M. Cieplik, R. Linden, R. van der Hesseling, and W. Heslinga, (2008), Emissions of the Use of Biomass Fuels in Stationary Applications, A First Inventory Within the Framework of the ‘Beleidsgericht Onderzoeksprogramma Lucht en Klimaat BOLK’ 2008-2009, ECN report BKM-2008-81, Petten, the Netherlands
Boersma A.R., Lako P., Van den Linden R., Van Doorn J., Jansen B., Kok H.G.J., Heslinga D.C. (2009), Air pollutant emissions from stationary installations using bio-energy in the Netherlands, BOLK Phase 2, report no. ECN-E-09-067, Energy Research Centre of the Netherlands, Petten, the Netherlands. Hammingh, P., K. Smekens, R. Koelemeijer, B. Daniels, P. Kroon (2008). Effects of climate policies on emissions of air pollutants in the Netherlands, First results of the Dutch Policy Research Programme on Air and Climate (Beleidsgericht Onderzoeksprogramma Lucht en Klimaat [BOLK], Report 500146001/2008, PBL Netherlands Environmental Assessment Agency, Bilthoven, the Netherlands, ECN Report ECN-E-08-064, Petten, the Netherlands.
Harmelen T., Koornneef, J., Horssen, A., Ramirez, A., Van Gijlswijk, R., (2008), The impacts of CO2 capture technologies on transboundary air pollution in the Netherlands, TNO and University of Utrecht, Utrecht, the Netherlands.
Horssen, A. Kuramochi, T., Jozwicka, M., Koornneef, J., Harmelen, T., Ramirez, A. (2009), The impacts of CO2 capture technologies in power generation and industry on greenhouse gas emissions and air pollutants in the Netherlands, Netherlands Organization for Applied Scientific Research (TNO), Utrecht, the Netherlands with the University of Utrecht, Utrecht, the Netherlands
Koper, M., C. Hamelinck, and R. Chifari, (2008), Quick scan local emissions biofuels scenarios. Ecofys final report June 2008, Utrecht, the Netherlands.
Koper M., Van den Berg M., Hamelinck C. (2009), Air polluting emissions from biofuel and biomass supply chains. Final report BOLK II. Report no. PBIONL082734, ECOFYS, Utrecht, the Netherlands.
Verbeek, R., R.T.M. Smokers, G. Kadijk, A. Hensema, G.L.M. Passier, E.L.M. Rabe, B. Kampman, and I.J. Riemersma (2008), Impact of Biofuels on Air Pollutant Emissions from Road Vehicles, TNO-CE report MON-RPT-033-DTS-2008-01737, TNO Delft and CE-Delft, the Netherlands.
Verbeek R., Kampman B., Rabe E.L.M., Rijkee X., Ligterink N., Bleuanus S. (2009), Impact of biofuels on air pollutant emissions from road vehicles, phase 2, Report no. MON-RPT-033-DTS-03967, Netherlands Organization for Applied Scientific Research (TNO), Delft, the Netherlands.
Co-impacts of climate policies on air polluting emissions in the Netherlands
Policy and scientific context 23 What are the synergies and trade-offs between climate
and air pollution policies and why have they become important issues in Europe? How are they related to recent developments in both climate and air pollution policies? Firstly, the synergies and trade-offs are introduced (Section 1.1), and then, the key developments in climate and energy policies are presented (Section 1.2). Special attention is given to the flexible instruments and renewable energy targets in the European Climate and Energy Directives, and the potential consequences for air polluting emissions. An outlook is given of potential co-benefits in the longer term of stricter climate policies (2050-2100).
Secondly, the key developments in air pollution policies are described (Section 1.3). One of the key issues is how to include the co-impacts (co-benefits or disbenefits) of European climate and energy into the ongoing revision of national emissions ceilings for 2020. Finally, European and national integrated assessment methodologies are described briefly that are used to quantify the effects of the synergies and trade-offs on energy use and emissions projections (Section 1.4).
1.1 Synergies and trade-offs between climate and air
quality policies
Climate change and air pollution are linked
Climate change and air pollution are linked in many ways. Greenhouse gases (GHG) and air pollutants have a number of common sources, such as combustion of fossil fuels and agricultural activities. Climate change, for example, affects atmospheric transport and air chemistry such as increasing temperatures and dry conditions (Pleijel, 2009). Climate change could thus result in changes in concentration, dispersion and deposition of air pollutants. It could also change precipitation patterns which could alter critical loads and the sensitivity of vegetation to air pollution.
However, air pollution could also have an effect on climate change. Some air pollutants (such as sulphates) have a cooling effect and others (such as ozone and black carbon) contribute to temperature increases. Air pollution could cause changes in regional precipitation patterns. Its effects on the ecosystem could also contribute to changes in the carbon cycle. Ozone damage will reduce carbon sequestration, and increased nitrogen deposition levels (in N-limited ecosystems)
will stimulate carbon uptake. These physical relationships mean that policies on climate, energy and air quality policies are also linked.
Effects of climate policies on air polluting emissions The main benefits of climate and energy policies are decreasing dependency on imported energy, reduced GHG and air polluting emissions and stimulation of technological developments. Most co-benefits for air quality originate from energy savings, improved energy efficiency and a move towards lower, carbon-based energy production. Specific measures that can be taken include switch from coal to gas and promotion of the use of renewable energy such as wind, solar and hydropower. Quite a lot is known about the co-benefits arising from such measures. However, there are also a number of important climate measures and policies where little is known about the co-benefits and where even disbenefits can emerge. Specific measures that can potentially result in disbenefits include use of biofuels in transport, use of biomass, biofuels and biogas in stationary installations, and CCS. Examples of climate, energy and air pollution mitigation measures for the Netherlands with their multiple pollutant effects are presented in Table 1.1.
Effects of air quality policies on climate change
Recent studies have revealed effects of air polluting emissions on near-term climate change (Pleijel, 2010). Aerosols and tropospheric ozone exert strong (positive or negative) radiative forcing while present in the atmosphere, and deposition of black carbon decreases surface albedo. Thus, in addition to immediate effects on human health and vegetation, air polluting emissions will influence the rate of temperature change in the near term and could accelerate melting of ice sheets in the Arctic and of Alpine glaciers. These effects are in addition to the effects of long-lived GHGs, such as CO2. While the precursor emissions for ozone and aerosols that cause these effects (SO2, NOx, PM, VOC, NH3) are currently widely controlled in Europe, there is interest in further emission reductions to improve human health and ecosystem sustainability. However, analyses of the costs and benefits of further measures do not as yet consider the near-term impacts on climate change, and thus might lead to counter-productive side-effects of air pollution control strategies on climate change.
For this purpose, the GAINS model used in the revision of the Gothenburg protocol to identify effect-based cost-effective
Co-impacts of climate policies on air polluting emissions in the Netherlands 24
emission control strategies is being extended to include the radiative effects of short-lived climate forcers. This would enable quantification of the near-term climate effects of air pollution control strategies that aim to protect human health and ecosystems (Maas, 2010). The model can also be used to develop an optimal strategy for both air quality improvement and climate change mitigation.
Climate change, air pollution and health
Climate change may influence health effects related to air pollution in many ways. Higher temperatures can lead to increased levels of air pollutants, such as ozone and secondary inorganic particles. Air pollution may interact directly with temperature, such as during heat wave-related mortality episodes. Furthermore, there is evidence of interactions between traffic-generated air pollution and pollen exposure in relation to allergy, particularly in children (Bellander, 2009). In general, the anticipated climate changes are mostly expected to aggravate the adverse health effects of air pollution. Thus, preventive action focusing on air pollution exposure would be expected to reduce some of the climate-related health effects and vice versa.
Climate change and air pollution are closely connected not only with regard to interactions in causing health effects. Some measures against climate change may strongly influence air pollution levels and vice versa. For example, greater use of solid biomass fuels in domestic heating will increase emissions of air pollutants without adequate protective technology. A change in particulate matter levels in the atmosphere is expected to change its greenhouse properties, but in which direction may depend on the type
of particulate matter. Health effects need to be adequately considered in prioritising climate measures.
Climate policy will decrease the cost of air quality policies An analysis by Amann et al. (2007) has shown that EU climate policy aiming at 20% CO2 reduction in 2020 will decrease the cost of additional air pollutant mitigation measures to achieve the ambition of the EU-Thematic Strategy for Air Pollution from 7 to 2 billion euros per year in 2020. Moreover, the cost of current air pollutant legislation will decrease from 75 to 65 billion euros (Figure 1.1). The preliminary analysis also indicates that the cost of climate policies within the EU (that reduce GHGs by 20% in 2020) is of the same order of magnitude as the cost of the air quality policies in 2020. The benefits for the Netherlands of reduced air pollution mitigation costs were also estimated in the first integrated report of the Dutch Research Programme (Hammingh et al., 2008). An update of these cost benefits estimates is given in Section 3.3.
1.2 Developments in climate policies
New short- and long-term targets in European climate and energy policies
Climate and energy targets for Europe differ under international and European agreements. In the short term, Europe has a Kyoto protocol target of 8% reduction in GHG emissions in the 2008-2012 period on the Kyoto base years. A recent report concluded that the EU is on track to meet its Kyoto protocol commitments (EEA, 2009).
Control measures in the Netherlands with effects on multiple pollutants1
Structural measures – Energy savings, efficiency improvements: bans all pollutants
– Biomass: CO2 $NOx , PM, SO2 , HC#
– Nuclear power generation : CO2 , SO2 , NOx , PM, HC $
– Wind power generation : CO2 , SO2 , NOx , PM, HC $
– Solar power generation : CO2 , SO2 , NOx , PM, HC $
Stationary sources – Advanced residential combustion: CO2 , NOx , HC $
– Large co-generation (CHP): CO2 , SO2, NOx , PM $NMVOC #
– Small co-generation (CHP): CO2 , SO2 , PM $NOx , CH4 , NMVOC #
– SCR, SNCR: NOx $, NH3 #
– FGD: SO2 , PM $, CO2 #
– Biomass co-firing in gas: CO2 $NOx , PM, SO2 #
– Biomass co-firing in coal: CO2 , SO2 , PM $NOx , NMVOC#
– CCS (post combustion, coal) : CO2 , SO2 $NOx , PM, NH3 #
– CCS industry : CO2 $NOx , PM, SO2 #
– Heat pumps : CO2 , NOx $PM, SO2 #
Mobile sources – Euro-standards: NOx , PM, HC $NH3 #
– Road pricing : CO2 , NOx , PM $
– Road fuel taxes : CO2 , NOx , SO2 , PM $
– CO2 standards cars/trucks: CO2 , SO2$
– Biofuels road vehicles: CO2 $
– Electric vehicles2: CO2 $NOx , SO2 #
Agricultural sources – Low nitrogen cattle feed: NH3 , CH4 $
– Improved injection of manure: NH3 $N2O #
– Anaerobic digestion-biogas: CO2 , CH4$NOx , SO2 , NMVOC, PM #
– Anaerobic digestion (CHP): CO2 , CH4 , SO2 $NOx , NMVOC, PM #
– Air scrubbers animal housings: NH3 , PM $CO2 #
Other sources – Green gas landfill/sewage treatment: CO2 , CH4 $NOx , SO2 , PM, NMVOC #
1After a concept by IIASA. The Dutch control measures are part of the Dutch Options Document, see Section 1.4 .
HC = Hydrocarbons, CH4 = methane, PM = particulate matter.
2 Effects based on electricity from fossil-fuelled electricity generation (66% coal-based). Net CO
2 effects are small and net PM
effects are negligible.
Policy and scientific context 25 On the way to longer term targets, European leaders have
adopted a climate and energy package in various Directives in 2009 that contain actions and ambitious targets for 2020 (EC, 2009a; EU, 2009a; 2009b; 2009c; 2009d). Europe is now committed to cutting GHG emissions to at least 20% below 1990 levels by 2020 and this commitment will rise to 30% if other industrialised countries agree to do the same. To achieve this level of reduction, targets have been set to boost energy efficiency by 20% by 2020; to increase the share of renewable energy in energy production to 20% on average across the EU by 2020; and to derive 10% of energy used in transport from renewable sources by the same year. The package also includes specific targets for each Member State. These targets will contribute to decreasing EU dependence on imported energy, to reducing GHG and air polluting emissions, and to stimulating technological developments. EU-ETS and flexible mechanisms in N-ETS lead to uncertainty in timing and location of co-impacts on air polluting
emissions
The EU climate and energy package strengthens the European CO2 Emission Trading System (EU-ETS Directive; EU, 2009a) to cover all major industrial emitters and aviation by 2012 and introduces more auctioning. About 43% of total GHG emissions in Europe (EU 27) were emitted by ETS installations in 2008 (EEA, 2010). A single EU-wide cap on emission allowances will apply from 2013 and will be cut annually, reducing allowances available to businesses to 21% below the 2005 level in 2020 (or a reduction of 14% relative to 1990). The EU-ETS allows participants in the system to buy and sell allowances anywhere in Europe. So, if a business needs to reduce GHG emissions, allowances can be purchased anywhere in Europe or investment made in measures to reduce their own (and our national) emissions. Such measures
include fuel switches, greater energy efficiency and an increased share of renewable energy production and CCS. Various studies have shown that climate measures also lead to substantial reductions in air pollutants. However, the trading flexibility makes it more difficult to forecast the future location of climate measures in Europe and thus to estimate the location of co-benefits for air polluting emissions. Participants in the EU ETS are allowed to buy CO2 credits from GHG reduction investments in other countries through the Clean Development Mechanism (CDM) and Joint Implementation (JI). The credits available to EU-ETS sectors between 2013 and 2020 are currently limited to unused credits from the Kyoto trading period 2008-2012 in order to promote EU internal emission reductions. Due to the recession, a larger proportion of these credits is more likely not to be used between 2008 and 2012 and will be kept by operators for the 2013-2020 period (ECOFYS, 2009). The maximum unused credits for the Netherlands could be about 44 Mt CO2 eq. If these credits were used in equal amounts every year between 2013 and 2020, about 5 Mt credits would be available in 2020 to Dutch participants in the ETS. Participants could also save more credits for later years towards 2020 (with possibly higher CO2 prices) and a larger amount could be used in 2020. The uncertainty in the amount and timing of credits used makes it more difficult to forecast national climate measures in a certain year and thus to estimate the related co-benefits for air quality in that year.
In the sectors not covered by the ETS such as buildings, transport, agriculture and waste, EU-wide emissions are to be reduced by 10% below 2005 levels by 2020 (Effort Sharing Directive; EU, 2009b). A linear reduction has to be made
Photo 3 Preventive action in the town Bac Giang, Vietnam, to reduce the population’s exposure to dust and heat (© P. Hammingh)