Report 607370002/2010 M. Rutgers et al.
Priority areas in the Soil Framework
Directive
RIVM Report 607370002/2010
Priority areas in the Soil Framework Directive
The significance of soil biodiversity and ecosystem services
M. Rutgers, RIVM
G.A.J.M. Jagers op Akkerhuis, Alterra J. Bloem, Alterra
A.J. Schouten, RIVM A.M. Breure, RIVM Contact:
Michiel Rutgers
Laboratory for Ecological Risk Assessment, RIVM michiel.rutgers@rivm.nl
This study has been commissioned by the Ministry of Housing, Spatial Planning and the Environment, Directorate for Sustainable Production, within the framework of RIVM project M/607370, Priority Areas and Loss of Soil Biodiversity.
© RIVM 2010
Parts of this publication may be reproduced on the condition that the source is acknowledged as follows: 'National Institute for Public Health and the Environment (RIVM), the title of the publication and the year of publication'.
Abstract
Priority areas in the Soil Framework Directive
The significance of soil biodiversity and ecosystem services
Soil biodiversity decreases when soil organic matter declines or when soil is compacted. A decrease in biodiversity may threaten the performance of ecosystem services such as agricultural production, groundwater and surface water cleaning and climate regulation. This is the outcome of a quick scan that aims to clarify the relationship between organic matter decline, soil compaction and soil biodiversity. The quick scan was based on a combination of information sources, such as literature reviews, biological monitoring data from a nationwide soil monitoring network and best professional judgment.
Seven soil threats are distinguished in the draft text of the Soil Framework Directive of the European Commission. Soil organic matter decline and soil compaction are the most relevant for the Netherlands due to intensive agricultural land management. Loss of soil biodiversity should be considered when identifying priority areas requiring protection from organic matter decline and compaction. This report describes the first steps in clarifying the relationship between soil biodiversity and decline in soil organic matter or soil compaction. The objective is to support the Netherlands in preparing for ratification of the Soil Framework Directive.
Key words:
priority areas, Soil Framework Directive, Thematic Strategy on Soil Protection, soil biodiversity, soil threats, soil organic matter, soil compaction, ecosystem services
Rapport in het kort
Prioritaire gebieden in de Kaderrichtlijn Bodem
Belang van bodembiodiversiteit en ecosysteemdiensten
Bij een afname van het organischestofgehalte of bij verdichting van de bodem daalt de
bodembiodiversiteit. Een daling van de bodembiodiversiteit zal de bodem ook minder goed in staat stellen om zogenaamde ecosysteemdiensten te leveren, zoals agrarische productie, schoon grond- en oppervlaktewater en de regulering van het klimaat. Dit is de uitkomst van een verkenning naar relaties tussen organischestofgehalte, bodemverdichting en de bodembiodiversiteit. De conclusies van de verkenning zijn gebaseerd op een combinatie van informatiebronnen, namelijk literatuuronderzoek, gegevens uit het landelijke meetprogramma met de Bodembiologische Indicator en best professional judgment.
In de concepttekst van de Kaderrichtlijn Bodem van de Europese Unie worden zeven
bodem-bedreigingen onderscheiden. Afname van het organischestofgehalte en bodemverdichting zijn de twee bedreigingen die het meest relevant zijn voor Nederland. Ze hangen samen met intensief landbouw-kundig bodembeheer. Het behoud van biodiversiteit is een criterium dat een rol speelt bij alle bedreigingen van de bodem. De afname van de bodembiodiversiteit kan een factor zijn bij het
aanwijzen van zogenaamde prioritaire gebieden voor deze bedreigingen. In dit rapport is een eerste stap gezet tot opheldering van de relatie tussen de bodembiodiversiteit en een afname van het organische-stofgehalte of bodemverdichting. Het onderzoek is bedoeld om Nederland voor te bereiden op de invoering van de Kaderrichtlijn Bodem.
Trefwoorden:
prioritaire gebieden, EU-Kaderrichtlijn Bodem, Europese Bodemstrategie, bodembiodiversiteit, bodembedreiging, bodemorganischestof, bodemverdichting, ecosysteemdiensten
Preface
The exploratory research carried out within the framework of this report builds on a long tradition of cooperation between various centres of expertise and research in the field of soil biology. This cooperative effort is coordinated by the interdepartmental biodiversity consultation groups of the Ministries of Housing, Spatial Planning and the Environment (VROM) and Agriculture, Nature and Food Quality (LNV) and is financed on a project basis by VROM and, through co-financing, by LNV. It concerns the development of the Biological Indicator for Soil Quality (BISQ) and Biological Soil Quality References. The BISQ is used in the Netherlands Soil Monitoring Network (NSMN), in which soil samples are taken every year from between 40 and 50 locations and characterised using an extensive set of biological indicators for soil quality. The Laboratory for Soil and Crop Analysis (Blgg), the Louis Bolk Institute, the Soil Quality Department of Wageningen University, Grontmij, TNO and Deltares are also partners, as well as the authors’ research institutes (Alterra and RIVM). The conclusions drawn in this report regarding soil biodiversity in relation to a possible decline in organic matter content or increase in soil compaction would not have been possible without the data from these partners. The authors would like to thank the following people for their contributions to this report (in alphabetical order): An Vos, Arthur de Groot, Bert van Dijk, Erik Steenbergen, Harm Keidel, Henk Siepel, Jaap Bogte, Jack Faber, Kristel Siepman, Lijbert Brussaard, Marja Wouterse, Meint Veninga, Nick van Eekeren, Niels Masselink, Rob Baerselman, Ron de Goede, Ruud Jeths, Tamas Salanki, Wim Didden (†) and Wim Dimmers.
The research team was supported by an advisory committee that provided valuable suggestions in the design and implementation phases of the research and discussed and provided useful comments on the draft version of the report. The authors would like to thank the following members of the Advisory Committee (in alphabetical order): André Smits (Province of Drenthe), Joke van Wensem (TCB), Maartje Nelemans (commissioner of the project; Ministry of VROM) and Monique Brobbel (Ministry of LNV).
This report was first published in Dutch:
Rutgers, M., Jagers op Akkerhuis, G.A.J.M., Bloem, J., Schouten, A.J., Breure, A.M. (2009) Prioritaire gebieden in de Kaderrichtlijn Bodem: belang van bodembiodiversiteit en
ecosysteemdiensten. Report 607370001, RIVM, Bilthoven.
Contents
Summary and conclusions 11
1 Introduction 13
1.1 The Soil Framework Directive 13
1.2 Soil biodiversity and research criteria 14
1.3 Structure of the report 16
2 Organic matter and soil biodiversity 17
2.1 Introduction 17
2.2 Organic matter thresholds 18
2.3 Trends in organic matter 19
2.4 Relationship between soil biota and organic matter 21
2.5 Abiotic monitoring data from the NSMN 22
2.6 Relationship
between land use and biodiversity in the BISQ database 23
2.7 Relationship between organic matter and biodiversity 26
2.8 Other soil properties: pH and clay particles 30
2.9 Conclusion and recommendations for organic matter 32
3 Soil compaction and soil biodiversity 35
3.1 Introduction 35
3.2 Monitoring soil compaction 37
3.3 Susceptible soils according to the EU 40
3.4 Relationship between soil biota and soil compaction 42
3.5 Conclusion and recommendations for soil compaction 46
4 Relationships between soil threats and ecosystem services 47 5 Towards a framework for the identification of priority areas 51
6 SWOT analysis of the quick scan 53
References 57 Appendix 1 61
Summary and conclusions
This report describes a quick scan of the opportunities for the inclusion of loss of soil biodiversity in the identification of priority areas. Priority areas are a component of the Soil Framework Directive (SFD) and are partly intended to stimulate Member States to develop land management policies (EC 2006, 2009). The SFD requires that priority areas are identified for a number of soil threats, such as soil compaction and decline in soil organic matter content. Climate change, desertification and loss of soil biodiversity should also be taken into account. The research focused on the issues relating to loss of soil biodiversity:
• is soil biodiversity likely to decrease following a decline in organic matter content? • is soil biodiversity likely to decrease following an increase in soil compaction? • what will be the effects of a loss of soil biodiversity on the soil function?
The research provided sufficient evidence for the general conclusion to be drawn that there is a loss of soil biodiversity as a result of an increase in the two threats named above. However, this evidence is based on a compilation of fragmented research, such as literature reviews, an explorative analysis of field monitoring data from the Netherlands Soil Monitoring Network (NSMN) and best professional judgments (BPJs). It is also recognised that more specific research is required in order to obtain a better understanding of the relationship between soil degradation and soil biodiversity. The relationship with organic matter is the best studied; nevertheless, good field studies across organic matter gradients are scarce. There is also a lack of knowledge concerning the relationships between the various organic matter fractions (for example, stable soil organic matter and unstable fresh organic matter) and soil biodiversity. This exploratory research should be followed up with a statistical analysis of the data and the patterns found.
There is scientific consensus on a mental model that assumes a relationship between soil biodiversity, soil process function and the corresponding ecosystem services. These are the intentional or
unintentional services (functions) that the soil provides society with, such as agricultural products, clean groundwater and surface water and climate-regulating functions. A quantitative exploration of these relationships is still in its infancy and there was no scope within this project to take this further. Based on the BPJs and the literature study, it can be concluded that organic matter decline and soil compaction have a negative effect on soil ecosystem service performance. A general recommendation is that the concept of ecosystem services be better developed; it is relatively new and has not yet received much research focus.
It is reasonable to suggest that soil biodiversity be included in the protocol for the identification of priority areas when formulating the assessment framework (decision instrument). Based on data from the Netherlands Soil Monitoring Network (NSMN), this study shows that there is a clear loss of biodiversity as a result of a decline in organic matter content in clay soils. Biodiversity is also low in intensively managed sandy soils used for agriculture, horticulture and bulb growing (maize production was not included in this study). The general conclusion is that the intensity of land use management influences the loss of soil biodiversity as a result of soil degradation, also in relatively insensitive soils. From a sustainability point of view, it is therefore justified to consider the intensity of land use
management when developing an assessment framework, and to not exclude certain soil types that are considered to be insensitive.
The results of the quick scan were subject to a SWOT analysis (Strengths, Weaknesses, Opportunities and Threats), in which different aspects of the conclusions and background information were discussed to obtain a more balanced view of the issue. One of the conclusions drawn from this analysis is that the terminology should be made more consistent, certainly as far as the soil aspects investigated within this study (soil biodiversity, ecosystem services, organic matter and soil compaction) are concerned, to prevent differences in interpretation and semantic discussions.
1
Introduction
1.1
The Soil Framework Directive
In 2006, the European Commission presented a proposal for a Soil Framework Directive (SFD; EC 2006). This proposal has already resulted in an initial European Parliament position, and it is expected that negotiations between Member States (in the Environmental Council) will be completed in 2010. Following agreement, Member States will have two years in which to incorporate the Directive into national legislation. Two years is not long, and although the wording of the Directive has not yet been finalised, it is already clear that some elements will also be included in the final Directive. This means that research for the implementation of the Directive needs to start now. One necessary area of research concerns the identification of priority areas (previously known as risk areas), taking into account the loss in soil biodiversity.
oil Framework Directive (SFD; EC 2006). This proposal has already resulted in an initial European Parliament position, and it is expected that negotiations between Member States (in the Environmental Council) will be completed in 2010. Following agreement, Member States will have two years in which to incorporate the Directive into national legislation. Two years is not long, and although the wording of the Directive has not yet been finalised, it is already clear that some elements will also be included in the final Directive. This means that research for the implementation of the Directive needs to start now. One necessary area of research concerns the identification of priority areas (previously known as risk areas), taking into account the loss in soil biodiversity.
The SFD is intended to stimulate Member States to develop soil policy and land use management tools. The SFD calls for Member States to identify priority areas requiring protection from a number of soil threats. Six of these are named in the Directive: erosion, organic matter decline, compaction,
salinisation, landslides and acidification. The Directive provides a number of conditions for the identification of priority areas: Member States must first determine whether the seriousness of a soil
threat at local level requires its identification as a priority area, and may themselves determine the scale, extent and ambition level. Eckelmann et al. (2006) provide general criteria which may be used in this assessment. When
identifying priority areas, climate change, desertification and soil biodiversity loss must also be taken into account. Should the identified soil threats negatively affect soil biodiversity, for example, this may be an extra reason for the
identification of a priority area. A fragment of the Framework Directive as worded when the research began is shown in Box 1. The SFD is intended to stimulate Member States to develop soil policy and land use management tools. The SFD calls for Member States to identify priority areas requiring protection from a number of soil threats. Six of these are named in the Directive: erosion, organic matter decline, compaction,
salinisation, landslides and acidification. The Directive provides a number of conditions for the identification of priority areas: Member States must first determine whether the seriousness of a soil
threat at local level requires its identification as a priority area, and may themselves determine the scale, extent and ambition level. Eckelmann et al. (2006) provide general criteria which may be used in this assessment. When
identifying priority areas, climate change, desertification and soil biodiversity loss must also be taken into account. Should the identified soil threats negatively affect soil biodiversity, for example, this may be an extra reason for the
identification of a priority area. A fragment of the Framework Directive as worded when the research began is shown in Box 1.
This report contains the results of a ‘quick scan’ of existing data and available knowledge concerning the expected effects of threats on soil biodiversity, and starts a discussion of the opportunities for compiling soil biodiversity information and its application in the identification of This report contains the results of a ‘quick scan’ of existing data and available knowledge concerning the expected effects of threats on soil biodiversity, and starts a discussion of the opportunities for compiling soil biodiversity information and its application in the identification of
Box 1. Fragment from the EU Soil Framework Directive (5-6-2009, 10387/098; EC, 2009).
Article 6. Identification of priority areas requiring special protection from soil degradation processes
1. Member States shall identify priority areas, as defined in Article 2(9), on their national territory requiring special protection against soil degradation processes defined in Article 2(10).
2. By … *, and for the soil degradation processes erosion, organic matter decline, compaction, salinisation, landslides and acidification, Member States shall identify, having regard to paragraph 6, the soil degradation processes which are of relevance for their territory or part of their territory. For such degradation processes, Member States shall, at the administrative level and geographical scale that they consider appropriate:
(a) evaluate, based on but not restricted to the elements set out in the indicative list in Annex I, the extent to which their national territory is subject or likely to be subject in the near future to, i.e. at risk of, such degradation processes; (b) establish the levels of risk acceptability, which can vary from area to area, of
the soil degradation processes, having regard to the objective of preserving soil functions pursuant to Article 1(1) and the sustainable use of soil; (c) identify priority areas on their national territory […] that exceed the levels of
acceptability established in point (b).
3. For the purpose of the evaluation carried out under paragraph 2(a), Member States may base the identification of areas on empirical evidence or validated models. Where appropriate existing data, including maps and research, may be used. 4. For the purpose of paragraphs 2(b) and 2(c) Member States shall take into account,
priority areas. The emphasis is on the effects of organic matter decline and soil compaction. Little or no attention is paid to erosion and acidification as these threats are considered less relevant in the implementation of the SFD in the Netherlands. Landslides are of no significance in the Netherlands. Salinisation, according to the terminology of the SFD, is limited in the Netherlands, where it is considered a groundwater issue, to be addressed through water policy. Because the decline of organic matter is of particular significance in mineral soils, soil subsidence in the peat meadow areas resulting from the oxidation of organic matter is beyond the scope of this quick scan. A separate policy is to be developed for sustainable soil management in peat meadow areas.
1.2
Soil biodiversity and research criteria
A decrease in soil biodiversity was defined for this project as a decrease in structural elements (species diversity), processes or ecological functions, resulting in a decrease in the functional aspects of the soil. This approach is consistent with the EU project ENVASSO (Environmental Assessment of Soil for
Monitoring; www.envasso.com). The ecological functions of the soil were defined in terms of
ecosystem services, consistent with the recommendation of the Technical Committee on Soil Protection ‘An Ecological Basis for Sustainable Land Use’ (TCB, 2003), the approach taken in the Ministry of Housing, Spatial Planning and the Environment project ‘Biological Soil Quality References’ (VROM, 2005) and the RIVM/Alterra/WUR project using the Biological Indicator for Soil Quality (BISQ) ‘Soil Ecosystems and the State of Ecosystem Services in the Netherlands’ (Rutgers et al., 2008). These operational definitions are consistent with ideas in the Soil Framework Directive and the Millennium Ecosystem Assessment (MEA, 2005) concerning the role and significance of soil biodiversity, functional properties, ecosystem services and life in the soil, despite the fact that the terms used are slightly different.
From a scientific point of view, no consensus has yet been reached concerning the use of a set of indicators to express soil biodiversity, and there is no clear definition of the term ‘soil biodiversity’. Ecosystems, including the soil, are so complex as far as the relationships and processes that take place over varying scales of space and time are concerned, that no solution is expected in the short term (‘ecosystems are not more complex than you think, they are more complex than you can think’; Egler, 1977). These limitations in our knowledge and the lack of consensus are ignored for the purpose of this report. Simple ‘proxies’ (an agreed and accepted quantitative approach, for lack of a better) are therefore used instead for soil biodiversity, to either quantitatively validate or disprove the
hypothesised relationships described in the SFD. In other words, we have to do the best with what we’ve got. The proxies used fall into two categories: a measure of ‘system complexity’ (species and function diversity) or a – hypothetical – relationship with an ‘amount’ (biomass, or potential activity). More integrated proxies for soil biodiversity are described in the literature (Markert et al., 2003; Breure et al., 2005; Mulder, 2006), but their application was considered too demanding within the framework of the research described in this report.
The research makes use of the results of
measurements made using the Biological Indicator for Soil Quality (BISQ) in the Netherlands Soil Monitoring Network (NSMN). The NSMN represents about 70% of land use-soil type combinations in the Netherlands. From 1997 onwards, biological measurements have been made every year in specific land-use and soil-type
Box 2. The underlying principle (working hypothesis).
Soil biodiversity and ecosystem service performance decrease as a result of soil threats such as organic matter decline or increasing soil compaction. Theoretically, the absence of a threat means that soil biodiversity and ecosystem service performance are arbitrarily set at 100%. In the case of a theoretically maximum threat, it is assumed
categories (Rutgers et al., 2005, 2008). Most sampling locations are in agricultural areas (livestock farming and arable fields), semi-natural grasslands, woodlands and heathlands. The data set does not consist of a systematic national inventory (for example using a grid system), but is compiled according to the dominant soil types and land-use categories found in the Netherlands (Spijker et al., 2009). The results are entered into the BISQ database. It is expected that the second five-yearly soil biology measurement round will be completed in 2010, and this will include an extensive random survey of soil on agricultural land.
Data from the long-term NSMN sample set (Rutgers et al., 2009) were investigated for relationships between threats and soil biodiversity. Various components of the living soil were investigated, the extent of which depended on the availability of data and the best professional judgment (BPJ) of the researchers involved. No new research was started. Various researchers were interviewed or asked to make an estimate of expected relationships between soil threats and soil biodiversity. Other researchers were asked to specify criteria relevant to the Netherlands for the identification of priority areas
requiring protection from organic matter decline and soil compaction.
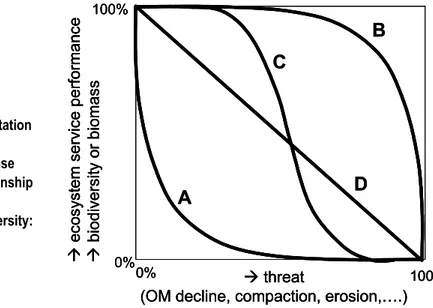
The underlying principle (working hypothesis) of this research was formulated as follows (see Box 2): soil threats, in this case a decrease in organic matter content and/or increasing soil compaction, result in a decrease in soil biodiversity. The information required for this project was collected using quick scans and was used to illustrate the working hypothesis, or to disprove it. No comprehensive statistical analysis was carried out. Instead, the plausibility of the working hypothesis was verified based on a combination of an assessment of data, interviews with experts and existing literature. As a practical model for thought and discussion, the relationship between threat and effect was expressed as four different curves: as a sensitive, an insensitive, a sigmoidal and a proportional relationship
(see Figure 1). An answer was also looked for to the question how this information may be used in future situations and which information is of use in the identification of priority areas, for example using a specific monitoring programme that focuses on a particular threat.
Figure 1. A figurative representation of the working hypothesis.
Four hypothetical dose-response curves representing the relationship between threat and ecosystem service performance or biodiversity: A. sensitive B. insensitive C. sigmoidal D. proportional Æ ec osy st em serv ice pe rfo rm an ce Æ biodiv ersit y or bio ma ss Æthreat
(OM decline, compaction, erosion,….)
0% 100% 0% 100%
A
B
C
D
Æ ec osy st em serv ice pe rfo rm an ce Æ biodiv ersit y or bio ma ss Æthreat(OM decline, compaction, erosion,….)
0% 100% 0% 100% Æ ec osy st em serv ice pe rfo rm an ce Æ biodiv ersit y or bio ma ss Æthreat
(OM decline, compaction, erosion,….)
0% 100% 0% 100%
A
B
C
D
1.3
Structure of the report
This report provides a description and an overview of a number of activities that must answer the questions: i) do the soil threats named in the draft version of the Soil Framework Directive (SFD), in this case organic matter decline and soil compaction, result in a decrease in soil biodiversity, and ii) how can soil biodiversity loss be taken into account in the identification of priority areas. The research consisted of a quick scan and a written report of this scan, potentially useful in both the policy arena and practise.
Three chapters of the report are dedicated to determining the extent of the validity of the working hypothesis, which assumes a decrease in soil biodiversity following soil degradation, in this case organic matter decline or soil compaction. To answer this question, use was made of three potential information sources:
• quantitative data from field measurements taken from real soil systems stored in the Biological Indicator for Soil Quality (BISQ) database;
• literature data on organic matter and soil compaction research carried out in the laboratory and on experimental plots, and relevant field research in specific situations;
• the best professional judgment (BPJ) of researchers working in soil ecology, stress ecology and the assessment of soil quality.
Soil biodiversity loss is related to organic matter decline and soil compaction in chapter 2 and 3 respectively. In chapter 4, the hypothesised effect on biodiversity is expressed as the soil system function in terms of ecosystem service performance. In order to do this, use was made of BPJ interviews and a questionnaire (see Appendix 1).
In chapter 5, discussion is initiated into the possibility and legitimacy of taking soil biodiversity loss into account in the identification of priority areas. The discussion concerning the strengths and weaknesses of the research described in this report is illustrated using a SWOT analysis (Strengths, Weaknesses, Opportunities and Threats; chapter 6).
2
Organic matter and soil biodiversity
2.1
Introduction
Organic matter is an exceptionally important component of the soil, as it affects the soil’s physical, chemical and biological properties. It is a source of energy and nutrients for soil biota and, through mineralisation, a source of nutrients (N, P and S) for plants. Organic matter influences the soil structure (in particular aggregate stability), water retention and water infiltration, and organic matter content and quality are therefore considered key factors in the assessment of the sustainability of soil management (Gregorich et al., 1994, 1997; Haynes, 2005).
There is no doubt that managing organic matter is essential in the maintenance of the soil ecosystem as a whole. The fact that organic matter is the primary food source for almost all soil biota is an important factor in the maintenance and promotion of life in the soil and therefore for the ecosystem services that the soil can provide (Faber et al., 2009). Maintaining organic matter is therefore of universal interest: directly for individual farmers working on the land and nature managers, as well as indirectly for water managers, water companies, investors, tourists, local residents and society as a whole.
Although the importance of soil organic matter is generally recognised, it seems to be difficult to identify priority areas requiring protection from a decline in organic matter (Körschens, 2006; Smit et al., 2007). Furthermore, generic acceptable thresholds are of no use as organic matter content varies greatly, depending on land use, soil management, soil type and climatic conditions. People working in various sectors (for example farmers or soil managers) experience few acute problems with organic matter. There is also no systematic monitoring network for determining trends in soil organic matter content. Though there are concerns regarding a decline in organic matter content, these are primarily based on data from outside the Netherlands. Smit et al. (2007) conclude that there is much interest in organic matter, but that there is a strong need for objective data to fuel the discussion. The present situation needs to be identified and defined, and data on the relationship between land use and changes
in soil organic matter content are needed.
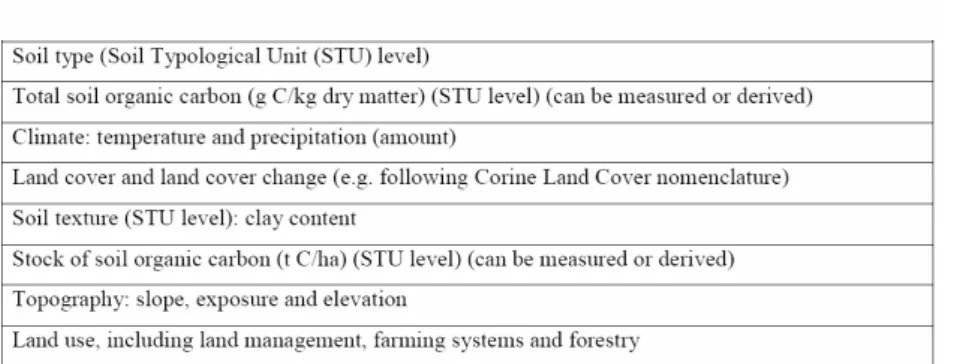
Both natural and anthropogenic factors play a role in soil organic matter dynamics. A decline in organic matter content is defined in the SFD as a steady downward trend in the organic fraction of the soil, excluding undecomposed plant and animal remains and their decomposition products, and excluding soil biomass. The SFD assumes that, in addition to natural factors and climate change, intensive rural management is also a risk factor for organic matter content (Box 3; EC, 2009).
Box 3. Table of criteria for the identification of priority areas requiring protection from a decline in organic matter content (EC, 2009).
Rural management is an important factor in the Netherlands as far as organic matter is concerned, as it is assumed that soil management that focuses on nature development presents little risk to organic matter content, due to the relatively nutrient-rich and young soils and the temperate climate (with the possible exception of the active management of drift sand and turf cutting on grassy heathlands). Eckelmann et al. (2006) indicate which soil and soil management properties may be of significance in the identification of priority areas, and that it is very difficult to derive generic threshold values, due to the dynamics and complexity of organic matter and the differences between soil types.
2.2
Organic matter thresholds
Although standards have been defined for soil pollution, there are no such thresholds for soil organic matter. A standard for organic matter could be defined as a minimum organic matter content, or an optimum organic matter content for crop production. The question however remains as to whether organic matter thresholds are an appropriate instrument for soil management. In addition, the available expertise is insufficient for the definition of such thresholds. Organic matter is a complex mixture of different compositions of small and large structural elements, making it difficult to define. In a healthy soil, organic matter is continually being supplied and removed, partly by natural processes and partly as a result of soil management. Furthermore, different organic matter thresholds would need to be defined for different soil types and land uses, making them difficult to apply.
A number of guideline values are suggested in the literature. Eckelmann et al. (2006) apply a lower threshold value of 2% organic carbon. This value is also cited in Loveland and Webb (2003), and is equivalent to an organic matter content of 3.4%. Römkens and Oenema (2004) set the threshold at 2% organic matter content. Smit et al. (2007) state that guidelines for optimum organic matter content are in use at the Dutch Agricultural Information Service (AIS), which applies the following values (with a brief remark concerning their feasibility):
• arable land on sand: 2.5% to 3.5%;
• sandy soils in general: 3% – lower values are more common, compared with other soil types; • arable land on clay: 2.0% to 2.5% – below this is ‘low’;
• excavated peatlands have a higher organic matter content.
These indicative ranges are also further refined according to land-use and soil-type category. Extensively managed soils and grasslands, which in general have a higher organic matter content, are not included, though it should be noted that these categories too may show negative trends (Hanegraaf et al., 2009). The area however over which these thresholds are not achieved will not be very large (Smit et al., 2007).
Taking all the scientific limitations into account, Smit et al. (2007) propose that priority areas requiring protection from a decline in organic matter content be identified in mineral soils using a decision tree (the exclusion method, see chapter 6 in Smit et al., 2007). Using this method, it would seem that poor soils with an organic matter content of less than 3.4% (2% organic carbon) used for maize cultivation, arable land or tree plantations are the most at risk. Focusing on a specific organic matter content threshold does not currently seem to be a suitable method for the evaluation of soil quality (Eckelmann et al., 2006). Some soils have a naturally low organic matter content and are unlikely to experience further decline. Other soils with an average organic matter content are continually at risk of further decline, and also difficult to influence through soil management. Soil management strategies that give a high chance of improvement are sometimes described for soils with low organic matter contents. Organic matter dynamics can even vary significantly between bordering plots of land (Lebbink et al.,
1994; Hanegraaf et al., 2009), making it difficult to derive area-specific or location-specific threshold values. This illustrates the undesirability of organic matter thresholds.
2.3
Trends in organic matter
It is a widely-known fact that organic matter content is dependent on soil type – young soils contain little organic matter. Land use management also has a large effect; natural soils often contain more organic matter than agricultural soils. The intensity of soil cultivation is considered to be one of the dominant factors that influence organic matter content. For example, during a 36 year-long field experiment near Ghent (Belgium), Van Eekeren et al. (2008) found the highest organic matter content in permanent grassland (6.1% DM), the lowest in permanent arable land (2.1% DM) and intermediate values for arable and grass rotations (3.3% and 3.5% DM).
The intensity of soil cultivation has supposedly been increasing for a long time, with the development of land for agricultural purposes, the drainage of agricultural land and, particularly during the last century, more intense agricultural methods using machinery. Overall, this has resulted in a lower average organic matter content in mineral soils in the Netherlands, but there is a lack of reliable data. However, recently-published data on measurements of organic matter content in agricultural soils in the Netherlands show no clear general negative trend, not even in sensitive soils (Hanegraaf et al., 2009), with individual fields showing both an increase and a decrease. This shows that local measures taken at individual field level have a large influence on organic matter content and that the monitoring of organic matter is therefore not straightforward.
Analysis of the Laboratory for Soil and Crop Analysis (Blgg) dataset indicates that sandy soils in which roughage – usually maize – has been cultivated for a long time usually showed a decline of about 1% organic matter content over the last 20 years (Smit et al., 2007). All sandy soils used for continuous maize production are at risk of dropping below the organic matter content threshold of 3.4%, as suggested by the AIS, in the near future. However, calculations made by Hanegraaf et al. (2009) show that there is no general negative trend in organic matter content in maize land and grassland on sandy soils in the Netherlands, though there is a normal distribution in the change in organic matter content. About a quarter of grassland and maize land fields, showed a decrease of at least 1% over 20 years. To prevent confusion, 1% is not a small relative decrease, but a significant decrease in absolute organic matter content. In the case of maize land, a quarter of the fields showed an increase; in the case of grassland, 60% of the fields showed an increase. It would seem that local measures taken on a single plot can have a large influence on organic matter content in the short term. This was also illustrated by Lebbink et al. (1994) using data from the pilot farm de Lovinkhoeve (Marknesse, the Netherlands), which showed that measures taken at plot level can, in the near future, ensure either a stable situation or a decrease or increase in organic matter content.
Land management has a greater and faster-acting influence on unstable (easily degradable) organic matter than on total organic matter content (Körschens, 2006). Cultivation in particular results in a decline in organic matter content; even if large amounts of organic fertiliser are applied, the level found in permanent grassland can never be reached in arable land. Organic fertiliser – manure and compost – does however have a beneficial effect on structure (larger aggregates and granule structure), though care should be taken not to apply too much as too much nitrogen is then released. There are indications that arable land has a maximum organic matter capacity, related to its clay content. Clay contains small pores that protect against decomposition. In long-term (>50 years) fertilisation experiments an increase in organic matter content of 25% was achieved in sandy clay, whereas an increase of only 11% was
achieved in light sandy soil. Once these maximum levels were reached, no further increase took place. These figures are relative percentage changes and not absolute values.
The general picture from long-term experiments on arable land is that, after 20 years of organic fertiliser application, the organic matter content was 20-30% higher than when artificial fertiliser was used. This large difference between artificial fertiliser and organic fertiliser applied to sandy soils as well as clay. The higher organic matter content was accompanied by more soil biota, more
N mineralisation and the better utilisation of nitrogen from organic matter (Faber et al., 2009).
Based on the literature, it is possible to produce a list of interventions and factors that have been shown to be important contributors to soil organic matter content decline (please also refer to Figure 2). These are, in order of decreasing significance:
• soil cultivation techniques (ploughing, harvesting root vegetables such as beet and potatoes); • soil sterilisation (steaming, flooding);
• crops that contribute little to OM (e.g. root vegetables);
• narrow crop rotations (with few grains, grasses or green fertiliser); • the removal of crop residue;
• artificial fertiliser and lime application (with exceptions); • a warmer climate.
A warmer climate results in a decline in organic matter content as higher temperatures mean that the supply of organic matter can no longer keep pace with decomposition. The influence of temperature is reflected in the higher organic matter content in the soils of north European countries (Scandinavia) compared with central European countries (Berg, 2000; EC, 2005).
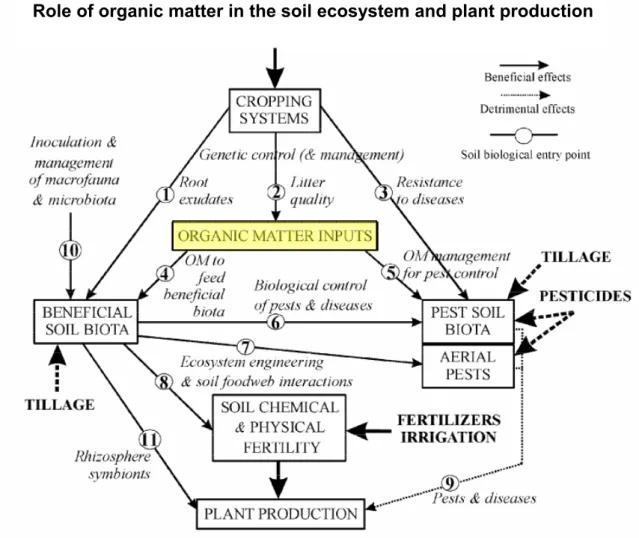
The factors named above are connected with the complex system of chemical, biological and agricultural processes that take place in the soil as shown in Figure 2. The influence of cropping systems is chosen as the point of reference in this diagram. Organic matter takes a central role in the identifiable chains of effects. The numbers in circles indicate where soil biota have an influence, though this is not addressed in detail here. The type of arrow (continuous or dashed) shows whether there are positive or negative effects on the compartments or on plant production. Plant production in Figure 2 is dependent on three factors: soil biota, soil fertility and damage by pests. Organic matter and fresh vegetation are the food source for soil biota and the stored minerals are released through the consumption and decomposition of organic matter. Biological mineralisation and chemical soil fertility together form the natural food source for plants, a process that is artificially enhanced through
Figure 2. The central role of organic matter in the soil ecosystem and the influence of cropping systems through agricultural management (fertilisation, ploughing, irrigation and pesticides), beneficial soil biota, diseases and pests and soil fertility. OM=Organic Matter (from Brussaard et al., 2007, adapted by Swift, 1999, and Susilo et al., 2004).
Role of organic matter in the soil ecosystem and plant production
2.4
Relationship between soil biota and organic matter
It has been shown in a large number of studies that organic matter has a positive effect on soil biota. The central role of organic matter in the soil ecosystem is shown, for example, in the diagram by Brussaard et al. (2007; Figure 2). Based on a study of the literature, an overview has been produced of the effects of a lower organic matter content (resulting from the interventions and factors named above) on the abundance and/or composition of soil biota (Table 1). The individual interventions, the direct or indirect consequences and the effects on soil biota are described in as much detail as possible. Almost all interventions that result in a lower organic matter content also result in a lower soil biota abundance and/or diversity.
Table 1. The effect of a low organic matter content on soil biota in relation to factors that cause a decline in organic matter content.
Causes Indirect effects Effect on soil biota
decline in OM content (general)
lower numbers and fewer species of soil biota (all groups)
decline in nematodes and bacteria
less OM: increase in earthworms,
potworms and micro-arthropods (possibly related to high OM content in arable land in fen settlements in the northeast of the Netherlands)
less OM: decrease in earthworms (Wardle, 1995; Van Eekeren et al., 2008) high temperature: OM
decomposition increases faster than OM production
OM content moves to lower dynamic equilibrium (Berg, 2000)
see: decline in OM content (general)
reduced supply of fresh organic material
reduced supply of unstable OM mesofauna more dependent on roots (Eo
and Nakamoto, 2008). Less fresh organic matter, fungi and bacteria (Pankhurst et al., 2003; Van Eekeren et al., 2008; Demšar et al., 2006)
reduced accumulation of stable OM (Adl et al., 2006)
reduced soil structure quality less habitable pore space and therefore
reduction in larger soil biota (Adl et al., 2006)
reduced drainage possibility of water saturation (resulting in
decline in soil fauna) soil sterilisation and similar
interventions
increase in bacterial OM decomposition
strong decline in all species return of system to early
successional phase
revival of rapid colonisers and opportunists
reduced aggregate stability less habitable pore space and therefore
decline in soil biota
nutrient flux brief revival of plant growth and
opportunistic soil biota
2.5
Abiotic monitoring data from the NSMN
Monitoring data from the Biological Indicator for Soil Quality (BISQ) database were used for the analysis in this chapter, which concerns abiotic monitoring data from seven categories of the Netherlands Soil Monitoring Network (NSMN); four in sandy soils (horticulture, arable land, dairy farms and semi-natural grasslands) and three in clay soils (arable land and dairy farms). Data from
a total of 228 sampled field locations were evaluated (Table 2; data previously published by Rutgers et al., 2009).
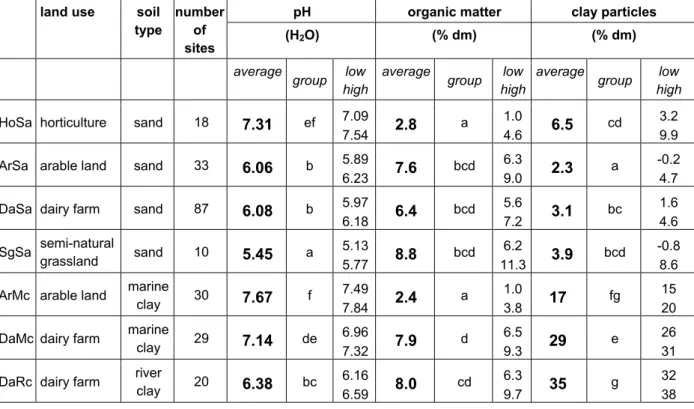
Analysis of the locations in sandy soils shows that organic matter content is lowest in horticultural soils (field production; 2.8% on average based on dry matter – Table 2) and highest in semi-natural
grasslands (8.8% on average). Though it may seem surprising that arable land on sand has, on average, an organic matter content that is roughly the same as that of dairy farms on sand (7.6% and 6.4% respectively; not significantly different), this is explained by the fact that many arable farms on sand are on excavated peatlands in the former fen settlements (the provinces of Friesland, Drenthe and Groningen). These soils contain the remains of organic matter in the mineral soils of the earlier peat. When arable farms on the higher sand deposits only are selected, the organic matter content is 3.5% on average. These results are consistent with the observation that intensive soil cultivation techniques have a negative influence on organic matter content (Faber et al., 2009; Van der Wal et al., 2008; Van Eekeren et al., 2008). Soil cultivation increases and organic matter content decreases in the order: semi-natural grassland, dairy farms (pastureland), arable land and horticulture. In addition to cultivation techniques, lime application (an increase in pH value) and the application of artificial fertiliser (no OM supply), also play a role in the increasing decline in organic matter content in arable land and
horticultural land (Faber et al., 2009).
Analysis of the data from clay soils shows that organic matter content in arable land is relatively low (2.4% based on dry matter) and higher for dairy farms on marine clay and river clay (7.9% and 8.0% respectively, Table 2; Rutgers et al., 2009). More intense cultivation methods on arable land also seem to result in a lower organic matter content in clay soils.
The conclusion is that the total soil organic matter content varies for different forms of soil
management. The highest organic matter content values are found in less intensively cultivated soils: semi-natural grassland (with extensive grazing of less than 0.5 LU per hectare) and dairy farmland. Lower organic matter content values are found in arable land and horticultural land. The same trend was found in both clay soils and sandy soils.
2.6
Relationship between land use and biodiversity in the BISQ database
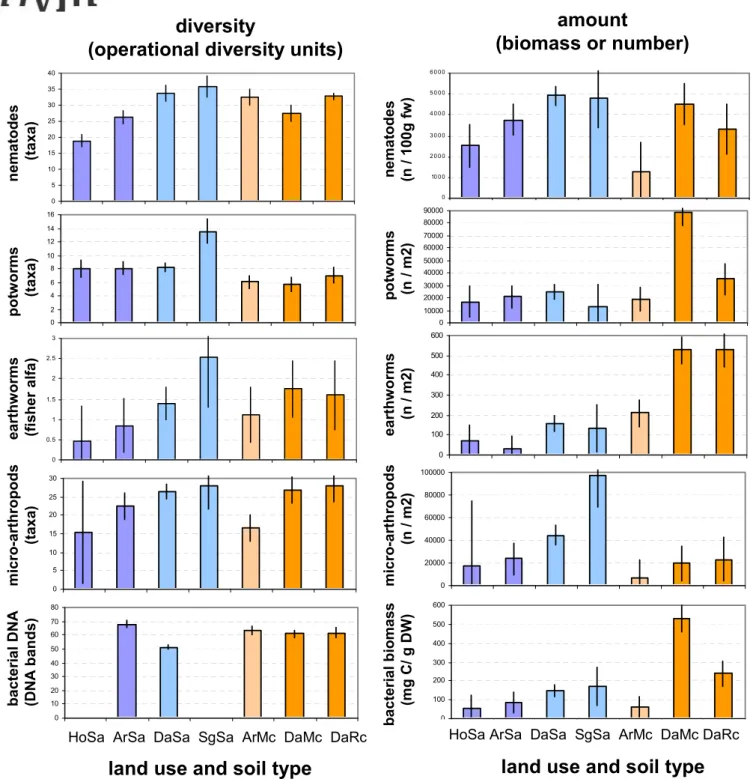
A limited set of biological monitoring data from the BISQ database was analysed to investigate soil biodiversity in the seven NSMN categories. These data concern a set of measures which, for lack of a better, represent an estimate of soil biodiversity (proxy), that can be roughly divided into system complexity (ODU or operational diversity unit) and soil biota abundance (number of organisms or biomass). These are shown in Figure 3 in the first and second columns respectively for the following groups of organisms (from top to bottom): eelworms (nematodes), potworms (enchytraeids),
earthworms (lumbricids), mites and springtails (micro-arthropods) and bacteria.
A negative correlation seems to exist between land use intensity and soil biodiversity proxies for the four categories on sand (the first four blue bars in each graph in Figure 3; from left to right: horticulture, arable land, dairy farms and semi-natural grasslands). This hypothesis seems plausible for most parameters, but not for bacteria diversity (insufficient data) and for number of potworms per square metre (no clear relationship). These results therefore agree with the hypothesis that land use intensity (cultivation techniques, as well as lime application and the application of artificial fertiliser) is correlated with a decline in organic matter content (previous section) and a decline in soil
Table 2. Some soil properties at locations in seven categories of the Netherlands Soil Monitoring Network (NSMN). The average and upper and lower threshold of the 95% Tukey confidence interval for organic matter content, pH and clay content are shown. Average differences are significant if the letters (a-g) are different. Data from Rutgers et al. (2009). The abbreviation of the category name is given in the first column.
pH organic matter clay particles land use soil
type number of sites (H2O) (% dm) (% dm) average group low high average group low high average group low high
HoSa horticulture sand 18 7.31 ef 7.09
7.54 2.8 a
1.0
4.6 6.5 cd
3.2 9.9
ArSa arable land sand 33 6.06 b 5.89
6.23 7.6 bcd
6.3
9.0 2.3 a
-0.2 4.7
DaSa dairy farm sand 87 6.08 b 5.97
6.18 6.4 bcd 5.6 7.2 3.1 bc 1.6 4.6 SgSa semi-natural grassland sand 10 5.45 a 5.13 5.77 8.8 bcd 6.2 11.3 3.9 bcd -0.8 8.6
ArMc arable land marine
clay 30 7.67 f 7.497.84 2.4 a 1.0 3.8 17 fg 15 20
DaMc dairy farm marine
clay 29 7.14 de 6.967.32 7.9 d 6.5 9.3 29 e 26 31
DaRc dairy farm river
clay 20 6.38 bc 6.16 6.59 8.0 cd 6.3 9.7 35 g 32 38
The abundance or biomass of groups of organisms seems to be quite a bit higher in grasslands than in arable land for the three categories on clay (the last three bars in each graph in Figure 3; arable land on marine clay and dairy farms on marine clay and river clay). This also applies to system complexity (ODU) proxies for earthworm and micro-arthropod communities, but not to proxies for the other groups (nematodes, potworms and bacteria).
The results for clay soils therefore largely agree with the hypothesis that land use intensity is correlated with a decline in soil biodiversity (both system complexity and abundance). A number of proxies showed no clear relationship, and no proxy showed an inverse relationship.
The general conclusion from this quick scan analysis of the BISQ database in the preceding sections is that it is plausible that an increasing intensity in soil management, as identified within the various categories of the NSMN, results in a decline in soil biodiversity. This is accompanied by, or is caused by, a decline in soil organic matter content.
amount
(biomass or number)
amount
(biomass or number)
diversity
(operational diversity units)
Figure 3. Soil biodiversity monitoring data from the BISQ database for seven land-use and soil-type categories in the Netherlands Soil Monitoring Network. System complexity is shown in the first column (ODU: operational diversity units). Soil biota abundance is shown in the second column (biomass or number). The categories (horizontal axis) are represented using the same abbreviations as in Table 2. The following groups are shown (from top to bottom): nematodes, potworms, earthworms, micro-arthropods and bacteria. The bars show the average for each category, including the Tukey 95% confidence intervals. From left to right, there are four categories on sand (blue: horticulture HoSa, arable land ArSa, dairy farms DaSa and semi-natural grassland SgSa) and three categories on clay (red: arable land and dairy farms on marine clay ArMc and DaMc, and dairy farms on river clay DaRc). Data from Rutgers et al. (2009).
0 5 10 15 20 25 30 35 40
Sa Ar Sa DaSa SgSa Ar Mc DaMc DaRc
l a n d u s e a n d s o i l t y p e Ho 0 2 4 6 8 10 12 14 16
Sa Ar Sa DaSa SgSa Ar Mc DaMc DaRc
l a n d u s e a n d s oi l t y pe Ho 0 0.5 1 1.5 2 2.5 3
HoSa Ar Sa DaSa SgSa Ar Mc DaMc DaRc
l a nd u s e a nd s oi l t y pe 0 5 10 15 20 25 30
HoSa Ar Sa DaSa SgSa Ar Mc DaMc DaRc
l a nd u s e a nd s o i l t y p e 0 10 20 30 40 50 60 70 80
HoSa Ar Sa DaSa SgSa Ar Mc DaMc DaRc
l a nd u s e a n d s o i l t y pe b acter ial D N A m icr o-ar thr o p ods ear th w o rms pot w o rm s n em atod es (D N A bands) (t ax a) ( fis h er al fa ) (t ax a) (t ax a)
HoSa ArSa DaSa SgSa ArMc DaMc DaRc
land use and soil type
0 10 0 0 2 0 0 0 3 0 0 0 4 0 0 0 5 0 0 0 6 0 0 0
HoSa ArSa DaSa SgSa Ar Mc DaMc DaRc
lan d use a n d soil t ype
0 10000 20000 30000 40000 50000 60000 70000 80000 90000
HoSa Ar Sa DaSa SgSa Ar Mc DaMc DaRc
l a nd u s e a nd s oi l t y pe 0 100 200 300 400 500 600
HoSa Ar Sa DaSa SgSa Ar Mc DaMc DaRc
l a nd us e a nd s oi l t y pe 0 20000 40000 60000 80000 100000
HoSa Ar Sa DaSa SgSa Ar Mc DaMc DaRc
l a nd us e a nd s oi l t y pe 0 100 200 300 400 500 600
HoSa Ar Sa DaSa SgSa Ar Mc DaMc DaRc
l a nd us e a n d s oi l t y pe
HoSa ArSa DaSa SgSa ArMc DaMc DaRc
land use and soil type
b acter ial bi o mas s mi cr o-ar thr o pods ear th w or m s p ot w or m s n ema to des (m g C/ g DW) (n / m2) (n / m2) (n / m2) ( n / 1 00 g f w )
diversity
(operational diversity units)
0 5 10 15 20 25 30 35 40
Sa Ar Sa DaSa SgSa Ar Mc DaMc DaRc
l a n d u s e a n d s o i l t y p e Ho 0 2 4 6 8 10 12 14 16
Sa Ar Sa DaSa SgSa Ar Mc DaMc DaRc
l a n d u s e a n d s oi l t y pe Ho 0 0.5 1 1.5 2 2.5 3
HoSa Ar Sa DaSa SgSa Ar Mc DaMc DaRc
l a nd u s e a nd s oi l t y pe 0 5 10 15 20 25 30
HoSa Ar Sa DaSa SgSa Ar Mc DaMc DaRc
l a nd u s e a nd s o i l t y p e 0 10 20 30 40 50 60 70 80
HoSa Ar Sa DaSa SgSa Ar Mc DaMc DaRc
l a nd u s e a n d s o i l t y pe 0 5 10 15 20 25 30 35 40
Sa Ar Sa DaSa SgSa Ar Mc DaMc DaRc
l a n d u s e a n d s o i l t y p e Ho 0 2 4 6 8 10 12 14 16
Sa Ar Sa DaSa SgSa Ar Mc DaMc DaRc
l a n d u s e a n d s oi l t y pe Ho 0 0.5 1 1.5 2 2.5 3
HoSa Ar Sa DaSa SgSa Ar Mc DaMc DaRc
l a nd u s e a nd s oi l t y pe 0 5 10 15 20 25 30
HoSa Ar Sa DaSa SgSa Ar Mc DaMc DaRc
l a nd u s e a nd s o i l t y p e 0 10 20 30 40 50 60 70 80
HoSa Ar Sa DaSa SgSa Ar Mc DaMc DaRc
l a nd u s e a n d s o i l t y pe b acter ial D N A m icr o-ar thr o p ods ear th w o rms pot w o rm s n em atod es (D N A bands) (t ax a) ( fis h er al fa ) (t ax a) (t ax a)
HoSa ArSa DaSa SgSa ArMc DaMc DaRc
land use and soil type
0 10 0 0 2 0 0 0 3 0 0 0 4 0 0 0 5 0 0 0 6 0 0 0
HoSa ArSa DaSa SgSa Ar Mc DaMc DaRc
lan d use a n d soil t ype
0 10000 20000 30000 40000 50000 60000 70000 80000 90000
HoSa Ar Sa DaSa SgSa Ar Mc DaMc DaRc
l a nd u s e a nd s oi l t y pe 0 100 200 300 400 500 600
HoSa Ar Sa DaSa SgSa Ar Mc DaMc DaRc
l a nd us e a nd s oi l t y pe 0 20000 40000 60000 80000 100000
HoSa Ar Sa DaSa SgSa Ar Mc DaMc DaRc
l a nd us e a nd s oi l t y pe 0 100 200 300 400 500 600
HoSa Ar Sa DaSa SgSa Ar Mc DaMc DaRc
l a nd us e a n d s oi l t y pe 0 10 0 0 2 0 0 0 3 0 0 0 4 0 0 0 5 0 0 0 6 0 0 0
HoSa ArSa DaSa SgSa Ar Mc DaMc DaRc
lan d use a n d soil t ype
0 10000 20000 30000 40000 50000 60000 70000 80000 90000
HoSa Ar Sa DaSa SgSa Ar Mc DaMc DaRc
l a nd u s e a nd s oi l t y pe 0 100 200 300 400 500 600
HoSa Ar Sa DaSa SgSa Ar Mc DaMc DaRc
l a nd us e a nd s oi l t y pe 0 20000 40000 60000 80000 100000
HoSa Ar Sa DaSa SgSa Ar Mc DaMc DaRc
l a nd us e a nd s oi l t y pe 0 100 200 300 400 500 600
HoSa Ar Sa DaSa SgSa Ar Mc DaMc DaRc
l a nd us e a n d s oi l t y pe b acter ial bi o mas s mi cr o-ar thr o pods ear th w or m s p ot w or m s n ema to des (m g C/ g DW) (n / m2) (n / m2) (n / m2) ( n / 1 00 g f w )
HoSa ArSa DaSa SgSa ArMc DaMc DaRc
2.7
Relationship between organic matter and biodiversity
The monitoring years 1999-2003 (the first complete round of monitoring data in the NSMN) were investigated in the BISQ database for relationships between organic matter content and soil biodiversity proxies, broken down by land-use and soil-type category. The aim was to discover the effect of a decline in organic matter content in each individual category, if this was possible using the data from the BISQ database. A standard regression analysis was carried out, after which the data was scanned by eye for positive and negative relationships.
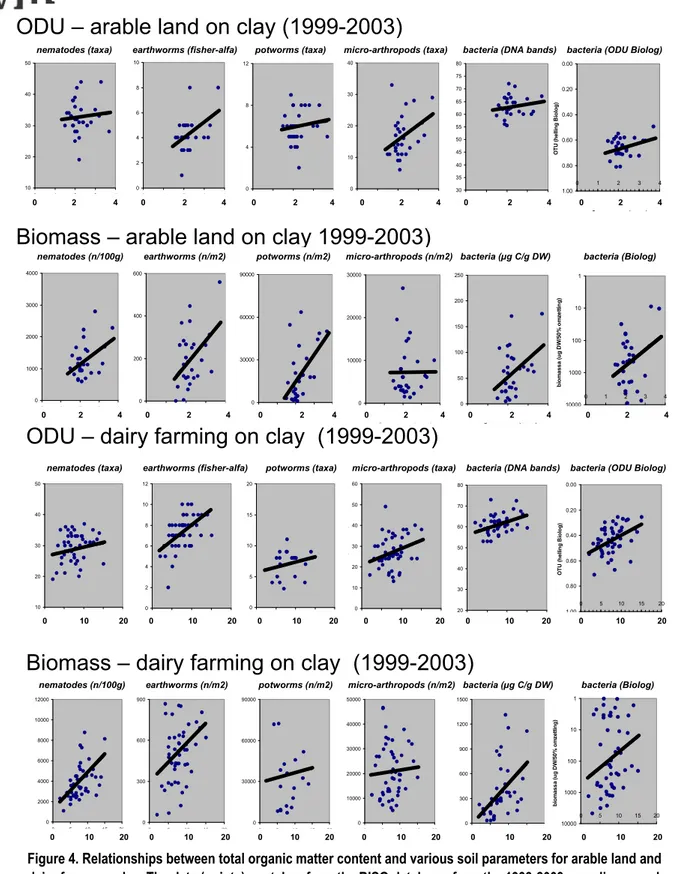
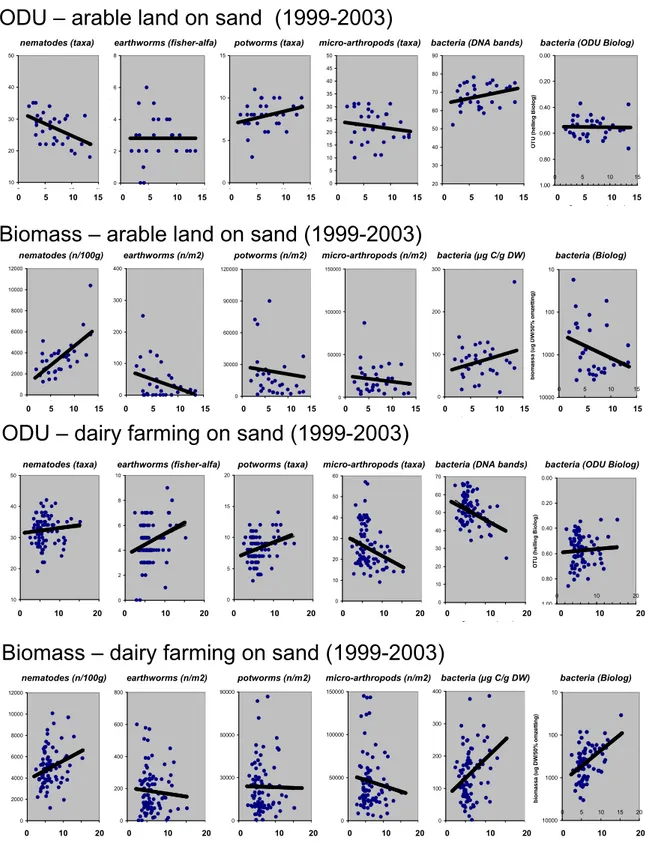
The relationships between total organic matter content and soil biodiversity proxies are shown as graphs for the categories arable land and dairy farms on clay (Figure 4) and on sand (Figures 5 and 6). Linear regression is used to decide whether the relationship is positive or negative, or does not exist at all. A rising line in Figures 4, 5 and 6 corresponds to a positive relationship between organic matter content and the biodiversity-related proxy. The vertical axis is shown in reverse for some parameters (for example bacterial biochemical diversity) to keep the graphs uniform and to enable an assessment to be made by scanning the graphs by eye. Limited correlation analysis was carried out to determine the statistical significance of the regression lines, with critical values for the correlation coefficients (P < 0.05). Most relationships were not statistically significant, though a few were. No further analysis was conducted due to the exploratory nature of this study, though it is recommended that the significant and insignificant relationships be further investigated.
Twelve regression analyses were carried out, shown in Figures 4 and 5: six for the relationship between organic matter content and the diversity parameters (ODU – operational diversity unit, such as number of taxa, Fisher alpha diversity index and functional diversity) and six for the relationship with
abundance per group and/or biomass. Four regression analyses were carried out for bacteria and two for all other organism groups. Each relationship was given a score according to whether it showed a rising line (+1), a falling line (-1) or no relationship (0). In the case of many positive though statistically insignificant relationships, it is nevertheless plausible to assume a positive relationship according to the principle of the weight of evidence; in other words, although each element does not in itself constitute convincing evidence, it does contribute to the complete set of evidence.
Figure 4 shows the results for the categories on clay. A scan of the graphs shows clear relationships with organic matter content, as no negative regressions were found: 11 (out of 12) and 12 (out of 12) respectively show positive relationships. For these categories, it is plausible that there is a positive relationship between organic matter content and soil biodiversity and the density (biomass) of the soil biota. Arable land and dairy farms on clay have very different organic matter contents, though
combining them into a single gradient for organic matter shows that all the positive relationships either remain or are reinforced. Following an analysis of all clay soils taken together (ignoring land use), the conclusion remains regarding the positive relationship between organic matter content and soil biodiversity.