RIVM report 320102004/2005
Consumer Product in vitro digestion model: bioaccessibility of contaminants from toys and application in risk assessment
AG Oomen, CJM Rompelberg, EFA Brandon, E van de Kamp, MR Duits, CHM Versantvoort, JGM van Engelen, AJAM Sips
Contact:
Esther F.A. Brandon
Centre for Substances and Integrated Risk Assessment
esther.brandon@rivm.nl
This investigation has been performed by order and for the account of the Food and Consumer Product Safety Authority, within the framework of project V/320102,
in vitro digestion model food/toy.
Rapport in het kort
Consumentenproducten in vitro digestie model: bioaccessibility van contaminanten en de toepassing hiervan in de risicobeoordeling
Slechts een beperkt aantal normen zijn beschikbaar voor de aanwezigheid van contaminanten in speelgoed. De normen die er zijn, hebben veelal betrekking op metalen. In de onderbouwing van deze normen worden aannames gedaan, onder andere over de hoeveelheid speelgoed die door een kind kan worden ingeslikt. Daarnaast wordt er veelal van uitgegaan dat 100% van de contaminant anders dan voor een aantal metalen, dat in het speelgoed aanwezig is, in het bloed wordt opgenomen en zo eventueel schade in weefsels en organen kan veroorzaken. Deze aannames zijn echter zeker niet voor ieder type speelgoed en voor iedere contaminant realistisch.
Om tot een realistische risicoschatting te komen zijn methodieken nodig om een goede inschatting te kunnen maken van de hoeveelheid contaminant die vrijkomt uit speelgoed indien hierop gesabbeld wordt (bijvoorbeeld bijtring) of delen worden ingeslikt (zoals vingerverf). In het huidige project is daarom het in vitro digestiemodel ontwikkeld. Hiermee kan worden onderzocht in welke mate de contaminant in het maagdarmkanaal wordt vrijgemaakt uit de speelgoedmatrix (de bioaccessible fractie) indien op speelgoed wordt gesabbeld en stukjes speelgoed eventueel worden doorgeslikt. Uit deze bioaccessible fractie kan eenvoudig een realistische schatting worden gemaakt van de hoeveelheid contaminant die de weefsels en organen kan bereiken.
Het in vitro digestiemodel is zo opgezet dat het enerzijds de humane fysiologie van het maagdarmkanaal zo goed mogelijk weerspiegelt en anderzijds eenvoudig, snel en goedkoop uitvoerbaar is.
trefwoorden: in vitro digestie model; biobeschikbaarheid; consumentenproduct; speelgoed; risicobeoordeling
Abstract
Consumer Product in vitro digestion model: bioaccessibility of contaminants from toys and application in risk assessment
There are only a limit number of regulatory standard for contaminants present in toys. These regulatory standards mainly concern metals. These regulatory standards are based on several assumptions, for example the amount of toy swallowed by a child. In addition, for other contaminants other than certain metals (e.g. lead) it is assumed that 100% of the contaminant in the toy will reach the blood circulation and thus can cause damage to tissues and organs. However, these assumptions are not realistic for each toy or contaminant.
To come to a realistic risk assessment, methods are necessary for a more accurate estimation of the amount of contaminant that is released from a toy in case it is sucked on (for example teething ring) or parts are swallowed (like finger paint). Therefore, an in vitro digestion model was developed in the current project. The extent of release of the contaminant in the gastrointestinal tract from a toy matrix can be studied with this model (bioaccessible fraction) in case the toy is sucked on or parts are swallowed. Using this bioaccessible fraction, a realistic estimation of the amount of contaminant that reaches the tissues and organs can be made.
The set-up of the in vitro digestion model was so that on the one hand the human physiology of the gastrointestinal tract is simulated as closely as possible and on the other hand that it is simple, fast and cheap method.
key words: in vitro digestion model; bioavailability; consumer products; toys; risk assessment
Contents
1. Introduction 9
1.1 General introduction 9
1.2 Outline of the report 9
2. Oral bioavailability and bioaccessibility of contaminants from toy matrices 11
2.1 Oral bioavailability: definition 11
2.2 Effect of matrix on bioavailability 11
2.3 Effect of matrix on absorption and metabolism 12
3. Stage 1: Development of in vitro digestion models for toys 15
3.1 Starting point and modifications 15
3.2 Design of the suck, suck-swallow, and swallow models 16
3.2.1 General set-up digestion models 16
3.2.2 Differences between digestion models 18
3.3 Aspects that should be considered in case studies 19
3.3.1 Simulating sucking 19
3.3.2 Simulating ingestion 20
4. Stage 2: Testing of some (real life) cases in the IVD model 23
4.1 Overview of experiments performed 23
4.2 Benzoic acid in finger paint 24
4.2.1 Introduction 24
4.2.2 Materials and Methods 25
4.2.3 Results and discussion 28
4.2.4 Conclusions regarding benzoic acid from finger paint 33
4.3 Lead in paint of tops 33
4.3.1 Introduction 33
4.3.2 Materials and Methods 34
4.3.3 Results and Discussion 36
4.3.4 Conclusions regarding lead from paint scraped of tops 38
5. Stage 3: Testing of IVD model against the in vivo situation 41
5.1 Phthalates in PVC disks 41
5.2 Mycotoxins in peanut and buckwheat 42
5.3 Lead in soil 42
5.4 Conclusions regarding validation of the in vitro digestion models 43
6. Stage 4: Application of the IVD model in risk assessment 47
6.1 Exposure assessment: ConsExpo 47
6.1.1 Mouthing scenario 47
6.1.2 Hand-mouth contact scenario 47
6.2 Risk assessment in ad hoc situations 48
7. Conclusions 51
7.1 Scientific conclusions 51
7.2 Relevancy for upholders 52
7.3 Relevancy for policy makers 53
References 55
Appendix 1. Experimental data of finger paint 59
Samenvatting
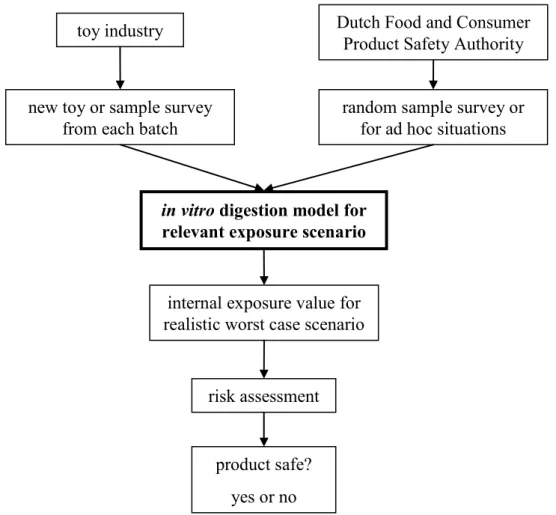
Dit project heeft geresulteerd in een eenvoudig, snel uitvoerbaar en relatief goedkoop in vitro model, het Consumentenproduct in vitro digestie model (Consumentenproducten IVD-model), waarmee het vrijkomen van schadelijke stoffen uit een bepaalde speelgoedmatrix (zoals een bijtring of vingerverf) bij sabbelen en /of inslikken door kinderen gesimuleerd kan worden. In dit rapport wordt ingegaan op de verschillende onderzoeksfasen en de belangrijkste bevindingen worden gepresenteerd.
Met de ontwikkeling van het IVD-model wordt het mogelijk om accuraat in te springen op toekomstige vragen met betrekking tot normoverschrijdingen van contaminanten in speelgoed (zoals recentelijk bij de Scoubidou-problematiek). In tegenstelling tot huidige modellen zoals het JRC-model dat door de Keuringsdienst van Waren wordt gebruikt, biedt het IVD-model niet alleen de mogelijkheid om het sabbelen te simuleren maar ook het inslikken van contaminant of gecontamineerde matrix. Tevens biedt het IVD-model de mogelijkheid om de blootstellingsscenario’s die door de risk assessors worden opgesteld zo goed mogelijk te simuleren. De verkregen data kunnen vervolgens worden gebruikt voor de blootstellingsschatting (en sluiten aan op ConsExpo) als onderdeel van de risicoschatting. Gezien het toepassingsgerichte onderzoek dat in dit project is uitgevoerd is in het hoofdstuk Conclusies naast de wetenschappelijke conclusie een apart deel aan beleidsrelevante conclusies gewijd. Ten aanzien van de beleidsrelevantie is de belangrijkste conclusie dat het van belang is dat modellen, zoals het Consumentenproduct IVD-model, in geval van ad hoc situaties worden toegepast conform de blootstellingsscenario’s als opgesteld door de risicobeoordelaars.
Summary
In this project we developed a simple, fast workable and relatively inexpensive in vitro model, the Consumer Product in vitro digestion model (Consumer Product IVD-model). With this model the release of a contaminant from a toy matrix (like a teething ring or finger paint) when a child sucks and/or swallows by children can be simulated. In the report the different research stages are described and the main results are presented.
With the development of the IVD-model, it is possible to accurately answer future questions regarding exceeding of limit values of contaminants in toys (like recently with the phthalates in Scoubidou ropes). In contrast to the currently used models like the JRC model used by the Food and Consumer Product Safety Authority, the Consumer Product IVD model not only can simulate the sucking but also the swallowing of a contaminant or contaminated matrix. Furthermore, with the IVD-model it is possible to realistically simulate exposure scenarios set up by the risk assessors. The results of the model can be used for exposure assessment (and fit ConsExpo) as part of the actual risk assessment.
The scope of the research performed for this project warrants the Chapter on conclusions including not only scientific conclusions but also a section describing the relevancy for policy makers. The main conclusion for the relevancy to policy makers is that models like the Consumer Product IVD model the experimental design can be completely adjusted to the exposure scenarios formulated by the risk assessor in case of ad hoc situations.
1.
Introduction
1.1
General introduction
The behaviour of young children as they pick up consumer products and toys, put them in their mouths, and lick their fingers, might pose them harm. Toys may contain contaminants that may affect the health of a child that is playing with a toy. Guidelines have been formulated in order to protect children’s health (NEN-EN 71-3:1995/C1:2002 en, 2002; NEN-EN 71-7:2002 (en), 2002; NEN-EN 71-9:2003 Ontw. en, 2003; Commission Directive 1999/815/EC, 1999; Commission Directive 93/11/EEC, 1993; Commission Directive 88/378/EEC, 1988). These guidelines prohibit the presence of contaminants in toys above a certain level or consider a migration limit of the contaminant from the toy. However, the experimental conditions for migration do not always simulate the physiologically situation in children. The migration limit for several metals is determined in vitro in acid (HCl, pH 1-1.5), which may result in overestimation of the true migration limit. Furthermore, in human exposure models, the possibility that not all contaminants in the toy contribute to the internal exposure is often not considered. Frequently, only a fraction of the compound is released from its matrix, and thus only a fraction contributes to the internal exposure, thereby overestimating the risk. For that reason, there is a demand for simple tools that enables to estimate the internal exposure of contaminants caused by handling toys or other consumer products by children. In addition, it would be valuable if results of the tool can be used as input for the National Institute for Public Health and the Environment (RIVM) consumer exposure model ConsExpo (Van Veen, 2001; Bremmer and Van Veen, 2002). Such a tool was thought to be found in a so called in vitro digestion model.
In vitro digestion models allow to simulate the release of a contaminant from a matrix during
transit in the gastrointestinal tract (bioaccessibility), with a three step procedure simulating the digestion process in successively the mouth, stomach and intestine. An in vitro digestion model based on human physiology was already developed to assess the bioaccessibility of contaminants from soil in the gastrointestinal tract of children (Oomen et al., 2003a). This model was used as starting point for an in vitro digestion model for toys and other consumer products.
1.2
Outline of the report
The present report represents the final report of project V/320102, “in vitro digestion model food/toys”, and gives an overview of the most relevant findings of the different stages of research, which have been included in this project.
The general aim of this project was 1) to develop a simple and fast in vitro model to simulate the release of a contaminant from a toy matrix (like a teething ring or finger paint) when a child sucks on and/or swallows a toy and 2) to apply this model into risk assessment.
To reach this goal, four stages of research have been defined:
stage 1) development of an in vitro model (including a comparison with the JRC model)
stage 2) testing of some (real-life) cases in the in vitro model stage 3) testing of the model against the in vivo situation
stage 4) application into risk assessment (more specifically, exposure assessment and relation with ConsExpo)
Stage 1
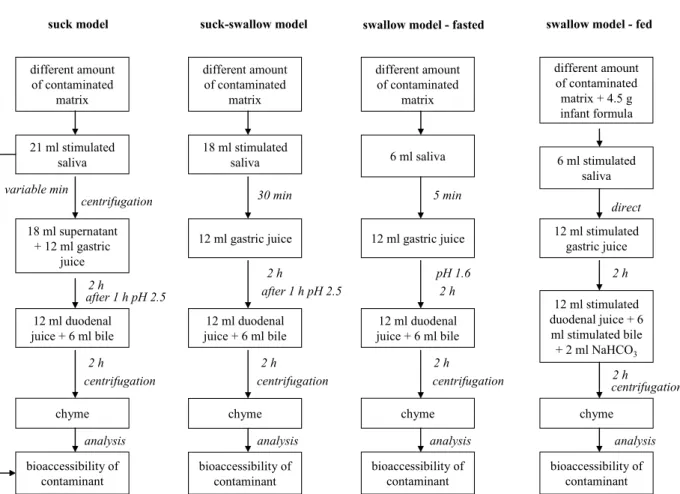
In this project, four variants of the in vitro digestion model were developed, corresponding to the three possible scenarios for the oral pathway of mouthing toys: 1) a suck model, 2) a suck-swallow model, 3) a swallow model under fasted conditions, and 4) a swallow model under fed conditions. Mobilisation of the contaminant may occur in the mouth as well as in the stomach and small intestine. When the toy itself is not ingested, only contaminants that are released from the toy in the saliva during chewing and sucking on the toy will enter the gastrointestinal tract and contribute to the exposure of the child. When the toy matrix is ingested not necessarily all contaminants will be released from the toy in the gastrointestinal tract. The contaminants still sorbed to the toy matrix in the gastrointestinal tract can be considered to be unavailable for absorption, and do not contribute to the exposure.
Stage 2
The developed Consumer Product IVD models were tested for real-life cases and spiked matrices in RIVM report 320102001 and 320102003, namely phthalate in PVC disks, azo dyes in textile, and lead in chalk and paint. In the current report an overview of these data is given and two additional real-life cases were studied with the Consumer Product IVD model (benzoic acid in finger paint and lead in paint from tops).
Stage 3
Before a certain methodology can be applied for risk or exposure assessment purposes, the methodology should have been proven to give relevant and reliable results, in other words, the methodology should have been validated. Therefore, the outcome of the in vitro digestion models was compared with the human in vivo situation.
Stage 4
The developed Consumer Product IVD models should be more reliable and more efficient than the currently used method to investigate the internal exposure. Therefore a comparison between the different models and their accuracy in prediction the in vivo internal exposure was performed.
In chapter 2 an introduction to the concept of internal exposure after ingestion (oral bioavailability) and bioaccessibility is given. In chapter 3 to 6, the most relevant findings of the four stages of the project are presented. Chapter 3 includes the development of the in vitro digestion model (Consumer Product IVD model) (stage 1), chapter 4 the testing of some (real-life) cases in the Consumer Product IVD model (stage 2), chapter 5 the testing of the in
vitro digestion models against the in vivo situation (stage 3), and chapter 6 the application
into risk assessment (more specifically, exposure assessment (relation with ConsExpo)) (stage 4). Chapter 7 summarizes the overall conclusions of the project. Within the conclusions, scientific conclusions and conclusions relevant for policy makers are distinguished.
2.
Oral bioavailability and bioaccessibility of
contaminants from toy matrices
2.1
Oral bioavailability: definition
The term oral bioavailability knows many interpretations, mostly depending on the field of research. In the present project we consider oral bioavailability of contaminants from toys in man.
Oral bioavailability is defined as the fraction of an external dose that results in internal exposure (see figure 1). The external dose represents the total amount of a contaminant that a person is in direct contact with or ingests. The contaminant is considered internal if it is absorbed from the gastrointestinal tract, transported through the liver into the systemic circulation, i.e. the central bloodstream.
Oral bioavailability consists of three processes that are schematically presented in figure 1. First, the contaminant should be mobilised from its matrix into the juices of the gastrointestinal tract. This process is driven by the digestion process which takes place in the mouth, stomach, and (small) intestine. The factor that becomes mobilised into the intestinal juice, called chyme, is referred to as the bioaccessible fraction. The mobilised contaminants can subsequently be transported across the intestinal epithelium into the portal vein. The fraction of the contaminant that passes the liver without being metabolised will reach the systemic circulation. Consequently, bioavailability (F) is the product of bioaccessibility (FB),
absorption (FA), and metabolism (FH), see figure 1.
2.2
Effect of matrix on bioavailability
The matrix in which a contaminant is present plays an important role in bioaccessibility. The matrix affects the fraction of contaminant that is released into digestive fluid during sucking or during transit through the gastrointestinal tract after ingestion. Only the contaminant molecules that are released from the matrix in the small intestine are considered to be available for intestinal absorption. The bioaccessible fraction represents thus a maximum fraction of the contaminant that can become bioavailable.
Studies with an in vitro digestion model, developed earlier in our laboratory, have shown that a considerable fraction of contaminants remains associated with soil during digestion (Oomen et al., 2003a; Oomen et al., 2002). Hence, the matrix of ingestion may lower the bioaccessible fraction, i.e. FB < 1, and thus lower internal exposure.
Figure 1. Processes in oral bioavailability.
2.3
Effect of matrix on absorption and metabolism
Compound specific properties, such as molecular weight, lipophilicity, affinity for P450 etc, determine the passage over the intestinal epithelium and the susceptibility for metabolism in the liver (Gan and Thakker, 1997). As the matrix will not affect the compound specific properties, it is not expected that once released from the matrix, the matrix itself will have an effect on the absorption or metabolism of the contaminant. However, in some cases the matrix of ingestion has been shown to affect the transport of the contaminant across the intestinal epithelium (Wienk et al., 1999). For example, food constituents may compete with the contaminant for transport across the intestinal epithelium. This is the case for some minerals and metals, e.g. lead is absorbed by the same transporters as calcium. However, as transport across the intestinal epithelium and metabolism in the liver predominantly depend on compound specific properties; mostly it can be assumed that the matrix of ingestion does not affect the transport across the intestinal epithelium or the metabolism in the liver. In that case, the difference in bioaccessibility of a compound from two different matrices reflects the difference in bioavailability of the compound from the two different matrices.
In drug research and for contaminants in soil, there is an increasing interest in the use of
in vitro methodologies to study the human bioavailability of compounds. In this research, in vitro digestion models simulate the digestion process in the gastrointestinal tract in a
external exposure small intestine portal vein liver mouth, oesophagus, stomach, small intestine systemic circulation internal exposure
exposure to an external dose of contaminant in a matrix
FB = fraction of an external dose released from matrix (bioaccessibility)
FA= fraction of FB transported across intestinal epithelium
FH = fraction of FA passing the liver without being metabolised F = fraction of external dose reaching systemic circulation = bioavailable fraction of contaminant
simplified manner by applying physiological based conditions, i.e. chemical composition of digestive fluids, pH and residence time periods typical for each compartment. Most of the
in vitro digestion models described in literature is a two- (stomach and small intestine) or
three-step procedure (mouth, stomach, small intestine or stomach, small and large intestine). The digestion is a three-step procedure (mouth, stomach, and small intestine) is physiologically the most relevant and is schematically shown in figure 2. The bioaccessibility of the contaminant can be determined in each compartment. However, absorption of compounds takes mainly place in the small intestine and therefore, the bioaccessibility determined in the chyme of the small intestine is the most important.
Figure 2. Schematic representation of an in vitro digestion model that follows a three-step procedure simulating the digestive processes in the mouth, stomach and small intestine.
[In each compartment, the matrix is incubated at 37°C for a time relevant for the compartment. The digestion is initiated by addition of artificial saliva to the contaminated matrix. Subsequently, gastric juices and intestinal fluids are added to simulate the digestive processes in stomach and small intestine, respectively. Thereafter, the concentration of the contaminant in the chyme (intestinal content) is determined.]
A similar approach can be applied for contaminants in toys. The three variants of the in vitro digestion model described in the present report have been developed for that aim.
contaminated matrix
stomach gastric juice
duodenal juice + bile centrifugation remaining matrix bioaccessibility of contaminant analysis incubation time min h h chyme saliva small intestine mouth
3.
Stage 1:
Development of in vitro digestion models
for toys
In the present chapter the development of four types of an in vitro digestion model to assess the bioaccessibility of contaminants from toys are described. The following scenarios of handling toys are discriminated: 1) child sucks on a toy and swallows the contaminants released in saliva, 2) child sucks on a toy, swallows not only the contaminants released in saliva but swallows also (pieces of) the contaminated toy matrix, 3) child swallows the contaminated toy matrix without a sucking phase under fasted conditions, and 4) child swallows the contaminated toy matrix without a sucking phase under fed conditions. The four types of the in vitro digestion model (IVD model) are referred to as type 1) suck, type 2) suck-swallow, type 3) swallow model under fasted conditions, and type 4) swallow model under fed conditions, respectively.
3.1
Starting point and modifications
As starting point for the design of the IVD model for contaminants in consumer products and toys (Consumer Product IVD model) the in vitro digestion model for soil (Soil IVD model) was used (Oomen et al., 2003a). This consists of a three-step procedure that simulates the conditions in the mouth, stomach and small intestine (see figure 2).
During the developmental phase the following factors have been modified:
• a different ratio of digestive juices was introduced for the Consumer Product IVD model than for the Soil IVD model. The ratio for the Consumer Product IVD model was adjusted to 1 : 2 : 2 : 1 for saliva : gastric juice : duodenal juice : bile juice because this ratio closer represents the ratio as present in the human gastrointestinal tract, that is, accounting for the reabsorption of digestive juices during transit.
• two variants of synthetic saliva have been introduced: stimulated (suck, suck-swallow, and swallow under fed conditions model) and normal saliva (swallow model under fasted conditions). Stimulated saliva contains higher levels of sodium and α-amylase, and a lower concentration of mucin than normal saliva (Kedjarune et al., 1997; Salvolini et al., 1999). Furthermore, the pH under stimulated conditions is slightly higher.
• two variants of synthetic gastric juice, duodenal juice and bile have been introduced: stimulated (swallow under fed conditions model) and normal (suck, suck-swallow, and swallow model under fasted conditions). Stimulated juices contains higher levels of pepsin, pancreatin, lipase and bile, and a lower concentration of sodium than normal juices (Salvolini et al., 1999). Furthermore, the pH under stimulated conditions is slightly higher.
For detailed information of the development of the IVD model see RIVM report 320102001, chapter 3 and RIVM report 320102002, chapter 3 (Oomen et al., 2003c; Oomen et al., 2004).
3.2
Design of the suck, suck-swallow, and swallow models
3.2.1 General set-up digestion models
The general set-up of the digestion models is described in the next four sections and is schematically shown in figure 3.
Type 1: Suck model
The suck-model is applied to simulate sucking of a child on a toy matrix (Oomen et al., 2003c). It is assumed that all the contaminant that is released in the mouth during sucking is also available in the small intestine for absorption. The migration of a contaminant from its matrix into saliva simulant is measured with this model. In short, different amounts of matrix are introduced to 21 ml stimulated saliva (pH 6.8 ± 0.2). This mixture is rotated head-over-heels (55 rpm) for different time periods based on mouthing data for children. At different time points, e.g. every 15 min, a small sample is taken from the digestion tube to determine the release rate of the contaminant from its matrix. Subsequently, the digestion tubes are centrifuged for 5 min at 2750 g and sampled to obtain information on the bioaccessibility of the contaminant. The whole process is performed at 37°C.
To investigate if the assumption that all the contaminant that is released in the mouth during sucking is also available for absorption in the small intestine, a modified suck model could be used. In short, different amounts of matrix are introduced to 21 ml stimulated saliva (pH 6.8 ± 0.2). This mixture is rotated head-over-heels (55 rpm) for a variable time period. The digestion tubes are centrifuged for 5 min at 2750 g and a sample of 18 ml supernatant is taken for further incubation. A volume of 12 ml gastric juice (pH 1.07 ± 0.07) is added to the saliva supernatant. The mixture is rotated for 1 h and the pH of the mixture is determined and, if necessary, set to pH 2.5 ± 0.1. Then, the mixture is rotated for another hour. Finally, 12 ml of duodenal juice (pH 7.8 ± 0.2) and 6 ml bile (pH 8.0 ± 0.2) are added simultaneously, and the mixture is rotated for 2 h. The pH of the chyme is determined and the digestion tubes are centrifuged for 5 min at 2750 g, yielding the chyme (the supernatant) and the digested matrix (the pellet). Samples can be taken from the saliva, stomach and chyme phase to obtain information on the bioaccessibility of the contaminant and its behaviour in the different compartments of the digestive tract. The whole process is performed at 37°C.
Type 2: Suck-swallow model
The suck and swallow model is applied to simulate mouthing and then ingestion of a certain toy matrix (Oomen et al., 2003b). In short, the digestion starts by introducing 18 ml stimulated saliva (pH 6.8 ± 0.2) to different amounts of matrix. This mixture is rotated head-over-heels (55 rpm) for 30 min. Subsequently, 12 ml of gastric juice (pH 1.07 ± 0.07) is added and the pH of the mixture of saliva and gastric juice is determined and, if necessary, set to pH 2.5 ± 0.1 after 1 h. The mixture is rotated for another hour. Finally, 12 ml of duodenal juice (pH 7.8 ± 0.2) and 6 ml bile (pH 8.0 ± 0.2) are added simultaneously, and the mixture is rotated for 2 h. The pH of the chyme is determined and the digestion tubes are centrifuged for 5 min at 2750 g, yielding the chyme (the supernatant) and the digested matrix (the pellet). Samples can be taken from the saliva, stomach and chyme phase to obtain information on the bioaccessibility of the contaminant and its behaviour in the different compartments of the digestive tract. The whole process is performed at 37°C.
Type 3: Swallow model under fasted conditions
The swallow model is applied to simulate ingestion of a certain toy matrix under fasted conditions (Oomen et al., 2003c). In short, the digestion starts by introducing 6 ml saliva (pH 6.5 ± 0.2) to different amounts of matrix. This mixture is rotated head-over-heels (55 rpm) for 5 min. Subsequently, 12 ml of gastric juice (pH 1.07 ± 0.07) is added and the pH of the mixture of saliva and gastric juice is determined and, if necessary, directly set to pH 1.6 ± 0.1. The mixture is rotated for 2 h. Finally, 12 ml of duodenal juice (pH 7.8 ± 0.2) and 6 ml bile (pH 8.0 ± 0.2) are added simultaneously and the mixture is rotated for another 2 h. The pH of the chyme is determined and the digestion tubes are centrifuged for 5 min at 2750 g. The whole process is performed at 37°C. Samples can be taken from the saliva, stomach and chyme phase to obtain information on the bioaccessibility of the contaminant.
Type 4: Swallow model under fed conditions
In the other swallow model fasted conditions are simulated. To simulate ingestion of a certain toy matrix under fed conditions the swallow model under fed conditions can be used. Differences in physiology between fasted and fed state may give rise to differences in bioaccessibility, as pH, salt and enzyme concentrations are different. An in vitro digestion model simulating fed conditions has been developed to quantify the bioaccessibility under fed conditions (Versantvoort et al., 2004). In short, the digestion starts by introducing different amounts of matrix to 6 ml stimulated saliva (pH 6.8 ± 0.2) and 4.5 g infant formula (product number 282, Olvarit (Nutricia®, The Netherlands), supplemented with 2 ml sunflower oil per 100 g). This infant formula with sunflower oil represents the mean food intake for adults in The Netherlands for a cooked meal regarding macronutrients and caloric composition and is based on the third Dutch National Food Consumption Survey from 1998 (Versantvoort et al., 2005). Immediately, 12 ml of stimulated gastric juice (pH 1.30 ± 0.02) is added and the mixture is rotated head-over-heels (55 rpm) for 2 h. The pH of the gastric fluid is determined and 12 ml of stimulated duodenal juice (pH 8.1 ± 0.2), 6 ml stimulated bile (pH 8.2 ± 0.2), and 2 ml sodium bicarbonate (84.7 g/l) are added simultaneously. The mixture is rotated for another 2 h and the pH of the chyme was determined. Separation of chyme and pellet was obtained by centrifugation at 2750 g for 5 min. The whole process is performed at 37°C. Samples can be taken from the stomach and chyme phase to obtain information on the bioaccessibility of the contaminant.
Figure 3. Schematic representation of the suck, suck-swallow, and swallow under fasted and fed conditions in vitro digestion models.
The articles by Oomen et al. and Versantvoort et al. describe in detail the composition and preparation of the stimulated and non-stimulated digestive fluids (Oomen et al., 2003c; Versantvoort et al., 2005).
3.2.2 Differences between digestion models
The main differences between the suck (type 1), suck-swallow (type 2), and swallow (type 3 and 4) in vitro digestion model are addressed below.
Matrix. The suck model simulates the release of contaminants from toys during sucking. In
contrast to the suck-swallow and swallow model, the matrix is not ingested. For that reason, the saliva + toy mixture was centrifuged at the end of the mouth compartment. The supernatant, i.e. the saliva without toy matrix, is used to continue the digestion process.
Stomach pH. The matrix may affect the pH in the stomach. However, in fasting conditions,
which are simulated in the digestion models type 1 to 3, the pH in the stomach is usually low. For that reason, the pH in the stomach was set to 2.5 ± 0.1 after 1 h in the suck and suck-swallow model. In the swallow model the pH of the stomach was set to pH 1.6 ± 0.1. The pH in the gastric compartment of the swallow model under fasted conditions is lower compared to the gastric pH in the suck, suck-swallow and swallow under fed conditions models, because less saliva is entering the gastric compartment in the swallow model (6 ml saliva instead of 18 ml). These pHs were chosen because an in vitro digestion without
suck model different amount of contaminated matrix 21 ml stimulated saliva suck-swallow model different amount of contaminated matrix 18 ml stimulated saliva
swallow model - fasted
different amount of contaminated
matrix
6 ml saliva
12 ml gastric juice 12 ml gastric juice
swallow model - fed
different amount of contaminated matrix + 4.5 g infant formula 6 ml stimulated saliva 12 ml stimulated gastric juice 18 ml supernatant + 12 ml gastric juice 12 ml duodenal juice + 6 ml bile 12 ml duodenal juice + 6 ml bile 12 ml duodenal juice + 6 ml bile 12 ml stimulated duodenal juice + 6 ml stimulated bile + 2 ml NaHCO3 chyme bioaccessibility of contaminant chyme bioaccessibility of contaminant chyme bioaccessibility of contaminant chyme bioaccessibility of contaminant centrifugation analysis centrifugation
centrifugation centrifugation centrifugation
analysis analysis analysis
direct 5 min 30 min variable min 2 h 2 h 2 h 2 h 2 h 2 h 2 h 2 h after 1 h pH 2.5 after 1 h pH 2.5 pH 1.6
matrix results in this pH and because this pH falls in the range of pH values for fasting conditions (Charman et al., 1997).
Volume and composition of the saliva and the mouthing time. In the suck model, the
volume is initially 21 ml, but 18 ml remains after removal of the matrix; the composition is that of stimulated saliva, and the mouthing time is variable depending on the observed mouthing time in children. For the suck-swallow model 18 ml stimulated saliva and mouthing time 30 min are employed. The swallow model simulates direct ingestion of a toy. Therefore, 6 ml saliva and incubation of 5 min are employed for the swallow model.
3.3
Aspects that should be considered in case studies
When a certain case of a matrix/contaminant combination is suitable for investigation of the bioaccessibility of the contaminant, i.e. a major exposure route is via sucking on the matrix or via oral ingestion and further insight into the actual exposure is desired, several aspects might be important to study.
3.3.1 Simulating sucking
When assessing the bioaccessibility of a contaminant from a matrix during sucking, the variables listed below should be considered to study:
• variation in suck time • intensity of sucking
• simulation of multiple suck events • variation of the amount of matrix
Variation in suck time and intensity.
When simulating sucking of children on toy matrices or consumer products, it is advisable to vary the suck time. Information about the suck time enables a derivation of the extraction rate, which can be used to refine default parameters for leaching in the fact sheet toys that is used by the exposure model ConsExpo (Bremmer and Van Veen, 2002). In addition, it provides insight in the exposure for various age categories of children, as the duration of mouthing objects depends on the age of the child. Average mouthing times of all objects including pacifiers (NL: speen) and fingers are longest for 4.5 months old children, i.e. 331 min, whereas the longest mouthing time for non-toys and toys-not-meant-for-mouthing is 86 min for 7.5 months old children (Bremmer and Van Veen, 2002; Groot et al., 1998). Variation in suck time also provides insight into the exposure progress. For example, a matrix can release all its extractable contaminant within a limited time frame, followed by a considerable lower or negligible release rate. On the other hand, a matrix can also release its contaminant at a constant rate.
The intensity of sucking could influence the amount contaminant released from its matrix. However, the intensity will be variable between different children, but also at different time point for one child, e.g. a baby will suck vigorously on a pacifier when it is hungry and only with minor intensity when it is asleep. Due to these variances and also the difficulty to imply the suck intensity in an in vitro digestion model, the intensity of sucking was not investigated.
Simulation of multiple suck events.
Children may suck on a certain toy matrix on more than one day. When assessing the extractability of the contaminant from the toy for a single event, i.e. a single day, this may lead to an overestimation of the exposure. The extractability of the contaminant may decrease after multiple suck events when the extractable pool of contaminants in the matrix is decreased. For example, a textile contaminated with azo dye released the highest amounts of the aromatic amine aniline during the first suck event, whereas the following suck events resulted in lower extraction (Oomen et al., 2004). Therefore, multiple suck events should be investigated, especially when exposure after prolonged use of the product should be estimated.
Variation of the amount of matrix.
Variation of the amount of matrix per digestion tube should be considered as it gives information on the amount of contaminant released per kg matrix or per surface unit. These experiments also show whether the saliva simulant is saturated with the contaminant. This is important for the determination of the extraction rate of the contaminant from its matrix. If the saliva is not saturated, the extraction rate can be determined directly from the rate contaminants are released into saliva simulant. However, when the saliva is saturated this may lead to an underestimation of the exposure because in vivo saliva is continuously swallowed and renewed. Therefore, if the saliva is saturated, the amount of saliva ingested by children during sucking should be multiplied with the saturation level of the contaminant in saliva. An example of such a situation is the release of an azo dye (quantified by the level of o-dianisidine in saliva simulant) from textile (Oomen et al., 2004).
Another reason to vary the amount of matrix in the sucking experiments is that the amount of matrix that is mouthed by children depends on the toy or consumer product. Some information about the physiologically relevant amounts of toy mouthed by children is provided by the toy fact sheet of the exposure model ConsExpo (Bremmer and Van Veen, 2002).
Obviously, the amount of contaminant that is released into saliva during sucking cannot increase after swallowing the saliva. Therefore, estimation of the release of a contaminant into saliva is sufficient when children are expected to suck on the toy matrix only. However, when a small amount of matrix is ingested, the release in the stomach and intestine may be considerably larger than when the bioaccessibility would have been only measured in the mouth, because the extractability of contaminants under conditions in stomach and intestine may be much higher.
3.3.2 Simulating ingestion
When assessing the bioaccessibility of a contaminant from a matrix after ingestion, the variables listed below should be considered to study:
• variation of the amount of matrix
• bioaccessibility under fasted and fed conditions • samples of stomach and intestinal compartment
Variation of the amount of matrix.
Variation of the amount of matrix per digestion tube should be considered as it provides information on the amount of contaminant released per kg matrix or per surface unit. The amount of matrix ingested depends on the behaviour of the child. In case of hand-to-mouth or object-to-mouth behaviour, children ingest small amounts of matrix per time unit as they put hands or objects with small amounts of matrix into their mouth. This may for example occur during playing with chalk. On the other hand, ingestion of a large piece of toy during a single event may also occur. The range of solid-to-fluid ratios, i.e. toy (g) in gastric juices (ml), may range between 1:9 and 1:166667 (Oomen et al., 2004). However, a physiologically realistic and feasible range is between 1:45 and 1:2250, with solid-to-fluid ratios of 1:45 are best representing single ingestion events, whereas higher ratios such as 1:2250 are representing hand/object-to-mouth behaviour (Oomen et al., 2004).
In addition, these experiments show whether the digestive juices are saturated with the contaminant within the physiologically relevant range of solid-to-fluid ratios. This is important for the estimation of the amount of contaminant that can be transported across the intestinal epithelium and can become bioavailable. If the digestive juice is not saturated, the bioaccessible fraction represents the maximum fraction of the contaminant that can be transported across the intestinal epithelium. However, if the digestive juice is saturated, the fraction released from its matrix may give an underestimation of the fraction of the contaminant that is transported across the intestinal epithelium. For, in vivo, the released contaminants are continuously transported across the intestinal epithelium, possibly inducing a further release of the contaminant from its matrix. With the present in vitro digestion models this situation can only be recognised, but cannot be simulated.
Bioaccessibility under fasted and fed conditions.
Differences in physiology between fasted and fed state may give rise to differences in bioaccessibility, as pH and salt and enzyme concentrations are different. An in vitro digestion model simulating fed conditions has been developed to quantify the bioaccessibility under fed conditions (Versantvoort et al., 2004). It is therefore important to study the bioaccessibility of a certain contaminant/matrix combination under both fasted and fed conditions, so that the state leading to the highest bioaccessibility can be used for risk c.q. exposure assessment.
Samples of stomach and intestinal compartment.
It is advisable to take samples from both the stomach and the intestinal compartment. Most compounds are absorbed in the small intestine, making the small intestine the most relevant site to assess bioaccessibility, but some compounds are absorbed in the stomach. Furthermore, information on the bioaccessibility of a contaminant throughout the entire gastrointestinal tract is valuable to understand the behaviour of the contaminant in the gastrointestinal tract.
4.
Stage 2: Testing of some (real life) cases in the IVD
model
4.1
Overview of experiments performed
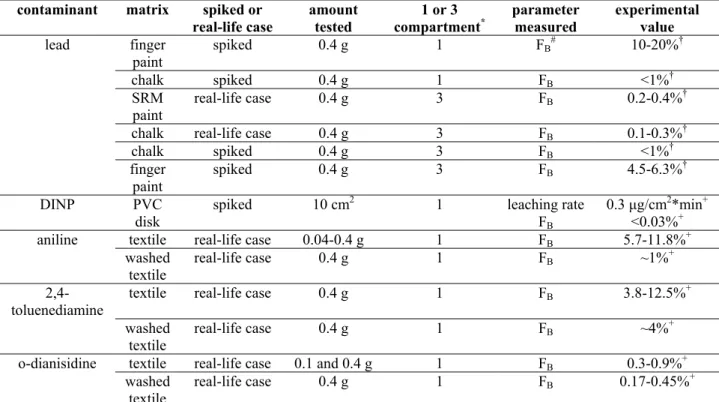
The data in table 1 to 4 summarise the experiments reported in RIVM reports 320102001 and 320102003 and the current report (Oomen et al., 2003c; Oomen et al., 2004).
Table 1: experiments performed using the type 1 model (suck model)
contaminant matrix spiked or
real-life case amount tested compartment1 or 3 * parameter measured experimental value
lead finger
paint spiked 0.4 g 1 FB
# 10-20%†
chalk spiked 0.4 g 1 FB <1%†
SRM
paint real-life case 0.4 g 3 FB 0.2-0.4%
†
chalk real-life case 0.4 g 3 FB 0.1-0.3%†
chalk spiked 0.4 g 3 FB <1%† finger paint spiked 0.4 g 3 FB 4.5-6.3%† DINP PVC disk spiked 10 cm 2 1 leaching rate FB 0.3 µg/cm2*min+ <0.03%+
aniline textile real-life case 0.04-0.4 g 1 FB 5.7-11.8%+
washed
textile real-life case 0.4 g 1 FB ~1%
+
2,4-toluenediamine
textile real-life case 0.4 g 1 FB 3.8-12.5%+
washed
textile real-life case 0.4 g 1 FB ~4%
+
o-dianisidine textile real-life case 0.1 and 0.4 g 1 FB 0.3-0.9%+
washed
textile real-life case 0.4 g 1 FB 0.17-0.45%
+ * the 1 compartment is the saliva phase and the 3 compartment is mouth, stomach and intestine
# F
B is bioaccessibility † RIVM report 320102001 + RIVM report 320102003
Table 2: experiments performed using the type 2 model (suck-swallow model)
contaminant matrix spiked or
real-life case amount tested parameter measured experimental value#
lead SRM
paint real-life case 0.4 g paint FB
* 4-16%
chalk real-life case 0.4 g chalk FB 0.1%
chalk spiked 0.4 g chalk FB 0-3%
finger paint
spiked 0.4 g chalk FB 15-19%
* F
B is bioaccessibility
Table 3: experiments performed using the type 3 model (swallow model under fasted conditions)
contaminant matrix spiked or
real-life case amount tested parameter measured experimental value lead SRM
paint* real-life case 0.4 g FB
† 21-29%+
chalk* real-life case 0.4 g F
B 2.9-3.7%+ chalk* spiked 0.4 g F B 0.5-2.7%+ finger paint* spiked 0.4 g FB 40-62% + SRM
paint* real-life case 0.4 g FB 20-33% ▼
chalk* real-life case 0.4 g F
B 2.5-4.9%▼
top
paint# real-life case 0.01-0.40 g FB 9.1-11.7% ■
benzoic acid finger
paint# real-life case 0.01-1.0 g FB 23-83% ■ * pH set to 1.6 ± 0.1 after 1 h # pH set to 1.6 ± 0.1 after 2 h † F B is bioaccessibility + RIVM report 320102001 ▼ RIVM report 320102003
■ current report (section 4.2 and 4.3)
Table 4: experiments performed using the type 4 model (swallow model under fed conditions)
contaminant matrix spiked or
real-life case amount tested parameter measured experimental value
lead SRM
paint real-life case 0.01 and 0.1 g FB
* 31-44%#
chalk spiked 0.01, 0.1 g FB 15-47%#
top paint
real-life case 0.01-0.40 g FB 3.0-5.6%†
benzoic acid finger
paint real-life case 0.01-1.0 g FB 10-90%
†
* F
B is bioaccessibility # RIVM report 320102003
† current report (section 4.2 and 4.3)
4.2
Benzoic acid in finger paint
4.2.1 Introduction
Benzoic acid (CAS no. 65-85-0) (figure 4) is a white solid compound that is slightly soluble in water. Sodium benzoate (CAS no. 532-32-1) (figure 4) is about 200 times more soluble in water. Benzoic acid and sodium benzoate are in equilibrium with one another. Anthropogenic releases of benzoic acid and sodium benzoate into the environment are primarily emissions into water and soil from their uses as preservatives. Concentrations of naturally occurring benzoic acid in several foods does not exceed average values of 40 mg/kg of food. The maximum concentrations reported for benzoic acid or sodium benzoate added to food for preservation purposes were in the range of 2,000 mg/kg of food (IPCS (International Program on Chemical Safety), 2000).
Figure 4. Molecular structure of benzoic acid and sodium benzoate.
After oral ingestion of benzoic acid and sodium benzoate, there is a rapid absorption (of undissociated benzoic acid) from the gastrointestinal tract in experimental animals or humans (US FDA, 1972; US FDA (PB-223 837), 1973). Based on the excretion data from the FDA studies, 100% absorption can be assumed and thus FB x FA is 100%.
In the acid conditions of the stomach, the equilibrium moves to the undissociated benzoic acid molecule. Benzoate from sodium benzoate changes from the ionised form to the undissociated benzoic acid molecule. In the more neutral pH of the small intestine, where absorption takes place, the equilibrium shifts to the dissociated form. Therefore, the absorption, metabolism and systemic effects of benzoic acid and sodium benzoate can be considered to be similar (IPCS (International Program on Chemical Safety), 2000).
The joint FAO/WHO expert committee of food additives (JECFA) has allocated an acceptable daily intake (ADI) for benzoic acid and its equivalents (e.g. sodium benzoate) of 0-5 mg/kg body weight due to the reports of idiosyncratic human intolerance (WHO, 1996). An ADI of 0-5 mg/kg body weight has been set by the Codex Alimentarius Commission in the joint FAO/WHO food standards programme (Codex Alimentarius Commission, 2004). Thus a maximum ADI for benzoic acid was set at 5 mg/kg body weight. However for toys, the maximal allowed level for benzoic acid is set in the Dutch law. For finger paint the maximum allowed level is 0.5% (NEN-EN 71-7:2002 (EN), 2002).
4.2.2 Materials and Methods
4.2.2.1 Variables testedBioaccessibility of a compound from a certain matrix may be influenced by a variety of conditions. In the present study some methodological variables with potentially high impact on the conclusions regarding bioaccessibility were tested. In all situations a swallow model was used as it was assumed that finger paint is directly ingested and the sucking phase is of minor importance.
The following variables were tested:
• fasted versus fed conditions in the gastrointestinal tract • water extraction versus physiologically relevant conditions • spiked versus contaminated samples
OH
O O O
Na
4.2.2.2 Finger paint
Five samples finger paint containing benzoic acid at levels exceeding the limit value of 0.5% were provided by the Food and Consumer Product Safety Authority. The concentrations of benzoic acid in the different finger paint samples are listed in table 5.
Table 5: concentrations of benzoic acid
concentration of benzoic acid finger paint % of weight mg/g
green 0.59 5.9 yellow 0.74 7.4 blue 0.61 6.1 red 0.73 7.3 orange 0.64 6.4 4.2.2.3 Digestion models
Swallow model under fasted conditions (type 3 model)
To simulate fasted conditions, experiments were performed according to the swallow model under fasted conditions described in Chapter 3. For the bioaccessibility determination, samples were taken from the saliva (500 µl), stomach (500 µl), and chyme (2.5 ml). Montana Soil 2711 and SRM paint in saliva, stomach, and chyme were taken into account as quality control samples.
Swallow model under fed conditions (type 4 model)
To simulate fed conditions, experiments were performed according to a modification of the in
vitro digestion model under fed conditions as described in Chapter 3. The digestion started by
introducing blue or red finger paint to saliva and infant formula. This mixture was rotated head-over-heels (55 rpm) for 5 min, instead of directly adding gastric juice as described in Chapter 3. This was done to investigate the bioaccessibility of benzoic acid in saliva and for a better comparison of the bioaccessibility under fasted conditions. Next, 12 ml of stimulated gastric juice was added and incubated for 2 h. The rest of the experiment was the same as described in Chapter 3. Samples were taken from the saliva (500 µl), stomach (500 µl), and chyme (2.5 ml) to determine the bioaccessibility in these compartments. Montana Soil 2711 and SRM paint in saliva, stomach, and chyme were taken into account as quality control samples.
Swallow model with water extraction
One of the methods applied by Safety Authorities for measuring a migration rate is based on extraction with water (NEN-EN 71-3:1995/C1:2002 en, 2002). The procedure was the same as described for the swallow model under fasted conditions, except that the pH in the stomach was not set to 1.6 ± 0.1 at the beginning of the 2 h incubation. This was not done, because only water was used and therefore no physiological conditions apply. Samples were taken at 5 min (saliva phase, 500 µl), 2 h (stomach phase, 500 µl)) and 4 h (chyme phase, 2.5 ml)), the same time points as for the experiments at fasted and fed conditions. Montana Soil 2711 and SRM paint in saliva, stomach, and chyme were taken into account as quality control samples.
4.2.2.4 Study design
An overview of the study design is given in table 6.
Table 6: study design of experiments performed with benzoic acid in finger paint in vitro model tested
amount of matrix in model (g)
type 3
model model type 4 extraction water real-life case samples
green paint 0.01-1.0 n = 1 yellow paint 0.01-1.0 n = 1 blue paint 0.01-1.0 n = 2 n = 1 n = 1 red paint 0.01-1.0 n = 2 n = 1 n = 1 orange paint 0.01-1.0 n = 1 spiked samples
[mg benzoic acid/g paint]
2.5 mg/g paint 0.40 n = 1 n = 1 n = 1 5 mg/g paint 0.40 n = 1 n = 1 n = 1 10 mg/g paint 0.40 n = 1 n = 1 n = 1 20 mg/g paint 0.40 n = 1 n = 1 n = 1 50 mg/g paint 0.40 n = 1 n = 1 n = 1 SRM paint 0.04 n = 1 n = 2 n = 2 0.40 n = 1 n = 2 n = 2 Montana Soil 2711 0.04 n = 1 n = 2 n = 2 0.40 n = 1 n = 2 n = 2
For each sample a range of amounts, i.e. 0.01, 0.04, 0.1, 0.25, 0.4 or 1.0 g of finger paint was tested in all three models. Spiked samples were only tested at an amount of 0.4 g per digestion tube. The basis for performing three colours as a single experiment and two in duplo was based on the assumption that the standard deviation is equal for the different colours of finger paint on one hand and practical limitations (maximum of 50 samples per day) on the other hand. Montana Soil contained 1.162 mg Pb/g soil and SRM paint 4.49 mg Pb/g paint. All experimental series also included blank samples.
4.2.2.5 Analysis
The Food and Consumer Product Safety Authority performed analyses of benzoic acid in digestive juices and finger paint samples according to protocol CHE01-ND101. The lower limit of quantification (LLQ) was 10 ng/ml in saliva and stomach fluid and 2 ng/ml in chyme. Lead concentrations from the control samples SRM paint and Montana soil 2711 in the digestive juices were analysed by the Laboratory of Inorganic Analytical Chemistry of the National Institute for Public Health and the Environment. The LLQ was 180 ng/ml in saliva and stomach fluid and 20 ng/ml in chyme. In short, the saliva and stomach sample were diluted to a volume of 5 ml with 0.1 M HNO3. The chyme samples were diluted 1:1 (v/v)
with 0.1 M HNO3. The amount of lead was measured by means of ICP-MS. The internal
standard used was Renium (50 ng/ml).
The bioaccessibility can be calculated by dividing the amount in the digestive juice by the total amount in the contaminated sample. The amount in the digestive juice is measured by the method described above and correcting for the measured value in the blank sample and
the total volume of digestive juice, sample and food. The total amount in the contaminated sample was measured by the Food and Consumer Product Safety Authority
4.2.3 Results and discussion
Results of the various digestion experiments with contaminated finger paint are given in appendix 2. A short overview of the main results is given in the sections below.
4.2.3.1 Fasted versus fed conditions
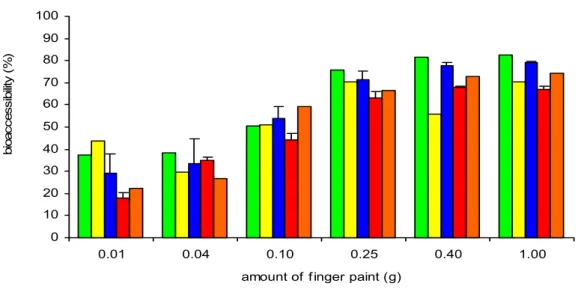
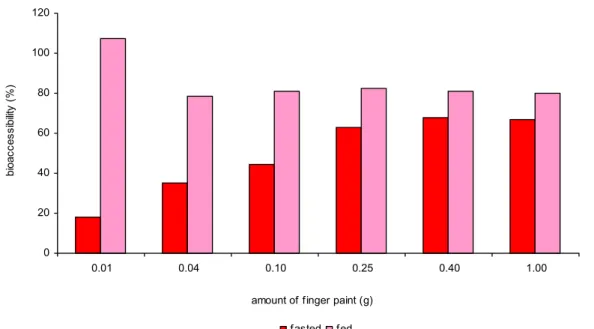
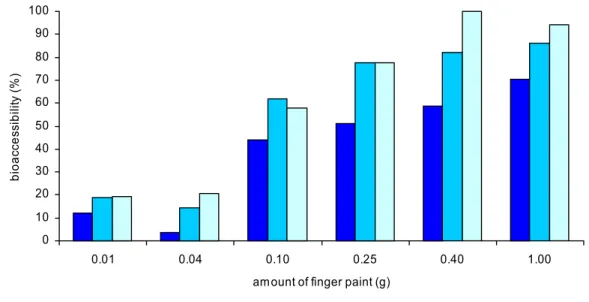
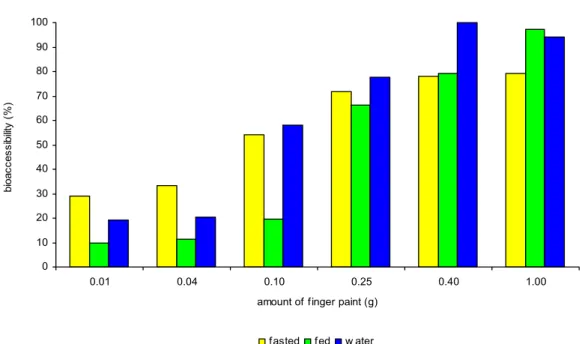
Bioaccessibility of benzoic acid in chyme (small intestine compartment) at fasted conditions was between 23 and 83% for the different amount and colours of finger paint (figure 5). Bioaccessibility at fed conditions was only tested for blue and red finger paint. Blue finger paint demonstrated an increasing bioaccessibility from 10 to 90% with increasing amounts (figure 6). However, bioaccessibility of red finger paint seemed to be much less influenced by the amount. Bioaccessibility was approximately 75-80% (figure 7).
Figure 5. Bioaccessibility of benzoic acid from different colours of finger paint in chyme under fasted conditions using the swallow model.
0 10 20 30 40 50 60 70 80 90 100 0.01 0.04 0.10 0.25 0.40 1.00
amount of f inger paint (g)
bi oa cc es sib ilit y ( % )
Bioaccessibility of benzoic acid tended to increase with increasing amounts in the test tube. A plausible explanation for this observation could not be given.
Figure 6. Bioaccessibility of benzoic acid from blue finger paint in chyme under fasted and fed conditions.
Figure 7. Bioaccessibility of benzoic acid from red finger paint in chyme under fasted and fed conditions.
The data show a tendency for higher bioaccessibility at fed conditions than at fasted conditions. Confirmation of this observation should be obtained by repeating this experiment with multiple measurements.
0 20 40 60 80 100 120 0.01 0.04 0.10 0.25 0.40 1.00
amount of finger paint (g)
bi oa cce ssi bi lit y ( % ) fasted fed 0 20 40 60 80 100 120 0.01 0.04 0.10 0.25 0.40 1.00
amount of finger paint (g)
bi oac ce ss ibi lit y ( % ) fasted fed
4.2.3.2 Water extraction versus physiologically relevant conditions
The bioaccessibility of benzoic acid in water for blue finger paint is shown in figure 8. The sampling times were chosen to resemble the saliva (5 min), stomach (2 h) and chyme (4 h) phase in the other digestion models. The bioaccessibility of red finger paint showed the same trend as blue finger paint and is shown in appendix 2.
A comparison of the bioaccessibility from blue finger paint in water and under physiologically relevant conditions after 4 h is shown in figure 9. Water extraction and the digestion models showed the same amount – bioaccessibility relationship. Moreover, absolute bioaccessibility values were comparable. This observation is not surprisingly as both the paint and benzoic acid are well soluble in water.
From the benzoic acid bioaccessibility data obtained from finger paint under different conditions (fasted, fed and in water), it appeared that all three test models resulted in a similar bioaccessibility value in chyme at amounts of finger paint per digestion tube of 0.25 g or more. In case of benzoic acid in finger paint, the most simple model, i.e. extraction with water, already gave results similar to more physiological test conditions.
Figure 8. Bioaccessibility of benzoic acid from blue finger paint in water at different time points. 0 10 20 30 40 50 60 70 80 90 100 0.01 0.04 0.10 0.25 0.40 1.00
amount of finger paint (g)
b io a cc e ss ib ilit y ( % ) 5 min 2 h 4 h
Figure 9. Bioaccessibility of benzoic acid from blue finger paint in water and under physiologically relevant conditions after 4 h.
4.2.3.3 Spiked versus contaminated samples
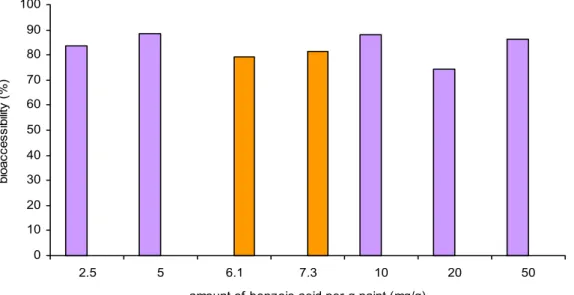
Bioaccessibility of benzoic acid from spiked finger paint was studied under three different conditions (figure 10). The bioaccessibility values were comparable with the bioaccessibility found for the same amount (0.40 g per digestion tube) of finger paint provided by the Food and Consumer Product Safety Authority under fasted and fed conditions and in water. In figure 11, a comparison between spiked finger paint and the real-life case (blue and red finger paint) under fed conditions is shown.
0 10 20 30 40 50 60 70 80 90 100 0.01 0.04 0.10 0.25 0.40 1.00
amount of finger paint (g)
bi oa cce ssi bi lit y ( % )
Figure 10. Bioaccessibility of benzoic acid from spiked finger paint (0.4 g per digestion tube) in chyme under fasted and fed conditions and in water (the 4 h situation).
Figure 11. Bioaccessibility of benzoic acid from spiked finger paint (0.4 g per digestion tube) and blue (6.1 mg benzoic acid per g paint) and red (7.3 mg benzoic acid per g paint) finger paint in chyme under fed conditions.
0 10 20 30 40 50 60 70 80 90 100 2.5 5 10 20 50
amount of material spiked (mg/g paint)
bi oa cc es si bi lit y ( % )
fasted fed water
0 10 20 30 40 50 60 70 80 90 100 2.5 5 6.1 7.3 10 20 50
amount of benzoic acid per g paint (mg/g)
bi oa cce ssi bi lit y ( % ) spiked real-life
4.2.4 Conclusions regarding benzoic acid from finger paint
In conclusion, bioaccessibility of benzoic acid from finger paint was similar at fasted and fed conditions and following extraction with water.
There was a trend that bioaccessibility increased with increasing amounts of finger paint per digestion tube and was maximal from 0.25 g and up. On the basis of this observation it is recommended to test a range of amounts in the in vitro digestion model. In case of finger paint it is also advisable to test various colours.
Information on bioaccessibility did not have added value for risk assessment as in the worst case scenario the assessed bioaccessibility was around 100% and the in vivo absorption is also 100%.
The acceptable daily intake (ADI) of benzoic acid is set at 5 mg/kg bw/day. There are no recent data for the background intake via food, water and air, only data from the 1970’s (4 mg/kg bw/day) (US FDA (PB-223 837), 1973). Benzoic acid is still a widely used food preservative and it is likely that the background intake is equal to the intake in the 1970’s. The amount of finger paint swallowed by children which leads to exceeding the ADI could be calculated using the following formula taking the background intake into account:
Yellow finger paint was used to calculate the amount resulting in exceeding the ADI, because it had the highest concentration benzoic acid. At an intake of more than 1.9 g finger paint per day the ADI will be exceeded. According to the RIVM report 612810012, this could be a worst case amount swallowed by young children (Bremmer and Van Veen, 2002). Therefore, it was concluded that this finger paint is not safe for children.
4.3
Lead in paint of tops
4.3.1 Introduction
Lead (Pb; relative atomic mass, 207.19; specific gravity, 11.34) is a bluish or silvery grey soft metal. It is absorbed in humans following ingestion. In animals and humans, absorption of lead from the gastrointestinal tract is influenced by the physico-chemical nature of the ingested material, nutritional status, and type of diet consumed. In adult humans, approximately 10% of the dietary lead is absorbed; the proportion is higher under fasting conditions. However, in infants and young children as much as 50% of dietary lead is absorbed.
Dutch risk assessment for lead is based on a criterion laid down by the FAO/WHO (FAO/WHO, 1993) and the IPCS (IPCS, 1995). The recommendation is to avoid lead blood levels above 50 µg/l, resulting in a provisional tolerable weekly intake (PTWI) of 25 µg/kg
(5-4) * 14 1 * 1 * 7.4
= 1.9 g paint (ADI – background intake) * average bw
body weight (bw)/week, thus a tolerable daily intake (TDI) of 3.6 µg/kg bw/day. This criterion is based on absorption (Fb,RfD × Fa,RfD) of 40% of dietary lead.
For toys, two different Dutch laws apply. First, the allowed levels of lead from toys is 0.7 µg bioavailable lead per day and an assumed average intake of 8 mg toy material per day, which results in a maximum release rate of 90 µg/g (Warenwetbesluit Speelgoed, 2004). However, this amount of ingested toy is not an absolute value and should be reviewed per toy (Bremmer and Van Veen, 2002). To determine the release rate, the toy or a part of the toys is placed in 70 mM HCl (pH around 1.5) for 2 h and the amount lead is determined in the HCl (NEN-EN 71-3:1995/C1:2002 en, 2002). Second, the maximum allowed lead level in toys is 3.5 mg/kg (Bouma et al., 2002). Normally, only the release rate is determined before a toy is entered on the market by the Toy industry and is therefore the most important legislation.
4.3.2 Materials and Methods
4.3.2.1 Variables testedBioaccessibility of a compound from a certain matrix may be influenced by a variety of conditions. In the present study some methodological variables with potentially high impact on the conclusions regarding bioaccessibility were tested. In all situations a swallow model was used as it was assumed that finger paint is directly ingested and the sucking phase is of minor importance.
The following variables were tested:
• fasted versus fed conditions in the gastrointestinal tract • water extraction versus physiologically relevant conditions • spiked versus contaminated samples
4.3.2.2 Tops
The Food and Consumer Product Safety Authority had found that the paint of one specific kind of top (figure 12) was found to release 1970 µg/g. This is higher than the allowed maximal release rate of 90 µg/g. The paint (red) was scraped from the tops for bioaccessibility testing. The paint was found to contain 14.8 ± 0.4 mg/g which is highly above the allowed level of 0.0035 mg/g (= 3.5 mg/kg).
Figure 12. The kind of top tested from which the paint contained lead levels above the allowed level.
4.3.2.3 Digestion models
Swallow model under fasted conditions (type 3 model)
To simulate fasted conditions, experiments were performed according to the swallow model under fasted conditions described in Chapter 3. For the bioaccessibility determination, samples were taken from the stomach (100 µl) and chyme (900 µl). Montana Soil 2711 and SRM paint in stomach (100 µl) and chyme (900 µl) were taken into account as quality control samples.
Swallow model under fed conditions (type 4 model)
To simulate fasted conditions, experiments were performed according to the swallow model under fed conditions described in Chapter 3. Samples were taken from the stomach (100 µl) and chyme (4 ml), to determine the bioaccessibility in these compartments. Montana Soil 2711 and SRM paint in stomach (100 µl) and chyme (900 µl) were taken into account as quality control samples.
Water extraction – Swallow model
One of the methods applied by Safety Authorities for measuring a leaching rate is based on extraction with water (NEN-EN 71-3:1995/C1:2002 en, 2002). The procedure was the same as described for the fasted conditions, i.e. the swallow model, except that the pH in the stomach was not set to 1.6 ± 0.1 at the beginning of the 2 h incubation. This was not done, because only water was used and therefore no physiological conditions apply. Samples were taken at 2 h (stomach phase, 100 µl) and 4 h (chyme phase, 5 ml), the same time points as for the experiments at fasted and fed conditions. Montana Soil 2711 and SRM paint in stomach (100 µl) and chyme (900 µl) were taken into account as quality control samples.
4.3.2.4 Study design
An overview of the study design is given in table 7.
Table 7: study design of experiments performed with lead in paint from tops in vitro model tested
amount of matrix in model (g) type 3 model type 4 model water extraction
paint from top 0.01-0.4 n = 2 n = 2 n = 2
SRM paint 0.04 n = 1 n = 1 n = 1
0.40 n = 1 n = 1 n = 1
Montana Soil 2711 0.04 n = 1 n = 1 n = 1
0.40 n = 1 n = 1 n = 1
For each sample a range of amounts, i.e. 0.01, 0.04, 0.07, 0.1, 0.25, or 0.4 g of paint was tested in all three models. Montana Soil contained 1.162 mg Pb/g soil and SRM paint 4.49 mg Pb/g paint. All experimental series also included blank samples.
4.3.2.5 Analysis
Lead concentrations in the digestive juices were analysed by the Laboratory of Inorganic Analytical Chemistry (National Institute for Public Health and the Environment). The LLQ was 180 ng/ml in stomach fluid and 20 ng/ml in chyme. In short, the stomach samples were diluted to a volume of 5 ml with 0.1 M HNO3. The chyme samples were diluted 1:1 (v/v)
with 0.1 M HNO3. The amount of lead was measured by means of ICP-MS. The internal
standard used is Renium (50 ng/ml).
The bioaccessibility can be calculated by dividing the amount in the digestive juice by the total amount in the contaminated sample. The amount in the digestive juice was measured by the method described above and correcting for the measured value in the blank sample, the dilution with HNO3 and the total volume of digestive juice, sample and food. The total
amount in the contaminated sample was measured using a destruction method with diluted
aqua regia (3:3:1 of Milli-Q water : HCl : HNO3). In short, 0.5 g of soil was destructed with
90 ml diluted aqua regia in a CEM Mars 5 microwave. The total amount of lead was determined with the same protocol as described earlier.
4.3.3 Results and Discussion
The bioaccessibility results from the different experiments with paint scraped from tops are in appendix 3, but a short overview of the main results is given in the sections below.
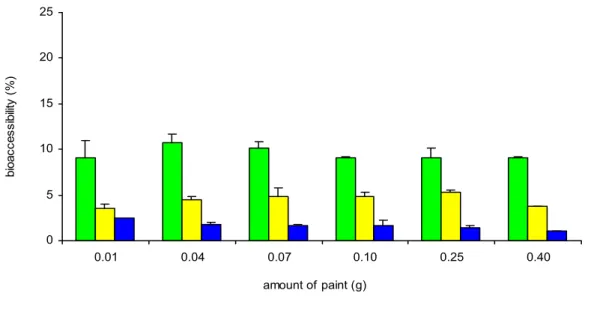
4.3.3.1 Fasted versus fed conditions
Under fed conditions the bioaccessibility of lead in chyme (small intestine compartment) was lower than under fasted conditions, ~4% and ~9.5% respectively (figure 13), but in both cases it was low (< 10%). This is most likely caused by a higher pH in the stomach compartment under fed conditions (pH around 2.0) compared to the fasted condition (pH approximately 1.6), resulting in a decreased release of lead in the stomach compartment. Hence, the fasted model represents the worst case scenario for estimating oral bioavailability. The different amounts of paint did not influence the bioaccessibility of lead, indicating that the model did not reach its limitations for solubility of lead in the digestive juices.