OPENBAAR
Environmental risk limits for
pharmaceuticals
Derivation of WFD water quality standards for carbamazepine, metoprolol, metformin and amidotrizoic acid
RIVM Letter Report 270006002/2014 C.T.A. Moermond
Colofon
© RIVM 2014
Parts of this publication may be reproduced, provided acknowledgement is given to the 'National Institute for Public Health and the Environment', along with the title and year of publication.
This is a publication of:
National Institute for Public Health and the Environment
P.O. Box 1│3720 BA Bilthoven The Netherlands
www.rivm.nl/en
C.T.A. Moermond
Contact:
Caroline Moermond
Centre for Safety of Substances and Products
caroline.moermond@rivm.nl
This investigation has been performed by order and for the account of Ministry of Infrastructure and the Environment, within the framework of the project 'Chemical aspects of WFD and RPS'
Abstract
Surface water risk limits for pharmaceuticals
RIVM proposes water quality standards for three pharmaceuticals in surface water: carbamazepine (epilepsy), metoprolol (heart failure) and metformin (diabetes). During the past years, these pharmaceuticals have been found in surface water in the Netherlands. They were included in the so-called ‘watchlist’ of substances which can negatively affect water quality. The proposed quality standards can be used to better estimate possible risks for man and the environment. They serve as advisory values for the Ministry of Infrastructure and Environment, which is responsible for standard setting.
Methodology
For water quality standards, four exposure routes are taken into account: direct effects on ecosystems, secondary poisoning of fish-eating animals, consumption of fish by man and the abstraction of surface water for drinking water. The route with the most strict quality standard determines the final quality standard. The WFD methodology further distinguishes between standards protecting against prolonged and short-term exposure.
Availability of data
For another watchlist pharmaceutical, amidotrizoic acid (an X-ray contrast medium), the derivation of environmental quality standards turned out to be not possible. RIVM was not able to use the relevant data for this substance. In general, a lack of access to original study reports hampered a sound derivation of quality standards, also for the other compounds. RIVM makes a plea that pharmaceutical companies and competent authorities provide all information needed to derive environmental quality standards for pharmaceuticals.
Monitoring
Pharmaceuticals enter the environment through sewage. Monitoring data in surface waters in the Netherlands show that the proposed quality standards are not exceeded. However, these monitoring data concern large rivers and not the smaller water bodies with a lower dilution of the sewage effluent. At this moment, water boards are collecting monitoring data to assess if the proposed water quality standards are exceeded in these smaller water bodies.
This research was conducted by order of the Ministry of Infrastructure and Environment.
Keywords:
environmental risk limits, carbamazepine, metoprolol, metformin, amidotrizoic acid
Publiekssamenvatting
Oppervlaktewaternormen voor geneesmiddelen
Het RIVM doet een voorstel voor waterkwaliteitsnormen voor drie
geneesmiddelen in oppervlaktewater. Het betreft carbamazepine (epilepsie), metoprolol (hartkwalen) en metformine (diabetes). Deze geneesmiddelen zijn de afgelopen jaren in Nederlands oppervlaktewater aangetroffen. Ze zijn
opgenomen op een ‘watchlist’ van stoffen die de waterkwaliteit negatief kunnen beïnvloeden. De normvoorstellen kunnen worden gebruikt om de risico’s voor mens en milieu beter in te schatten en dienen als advieswaardes voor het ministerie van Infrastructuur en Milieu (IenM), dat verantwoordelijk is voor het vaststellen van normen.
Methodologie
Voor waterkwaliteitsnormen worden de effecten van een stof op vier ‘routes’ onderzocht: schade aan ecosystemen, doorvergiftiging naar visetende dieren, consumptie van vis door mensen en oppervlaktewater voor de
drinkwaterproductie. De route met de strengste norm bepaalt de uiteindelijke norm. Verder maakt de gebruikte Kaderrichtlijn water onderscheid tussen normen voor chronische en acute blootstelling.
Beschikbaarheid van gegevens
Voor een ander geneesmiddel op de ‘watchlist’, amidotrizoinezuur
(röntgencontrastmiddel), was het niet mogelijk een norm af te leiden. Het RIVM kon niet beschikken over de benodigde gegevens. Ook voor de andere
geneesmiddelen werd de normafleiding beïnvloed door een gebrek aan toegang tot originele onderzoeksgegevens. Het RIVM pleit ervoor dat de
geneesmiddelenfabrikanten en de toelatingsautoriteiten alle gegevens ter beschikking stellen die nodig zijn om milieukwaliteitsnormen af te leiden.
Monitoring
Geneesmiddelen komen hoofdzakelijk via het riool in het oppervlaktewater terecht. Meetgegevens in Nederlandse oppervlaktewateren laten zien dat de voorgestelde normen niet worden overschreden. De metingen zijn echter gedaan in grote rivieren en niet in kleinere waterlichamen, waar minder verdunning van afvalwater optreedt. Waterbeheerders verzamelen momenteel meetgegevens om na te gaan in hoeverre de voorgestelde normen in deze kleinere wateren worden overschreden.
Het onderzoek is uitgevoerd in opdracht van het ministerie van Infrastructuur en Milieu.
Trefwoorden:
Contents
Summary—9
1
Introduction—11
1.1
Background and aim—11
1.2
Standards considered—11
2
Methods—15
2.1
General—15
2.2
Data collection and evaluation—15
2.3
Data evaluation—15
2.4
Status of the results—16
3
Carbamazepine—17
3.1
Introduction—17
3.2
Identity—17
3.3
Information on uses and emissions—17
3.4
Existing or proposed water quality standards, risk limits, etc.—18
3.5
Physico-chemical properties and fate in the environment—18
3.6
Bioconcentration and biomagnification—19
3.7
Human toxicological threshold limits and carcinogenicity—19
3.8
Aquatic toxicity data—20
3.9
Derivation of Environmental Risk Limits—23
3.10
Comparison with monitoring data—25
4
Metoprolol—27
4.1
Introduction—27
4.2
Identity—27
4.3
Information on uses and emissions—27
4.4
Existing or proposed water quality standards, risk limits, etc.—27
4.5
Physico-chemical properties and behaviour in the environment—28
4.6
Bioconcentration and biomagnification—28
4.7
Human toxicological threshold limits and carcinogenicity—29
4.8
Aquatic toxicity data—29
4.9
Derivation of Environmental Risk Limits—31
4.10
Comparison with monitoring data—33
5
Metformin—35
5.1
Introduction—35
5.2
Identity—35
5.3
Information on uses and emissions—35
5.4
Existing or proposed water quality standards, risk limits, etc.—35
5.5
Physico-chemical properties and behaviour in the environment—36
5.6
Bioconcentration and biomagnification—36
5.7
Human toxicological threshold limits and carcinogenicity—37
5.8
Aquatic toxicity data—37
5.9
Derivation of Environmental Risk Limits—38
5.10
Comparison with monitoring data—40
6
Amidotrizoic acid—41
6.1
Introduction—41
6.2
Identity—41
6.4
Existing or proposed water quality standards, risk limits, etc.—41
6.5
Physico-chemical properties and behaviour in the environment—42
6.6
Bioconcentration and biomagnification—42
6.7
Human toxicological threshold limits and carcinogenicity—43
6.8
Aquatic toxicity data—43
6.9
Derivation of Environmental Risk Limits—44
6.10
QSdw, hh—44
6.11
Monitoring data—44
7
Conclusions and recommendations—47
Acknowledgements—49
References—50
List of terms and abbreviations—53
Annex 1: Toxicity data for Carbamazepine
www.rivm.nl/bibliotheek/rapporten/annex1Carbamazepine.pdf
Annex 2: Toxicity data for Metoprolol
www.rivm.nl/bibliotheek/rapporten/annex2Metoprolol.pdf
Annex 3: Toxicity data for Metformin
www.rivm.nl/bibliotheek/rapporten/annex3Metformin.pdf
Annex 4: Toxicity data for Amidotrizoic acid
www.rivm.nl/bibliotheek/rapporten/annex4Amidotrizoic.pdf
Annex 5: References used in the toxicity tables
Summary
RIVM proposes water quality standards for three pharmaceuticals in surface water: carbamazepine (epilepsy), metoprolol (heart failure) and metformin (diabetes). During the past years, these pharmaceuticals have been detected frequently in Dutch surface waters used for drinking water abstraction. Based on indicative risk limits they were included in the so-called ‘watchlist’ of substances which can negatively affect water quality. As a follow-up, the Dutch Ministry of Infrastructure and the Environment ordered RIVM to propose water quality standards to put the results of a nationwide monitoring campaign into perspective.
The proposed standards are based on ecotoxicity data from the national and European authorisation dossiers and additional information obtained from the open literature. The methods used are in accordance with the methodology of the Water Framework Directive (WFD) and national frameworks for risk limit derivation. The proposed quality standards serve as advisory values for the Ministry of Infrastructure and Environment, which is responsible for standard setting.
The WFD distinguishes two types of water quality standards: (1) a long-term standard, expressed as an annual average concentration (AA-EQS) and normally based on chronic toxicity data. This standard should protect the ecosystem against adverse effects resulting from long-term exposure; and (2) a standard for short-term concentration peaks, referred to as a maximum acceptable concentration EQS (MAC-EQS). For the AA-EQS, four exposure routes are taken into account: direct effects on ecosystems, secondary poisoning of fish-eating animals, consumption of fish by man and the abstraction of surface water for drinking water. The route with the most strict quality standard determines the final quality standard.
For amidotrizoic acid (an X-ray contrast medium), the derivation of
environmental quality standards turned out to be not possible. RIVM was not able to use the relevant data for this substance. In general, a lack of access to original study reports hampered the derivation of quality standards, also for the other compounds. RIVM makes a plea that pharmaceutical companies and competent authorities transparently provide all information needed to derive environmental quality standards.
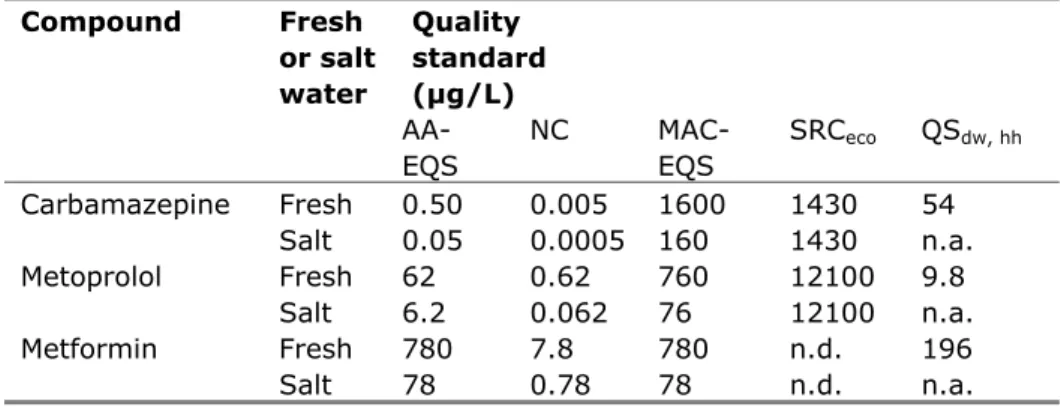
An overview of the proposed quality standards for the other compounds is presented in Table 1. All values are expressed on the basis of dissolved concentrations, but in view of the relatively low sorptive capacity of the compounds they are applicable to the total fraction as well.
Pharmaceuticals enter the environment through sewage. Monitoring data in surface waters in the Netherlands show that the proposed quality standards are not exceeded. However, these monitoring data concern large rivers and not the smaller water bodies with a lower dilution of the sewage effluent. At this moment, water boards are collecting monitoring data to assess if the proposed water quality standards are exceeded in these smaller water bodies.
Table 1. Derived AA-EQS, MAC-EQS, NC, , SRC, QSdw, hh values for three pharmaceuticals. Compound Fresh or salt water Quality standard (µg/L) AA-EQS NC MAC-EQS SRCeco QSdw, hh Carbamazepine Fresh 0.50 0.005 1600 1430 54 Salt 0.05 0.0005 160 1430 n.a. Metoprolol Fresh 62 0.62 760 12100 9.8 Salt 6.2 0.062 76 12100 n.a. Metformin Fresh 780 7.8 780 n.d. 196 Salt 78 0.78 78 n.d. n.a.
n.a. = not applicable
1
Introduction
1.1 Background and aim
In this report, a proposal is made for water quality standards for four
pharmaceuticals: carbamazepine, metoprolol, metformin, and amidotrizoic acid. The Water Framework Directive (WFD) requires member states to identify substances that may potentially harm water quality. In 2012, an inventory was made on occurrence and potential risks of substances in Dutch surface waters, based on information of water owners and drinking water companies [1]. Based on that research, the aforementioned compounds were identified as being potentially relevant for the quality of surface waters in the Netherlands and included in a so-called Dutch watchlist [1]. This list contains (new) substances for which monitoring data indicate that they might become a problem for the ecological and/or drinking water function of Dutch surface waters, but for which too little information is available at this stage for standard setting and/or inclusion in national legislation under the WFD. The Dutch watchlist has no legal status, but is meant to focus further research, e.g. concerning monitoring or (eco)toxicological risks. To further underpin future policy decisions regarding these substances, Smit and Wuijts [1] advised to collect monitoring data on a nationwide scale and to derive water quality standards according to the methodology of the WFD [2] to compare the monitoring data to. The Dutch Ministry of Infrastructure and the Environment commissioned RIVM to propose such standards.
1.2 Standards considered
Under the WFD, two types of EQSs are derived to cover both long- and short-term effects resulting from exposure:
an annual average concentration (AA-EQS) to protect against the occurrence of prolonged exposure, and
a maximum acceptable concentration (MAC-EQS) to protect against possible effects from short term concentration peaks.
In Dutch, these two WFD-standards are indicated as ‘JG-MKN’ and ‘MAC-MKN’, respectively1.
Next to the AA-EQS and MAC-EQS, the WFD also considers a standard for surface water used for drinking water abstraction. Below, a short explanation on the respective standards is provided and the terminology is summarised in Table 2. Note that all standards refer to dissolved concentrations in water. - Annual Average EQS (AA-EQS) – a long-term standard, expressed as an
annual average concentration (AA-EQS) and normally based on chronic toxicity data which should protect the ecosystem agains adverse effects resulting from long-term exposure.
The AA-EQS should not result in risks due to secondary poisoning and/or risks for human health aspects. These aspects are therefore also
addressed in the AA-EQS, when triggered by the characteristics of the compound (i.e. human toxicology and/or potential to bioaccumulate).
Separate AA-EQSs are derived for the freshwater and saltwater environment.
- Maximum Acceptable Concentration EQS (MAC-EQS) for aquatic ecosystems – the concentration protecting aquatic ecosystems from effects due to short-term exposure or concentration peaks. The MAC-EQS is derived for freshwater and saltwater ecosystems, and is based on direct ecotoxicity only.
- Quality standard for surface water that is used for drinking water
abstraction (QSdw, hh). This is the concentration in surface water that meets the requirements for use of surface water for drinking water production. The QSdw, hh specifically refers to locations that are used for drinking water abstraction.
The quality standards in the context of the WFD refer to the absence of any impact on community structure of aquatic ecosystems. Hence, not the potential to recover after transient exposure, but long-term undisturbed function is the protection objective under the WFD. Recovery in a test situation, after a limited exposure time, is therefore not included in the derivation of the AA- and MAC-EQS.
Table 2. Overview of the different types of WFD-quality standards for freshwater (fw), saltwater (sw) and surface water used for drinking water (dw) considered in this report. Type of QS Protection aim Terminology for temporary standard1 Notes Final selected quality standard long-term Water organisms QSfw, eco QSsw, eco Refers to direct ecotoxicity lowest water- based QS is selected as AA-EQSfw and AA-EQSsw Predators (secondary poisoning) QSbiota, secpois, fw QSbiota, secpois, sw QS for fresh- or saltwater expressed as concentration in biota, converted to corresponding concentration in water QSfw, secpois QSsw, secpois Human health (consumption of fishery products)
QSbiota, hh food QS for water expressed as concentration in biota, converted to corresponding
concentration in water; valid for fresh- and saltwater QSwater, hh food short-term Water organisms MAC-QSfw, eco MAC-QSsw, eco Refers to direct
ecotoxicity; check with QSfw, eco and QSsw, eco
MAC-EQSfw MAC-EQSsw dw Human health (drinking water)
Relates to surface water used for abstraction of drinking water
QSdw, hh
1: Note that the subscript “fw” refers to the freshwater, “sw” to saltwater; subscript “water” is used for all waters, including marine.
For the purpose of national water quality policy, e.g. discharge permits or specific policy measures, two additional risk limits are derived:
- Negligible Concentration (NC) – the concentration in fresh- and saltwater at which effects to ecosystems are expected to be negligible and functional properties of ecosystems are safeguarded fully. It defines a safety margin which should exclude combination toxicity. The NC is derived by dividing the AA-EQS by a factor of 100, in line with [3, 4].
- Serious Risk Concentration for ecosystems (SRCeco) – the concentration in water at which possibly serious ecotoxicological effects are to be expected. The SRCeco is valid for the freshwater and saltwater compartment.
Quality standards for sediment and suspended matter in surface water will not be derived in this report, because for these compounds they are not relevant for compliance check within the context of national water quality policy.
2
Methods
2.1 General
The methodology is in accordance with the European guidance document for derivation of environmental quality standards under the WFD [2]. This document is further referred to as the WFD-guidance. Additional guidance for derivation of quality standards that are specific for the Netherlands, such as the NC and SRC, can be found in [5]. This guidance document was prepared for derivation of quality standards in the context of the former project “International and national environmental quality standards for substances in the Netherlands (INS)”, and is further referred to as the INS-guidance. It should be noted that the
WFD-guidance deviates from the INS-WFD-guidance for some aspects. This specifically applies to the treatment of data for freshwater and marine species (see section 4.1) and the derivation of the MAC (see section 4.4). This also holds for the quality standard for surface waters intended for the abstraction of drinking water (QSdw, hh, see section 4.3). Where applicable, the WFD-guidance is followed and the INS-guidance is used for situations which are not covered by the former.
2.2 Data collection and evaluation
The derivation of the quality standards for the pharmaceuticals is based on data available in the public domain and on data from industry. An on-line literature search was performed via SCOPUS and data were retreived from the fass.se website. Publicly available reports from quality standard derivations by other institutions in other countries were also used. The original publications used in these reports were re-assessed.
Because a lot of data is generated for the marketing authorisation of
pharmaceuticals, all marketing authorisation holders for products containing these four pharmaceuticals in the Netherlands were invited to share data. Positive reactions were received from a number of marketing authorisation holders. With their permission, the dossier data was accessed and evaluated using the internal database system of the Medicines Evaluation Board. These studies were evaluated, according to the procedure below (see 2.3), but only the endpoints are presented in this report because of confidentiality claims of the data owners. This is a deviation from the normal procedure as described in the WFD- and INS-guidance, and it is recognised that transparency is reduced to some extent. However, not being able to use the data was considered an even less desirable option.
2.3 Data evaluation
Ecotoxicity studies were screened for relevant endpoints (i.e. those endpoints that have consequences at the population level of the test species) and thoroughly evaluated with respect to the validity (scientific reliability) of the study. A detailed description of the evaluation procedure is given in section 2.2.2 and 2.3.2 of the INS-Guidance and in the Annex to the EQS-guidance under the WFD. In short, the following reliability indices were assigned, based on Klimisch et al [6]:
Ri 1: Reliable without restriction ’Studies or data … generated according to
generally valid and/or internationally accepted testing guidelines (preferably performed according to GLP) or in which the test parameters documented are
based on a specific (national) testing guideline … or in which all parameters described are closely related/comparable to a guideline method.’
Ri 2: Reliable with restrictions ’Studies or data … (mostly not performed
according to GLP), in which the test parameters documented do not totally comply with the specific testing guideline, but are sufficient to accept the data or in which investigations are described which cannot be subsumed under a testing guideline, but which are nevertheless well documented and scientifically
acceptable.’
Ri 3: Not reliable ’Studies or data … in which there are interferences between
the measuring system and the test substance or in which organisms/test systems were used which are not relevant in relation to the exposure (e.g., unphysiologic pathways of application) or which were carried out or generated according to a method which is not acceptable, the documentation of which is not sufficient for an assessment and which is not convincing for an expert judgment.’
Ri 4: Not assignable ’Studies or data … which do not give sufficient experimental
details and which are only listed in short abstracts or secondary literature (books, reviews, etc.).’
All available studies are summarised in data-tables, which are available in the Annexes to this report. These tables contain information on species
characteristics, test conditions and endpoints, except for studies for which data confidentiality was claimed (see above). Explanatory notes are included with respect to the assignment of the reliability indices.
2.4 Status of the results
The results presented in this report have been discussed by the members of the scientific advisory group for standard setting in the Netherlands
(WK-normstelling water en lucht), supplemented with representatives from industry.
It should be noted that the proposed quality standards in this report are scientifically derived values, based on (eco)toxicological, fate and physico-chemical data. They serve as advisory values for the Dutch Ministry of Infrastructure and Environment, that is responsible for setting Environmental Quality Standards. The presented quality standards should thus be considered as advisory values that do not have an official status.
3
Carbamazepine
3.1 Introduction
Carbamazepine has been selected by Smit and Wuijts [1] after it was put forward by the Association of River Waterworks (RIWA) as a drinking water relevant compound. The compound is frequently detected in surface water used for drinking water abstraction at concentrations higher than 0.1 µg/L, which is the target set by the International Association of Waterworks in the Rhine Catchment Area (IAWR) for toxicologically relevant substances [7].
Rijkswaterstaat, the governmental board responsible for main rivers and large waterbodies, also put forward carbamazepine as a potentially relevant
compound, because together with its degradation products it is one of the drugs that is most frequently found in surface water. The compound has been
considered for the revision of the list of priority substances under the WFD, but in the end it was not included in Directive 2013/39/EU. Carbamazepine is included in the monitoring programme (“Rijnstoffenlijst 2011”) of the International Commission for the Protection of the Rhine [8] because of its relevance for drinking water production.
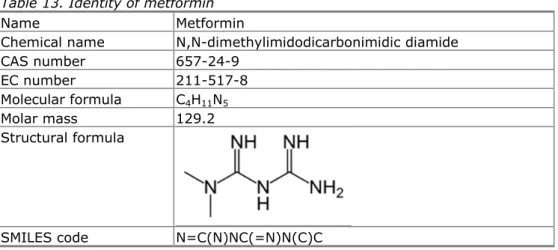
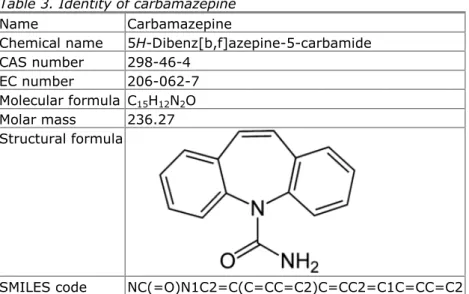
3.2 Identity
Table 3. Identity of carbamazepine
Name Carbamazepine
Chemical name 5H-Dibenz[b,f]azepine-5-carbamide CAS number 298-46-4
EC number 206-062-7
Molecular formula C15H12N2O Molar mass 236.27 Structural formula
SMILES code NC(=O)N1C2=C(C=CC=C2)C=CC2=C1C=CC=C2
3.3 Information on uses and emissions
Carbamazepine is an active pharmaceutical ingredient used for the treatment of epilepsy, trigeminal neuralgia, bipolar depression, excited psychosis, and mania. A total of 28 products with carbamazepine are registered in the Netherlands [9]. Although it is suggested that due to the ageing population carbamazepine use might increase from 8400 kg in 2007 to 8990 kg by 2020 [10], currently the estimated number of users in the Netherlands shows a decrease from almost 56000 in 2006 to around 44000 in 2012 (GIPdatabank.nl). Novartis provided data from the IMS database, showing that total consumption of carbamazepine in the EU decreased from 387 tons in 2008 to 351 tons in 2013. In the
Netherlands, carbamazepine consumption decreased from 9.7 tons in 2008 to 8.6 tons in 2013 (personal communication Novartis). Estimated emissions to surface water in the Netherlands were 1090, 1093 and 1067 kg/y in 2005, 2007 and 2008, respectively [11].
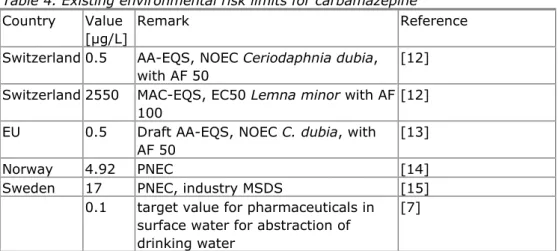
3.4 Existing or proposed water quality standards, risk limits, etc.
For the evaluation of carbamazepine as a candidate for the Dutch watchlist, Smit and Wuijts [1] collected relevant environmental risk limits from readily available datasources.
Table 4. Existing environmental risk limits for carbamazepine
Country Value [µg/L]
Remark Reference Switzerland 0.5 AA-EQS, NOEC Ceriodaphnia dubia,
with AF 50
[12] Switzerland 2550 MAC-EQS, EC50 Lemna minor with AF
100
[12] EU 0.5 Draft AA-EQS, NOEC C. dubia, with
AF 50
[13]
Norway 4.92 PNEC [14]
Sweden 17 PNEC, industry MSDS [15]
0.1 target value for pharmaceuticals in surface water for abstraction of drinking water
[7]
3.5 Physico-chemical properties and fate in the environment
Table 5. Physico-chemical properties of carbamazepine
Parameter Unit Value Remark Reference
Molecular weight [g/mol] 236.27 [12] Water solubility [mg/L] 17.66 112 Estimated Experimental value [12] pKa [-] 15.37 Estimated; value is too high to be relevant in environmental conditions. [12] 13.94 [12] log KOW [-] 2.25 2.45 Estimated Experimental value [12] Vapour pressure [Pa] 1.17 x 10⁻⁵ at 25°C, estimated [12] 1.84 x 10⁻⁷ at 25°C; unknown if experimental or estimated [13] Melting point [°C] 190.2 Experimental value [12]
Boiling point [°C] 410.02 Estimated [12]
Henry’s law constant
[Pa/m3.mol] 1.1 x 10⁻⁵ - 1.6 x 10⁻⁴
Estimated [12]
Log KOC values of 2.23 – 3.12 are reported [12]. In the European datasheet, KOC values for sludge range from 3.5 - < 57 L/kg and for soil from 116.3 –
The derived quality standards are based on dissolved concentrations. In view of the sorption data, these concentrations can be assumed to be valid for the total fraction as well.
Carbamazepine has a number of metabolites or degradation products, which are also found in the environment in concentrations >10% of the parent compound [16]. Within the scope of the present quality standard derivation, the
degradation products are not taken into account. Within the scope of a similar quality standard derivation in Germany and Switzerland, toxicity tests on the metabolites might be performed upon request.
3.6 Bioconcentration and biomagnification
Schwaiger et al. [17] report organ-BCFs for Cyprinus carpio, with a highest BCF of 12 L/kg for the liver. These data are confimed by the study of Garcia et al. [18], who report 42-days kinetic organ-BCFs for Pimephales notatus and
Ictalurus punctatus, with the highest organ-BCFs of 4.6 L/kg for the liver of P. notatus and 7.1 for plasma in I. punctatus. Furthermore, a plasma-BCF in the
range of 0.8 – 4.2 L/kg is reported (Fick, 2010 in [13]). A calculated BCF of 63.2 L/kg at pH 4-10 is also reported (ACD Daten Bank, 2004 in [13]). In view of these data, the risk of secondary poisoning seems to be negligible. Although whole-body BCFs are more relevant for deriving quality standards for secondary poisoning than based BCFs, it can be assumed that the highest organ-based BCF is worst-case for the whole-body BCF. For derivation of the quality standard for human consumption of fishery products, the worst-case measured BCF in liver of 12 L/kg is used with a BMF of 1.
3.7 Human toxicological threshold limits and carcinogenicity
Certain evidence of reproductive adverse effects at clinical doses is reported by Novartis [13]. The compound is self-classified as Repr. 1B, Repr. 2 and Carc. 2 by some industry notifiers in the ECHA database (www.echa.europe.eu; accessed on January 9, 2014). Epidemiological data show that carbamazepine causes teratogenicity in humans (e.g., spina bifida). Genotoxicity is reported as negative [19].
A provisional drinking water standard of 50 μg/L is reported by [20], based on the lowest therapeutic dose for humans of 100 mg/day [21]. For a 60 kg adult this dose corresponds to 1.66 mg/kgbw/day. With a safety margin of 100, a provisional ADI of 16.6 µg/kgbw/day and a provisional drinking water standard of 50 μg/L have been derived.
A LOAEL of 100 mg/d, corresponding to 1.43 mg/kgbw/day for an adult of 70 kg is reported [22]. This results in a human toxicological threshold limit of
15.9 µg/kgbw/day by using a factor of 3 for extrapolation of LOAEL to NOAEL, a factor of 3 to protect sensitive groups, and a factor of 10 for possible
carcinogenicity [22].
Novartis has provided a derivation of the ADI for carbamazepine, based on the same information, and arrives at the same ADI of 15.9 µg/kgbw/day (Novartis, personal communication)
Inéris [23] used a LOAEL of 100 mg/kgbw/day for carcinogenicity in rats with a factor of 3000 (3 for extrapolation to NOAEL, 10 for intraspecies variability, 10 for interspecies variability, 10 for toxic mechanism). This results in an ADI of 33 µg/kgbw/day.
A human toxicological threshold limit of 0.34 µg/kg/day is reported by Schriks et al. [24] based on a maximum tolerated dose (MTD) of 250 mg/kg bw/d for carcinogenicity in rats. Apparently, a safety factor of 740,000 is used, which is not further explained in the Schriks publication.
For the teratogenic mode of action in humans, which is a severe effect for which the ADI should offer enough protection, various reviews estimate a LOAEL of 3.0 mg/kgbw/day (based on a lowest therapeutic dose of 200 mg/day for an adult) [19, 25]. With a total factor of 900 (3 for extrapolation to NOAEL, 3 for sensitive groups in the population, 10 for possible carcinogenicity, 10 for the limited amount of data), this results in an ADI of 3.3 µg/kgbw/day [25]. [19] arrive at an ADI of 10 µg/kgbw/day using a total factor of 300 (10 for extrapolation to
NOAEL, 3 for sensitive groups, 3 for extrapolation of subchronic to chronic, 3 for limited database).
Concludingly, due to the lack of original data which can be assessed for reliability, a pragmatic approach regarding the derivation of an ADI is needed. Teratogenicity is an important endpoint, but dose-response data are hardly available. Because there is no genotoxicity, a limit value can be used for
carcinogenicity. Based on the information presented above, a rounded ADI-value of 16 µg/kgbw/day will be used to assess if human exposure via fish will be the most critical route for risk limit derivation.
3.8 Aquatic toxicity data
An overview of the aggregated ecotoxicity data for carbamazepine for freshwater and marine species is given in Table 6. There are too few data to perform a meaningful statistical comparison between freshwater and marine species. Since there are no further indications of a difference in sensitivity between freshwater and marine organisms and the behaviour of carbamazepine is not expected to differ between freshwater and marine systems, the toxicity data may be
combined [2]. Detailed toxicity data for carbamazepine are tabulated in separate Excel tables, which are taken up as annexes to this report. Only valid studies were used to construct the aggregated data table, with geometric means if per species more data were available for the same endpoint.
Table 6. Aggregated toxicity data for carbamazepine to fresh water organisms. All data with (s) are salt water data.
Chronica Acutea
Taxonomic group NOEC/EC10
(mg/L)
Taxonomic group L(E)C50
(mg/L)
Bacteria Bacteria
Vibrio fisheri (s) 8.9a Vibrio fisheri (s) 64.0f
Cyanobacteria Cyanobacteria Synechococcus leopolensis 17.5 Synechococcus leopolensis 33.6 Algae Algae
Cyclotella meneghiniana 10 Chlorella vulgaris 36.6
Chlorella pyrenoidosa 0.5b Cyclotella meneghiniana 31.6 Chlorella vulgaris 11.8 Desmodesmus
subspicatus
74
Dunaliella tertiolecta (s) 10b Dunaliella tertiolecta (s) 296g Scenedesmus obliquus 0.5b Pseudokirchneriella subcapitata 0.5b Macrophyta Lemna minor 25.5 Rotifera Rotifera Brachionus calyciflorus (s) 0.377 Brachionus koreanus (s) 138.6 Crustacea Cnidaria
Ceriodaphnia dubia 0.025c Hydra attenuata 15.52h
Daphnia magna 0.4d
Daphnia pulex 0.1 Crustacea
Ceriodaphnia dubia 77.7
Pisces Daphnia magna 70.0i
Danio rerio 12.5e
Pisces
Danio rerio 35.4
Oncorhynchus mykiss 19.9
Oryzias latipes 35.4
a geometric mean of 14.2 and 5.59 mg/L for bioluminescence.
b most relevant edpoint: growth rate; most relevant exposure time: 96 h. c most sensitive exposure time: 7 days
d lowest NOEC for reproduction and growth e lowest relevant endpoint: NOEC for hatching
f geometric mean of 52.2 and 78.4 mg/L for bioluminescence, most relevant exposure time: 15 min.
g most relevant exposure time: 96 h
h lowest endpoint: EC50 for growth, morphology, feeding
i geometric mean of 67.5, 111, 76.3, 97.88, and 30 mg/L for immobilisation
The lowest reliable chronic toxicity value is the NOEC of 0.025 mg/L for
reproduction in Ceriodaphnia dubia by Ferrari et al. [26]. Lamichhane et al. [27] report a nominal NOEC of 0.104 mg/L for the same species, and an EC10 of 0.054 mg/L could be calculated using the data from that study with a correction
for actual measured concentrations (see the detailed tables in the Annex to this report). Because this endpoint is derived for a different exposure time (14 days) than that by Ferrari et al., the lowest of the two is used. An industry report shows a NOEC of 17 mg/L for the same species with the same duration and the same endpoints (confidential data by Novartis). Because the difference between these values is a factor of 1000, it is not possible to use the geometric mean of these values. As there is no reason to invalidate the Ferrari (and Lamichhane) studies, this study will be used for the derivation of the quality standard. In addition to the data in the aggregated data table, data are available from a subchronic study (10 days exposure) to Hyalella azteca and Chironomus
riparius. Because this study is neither acute (i.e. 4-day exposure according to
OECD 235) nor chronic (28-day exposure according to OECD 218), it is not included in the aggregated data table. The available data for the sub-lethal endpoint (growth) for these species, an EC10 of 2.6 mg/L for C. riparius and an EC10 of 2.4 mg/L for H. azteca, shows that these species are most likely not more sensitive than the species already present in the chronic dataset. Toxicity tests with fish or amphibian embryos are regarded as chronic studies, even if the exposure time is only 48 or 96 hours, since more than one life-stage and/or the most sensitive life-stage is tested during these studies. Because the endpoint resulting from the amphibian embryo study is a higher-than value, it is not taken up into the aggregated data table.
In addition to the information presented above, chronic data for Cyprinus carpio are available from a report by Schwaiger et al. [17] and a publication by
Triebskorn et al. [28]. This is the same experiment, with more details reported in the Schwaiger report than in the Triebskorn publication [17]. In the
Schwaiger report, the detailed data show clearly that there is no effect on histopathological or blood parameters up to the highest test concentration (LOEC > 0.1 mg/L; NOEC ≥ 0.1 mg/L). Even when there seems to be an effect (for instance on plasma enzymes), the effect is not dose-related and seems more an artefact of the many variables studied, than a real physiological effect. However, Triebskorn et al. [28] does report a LOEC of 0.001 mg/L for effects on the kidney. Looking at the detailed data in Schwaiger et al., this does not seem a reliable endpoint and may again be merely an artefact of the amount of variables studied. Moreover, there is still debate if these endpoints are population relevant; where for blood parameters this does not seem to be the case, in the Diclofenac dossier for the European Commission [29],
histopathological changes for Oncorhynchus mykiss in the same
Triebskorn/Schwaiger study were accepted as relevant endpoints and included in the proposed quality standard derivation. These histopathological changes for diclofenac were much more pronounced and did show a dose-reponse
relationship. However, recently a review of these studies was published, suggesting that also for diclofenac the findings were not clear [30], but the discussion within the EU is still on-going.
In view of the uncertainty regarding the studies discussed above, we decided not to use the data from the Triebskorn/Schwaiger study for derivation of the EQS for carbamazepine. The results were either not relevant for the
ecolotoxicological risk limits derived here (blood parameters) or not reliable (no clear dose-response relationship for kidney histopathological effects).
Galus et al. [31] tested toxicity of carbamazepine to Danio rerio at 0.0005 and 0.01 mg/L. Effects on egg production were shown, but these were not dose-related and could be an artefact of the egg collection method. Also the
histopathological changes in the kidney for both male and female did not seem to be dose-related. No incidence of effects was shown for histopathological changes in the liver. The gonads of female fish were affected at both
concentrations, with a higher effect at the highest concentration (no effects on gonads in male fish). The study has some methodological shortcomings (2 grams of fish per liter, renewal only every 3 days), and thus results will be used as supporting information, but not as critical endpoints.
3.9 Derivation of Environmental Risk Limits
3.9.1 Derivation of QSfw, eco and QSsw, eco
The acute base set is complete. Chronic data are available for six taxonomic groups, with the lowest NOEC-value of 0.025 mg/L for Ceriodaphnia dubia. Because there are no chronic data of the acutely most sensitive taxonomic group (Cnidaria), an assessment factor of 50 should be applied. Thus, the QSfw, eco is 0.025 /50 = 0.0005 mg/L = 0.50 µg/L.
For salt water systems, the QSsw, eco can be derived based on the same value of 0.025 mg/L for C. dubia. With an assessment factor of 500 (no additional specific marine taxonomic groups in the chronic dataset), this results in a QSsw, eco of 25 / 500 = 0.050 µg/L.
As indicated above, the data for the insect C. riparius could not be used since this species was tested only semi-chronically. Valid acute and chronic data on this species and/or H. azteca might reduce the uncertainty regarding the most sensitive taxon, in view of which a safety factor of 50 had to be applied in the present derivation. A further reduction of the uncertainties regarding this risk limit derivation could well be possible, if more data were present that would allow for using statistical extrapolation by means of a species sensitivity distribution (SSD).
3.9.2 Derivation of QSwater, hh food
A quality standard for human consumption of fishery products needs to be derived because of the reported reprotoxic effects [13].
The QSwater, hh food represents the concentration in water that will be protective for humans upon consumption of fishery products. The QSwater, hh food is valid for freshwater and marine waters. First, the maximum permissible concentration in fish (QSbiota, hh food) is calculated based on an ADI of 16 × 10-3 mg/kgbw/day (see 3.7), assuming a body weight of 70 kg, a daily intake of 115 g fish, and a maximum contribution to the ADI of 10%.
The QSbiota, hh food is then (0.1 × 16 × 10-3 × 70) / 0.115 = 0.97 mg/kgbiota ww. Subsequently, the QSwater, hh food is converted to equivalent concentrations in water using the BCF of 12 L/kg and BMF of 1 kg/kg as derived in section 3.6. The resulting QSwater, hh food is calculated as 0.97 / (12 × 1) = 0.081 mg/L = 81 µg/L.
3.9.3 Choice of AA-EQS
For freshwater ecosystems, a QSfw, eco of 0.50 µg/L and a QSwater, hh food of 81 are derived. The lowest of these is the overall AA-EQSfw, which means that the AA-EQSfw is set at 0.50 µg/L.
For saltwater ecosystems, a QSsw, eco of 0.050 µg/L and a QSwater, hh food of 81 resp. 17 µg/L are derived. The lowest of these is the overall AA-EQSsw, which means that the AA-EQSsw is set at 0.050 µg/L.
The comparisons above show that the quality standard for human consumption of fishery products, is not the most critical quality standard and the safety margin between these quality standards is more than a factor of 100.
3.9.4 Derivation of MAC-EQSfw and MAC-EQSsw
Because there are no acute toxicity data for insects, the requirements to perform an SSD are not met.
Using the assessment factor method, the MACfw, eco is derived with the lowest value of 15.5 mg/L for Hydra attenuata. The standard deviation of the log-transformed acute data is below 0.5, and thus an assessment factor of 10 can be applied, resulting in a MAC-EQSfw of 1.6 mg/L.
It is noted that the difference between the AA-EQS and MAC-EQS is more than a factor of 1000, which is due to the high acute-to-chronic ratio. When monitoring data are compared with the standards according to the procedures under the WFD, exceedance of the MAC-EQS will automatically lead to exceedance of the AA-EQS. This means that the MAC-EQS for imidacloprid is of little relevance from the viewpoint of compliance check. However, it may be used for other purposes as well, such as actual risk assessment of incidental peaks.
The saltwater species Brachionus koreanus is not considered as a specifically marine taxon in a sense that the life form or feeding strategy differ from those of related freshwater species. Therefore , the MAC-EQSsw should be derived using an additional assessment factor of 10 (), which results in a MAC-EQSsw of 1.6 / 10 = 0.16 mg/L.
3.9.5 Derivation of NCfw and NCsw
The NC is a factor of 100 below the AA-EQS. The NCfw is 0.50 / 100 = 0.005 µg/L (5 ng/L), the NCsw is 0.0005 µg/L (0.5 ng/L).
3.9.6 Derivation of SRCfw, eco and SRCsw, eco
Because more than three chronic toxicity values are available, the SRCeco is taken as the geometric mean of all chronic toxicity data. Thus, the SRCeco is 1.43 mg/L. This value is valid for freshwater and saltwater.
3.9.7 QSdw, hh
Within the WFD, it is assumed that the level of purification of waters intended for drinking waters should be reduced. Thus, a simple treatment of water abstracted for use as drinking water is assumed [2].
Carbamazepine is considered difficult to remove by current methods for surface water treatment (only 0-40% removed; [32]{Ter Laak, 2010 #38. Thus, in line
with the WFD methodology for the calculation of the QSdw, hh 0% removal is assumed.
With an ADI of 15.5 × 10⁻³ mg/kg
bw/day = 15.5 µg/kgbw/day (see section 3.7), assuming a body weight of 70 kg, a daily intake of 2 L water, and a maximum contribution to the ADI of 10%, the QSdw, hh becomes (15.5 x 0.1 x 70) / 2 = 54 µg/L.
Because this QSdw, hh is higher than the QSfw, this means that the QSfw is also protective for drinking water abstraction when human-toxicological information is used as a basis. However, the proposed target value for pharmaceuticals according to the DMR-memorandum [7] is 0.1 µg/L, which is lower than the QSfw.
3.10 Comparison with monitoring data
In Table 7, an overview is given of monitoring data of carbamazepine.
Table 7. Monitoring data of carbamazepine in the Netherlands
Year Min [µg/L] Max [µg/L] Median [µg/L] Average [µg/L] 90th percentile [µg/L]
Remark (location) Reference
2003 0.227 263 measurements; RIWA data [24] 2006 < 0.12 0.06 0.0539 0.081 28 (Brakel) [33] 0.03 0.12 0.065 0.0692 0.12 12 (Lobith) 0.04 0.15 0.08 0.0821 0.112 117 (Nieuwegein) 0.05 0.13 0.09 0.0893 0.118 15 (Nieuwersluis) < 0.08 0.07 0.0635 0.08 13 (Andijk) 2007 < 0.07 0.05 < 0.06 29 (Brakel) [33] 0.027 0.14 0.06 0.0716 0.136 13 (Lobith) < 0.12 0.08 0.067 0.11 13 (Nieuwegein) 0.05 0.1 0.08 0.0757 0.095 14 (Nieuwersluis) 0.04 0.07 0.05 0.05 0.07 13 (Andijk) 2008 < 0.06 * < * 8 (Luik) [33] < 0.07 < < 0.062 27 (Brakel) < 0.09 < < 0.086 13 (Keizersveer) 0.026 0.12 0.057 0.061 0.109 13 (Lobith) 0.05 0.08 0.07 0.0669 0.08 13 (Nieuwegein) 0.05 0.11 0.08 0.08 0.106 13 (Nieuwersluis) 0.04 0.06 0.05 0.05 0.06 13 (Andijk) 2009 0.059 * 0.03 * * 7 (Luik) [33] < < < < < 122 (Heel) < 0.13 0.06 0.059 0.11 29 (Brakel) 0.03 0.12 0.06 0.0687 0.12 15 (Keizersveer) 0.039 0.16 0.078 0.0824 0.144 13 (Lobith) < 0.08 0.06 0.0565 0.076 13 (Nieuwegein) 0.07 0.12 0.08 0.0831 0.112 13 (Nieuwersluis) < 0.07 0.05 0.0481 0.066 13 (Andijk) 2009 0.61 0.21 16 occasions during screening [34]
Year Min [µg/L] Max [µg/L] Median [µg/L] Average [µg/L] 90th percentile [µg/L]
Remark (location) Reference
2010 < 0.07 0.014 0.0189 0.0654 10 (Namêche) [33] < 0.057 0.016 0.0193 0.0539 10 (Luik) < < < < < 53 (Heel) < 0.1 0.055 0.0513 0.083 26 (Brakel) 0.02 0.1 0.06 0.0562 0.096 13 (Keizersveer) 0.033 0.11 0.0475 0.0565 0.102 12 (Lobith) < 0.1 0.065 0.0679 0.1 12 (Nieuwegein) < 0.11 0.08 0.0754 0.106 13 (Nieuwersluis) < 0.14 < 0.055 0.128 13 (Andijk) 0.04 0.06 0.05 0.0508 0.06 12 (Stellendam) 2011 < < < < < 149 (Heel) [33] < 0.19 0.08 0.0817 0.139 30 (Brakel) < 0.13 0.11 0.0862 0.127 12 (Keizersveer) 0.016 0.17 0.088 0.0877 0.154 13 (Lobith) < 0.16 0.07 0.0765 0.148 13 (Nieuwegein) < 0.088 0.064 0.0578 0.0864 13 (Nieuwersluis) < 0.09 < < 0.082 13 (Andijk) 0.03 0.07 0.06 0.0564 0.07 11 (Stellendam) 2012 < < < < < 153 (Heel) [33] < 0.045 0.028 0.0273 0.041 13 (Brakel) < 0.09 < < 0.09 14 (Keizersveer) < 0.11 0.06 0.0505 0.08 292 (Lobith) < 0.064 0.042 0.0398 0.0616 13 (Nieuwegein) 0.03 0.064 0.052 0.0486 0.0632 13 (Nieuwersluis) < 0.047 0.03 0.0288 0.0446 13 (Andijk) 0.03 0.07 0.05 0.0486 0.065 14 (Stellendam)
Other screening monitoring studies by waterboards showed concentrations between 0.02 and 0.73 µg/L [1].
Rademaker and De Lange [35] summarize monitoring data from various sources. Over 2003-2005, carbamazepine was found in 99 out of 153 samples (65%), the highest concentration was 0.26 µg/L, the average was 0.067 µg/L. Concludingly, the measured concentrations, with annual averages of 0.0.03 - 0.09 µg/L over 2011/2012, are a factor of > 6 lower than the proposed AA-EQS of 0.50 µg/L. The maximum value over 2011/2012 of 0.19 µg/L is almost a factor of 1000 lower than the MAC-EQS of 1.6 mg/L. However, these monitoring data mainly concern larger rivers. There is an on-going monitoring programme of regional waters, results of which will be published soon.
Data from the Watson-database over 2012, regarding measurements in effluents of various sewage treatment plants, show an average carbamazepine
concentration of 0.619 µg/L, with a maximum value of 0.774 µg/L and a 90th percentile of 1.17 µg/L. Thus, the average value in effluents does exceed the derived AA-EQS value. Depending on the dilution of the effluent, the
4
Metoprolol
4.1 Introduction
Similar to carbamazepine, metoprolol has been selected by Smit and Wuijts [1] for the Dutch watchlist after it was put forward by RIWA as a drinking water relevant compound. The compound is frequently detected in surface water used for drinking water abstraction at concentrations higher than 0.1 µg/L, which is the target set by the IAWR for toxicologically relevant substances [7].
4.2 Identity
Table 8. Identity of metoprolol
Name Metoprolol
Chemical name 1-[4-(2-methoxyethyl)phenoxy]-3-(propan-2-ylamino)propan-2-ol
CAS number 37350-58-6 (base); 98418-47-4 (succinate);
56392-17-7 (tartrate)
EC number 253-483-7
Molecular formula C15H25NO3
Molar mass 267.37 (base); 652.81 (succinate); 684.82
(tartrate) Structural formula
SMILES code COCCc1ccc(OCC(O)CNC(C)C)cc1
4.3 Information on uses and emissions
Metoprolol is a selective β1 receptor blocker used in treatment of several diseases of the cardiovascular system, especially hypertension. Metoprolol competes with adrenergic neurotransmitters such as catecholamines for binding at beta(1)-adrenergic receptors in the heart. Beta(1)-receptor blockade results in a decrease in heart rate, cardiac output, and blood pressure
(http://www.drugbank.ca/drugs/DB00264). The active substance metoprolol is employed either as metoprolol succinate or metoprolol tartrate (where 100 mg metoprolol tartrate corresponds to 95 mg metoprolol succinate), respectively as prolonged-release or conventional-release formulation. In the Netherlands, 67 products containing metoprolol are registered [9]. The estimated number of users in the Netherlands has increased from about 800000 in 2006 to almost 975000 in 2010 [36]. The estimated use of metoprolol was 22681 kg in 2007, while the use is expected to increase to 28061 kg in 2020 [10]. The compound is not included in the Pollutant Release and Transfer Register [11].
4.4 Existing or proposed water quality standards, risk limits, etc.
For the evaluation of metoprolol as a candidate for the Dutch watchlist, Smit and Wuijts [1] collected relevant environmental risk limits from readily available data sources (see Table 9).
Table 9. Existing environmental risk limits for metoprolol
Country Value [µg/L]
Remark Reference CH 64 AA-EQS, based on direct ecotoxicity
for Daphnia magna with AF of 50.
[37] CH 76 MAC-EQS, based on direct ecotoxicity
to Desmodesmus subspicatus with AF of 100.
[37]
F 7.3 PNEC, EC50 D. subspicatus with AF
1000
[38]
S 58.3 PNEC, industry MSDS [15]
0.1 target value for pharmaceuticals in surface water for abstraction of drinking water
[7]
4.5 Physico-chemical properties and behaviour in the environment
Table 10. Physico-chemical properties of metoprolol
Parameter Unit Value Remark Reference
Molecular weight
[g/mol] 267.37
Water solubility [mg/L] 16900 Experimental value
[39]
200000 metoprolol base Dossier data AstraZeneca pKa [-] 9.09; 14.41 Estimated [39] log KOW [-] 1.88 Experimental value EpiWin 1.69 Calculated EpiWin -0.9 Experimental value at pH 7; OECD 107 Dossier data AstraZeneca log KOC [-] 1.475; 2.057 Calculated [39] Vapour pressure [Pa] 3.84 x 10⁻⁵ Calculated [39]
Melting point [°C] 116.15 Calculated [39]
Boiling point [°C] 362.44 Calculated [39]
Henry’s law constant [Pa/m3.mol ] 1.42 x 10⁻⁸ 2.15 x 10⁻⁶ Calculated [39]
The derived quality standards are based on dissolved concentrations. In view of the expected low sorption, these concentrations are valid for the total fraction as well.
4.6 Bioconcentration and biomagnification
Using the worst-case log KOW of 1.88, the BCF can be estimated to be 7.9 L/kg according to [2]. Risk of secondary poisoning seems negligible.
4.7 Human toxicological threshold limits and carcinogenicity
The compound is self-classified as Repr. 2 by some industry notifiers in the ECHA database (echa.europa.eu/ ; accessed on January 9, 2014).
A provisional drinking water standard is reported by [20], based on the lowest therapeutic dose of 100 mg/day [21]. For a 60 kg adult this dose corresponds to 1.66 mg/kgbw/day. With a safety margin of 100, a provisional ADI of
16 µg/kgbw/day and a provisional drinking water standard of 50 μg/L were derived.
However, this lowest therapeutic dose is based on metoprolol tartrate and not on metoprolol base [21]. If a correction is applied based on molecular weights (2 x 267.4 g/mol for metoprolol and 684.8 g/mol for metoprolol tartrate), the lowest therapeutic dose becomes 78 mg/day. Besides this, the current lowest dose is not 100 mg/day but 25 mg/day (for use without other medication; see also the package leaflet for Selokeen which can be found at
www.astrazeneca.nl). Corrected for metoprolol base, the dose of 25 mg/day corresponds to 19.5 mg, which would correspond to a dose of 0.28 mg/kgbw/day for an adult of 70 kg (which is preferred within the WFD framework). With a safety margin of 100, the provisional ADI for a 70 kg adult would become 2.8 µg/kgbw/day.
It is noted that reprotoxicity is not taken into account in this provisional ADI. However, it is not possible to derive an ADI based on reproduction toxicity since the data underlying the self classification are not publicly available. A LOAEL of 64 mg/kgbw/day for increased embryo mortality in rabbits and a LOAEL of 3.5 mg/kgbw/day for sperm production in rats were found (FDA data on
http://www.drugs.com/pro/metoprolol.html; accessed on Jan 20, 2014). However, because the study report of this study was not publicly available, reliability could not be checked. Compared with the daily intake of 19.5
mg/person and the provisional ADI of 2.8 of µg/kgbw/day, the safety margin with the LOAEL is about a factor of 1000, which is sufficient to consider the
provisional ADI to be safe.
4.8 Aquatic toxicity data
An overview of the aggregated ecotoxicity data for metoprolol for freshwater and marine species is given in Table 11. There are too few data to perform a
meaningful statistical comparison between freshwater and marine species. Since there are no further indications of a difference in sensitivity between freshwater and marine organisms and the behaviour of metoprolol is not expected to differ between fresh and marine systems, the toxicity data may be combined {EC, 2011 #41}. Detailed toxicity data for metoprolol are tabulated in separate Excel tables in the Annex to this report. Only valid studies were used to construct the aggregated data table, with geometric means if per species more data were available for the same endpoint.
Table11. Aggregated toxicity data for metoprolol for fresh and saltwater organisms. All data with (s) are salt water data.
Chronic Acute
Taxonomic group NOEC/EC10
(mg/L)
Taxonomic group L(E)C50
(mg/L)
Protozoa Bacteria
Tetrahymena pyriformis 21.8 Vibrio fisheri (s) 144
Algae Protozoa
Pseudokirchneriella subcapitata
13.4a Tetrahymena pyriformis 121
Crustacea Algae
Daphnia magna 3.1b Desmodesmus
subspicatus 7.6d Pseudokirchneriella subcapitata 45.5e Pisces
Danio rerio 24c Crustacea
Ceriodaphnia dubia 20.0f Daphnia magna 133g Thamnocephalus platyurus 77.5h Pisces Danio rerio 137 Oncorhynchus mykiss 106
a Geometric mean of 19.65, 6.14, and 19.9 mg/L, NOEC/EC10 values for growth rate (preferred endpoint).
b NOEC for reproduction in a 9-days test c EC10 for growth and development.
d Geometric mean of 7.3 and 7.9 mg/L, EC50 for growth rate
e Geometric mean of 43.4 and 47.7 mg/L, EC50 for growth rate (preferred endpoint) f Geometric mean of 45.3 and 8.8 mg/L, EC50 for mortality.
g 48-hours EC50 value for immobility/mortality (Geometric mean of 63.9, 438, 76.2, 200, and 96.64 mg/L). Effects on heart rate and breathing are not used since these are not population relevant.
h Most sensitive endpoint, Thamnotoxkit.
Toxicity tests with metoprolol are either performed with metoprolol tartrate or metoprolol succinate. However, the quality standard is derived for the
metoprolol base. The endpoints reported should thus reflect the metoprolol base concentrations. In some studies, it is reported clearly if the endpoints reflect the base, the tartrate salt or the succinate salt. In the latter two cases, the endpoint is recalculated into metoprolol base concentrations. If it was not reported if the data reflect the concentrations of the base or the salt, an email was sent to the authors to enquire. If no response was received, it was assumed that the data reflected the metoprolol base (the weight of which is 78% of metoprolol tartrate and 82% of metoprolol succinate).
The NOEC of 3.1 mg/L for Daphnia magna originates from a 9-day test. Although this test is neither acute nor chronic, it is included in the chronic dataset because the “true” chronic endpoint reproduction was included. In addition to the valid studies taken up in the aggregated data table (Table 11),
chronic data for Oncorhynchus mykiss are available from [28] with a LOEC of ≤ 0.001 mg/L for histopathological effects on the kidney and the liver and 0.005 mg/L for histopathological effects on the gills. Similar to what is observed for carbamazepine (see 3.8), a closer look reveals that these effects are not dose-related but rather seem to be an artefact of the many variables studied, than a real physiological effect. Moreover, there is still debate if these endpoints are population relevant; where for blood parameters this does not seem to be the case, in the diclofenac draft EQS derivation for the European Commission [29], histopathological changes for O. mykiss observed in the same experiment [40] were accepted as relevant endpoints. However, recently a review of these studies was published, suggesting that also for diclofenac the findings were not clear [30]. As for carbamazepine, it was decided not to use the histopathological endpoints for derivation of the EQS for metoprolol..
4.9 Derivation of Environmental Risk Limits
4.9.1 Derivation of QSfw, eco and QSsw, eco
The acute base set is available. Chronic data are available for a protozoa (Tetrahymena pyriformis), algae, crustaceans, and the fish Danio rerio. The trophic level which is the most sensitive in the acute dataset (primary
producers) is also present in the chronic dataset. The lowest NOEC is 3.1 mg/L for reproduction of Daphnia magna obtained in a 9-day test. There is also a ‘lower than’ value which is lower than this lowest NOEC (< 3.1 mg/L for growth of 2nd generation D. magna), also obtained in 9-day test. In view of this, and because the test duration is only semi-chronic., an assessment factor of 50 is applied to the NOEC of 3.1 mg/L for D. magna, resulting in an QSfw, eco of 0.062 mg/L = 62 μg/L.
No specific marine taxa are present in the dataset, and thus the QSsw, eco is derived using an additional assessment factor of 10, which results in an QSsw, eco of 6.2 μg/L.
4.9.2 Derivation of QSwater, hh food
Because of the selfclassification of Repr. 2, derivation of the QSwater, hh food is triggered
[13].
A provisional ADI of 2.8 × 10⁻³ mg/kg
bw/day is derived (see section 0). The QSwater, hh food represents the concentrations in water that will be protective for humans upon consumption of fishery products. The QSwater, hh food is valid for fresh and marine water. First, the maximum permissible concentration in fish (QSbiota, hh food) is calculated based on an ADI of 2.8 × 10⁻³ mg/kgbw/day (see 4.7), assuming a body weight of 70 kg, a daily intake of 115 g fish, and a maximum contribution to the ADI of 10%.
The QSbiota, hh food is then (0.1 × 2.8 × 10-3 × 70) / 0.115 = 0.17 mg/kgbiota ww. Subsequently, the QSbiota, hh food is converted to an equivalent concentration in water using the BCF of 7.9 L/kg and BMF of 1 kg/kg as derived in section 4.6. The resulting QSwater, hh food is calculated as 0.17 / (7.9 × 1) = 0.022 mg/L = 22 µg/L.
The quality standard for human consumption of fishery products is considered as highly uncertain. There is no reliable BCF, and due to a lack of data the ADI is not based on toxicological data but on the therapeutic dose. To increase the certainties surrounding these risk limits, the performance of a BCF study could be recommended, together with the public availability of toxicological study reports.
4.9.3 Choice of final EQS
The QSfw, eco is 62 µg/L and the QSsw, eco is 6.2 µg/L.
The QSwater, hh food is 22 µg/L, which is lower than the QSfw, eco. However, the derivation of this human route is too uncertain to use as a basis for an AA-EQS that relates to surface water in general. Therefore, the AA-EQSfw is set to 62 µg/L on the basis of the QSfw, eco. It is noted that for metoprolol and for pharmaceuticals in general, information from valid and relevant, publicly available, studies is urgently needed to set a reliable human-toxicological threshold limit for the general population. For saltwater the QSsw, eco is most critical and the final AA-EQSsw is 6.2 µg/L.
4.9.4 Derivation of MAC-EQSfw and MAC-EQSsw
Acute toxicity data are available for five taxonomic groups. Using the
assessment factor method, the MAC-QSfw, eco is derived using the lowest value of 7.6 mg/L for the alga Desmodesmus subspicatus. The standard deviation of the log-transformed acute data is below 0.5, and thus an assessment factor of 10 can be applied, resulting in a MAC-EQSfw of 0.76 mg/L = 760 µg/L.
For marine systems, the MAC-EQSsw can be derived using an additional assessment factor of 10, since no typically marine taxonomic group is present The MAC-EQSsw is 76 µg/L.
4.9.5 Derivation of NCfw and NCsw
The NC is a factor of 100 below the AA-EQS. The NCfw is 62 / 100 = 0.62 µg/L, the NCsw is 6.2 / 100 = 0.062 µg/L.
4.9.6 Derivation of SRCfw, eco and SRCsw, eco
Because more than three chronic toxicity values are available, the SRCeco is taken as the geometric mean of all chronic toxicity data. The SRCeco is 12.1 mg/L. . This value is valid for freshwater and saltwater.
4.9.7 QSdw, hh
Within the WFD, it is assumed that the level of purification of waters intended for drinking waters should be reduced. Only simple treatment of water abstracted for use as drinking water is therefore assumed [2].
Metoprolol is considered difficult to remove by current methods for surface water treatment (only 0-43% removed; [41]; [42]; [32]). In line with the WFD
methodology for the calculation of the QSdw, hh 0% removal is assumed. With the provisional ADI of 2.8 × 10⁻³ mg/kg
bw/day = 2.8 µg/kgbw/day (see section 0), assuming a body weight of 70 kg, a daily intake of 2 L water, and a maximum contribution to the ADI of 10%, the MPCdw, hh becomes (2.8 x 0.1 x 70) / 2 = 9.8 µg/L.
This does not correspond to the value derived by Versteegh et al. [20] since they used a different therapeutic dose and did not take the molecular weight of metoprolol base into account. The difference in bodyweight of 60 kg used by Versteegh et al. versus 70 kg used in this derivation, is equalled out in the calculation.
Because this QSdw, hh is lower than the QSfw, this means that the QSfw is not protective for drinking water abstraction and that for waters intended for drinking water abstraction the QSdw, hh should be used.
4.10 Comparison with monitoring data
Table 12 gives an overview of monitoring data in the Netherlands.
Table 12. Monitoring data of metoprolol in the Netherlands
Year Min [µg/L] Max [µg/L] Median [µg/L] Average [µg/L] 90th percentile [µg/L] Remark Reference 2005 0.03 0.06 autumn 2005 [20] 2006 0.2 114 measurements; RIWA data [24] 2006 0.02 0.04 spring 2006 [20] 2006 < 0.18 0.065 0.0754 0.159 12 (Nieuwegein) [33] 0.06 0.2 0.105 0.118 0.2 12 (Nieuwersluis) < 0.1 < 0.0164 0.086 11 (Andijk) 2007 0.014 0.038 0.0235 0.0238 0.0362 12 (Lobith) [33] < 0.11 0.08 0.0619 0.102 13 (Nieuwegein) < 0.14 0.11 0.0892 0.136 13 (Nieuwersluis) < 0.06 < 0.0185 0.06 13 (Andijk) 2008 < < * < * 7 (Luik) [33] < 0.068 * 0.037 * 4 (Heel) < 0.04 * 0.0287 * 4 (Brakel) 0.035 0.13 * 0.08 * 9 (Keizersveer) 0.011 0.047 0.027 0.0278 0.045 13 (Lobith) < 0.13 0.09 0.0775 0.124 12 (Nieuwegein) 0.1 0.18 0.13 0.141 0.18 11 (Nieuwersluis) < 0.06 < 0.0225 0.059 10 (Andijk) 2009 0.03 0.11 * 0.065 * 4 (Brakel) [33] < 0.21 < < 0.174 15 (Keizersveer) 0.039 0.12 0.059 0.0673 0.12 13 (Lobith) < 0.13 0.09 0.0823 0.126 11 (Nieuwegein) 0.11 0.25 0.16 0.159 0.238 11 (Nieuwersluis) < 0.12 0.0175 0.0365 0.12 10 (Andijk) 2010 < < * < * 4 (Namêche) [33] < < * < * 4 (Luik) < 0.07 < < 0.07 13 (Brakel) 0.04 0.19 0.12 0.114 0.182 13 (Keizersveer) 0.053 0.14 0.071 0.0773 0.124 12 (Lobith) < 0.13 < 0.0517 0.118 13 (Nieuwegein) 0.014 0.19 0.11 0.094 0.186 13 (Nieuwersluis) < 0.09 < < 0.078 13 (Andijk) < 0.1 0.07 0.07 0.1 12 (Stellendam)
Year Min [µg/L] Max [µg/L] Median [µg/L] Average [µg/L] 90th percentile [µg/L] Remark Reference 2011 0.013 0.031 * 0.0205 * 4 (Heel) [33] < 0.12 0.05 0.055 0.116 13 (Brakel) 0.06 0.29 0.18 0.178 0.278 13 (Keizersveer) 0.032 0.13 0.075 0.0805 0.126 13 (Lobith) 0.033 0.055 * 0.0428 * 6 (Nieuwegein) < 0.069 * 0.0461 * 6 (Nieuwersluis) < 0.025 * 0.00808 * 6 (Andijk) < 0.12 0.06 0.0632 0.114 11 (Stellendam) 2012 < < < < < 4 (Heel) [33] < 0.045 0.028 0.0273 0.041 13 (Brakel) < 0.09 < < 0.09 13 (Keizersveer) - 0.11 0.06 0.0505 0.08 13 (Lobith) < 0.064 0.042 0.0398 0.0616 6 (Nieuwegein) 0.03 0.064 0.052 0.0486 0.0632 6 (Nieuwersluis) < 0.047 0.03 0.0288 0.0446 6 (Andijk) 0.03 0.07 0.05 0.0486 0.065 11 (Stellendam) Monitoring data from a number of waterboards show concentrations of metropolol ranging from 0.11 to 1.1 µg/L [1]. This is higher than the values reported by RIWA [33].
The annual average over 2011/2012 is 0.01 - 0.18 µg/L, which is well below the derived AA-EQSfw of 43 µg/L. The maximum over 2011/2012 is 0.29 µg/L, which is also well below the derived MAC-EQSfw of 760 µg/L.
Rademaker and De Lange [35] summarise monitoring data of pharmaceuticals in the Netherlands over 2003-2005, based on a number of studies. Metropolol was found in 59 out of 120 samples (49%), the highest concentration was 0.42 µg/L, the average was 0.023 µg/L.
Data from the Watson-database over 2012, regarding measurements in various STP-effluents, show an average metoprolol concentration of 1.785 µg/L, with a maximum value of 4 µg/L and a 90th percentile of 2.8 µg/L. Without taking further dilution into account, the average value in effluents is also well below the the derived AA-EQSfw value.
These monitoring data indicate that the AA-EQSfw and the QSdw, hh will likely not be exceeded. However, these monitoring data mainly concern larger rivers.


![Table 7. Monitoring data of carbamazepine in the Netherlands Year Min [µg/L] Max [µg/L] Median [µg/L] Average [µg/L] 90 th percentile [µg/L]](https://thumb-eu.123doks.com/thumbv2/5doknet/3013990.6690/26.892.168.728.526.1177/table-monitoring-carbamazepine-netherlands-year-median-average-percentile.webp)