DECARBONISATION OPTIONS
FOR THE DUTCH SUGAR
INDUSTRY
K. Rademaker, M. Marsidi
20 August 2019
Decarbonisation options for the Dutch sugar industry
© PBL Netherlands Environmental Assessment Agency; © ECN part of TNO The Hague, 2019
PBL publication number: 3481
TNO project no. 060.33956 / TNO publication number: TNO 2019 P10393
Authors
K. Rademaker and M. Marsidi
MIDDEN project coordination and responsibility
The MIDDEN project (Manufacturing Industry Decarbonisation Data Exchange Network) was initiated and is also coordinated and funded by PBL and ECN part of TNO. The project aims to support industry, policymakers, analysts, and the energy sector in their common efforts to achieve deep decarbonisation. Correspondence regarding the project may be addressed to: K.M. Schure (PBL), Klara.Schure@pbl.nl, or A.W.N van Dril (TNO), Ton.vanDril@tno.nl
Production coordination PBL Publishers
This publication is a joint publication by PBL and ECN part of TNO and can be downloaded from: www.pbl.nl/en. Parts of this publication may be reproduced, providing the source is stated, in the form: Rademaker, K. and Marsidi M. (2019), Decarbonisation options for the Dutch sugar industry. PBL Netherlands Environmental Assessment Agency, The Hague.
PBL Netherlands Environmental Assessment Agency is the national institute for strategic policy analysis in the fields of the environment, nature and spatial planning. We contribute to improving the quality of political and administrative decision-making by conducting outlook studies, analyses and evaluations in which an integrated approach is considered paramount. Policy relevance is the prime concern in all of our studies. We conduct solicited and
unsolicited research that is both independent and scientifically sound.
ECN part of TNO has a twofold mission: to accelerate the energy transition and to strengthen the competitive position of the Netherlands. ECN part of TNO conducts independent and internationally leading research and we stand for an agenda-setting, initiating and supporting role for government, industry and NGOs.
This report is not reviewed by Suiker Unie. PBL and ECN part of TNO remain responsible for the content. The decarbonisation options and parameters are explicitly not verified by the companies.
Contents
Summary 4
INTRODUCTION
5
1
SUGAR PRODUCTION IN THE NETHERLANDS
6
1.1 History of the Dutch sugar industry 6
1.2 The sugar sector in the Netherlands today 6
2
SUGAR PRODUCTION PROCESSES
9
2.1 Categorisation of processes 9
2.2 Overview of energy and material flows per process in 2016 9
2.3 Sugar production 12
2.4 Pulp drying 16
2.5 Biogas production 18
2.6 Biogas upgrading to green gas 19
2.7 Ensilaging of beet pulp 20
2.8 Lime production 20
2.9 Combined Heat and Power – CHP 22
3
SUGAR PRODUCTION AND USE
24
3.1 Sugar products 24
3.2 Commodity prices 25
4
OPTIONS FOR DECARBONISATION
27
4.1 Energy efficiency improvements 27
4.2 Decarbonisation of energy supply 29
4.3 Other decarbonisation options 31
5
DISCUSSION
33
5.1 Current GHG emissions 33
5.2 Short term 33
6
REFERENCES
37
PBL – ECN part of TNO |4 – A MIDDEN report
FINDINGS
Summary
There are two sugar factories in the Netherlands, at Dinteloord and Vierverlaten, both operated by Suiker Unie, part of Royal Cosun, an agro-industrial cooperative. Sugar
production from beet is seasonal, starting typically in the beginning of September and ending mid January (Royal Cosun, 2014b). The annual sugar production is around 0.9–1.3 million tonnes, depending on beet production, beet quality and campaign length.
The annual greenhouse gas (GHG) emissions from Suiker Unie vary from 210 to 272 kt CO2eq. Most of the CO2 emissions are energy related as natural gas is used in a combined heat and power generation unit (CHP) to produce the required steam and electricity. About 10% of the emissions are produced in the lime kiln where cokes are used to convert limestone into lime at high temperatures.
Based on the 2016 production volume of 0.93 million tonnes sugar, the calculated CHP gas input was calculated to be 3.4 PJ, generating 2.6 PJ of 4 bar steam (Suiker Unie, 2018c) and 0.5 PJ of electricity. Most of the residual product flow is used as cattle feed, but also part of it is used to produce 0.6 PJ of biogas. In terms of energy efficiency, Suiker Unie has made substantial progress over the last few decades. By 2010, Suiker Unie had reduced its energy consumption by 42% with respect to energy consumption in 1990. The aim for 2020 was a 50% reduction, but this target was already achieved in 2016 (RVO, 2018a).
The main short-term opportunities to further decarbonise CO2 emissions related to natural gas combustion1 in the sugar industry are electrification (heat pumps, electric boilers) and the substitution of natural gas by biogas.
From an efficiency point of view, implementation of mechanical vapour recompression (heat pumps) is a more attractive electrification option than electric boilers due to the higher energy efficiency (COP of 3 to 10). However, electric boilers are a standardised technology, whereas mechanical vapour recompression requires site- and production-process-specific adjustments.
Biogas from the digesters is currently converted by Suiker Unie into green gas and
subsequently fed into the gas grid. The biogas, or green gas, could potentially also be used as input for steam production.
Substitution of natural gas by hydrogen could in the future also become a viable option to produce steam, provided competitively priced hydrogen becomes available.
1 Substitution of lime in sugar production or technologies to decarbonise lime production were not identified.
FULL RESULTS
Introduction
This report describes the current situation for sugar production in the Netherlands and the options and preconditions for its decarbonisation. The study is part of the MIDDEN project (Manufacturing Industry Decarbonisation Data Exchange Network). The MIDDEN project aims to support industry, policymakers, analysts, and the energy sector in their common efforts to achieve deep decarbonisation. The MIDDEN project will update and elaborate further on options in the future, in close connection with the industry.
Scope
Production locations include: Suiker Unie Dinteloord and Suiker Unie Vierverlaten.
Processes include: • CHP (utility); • Sugar production; • Pulp drying; • Biogas production;
• Biogas upgrading to green gas; • Ensilaging of beet pulp;
• Lime production. Products include: • White sugar; • Molasses; • Betacal; • Beet pulp; • Green gas.
The main decarbonisation options are:
• Heat pumps; • Hydrogen boiler; • Biogas boiler; • Electric boiler.
Reading guide
Chapter 1 provides a general introduction to the sugar industry in the Netherlands. In
Chapter 2 the sugar production processes are described, followed by an overview of the main sugar production related products in Chapter 3. Potential decarbonisation options for the sugar industry are described in Chapter 4. The feasibility and requirements of those decarbonisation options are discussed in Chapter 5.
PBL – ECN part of TNO |6 – A MIDDEN report
1 Sugar production in
the Netherlands
This section provides information regarding the sugar industry and its production facilities in the Netherlands.
1.1 History of the Dutch sugar industry
Dutch sugar production started in 1858 with a factory in Zevenbergen. Within the next 16 years, a total of 23 sugar factories were established in the Netherlands. In 1899, the first association of corporate sugar factories (‘Verenigde Coöperatieve Suikerfabrieken’, or VCS) was founded by sugar beet farmers (Suiker Unie, 2018a). Members of the VCS had the advantage of obtaining a better price for their sugar beets. In 1947, members of the VCS began to merge (Suiker Unie, 2018a). After negotiations in 1966, six companies joined forces under the new name ‘Suiker Unie’. Between 1987 and 2007, factories where either merged or closed, leaving only 2 large sugar factories in the Netherlands, one at Dinteloord and the other at Vierverlaten. Both are now part of Suiker Unie.
Partially, the closing of companies was caused by changes regarding the ‘European sugar quota’. The sugar quota on national production was enforced in 1968 to create a guaranteed price for sugar (ECN, 2011). Because of this policy, import was faced with high taxes
whereas the inland price for sugar stabilised (ECN, 2011). Critics denounced the
protectionism of this market order, resulting in a step wise reformation of the guaranteed price and national production quota between 2006 and 2015. Production over the limit of the quota, called ‘out of quota production’, was exported, used as bioethanol, or used for specific chemical uses (Europa Nu, 2017). In 2015 the sugar quota policy was abolished and without a limit on sugar production an increase in production is expected (Europa Nu, 2017). In Dinteloord and Vierverlaten, the production capacity of the sugar factories was increased in 2017, as well as the biogas production capacity (Royal Cosun, 2017b).
1.2 The sugar sector in the Netherlands today
In 2017, 8,000,000 tonnes of sugar beets were processed in the Netherlands (Royal Cosun, 2017b) in Vierverlaten and Dinteloord. Figure 1 shows the current locations of Suiker Unie (Van Dam, 2014). In Vierverlaten, Dinteloord and Anklam (GER), sugar is produced from sugar beets. In Roosendaal and Putterhoek specialty products of sugar are produced. Eemshaven and Liverpool (UK) are logistics and sales locations of Suiker Unie.
Figure 1 Suiker Unie locations in 2014 (Van Dam, 2014)
Only the sugar factories Vierverlaten and Dinteloord are discussed in this report, because these are the Dutch production sites where the energy intensive production of sugar from sugar beets takes place and that are part of the ETS, whereas the other Dutch factories of Suiker Unie are not.
The sugar factory is located at Dinteloord in the Dutch Province of North Brabant and was founded in 1908. According to the Dutch Emissions Authority (NEa), the sugar factory at Dinteloord emitted 101,613 tonnes CO2eq in 2016 (Dutch Emissions Authority, 2018). On-site, there is a digester and a biogas upgrader. Around 100,000 tonnes of biological residues per year (Suiker Unie, 2018b) are used by the digester and upgrader to produce 9–11 million m3 green gas per year, which is fed into the gas grid (RVO, 2009) (Suiker Unie, 2017b). The CO2 that is produced by the digester can potentially be reused by nearby greenhouses of Agro food Cluster Nieuw Prinsenland (Groentennieuws, 2013). The wastewater of the sugar factory is used by a nearby eggplant greenhouse (Omroep Brabant, 2018).
The sugar factory of Vierverlaten in Groningen was built in 1916. According to the Dutch Emissions Authority data, the sugar factory of Vierverlaten reported 108,558 tonnes CO2eq emitted in 2016 (Dutch Emissions Authority, 2018). On-site, there is a digester and a biogas upgrader which is assumed to be the same as the installation in Dinteloord (Suiker Unie, 2018b).
A total of 800 employees worked at Suiker Unie in 2017. The number of employees may differ substantially, within and outside of the production season (beet campaign).
PBL – ECN part of TNO |8 – A MIDDEN report Table 1: General plant characteristics of sugar factories at Dinteloord and
Vierverlaten
Characteristics Suikerfabriek Dinteloord Suikerfabriek Vierverlaten
Name Suiker Unie
Factory at Dinteloord
Suiker Unie Production location Vierverlaten
Address Noordzeedijk 113 Fabriekslaan 12
Postal code 4971 TL 9745 AG
Location Dinteloord Groningen
Employment Total of 800 employees in 2017 Royal Cosun (2017b)
ETS data (2016) 101,613 108,558
2 Sugar production
processes
This chapter describes the sugar production processes. Please note that all information below is based on literature research and assumptions made by ECN researchers. The results were not verified by Suiker Unie. Furthermore, the two factories in Dinteloord and Vierverlaten are assumed to be identical in terms of production, specific energy consumption and equipment.
2.1 Categorisation of processes
To describe the different processes and technologies of the sugar factories, the following categorisation was used:
• CHP (utility); • Sugar production; • Pulp drying; • Biogas production;
• Biogas upgrading to green gas; • Ensilaging of beet pulp;
• Lime production.
2.2 Overview of energy and material flows per process in
2016
Figure 2 provides an overview of the material and energy consumption of the Dutch sugar industry in 2016. In this year, the factories at Dinteloord and Vierverlaten produced a total of 934,000 tonnes sugar combined (Royal Cosun, 2016). Based on the specific energy
consumption and estimated production volumes for each process, a total CO2 emission of 213 kt was calculated2. Most of the emissions are related to the combustion of natural gas (192 kt CO2) by the CHP to produce steam and electricity. The remaining 21 kt CO2 is related to the combustion of cokes in the lime kiln, used to produce lime for the juice purification.
2 This is comparable to the reported emissions by Suiker Unie of 210 kt CO2eq (Dutch Emissions Authority,
Figure 2 Overview of material and energy consumption Dutch sugar industry in 2016
CHP Beets (30% dmc) Lime kiln (900oC)
6.6 Mton Natural gas 3.4 PJ CO2 21 kton CO2 192 kton Sugar production (70-135oC) Limestone 0.12 Mton Lime 0.07 Mton Pulp dryer (500-575oC)
Digester Biogas upgrader
Natural gas Cokes 0.2 PJ Steam (4 bar) 2.6 PJ Waste heat (40-602.3 PJ oC) Electricity 0.5 PJ
Biomass other sectors
Wet beet pulp (26% dmc) 1.3 Mton Sugar 0.93 Mton Molasses (75% dmc) 0.28 Mton Betacal (50% dmc) 0.37 Mton CO2 0 kton Green gas 0.6 PJ Biogas Dry pulp 0 Mton Beet tops (12% dmc) 4 Mton Ensilaging Consumers of pulp (animal feed) Beet ends (14% dmc) 0.09 Mton
PBL – ECN part of TNO |12 – A MIDDEN report
2.3 Sugar production
2.3.1 Description
Sugar production is defined here as all necessary steps to produce white sugar from sugar beet at the production site. Sugar beet production, harvesting, logistics, and other activities related to the farmers that produce the sugar beet are outside of the scope.
The process of sugar production can be divided into 4 processes: • Juice production;
• Juice purification; • Juice evaporation; • Crystallisation.
The sugar production varies per year. In 2014 the sugar production was 1,124,000 tonnes of sugar (Suiker Unie, 2014a), whereas in 2016 the sugar production was 934,000 tonnes (Royal Cosun, 2016). In 2017, after investments to expand the production capacity of the sugar factories, the production rose to a new a record with 1.3 million tonnes production and a campaign lasting 5 full months (Royal Cosun, 2017a).
The total production capacity in 2014 of Suiker Unie Vierverlaten and Suiker Unie Dinteloord combined was 6,4403 tonnes of sugar per day (Royal Cosun, 2014b). Sugar beet harvesting, and the subsequent sugar production, is done in periods called ‘campaigns’, starting typically in the beginning of September and ending mid January (Royal Cosun, 2014b). The production capacity is therefore only used to its fullest 40% of the time.
PBL – ECN part of TNO |14 – A MIDDEN report Juice Production
The first step in sugar production is the cleaning and chopping the sugar beets. Water is used to remove earth and small stones. The beet soil itself is recovered and is reused as farm land. The small parts of the beet that end up in the washing water are used as a feedstock to produce biogas. The beets are then sliced into thin 4–5 mm strips — also called cossettes (SKIL, 2018), after which water is added to remove earth and other impurities at a temperature of about 60 °C.
The cossettes are then added to the cossette mixer, where the sugar is extracted by mixing and heating the cossettes to minimally 69 °C, but not higher than 75 °C (Merino Gómez, 2001). Above 75 °C the cossettes can start to degrade. By means of diffusion the sugar is extracted by the water resulting in raw juice. Typically, a sugar beet contains 14% to 18% sugar (FAO, 1999)
(Duraisamy, Berekute and Salelgn, 2017). In the extraction process about 98% of the sugars from the beet are extracted (Honiron Manufacturing, 2018). The last 1% to 2% of sugar will remain in the beet pulp. The extraction process takes about 90 minutes for the cossettes to travel through the diffuser (Merino Gómez, 2001). The water that is used in the extraction travels through the diffuser in 45 minutes. This is done to create a countercurrent exchange, which results in higher sugar extraction. Rotary blades move the cossettes constantly towards water with a lower sugar concentration. By doing so, the diffusion gradient is continuously maximised, forcing a constant mass transfer (Merino Gómez, 2001).
The raw juice (at 26 °C) is then brought to the next step of juice purification. The raw juice consists of 14% sugar (Smejkal, Bagherzadeh and Schick, 2008).
Juice Purification
In addition to sugar and water, the raw juice still contains insoluble compounds. These are
removed by carbonation of the raw juice. Using lime (see also Section 2.8 for lime production) the insoluble compounds of the raw juice are precipitated, only leaving a sugary solution. In two carbonisation steps the solution is then treated with CO2 to get rid of the lime, which then forms a side stream in the form of calcium carbonate. In this process, 66% of the CO2 produced in the lime kiln is captured. The calcium carbonate is sold as a lime fertiliser under the branded name Betacal. About 0.4 tonnes Betacal is produced per tonne of sugar (IRS, 2018).
The liming, which is the addition of lime to the raw juice, and the first carbonisation step operate at 83 °C, while the second carbonisation step operates at 93 °C (Smejkal, Bagherzadeh and Schick, 2008). During the process of liming the pH carefully needs to be checked and kept at a pH of 7. The resulting solution is called thin juice that consists of sugar for 15% to 16%. At a
temperature of 91 °C (Smejkal, Bagherzadeh and Schick, 2008) the product goes to the next process of juice evaporation.
Juice Evaporation
Through multiple-effect evaporation (MEE), the thin juice is heated and water is evaporated to result in thick juice. During these steps the dry matter content (dmc) of the thin juice (16%–17% dmc) is increased to 73% (Smejkal, Bagherzadeh and Schick, 2008).
Steam enters the first effect at a temperature of around 135 °C. The final evaporation step is operated at a temperature of around 115 oC (Smejkal, Bagherzadeh and Schick, 2008). The remaining hot vapour after the evaporation steps is reused in different processes. Most of the waste heat of the evaporation steps is used for the crystallisation step. The rest is used to preheat
the diffuser in the juice production process, heat the 2cd carbonation step, heat the pre-limer, and to provide heat to the pulp press4 (Smejkal, Bagherzadeh and Schick, 2008).
Crystallisation
This process step is done in batches to produce the crystalline white sugar. The thick juice is boiled in three steps in vacuum pans. The temperature of the three steps is 70 °C, 75 °C and 80 °C, respectively (Smejkal, Bagherzadeh and Schick, 2008). In the first step, the juice is cooked until supersaturation (Simoglou, Georgieva, Martin, Morris and Feyo de Azevedo, 2005). When supersaturation is reached, sugar crystals are added to start the Crystallisation, which is the second step. To maintain the same level of supersaturation, thin juice or water is added to this process. In the third and last step the sugar crystals, in the form of a heavy syrup, are extracted by evaporating the water. The sugar crystals are then separated from the thick syrup in a centrifuge (Simoglou, Georgieva, Martin, Morris and Feyo de Azevedo, 2005). The sugar that is produced contains about 2% water, whereas the heavy syrup – better known as molasses – contains 81% dry substance (Smejkal, Bagherzadeh and Schick, 2008).
Molasses is made at a ratio of 0.3 t/t sugar and used as animal feed or as feedstock in alcohol production and yeast production (IRS, 2018).
Waste heat
The sugar production process heat flows are highly integrated, thereby using the heat from the CHP very efficiently. Waste heat eventually leaves the process in the form of vapour at a
temperature of 50 °C (2 PJ in 2011) and in the form of condensates, also at 50 °C (about 1 PJ in 2011). Additionally, heat is lost at 40 °C (1 PJ in 2011) in the form of ventilation air and via flue gasses (0.5 PJ in 2011). Waste heat from the drying of the pulp has a dew point of 50 oC (1.5 PJ in 2011) (Daniels, Wemmers, Tigchelaar and Wetzels, 2011). It is assumed that the waste heat streams of 2016 have similar volumes and temperature levels.
2.3.2 Energy and material input and output
It is assumed that energy input for the sugar production consists only of steam and electricity produced from the on-site CHP. The produced steam is routed to the first juice evaporation step and from there on the system is interconnected with the other process steps, creating an intricate network of heat flows.
The amount of electricity sold to the grid depends on the amount of overproduction during the campaign length and is usually in the range of 3–5 MW (Suiker Unie, 2019). In our calculations of the specific electricity consumption, we neglect the fact that part of the produced electricity is sold to the grid, as this varies per year.
The main input for the sugar production process are sugar beets and limestone. Limestone is converted to quicklime in the lime kiln and used for juice purification.
The main output of sugar production is white sugar. Other main outputs are molasses (a brown, thick syrupy substance), slaked lime (Betacal), and beet pulp (IRS, 2018). Beet pulp, either pressed or dried, is a large residual stream and is used as animal feed. Betacal is a waste product from juice purification that contains undesirable insoluble compounds and nutrients and is used as fertiliser (Smit and Janssens, 2016). Beet tops are the largest residual stream. Currently, there appears to be no application for the 3 to 4 million tonnes of beet tops (12% dmc) produced
4 Note that this is a very high level summary of the waste heat flows of sugar production, and that the actual heat
PBL – ECN part of TNO |16 – A MIDDEN report annually, although researchers are analysing its potential as a substitute for proteins (EcoWatch, 2015). Molasse is used as animal feed or as feedstock in alcohol production and yeast.
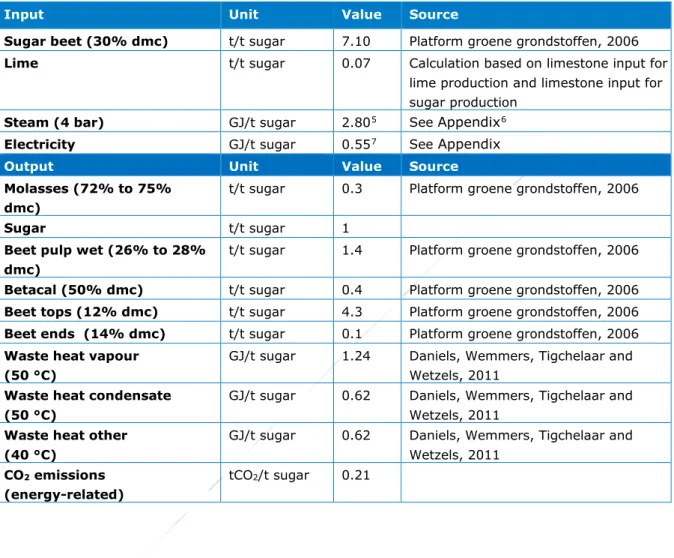
Table 2 summarises the most important input and output of the sugar production process.
Table 2: Input and output of sugar production
Input Unit Value Source
Sugar beet (30% dmc) t/t sugar 7.10 Platform groene grondstoffen, 2006
Lime t/t sugar 0.07 Calculation based on limestone input for
lime production and limestone input for sugar production
Steam (4 bar) GJ/t sugar 2.805 See Appendix6
Electricity GJ/t sugar 0.557 See Appendix
Output Unit Value Source
Molasses (72% to 75% dmc)
t/t sugar 0.3 Platform groene grondstoffen, 2006
Sugar t/t sugar 1
Beet pulp wet (26% to 28% dmc)
t/t sugar 1.4 Platform groene grondstoffen, 2006
Betacal (50% dmc) t/t sugar 0.4 Platform groene grondstoffen, 2006
Beet tops (12% dmc) t/t sugar 4.3 Platform groene grondstoffen, 2006
Beet ends (14% dmc) t/t sugar 0.1 Platform groene grondstoffen, 2006
Waste heat vapour (50 °C)
GJ/t sugar 1.24 Daniels, Wemmers, Tigchelaar and Wetzels, 2011
Waste heat condensate (50 °C)
GJ/t sugar 0.62 Daniels, Wemmers, Tigchelaar and Wetzels, 2011
Waste heat other (40 °C)
GJ/t sugar 0.62 Daniels, Wemmers, Tigchelaar and Wetzels, 2011 CO2 emissions (energy-related) tCO2/t sugar 0.21
2.4 Pulp drying
2.4.1 Description
Beet pulp can be sold as animal feed or used as feedstock for the digester.
Typically, the beet pulp is dried using a high temperature drum (HTD) dryer (European Commission, 2005) after a pulp press has first mechanically removed the water. After the
mechanical pressing, the pressed pulp can also be sold as pressed pulp for animal feed, instead of being dried first and then sold as dried pulp.
The temperature in the dryer is between 500 °C and 575 °C and the exhaust heat has a
temperature between 103 °C and 120 °C (European Commission, 2005; Merino, Alves, Acebes and
5 Average of calculated specific steam consumption for 2014 and 2016 (see the appendix).
6 The steam consumption is based on the registered CO2 emission according to (Dutch Emissions Authority, 2018)
(based on the average calculated for 2014 and 2016), but the actual steam consumption could be higher as the amount of biogas produced by Suiker Unie for their own consumption is not registered as CO2 emissions and therefore
not included in this approach
Prada, 2017). The dew point of the exhaust gas is around 50 oC (Daniels, Wemmers, Tigchelaar and Wetzels, 2011).
Wet beet pulp consists for a large part out of water (~30% dry matter content). Since drying the beet pulp is very energy intensive (see Section 2.4), it is more energy efficient to use the beet pulp as feedstock for the digester (Suiker Unie, 2014b), or directly as pressed pulp for feed for animals (see Section 2.7). The decision making behind which part of the pressed pulp is allocated to which end product (biogas, dried animal feed pellets, pressed pulp), depends on the demand for pressed pulp demand for dried pulp, and various other factors8.
Based on the literature, it is assumed that Suiker Unie has focused on using ensilage to avoid the need to dry the pulp (45% of the pulp in 2008 and 70% in 2011 (Backx, 2012)), it is assumed that in 2016 a large part of the wet pulp was sold (as pressed pulp) as food for animals after
ensilaging. Pressed pulp is also used for the digester. Therefore, the pulp dryer is assumed not to be used as of 2016. Note that avoiding the drying step is only possible if there are consumers for the wet pulp.
2.4.2 Energy and material input and output
Beet pulp is the beet waste left after sugar extraction and has around 10% dry matter content (IRS, 2018). After the mechanical removal of water (press), the wet beet pulp has a dry matter content of about 26% to 28%. It is reported that the residence time of pulp in the drum dryer is 28 minutes and results in a dry beet pulp with around 90% dry matter content (Merino, Alves, Acebes and Prada, 2017).
According to (Jensen and Morin, 2015), the process of drum drying consumes 6.1 GJ/t dry beet pulp (Jensen and Morin, 2015).
Table 3: Input and output of pulp drying
Input Unit Value Source
Natural gas GJ/t dry pulp 6.10 Jensen and
Morin, 2015
Beet pulp wet (28% dmc) t/t dry pulp 3.50 Jensen and
Morin, 2015
Output Unit Value Source
Beet pulp (dry) (90% dmc) t/t dry pulp 1
Waste heat (dew point 50 °C) GJ/t dry pulp 6.1 Daniels,
Wemmers, Tigchelaar and Wetzels, 2011
CO2 emission tCO2/t dry pulp 0.34 Calculated
8 The offer by Cosun BG Duynie, for example, to install a silo for free for farmers willing to sign a 10-year contract to
buy pressed pulp resulted in a decrease in demand for dried pulp and an increase in demand for pressed pulp (Processinnovation.nl, 2016).
PBL – ECN part of TNO |18 – A MIDDEN report
2.5 Biogas production
2.5.1 Description
The sugar factories of Dinteloord and Vierverlaten received a permit to build a digester in 2011 and 2012, respectively. The digesters are assumed to be almost identical to each other (Suiker Unie, 2019). The digesters, anaerobe methane reactors, were installed to replace the previous process water treatment installation that had a high electricity consumption and did not produce biogas (RVO, 2009).
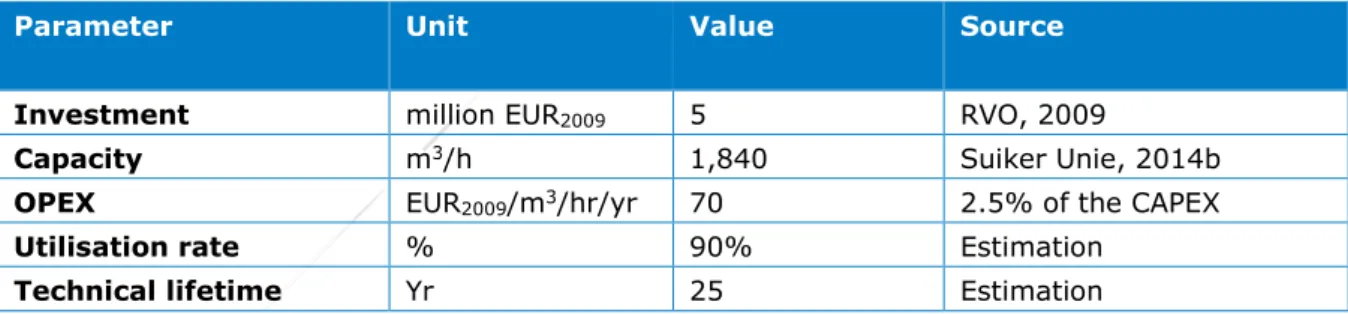
The total installed capacity of the anaerobe methane reactors is assumed to correspond to the capacity of the biogas upgrader (1,150 m3/h, (RVO, 2009)). It is therefore assumed that the capacity per installation is 1,840 m3/h (based on a consumption of 1.6 m3 biogas per m3 green gas). The utilisation rate is assumed to be 90%.
During the campaign the digester is fed mostly with remnants of the sugar beets. Unlike the sugar production, the digester appears to also run when the production season is over, using mostly beet pulp (Van der Veen, 2014).
According to (RVO, 2009) the investment for a methane reactor required an investment of EUR 5 million. Based on the assumed biogas production capacity, the investment cost was estimated at EUR2009 2,700 per m3/hr. The OPEX is assumed to be EUR2009 70 per m3/hr/yr (2.5% of the CAPEX). The technical lifetime is assumed to be 25 years.
The biogas production capacity of Vierverlaten has likely increased as of 2018, as Suiker Unie planned to install an extra digestion tank (in addition to the four tanks already installed). The additional produced biogas would be used on-site. The additional feedstock demand would be met by using pressed pulp (Suiker Unie, 2017a).
Table 4: Digester data
Parameter Unit Value Source
Investment million EUR2009 5 RVO, 2009
Capacity m3/h 1,840 Suiker Unie, 2014b
OPEX EUR2009/m3/hr/yr 70 2.5% of the CAPEX
Utilisation rate % 90% Estimation
Technical lifetime Yr 25 Estimation
2.5.2 Energy and material input and output
The reactors produce biogas with a methane content of 81% (RVO, 2009). Aside from biogas, the digester produces digestate which is a valuable natural fertiliser containing minerals (Pesta, 2007). Every year, 100 kt of digestate (wet) is produced by the module. The concentrate contains N:P:K in a 12:5:5 ratio (Suiker Unie, 2014b). This concentrate is used for fertilisation (Suiker Unie, 2019).
The anaerobic digesters make use of waste material from the cleaning process, remnants of the sugar beets, and pressed pulp (Smit and Janssens, 2016) (Suiker Unie, 2019). Waste streams from nearby sectors are also used, such as from the potato industry (Suiker Unie, 2014b), but
around 95% of feedstock materials used in digesters are related to sugar beets (Van der Veen, 2014).
Table 5: Input and output of digester
Input Unit Value Source
Biomass feedstock (pressed pulp and remnants of the sugar beets)
t/m3 biogas 0.008 Huisman, 2009
Output Unit Value Source
Biogas m3/m3 biogas 1
Digestate (wet) (10% dmc)
t/m3 biogas 0.006 Suiker Unie, 2014b
2.6 Upgrading biogas to green gas
2.6.1 Description
Biogas is made up of a different methane and CO2 ratio than natural gas; the calorific value of biogas is lower than that of natural gas (Eriksson, 2010). By removing CO2, it is possible to upgrade biogas to an energetic value that is comparable to natural gas (Persson, Jönsson and Wellinger, 2006). It can be economically attractive to invest in an upgrading installation due to the SDE subsidy for injecting green gas into the grid (RVO, 2018b).
It is not known what type of upgrading technology the Dutch sugar factories use. However, well-known techniques are adsorption technologies, e.g. Pressure Swing Adsorption (PSA), or
absorption technologies, e.g. with water or polyethylene glycol or Mono Ethanol Amine (MEA) (Persson, Jönsson and Wellinger, 2006).
At both digester installations, Suiker Unie invested in biogas upgraders to upgrade biogas to natural gas quality (RVO, 2009). The production volume of this so-called green gas per installation is 10 million m3 (Suiker Unie, 2014b) with a green gas production capacity per installation of 1,150 m3/hr (Suiker Unie, 2014b), and an estimated utilisation rate of 90%.
The biogas upgrader cost of an installation of 1,150 m3 green gas per hour, is EUR 4 million (RVO, 2009). Based on this data, the CAPEX is assumed to be EUR2009 3,500 per m3/hr, with an OPEX of EUR2009 90 per m3/hr/yr (2.5% of CAPEX). The technical lifetime is assumed to be 25 years.
Table 6: Biogas upgrader data
Parameter Unit Value Source
Investment million EUR2009 4 RVO, 2009
Capacity m3/h 1,150 RVO, 2009
OPEX EUR2009/m3/hr/yr 90 2.5% of CAPEX
Utilisation rate % 90% Estimation
PBL – ECN part of TNO |20 – A MIDDEN report
2.6.2 Energy and material input and output
The biogas upgrader uses 1.6 m3 biogas per produced m3 of green gas, based on a reported 10 Mm3 green gas production and 16 Mm3 biogas production per year (Suiker Unie, 2014b). The process requires heating. In some cases, biogas can be used for this (maximum of 10% of the biogas input)9.
Table 7: Input and output of biogas upgrader
Input Unit Value Source
Biogas m3/m3 green gas 1.6 Suiker Unie, 2014b
Output Unit Value Source
Green gas m3/m3 green gas 1
2.7 Ensilaging of beet pulp
2.7.1 Description
Ensilaging the beet pulp minimises biological degradation and preserves nutrients. The silage can be stored in a silo or pit and sold later as animal feed or used to feed the digester. To ensilage the beet pulp, it is important to have the right conditions regarding moisture, temperature and acidic level to prevent the material from composting, fermenting or rotting. In terms of temperature the optimal range is 40 oC to 60 oC (Schrik et al., 2017). The beet pulp needs to be put on top of each other and closed from oxygen. This can be done using a tarp and fixate it with old tires, ground cover if available or straps (Latre, Wambacq and Van Dijk, 2014). Coverage of the beet pulp should happen as quickly as possible to prevent oxygen to be absorbed in the upper layers of the silo. Only in this way lactic acid bacteria can grow and conserve the material. This process takes about 4.5 weeks.
2.8 Lime production
2.8.1 Description
Juice purification is an essential process used to remove unwanted insoluble compounds. For this process lime is used that is produced in a lime kiln. The following reaction takes place in the lime kiln:
CaCO3-> CaO + CO2
The process temperature in the kiln is between 830 °C and 1200 °C (Piringer, 2017).
9 Note that (ECN, 2017a) estimates a 30% use of biogas for internal heating of green gas production using
mono-digestion. However, it is assumed that the feedstock used by Suiker Unie has a considerably higher dry matter content and therefore requires less heating. Also, the digester may benefit from the available waste heat, or directly use steam from the CHP unit.
Most of the kilns in the European sugar industry are mixed feed shaft kilns (European Commission, 2010). In the lime kiln, limestone (CaCO3) is heated using cokes or anthracite to form lime (CaO) and CO2.
Raw juice is added to dissolve the lime in an exothermic reaction to produce limewater. The raw juice (83% water) (Smejkal, Bagherzadeh and Schick, 2008), is mixed directly with the lime (District Court 's-Hertogenbosch, 2015). The carbon dioxide enriched gas from the lime kiln is then added to form calcium carbonate and precipitate impurities by encapsulating them into the calcium carbonate particles. The particles are then removed via sedimentation (Varelius, 2014).
The precipitated material (called ‘Betacal’) consists mostly of CaCO3. Other components are nitrogen, phosphor in the form of P2O5, and magnesium (MgO) (Royal Cosun, 2014a).
There are no public data available regarding production capacity, amounts produced annually, or investment costs, related to the lime kiln of Suiker Unie. Based on the ratio of tonne lime per tonne sugar, the total lime production in 2016 by both factories of Dinteloord and Vierverlaten combined, is estimated to be around 65 kt. The total combined lime production capacity installed is estimated to be 451 t/day, and is assumed to only be used during the production season (estimated 40% utilisation rate).
2.8.2 Energy and material input and output
The most common fuel in sugar industry lime kilns is coke or anthracite. Cokes or anthracite are used because the gas after combustion of these fuels results in more CO2 (40% to 42% CO2 by volume) than it would from gas from oil- or gas-fired kilns (28% to 32% CO2 by volume) (European Commission, 2010), which is used for the precipitation step.
Part of the CO2 gas that is produced in the lime kiln from the conversion of limestone to lime and the combustion of cokes, is emitted to the air (Ecofys, 2014). The rest is captured during the precipitation step and becomes part of a fertiliser product (Betacal).
The specific consumption of limestone for lime production in weight was calculated based on the ratio of one mole of CaCO3 per mole of CaO10, resulting in 1.8 tonnes limestone per tonne lime.
The specific consumption of cokes was based on the required heat consumption for lime production by mixed feed shaft kilns (MFSK) or 3.4 GJ/t lime (Ecofys, 2014).
Table 8: Input and output of lime kiln
Input Unit Value Source
Limestone t/t lime 1.80 Calculation based on reaction
ratio CaCO3 to CaO and molar mass
Cokes GJ/t lime 3.4 Ecofys, 2014
PBL – ECN part of TNO |22 – A MIDDEN report
Output Unit Value Source
Lime t/t lime 1
CO2 process emissions tCO2/t lime 0.3 - 0.4 Ecofys, 2014
2.9 Combined Heat and Power – CHP
2.9.1 Description
Both sugar production plants in the Netherlands own a CHP installation to meet their steam and electricity demands. Suiker Unie provides the following information (Suiker Unie, 2018c):
• One CHP has the potential of producing 21–23 MW electricity;
• The electricity is generated by a steam boiler that produces steam at 40 to 50 bar; • This pressure is decreased in a steam turbine to 4 bar, whilst the generator of a turbine
converts part of the energy to electricity.
Each CHP of the production facilities (Vierverlaten and Dinteloord) has an electric output of 21–23 MW (Suiker Unie, 2018c); for the data an average of 22 MW is used. The total steam production in 2016 of 1.26 PJ is based on the total sugar produced and the specific steam consumption per tonne of sugar (see Figure 2). The CHP is assumed to only run during the production season (assumed 40% utilisation rate).
The CAPEX is calculated based on the investment cost of a 15 MWe steam turbine, which is according to (USDOE, 2016) 600 EUR2016/kWe, with an OPEX of 1 euro cent per kWh electricity output11.
Table 9: CHP equipment data
Parameter Unit Value Source
Investment million EUR2016 13 USDOE, 2016
Capacity MWe 22 Suiker Unie, 2018c
OPEX EUR2016/kWh 0.01 USDOE, 2016
Utilisation rate % 40% Estimation based on
campaign length
Technical lifetime Yr 25 Estimation
2.9.2 Energy and material input and output
The ratio steam and electricity production of the CHP was calculated based on the steam pressure before and after the steam turbine (Suiker Unie, 2018c). For information regarding the calculations see the Appendix. Table 10 summarises the energy input and output.
Table 10: Input and output of CHP
Input Unit Value Source
Gas consumption GJ/GJ steam 1.30 Calculations based on (Suiker Unie, 2018c)
Output Unit Value Source
Steam production GJ/GJ steam 1
Electricity production GJ/GJ steam 0.20 Calculations based on (Suiker Unie, 2018c)
According to Suiker Unie, up to 5 MW of the produced electricity is sent to the electricity grid (Suiker Unie, 2019).
PBL – ECN part of TNO |24 – A MIDDEN report
3 Sugar production and
use
This section describes the applications of the main products produced by the sugar factories of Dinteloord and Vierverlaten, and provides an overview of the market prices for these commodities.
3.1 Sugar products
3.1.1 Sugar
The main product consists of different grades of white sugar. The annual production depends strongly on the sugar content of the sugar beets as well as the amount of processed beets and can therefore fluctuate by year. Typically, the sugar content of a Dutch sugar beet is around 14% to 18% (Royal Cosun, 2014b). In 2016, 934 kt sugar was produced (Royal Cosun, 2016).
After producing the raw sugar, the product is further processed to produce several sieve grades of white sugar. The processing happens at the factory in Puttershoek, also owned by Suiker Unie12.
3.1.2 Molasses
It is estimated that around 280 kt molasses was produced in the Netherlands in 2016, assuming a molasses content of 40 kg per tonne of beet (Platform groene grondstoffen, 2006). This thick syrup-like substance is further processed in the Dutch specialty sugar factory in Roosendaal, owned by Suiker Unie. Aside from producing syrups directly for consumers, and vercosine and melado for industrial purposes, part of the produced molasses is fermented or sold as animal feed. As fermented product, molasses is an important product for the alcohol production. Furthermore, it can be utilised to produce yeast (extracts), citric acid, and bio-ethanol (Suiker Unie, 2019).
3.1.3 Betacal
During the process of juice purification, lime is used. After the precipitation step, the lime is removed from the juice and contains many nutrients, forming a product called ‘Betacal’. It is estimated that around 374 kt of Betacal was produced in 2016. Betacal is known as a cheap and fast working lime fertiliser. Betacal improves the pH values of fertile land and soil, and can lead to better structure of the soil (Royal Cosun, 2019).
3.1.4 Beet pulp
Beet pulp is a residual stream from sugar production and is produced when sugar is extracted from the cossettes. The beet pulp that remains is nutritious feed for cattle and pigs. It is available in different levels of sugar content and dryness. If beet pulp is mechanically dewatered it is referred to as pressed pulp and can be directly sold to animals. The pressed beet pulp can also be ensilaged to minimise biological degradation and preserves nutrient, and then later sold as animal feed or used as feedstock for the digester.
When further dried after the mechanically dewatering, using a pulp dryer, the product is called dry pulp. The dry pulp is sold as animal feed.
12 https://www.suikerunie.nl/Locaties
A large portion of the beet pulp is consumed by the cattle industry (825 kt (Thielen, 2018)) wet pulp in 2016 of the total 1.3 Mt wet pulp produced).
3.1.5 Green gas
The biogas produced in the digesters of Suiker Unie is converted into green gas. Suiker Unie sells the green gas to the regional gas grid at 8 bar and to the national gas grid at 40 bar (Suiker Unie, 2014b).
3.2 Commodity prices
Table 11 shows an overview of the commodity prices relevant for the sugar industry.
Table 11: Market prices of sugar production commodities
Market price Unit Source
Sugar beets 32.50–68.80 EUR2018/t Dodde, 2018
Sugar 374–720 EUR2018/t Engwerda, 2018
Rabobank, 2015
Molasses 145–175 EUR2016/t ISO, 2016
Limestone 3–15 EUR2008/t Europe Aggregates
business, 2008
Beet pulp (24% dmc) 23–28 EUR2007/t Instituut, 2007
Sugar beets have a minimum price of EUR 32.50 per tonne of sugar beet (Boerenbusiness.nl, 2015). For the upper limit, we assumed a price of EUR 68.80 per tonne (Boerderij, 2014).
For the sugar price, we assumed a range of EUR 374 to 720 per tonne of sugar, based on (Engwerda, 2018; Rabobank, 2015). It should be noted that the current sugar price of EUR 374 per tonne represents the lowest point since 2006 because of a global sugar surplus. In general, sugar prices can fluctuate strongly (see Figure 5).
The market price for molasses ranges from EUR 145 to 175 per tonne and is coupled to the market price of wheat, soya, barley and other competing substitutes for animal feed (ISO, 2016).
The cost of limestone is difficult to determine. A range of EUR 3 to 15 per tonne of limestone is used based on (Europe Aggregates business, 2008), and cross-checked with the cost of limestone based on a production cost of lime of EUR 70 per tonne of lime, assumed 17% raw material cost in lime production (Ecofys, 2014), and a specific consumption of 1.8 tonnes of limestone per tonne of lime.
For the price of beet pulp, we assumed a range of EUR 23 to 28 per tonne of beet pulp (24% dmc), based on (Instituut, 2007).
PBL – ECN part of TNO |26 – A MIDDEN report Figure 4 Development of sugar prices in the EU and in the world market (EUR/tonne) (Rabobank, 2015)
4 Options for
decarbonisation
This section discusses the identified decarbonisation options for the sugar industry in the
Netherlands. These include further energy efficiency improvements and substitution of natural gas to produce steam and electricity.
4.1 Energy efficiency improvements
In terms of energy efficiency, Suiker Unie has made great progress over the last few decades. In 2010, Suiker Unie published a report that covered the sustainability ambitions and achievements of Suiker Unie (Suiker Unie, 2010). Figure 6 shows the development of the specific energy consumption (MWh/t sugar) of the Dutch sugar production since 1990. By 2010, Suiker Unie had reduced her specific energy consumption by 42% with respect to the reference year 1990. The goal for 2020 to achieve a reduction in specific energy consumption of 50% compared to 1990, was already achieved in 2016 (RVO, 2018a).
Figure 5 Specific energy consumption of Suiker Unie since 1990 (Suiker Unie, 2010) 13
Suiker Unie states that the efficiency plan over 2013–2016 delivered a 12% improvement to the on-site processes. This includes the abandoning of pulp drying. The possibility of supplying waste heat to neighbouring companies is also being considered (RVO, 2018a).
Further energy efficiency improvements
Since, the process of sugar production strongly depends on steam, a logical improvement is lowering of the steam demand. However, considering the continuous efforts in energy efficiency improvements since 199014, there may be only limited potential for reduction of the specific steam
13 It is unclear whether the energy consumption refers to final energy consumption of heat and electricity from the
CHP, or to the total gas consumption. The graph is therefore only to illustrate the relative efficiency gains Suiker Unie had already achieved in 2010 compared to 1990.
14 An example of the continuous investments in energy efficiency is the improvement of the efficiency of the
PBL – ECN part of TNO |28 – A MIDDEN report consumption left. No literature was found about other potential major energy efficiency improvements in sugar production, aside from the use of heat pumps15.
4.1.1 Heat pumps
A heat pump transfers heat from a low temperature source to a higher temperature demand by applying additional power. The ratio heat output to power in is called the CoP (Coefficient of Performance).
Considering the waste heat temperatures and process temperatures, the most suitable heat pump technology for the sugar industry is vapour recompression.
Mechanical vapour recompression (MVR)
MVR is an open heat pump system in which, by means of compression, both pressure and
temperature are increased, together with the corresponding saturation temperature (Klop, 2015).
The application area (temperatures) for mechanical vapour recompression is depicted in Figure 7.
Figure 6 Application area of MVR (ECN, 2017b)
MVR is applied in the dairy industry for evaporation units for temperatures between 50 oC and 120 oC. Centrifugal compressors are used, which are a type of compressor characterised by high capacity (>10 t/h) and low lift. The pressure ratio is typically 1.4 to 1.5 (ECN, 2018).
Suiker Unie is currently testing a thermal vapour recompression unit to reuse the vapour from the evaporation step, thereby resulting in a significant increase in energy efficiency (RVO, 2019).
The unit size of an MVR unit can vary greatly but a typical size is 4 MWth. The thermal power size of an MVR installation can go up to 60 MWth (ECN, 2017b).
15 ECN experts have mentioned that major energy efficiency improvements are potentially possible but would require
Table 12: Characteristics of heat pumps
Characteristics Value Source
Fuel Electricity, waste heat
Emissions
Capacity 0.25–60 MW ECN, 2017b
Efficiency 3.5–10 COP Klop, 2015
Lifetime 10 years Walmsley, et al., 2017
Investment cost EUR2015 1,300 and 3,100 per kWe (for a 43 MWth and 2.6 MWth installation respectively)
Klop, 2015
Maintenance cost 3% of CAPEX ECN, 2017b
4.2 Decarbonisation of energy supply
4.2.1 Hydrogen boiler
Hydrogen can be used as an alternative for natural gas to produce steam in combustion boilers. To be considered a renewable option, the hydrogen (H2) has be produced from electrolysis using renewable electricity (green hydrogen) or from natural gas in combination with CCS to mitigate CO2 emissions (blue hydrogen).
The use of hydrogen in generic industrial boilers appears to be feasible and would only require a retrofit of the burner to accommodate hydrogen gas properties (E4tech, 2014). For 100% use of hydrogen, oxyfuel burners could be used to combust the hydrogen using pure oxygen instead of air to avoid nitrous oxide (NOx) formation. This would also increase the combustion efficiency by 15% compared to conventional natural gas boilers (E4tech, 2015).
The availability of affordable hydrogen produced from renewable electricity (green hydrogen) or hydrogen produced from natural gas in combination with CCS (blue hydrogen), is currently a limiting factor. However, this may change as there are currently over a hundred of hydrogen project initiatives in industry, transportation, built environment and energy sector (Gigler and Weeda, 2018).
PBL – ECN part of TNO |30 – A MIDDEN report Table 13: Characteristics of hydrogen boilers
Characteristics Value Source
Fuel Hydrogen Johansson, 2005
Emissions Water vapour
NOx Johansson, 2005 Capacity 50 to >300 MWth Efficiency 100% (LHV) 85% (HHV) VNP, 2018
Lifetime 15–25 years VNP, 2018; E4tech, 2015
Investment cost EUR2015 110/kWth E4tech, 2015
Maintenance cost EUR 3.5/kWth/yr E4tech, 2015
4.2.2 Biogas boiler
CO2 reduction can be achieved by using biogas instead of natural gas to fire the boilers. This can be done without any impact when mixing only a low amount of biogas with the natural gas used for combustion (Cerna, Kopelentova and Zeeman, 2014). For higher biogas ratios, however, higher maintenance costs are to be expected as unwanted elements can cause the boilers and chimneys to clog. In addition, some biogas elements can cause corrosion of the ceramic coating of natural gas burners due to chemical reactions (Cerna, Kopelentova and Zeeman, 2014).
Suiker Unie already uses part of the biogas produced by their digesters to replace natural gas input for the boiler. Suiker Unie has also recently expanded the capacity of its digesters (Royal Cosun, 2017b). The capacity of Vierverlaten has likely further increased as of 2018, as Suiker Unie planned to install an extra digestion tank (in addition to the four tanks already installed). The extra produced biogas would be used on-site. The additional feedstock demand would be met by using pressed pulp (Suiker Unie, 2017a).
Table 14: Characteristics of biogas boilers
Characteristics Value Source
Fuel Biogas
Emissions CO2 (short cycle)
Capacity 50 to >300 MWth16 IEA, 2010
Efficiency 87%–90% (LHV) Estimation
Lifetime <25 IEA, 2010
Investment cost EUR2015 50/kWth17 Energy Matters, 2015 Maintenance cost EUR 1.5–2.5/kWth/yr Estimation
Alternatively, the use of green gas (biogas gas upgraded to natural gas quality) could be considered. Use of green gas would not have any impact on the boilers compared to the use of natural gas.
16 It is not specified in the available literature what the typical size is for a hydrogen boiler. It is assumed that any
steam boiler of any size can be converted into a hydrogen boiler by retrofitting the burner. Therefore, the size of industrial H2 boilers is assumed to range from 50 to > 300 MWth.
4.2.3 Electric boiler
There are several types of commercially available industrial electric boiler systems18. Most common are:
• Using an electric heating element that acts as a resistance (electric boiler);
• Using the conductive and resistive properties of the water itself to carry electric current (electrode boiler).
Electric boilers and electrode boilers mainly apply to utility-related processes (steam production). The implementation threshold is perceived as relatively low as it does not require a complete redesign of primary processes (Berenschot, Energy Matters, CE Delft, Industrial Energy Experts, 2017). Because of the working principle, electric boilers have lower thermal capacities than electrode boilers. Typical capacities of electric boilers are up to 5 MWe, whereas electrode boilers have a 3–70 MWe capacity.
Saturated steam with temperatures of up to 350 °C and 70 bar can be produced with commercially available electrode boilers (capacities of up to 70 MWe). Advantages of this technology is
(Berenschot, Energy Matters, CE Delft, Industrial Energy Experts, 2017), (Berenschot, CE Delft, ISPT, 2015):
• An efficiency of 95% to 99.9%; • Robust;
• Can be used as flexible capacity.
Note that in order to be considered a decarbonisation option the electricity supply has to come from a renewable source.
Table 15: Characteristics of electric boilers
Characteristics Value Source
Fuel Electricity
Emissions
Capacity 0.4–70 MWe Berenschot, Energy Matters, CE
Delft, Industrial Energy Experts, 2017
Electrical efficiency 95%–99% Thermona, 2010
Lifetime 10–15 years Berenschot, CE Delft, ISPT,
2015; VNP, 2018 Investment costs/CAPEX EUR 150–190/kWe2017
(incl. installation)19
Berenschot, CE Delft, ISPT, 2015
Maintenance costs/OPEX EUR 1.1/kW/yr FOM and EUR 0.5/MWh VOM
Berenschot, Energy Matters, CE Delft, Industrial Energy Experts, 2017
4.3 Other decarbonisation options
4.3.1 Use of waste heat by third parties
Suiker Unie Dinteloord is part of the industrial area ‘Nieuw Prinsenland’, that also hosts various horticultural companies. These companies could potentially reuse the waste heat that leaves the
18 There are also infrared- and induction boilers available, but they are small-scale and not commonly available.
PBL – ECN part of TNO |32 – A MIDDEN report sugar factory in the form of vapour and condensate. Part of this is already used as feed water at the Auberginekwekerij De Jong.
4.3.2 CO
2No opportunities for capture or storage of CO2 from sugar production processes were identified. CCS for this size of production plant (emissions of 0.1 Mt/year) are likely to be economically unattractive. The possibility to combine concentrated CO2 streams from other local industries and the availability of local CCS storage capacity, would require further study.
Suiker Unie is looking into options to reutilise the CO2 from the biodigester (Suiker Unie, 2019). The focus lies on the sugar factory in Dinteloord, which is part of the industrial area Nieuw
Prinsenland, where several horticulture companies could use the additional CO2 in their greenhouses.
5 Discussion
This section discusses the potential of the decarbonisation options to reduce greenhouse gas emissions in the Dutch sugar industry.
5.1 Current greenhouse gas emissions
The annual greenhouse gas emissions from the Dutch sugar industry between 2013 and 2017 varied from 210 to 272 kt CO2eq, depending on, among other things, the annual sugar production and campaign length, and the use of the pulp dryer.
Table 16: Greenhouse gas emissions (tonnes) Suiker Unie 2013–2017 (Dutch Emissions Authority, 2018)
Name Suiker Unie site Emissions 2013 Emissions 2014 Emissions 2015 Emissions 2016 Emissions 2017 Factory at Dinteloord 130,735 135,877 122,872 101,613 121,218 Production location Vierverlaten 102,020 136,101 119,820 108,558 119,301 Total 232,755 271,978 242,692 210,171 240,519
Despite a higher sugar production in 2017 (1,329 kt (Suiker Unie, 2014a)) as compared to 2014 (1.124 kt (Suiker Unie, 2014a)), the total greenhouse gas emission level was lower. The reason for this lowering of the specific greenhouse gas emission (CO2eq/t sugar) is unclear. Potential reasons could be:
• A higher amount of replaced natural gas with biogas from the digesters in 2017; • Less drying of beet pulp in 2017.
5.2 Short term
The main short-term opportunities to decarbonise the sugar industry are electrification (heat pumps, electric boilers) or the substitution of natural gas by biogas.
From an economic point of view, implementation of mechanical vapour recompression (heat pumps) is likely to be more attractive than the implementation of an electric boiler due to the higher energy efficiency (COP of 3 to 10). However, the use of an electric boiler has the significant advantage that it has a lower impact on the production process. Also, electric boilers are a more commonly used and standardised technology, whereas mechanical vapour recompression is not as mature and requires site and process specific adjustments.
Biogas is already used to some degree by Suiker Unie as energy input for the boilers (Suiker Unie, 2017a). An increase of the digester capacity would provide the opportunity to further replace natural gas with biogas, provided there is sufficient local availability of suitable organic materials from other sectors. As the ratio biogas to natural gas going into the boiler increases, the
PBL – ECN part of TNO |34 – A MIDDEN report to clog. Some elements can cause corrosion of the ceramic coating of natural gas burners due to chemical reactions (Cerna, Kopelentova and Zeeman, 2014). This issue could potentially be resolved by upgrading the biogas to green gas before combustion in the boiler, as is currently done to upgrade the biogas for injection into the gas grid, although this would result in efficiency losses. Note that increasing the digesters capacity may also lead to opposition from local residents due to fear of smell.
Substitution of natural gas by hydrogen could in the future become a viable option, provided competitively priced blue (from natural gas in combination with CCS) or green (from renewable electricity) hydrogen becomes available.
Application of these decarbonisation options would not fully abate the CO2 emissions in the Dutch sugar industry, as they do not affect the emissions related to the production of lime (~10% of total CO2 emissions). Further study is needed to identify decarbonisation pathways for the lime production.
References
Backx A. (2012). De duurzaamheid van perspulp.Berenschot, CE Delft and ISPT (2015). Power to products.
Berenschot, Energy Matters, CE Delft and Industrial Energy Experts (2017). Electrification in the Dutch process industry.
Boerderij (2014). Bietenprijs €67,26 per ton [Price of beetroot EUR 67.26 per tonne (in Dutch]]. Boerenbusiness.nl. (2015). Cosun betaalt vanaf 2017 basisprijs van 32,50 euro [From 2017
onwards, Cosun is paying a basic price of EUR 32.50 (in Dutch)].
Cerna K, Kopelentova K and Zeeman M. (2014). Biogas and its energy use. EU Lifelong Learning Programme.
Daniels B, Wemmers AK, Tigchelaar C and Wetzels W. (2011). Restwarmtebenutting. ECN. District Court 's-Hertogenbosch (2015). Uitspraken Rechtspraak, 1000477 [District Court rulings,
1000477]. 's-Hertogenbosch.
Dodde H. (2018). News message. Accessed 2 July 2018.
https://www.nieuweoogst.nu/nieuws/2018/02/07/cosun-betaalt-4562-euro-per-ton-suikerbieten.
Duraisamy R, Berekute AK and Salelgn K. (2017). Production of beet sugar and bio-ethanol from sugar beet and it bagasse.
Dutch Emissions Authority (2018). Emmissiecijfers over 2013-2017 [Emission data on 2013– 2017]. NEa, The Hague.
E4tech (2014). Development of water electrolysis in the European Union.
E4tech (2015). Scenarios for deployment of hydrogen in contributing to meeting carbon budgets and the 2050 target.
ECN (2011). Beschrijving van relevante scenario's op het gebied van landbouw-, milieu-, en klimaatbelid en energieprijzen voor de Voorstudie Routekaart SuikerUnie [relevant policy scenarios on agriculture, environment and climate]. ECN, Amsterdam.
ECN (2017a). Conceptadvies basisbedragen SDE plus 2018 [concept advice on basic rates |SDE plus 2018].
ECN (2017b). Dutch program for the acceleration of sustainable heat management in industry. ECN (2018). Personal communication Anton Wemmers.
Ecofys (2014). A Competitive and Efficient Lime Industry.
EcoWatch (2015). Sugar Beet Leaves Create Vegan Protein Alternative. Energy Matters (2015). Flexibilisering industriele WKK.
Engwerda J. (2018). Suikerprijs in EU keldert verder omlaag [sugar prices plummet further]. https://www.boerderij.nl/Akkerbouw/Nieuws/2018/3/Suikerprijs-in-EU-keldert-verder-omlaag-263481E/.
Eriksson E. (2010). Environmental technology assessment of natural gas compared to biogas. In P. Potocnik, Natural gas (pp. 127-146). INTECH, Croatia.
Europa Nu (2017). The end of the sugar production quotas in the EU. www.europa-nu.nl. Europe Aggregates business (2008). Global crisis hits aggregate prices. Accessed in 2018:
http://www.aggbusiness.com/sections/market-reports/features/global-crisis-hits-aggregate-prices/.
European Commission (2005). BAT in the Food, Drink and Milk Industries. EU, Sevilla.
European Commission (2010). BREF cement, lime and magnesium oxide manufacturing industries. FAO (1999). Agribusiness handbooks sugar beets, white sugar.
Gigler J and Weeda M. (2018). Routekaart Waterstof TKI Nieuw Gas.
Groentennieuws (2013). Duurzaamheidsverslag Agro & Food Cluster Nieuw Prinsenland gepubliceerd.
PBL – ECN part of TNO |36 – A MIDDEN report Haunschild R, Bornman L and Marx W. (2016). Climate Change Research in view of bibliometrics.
PLoS One.
Honiron Manufacturing (2018). A look at sugar production from sugar beets. Honiron Manufacturing: https://www.honiron.com/look-sugar-production-sugar-beets/
Huisman GH. (2009). Haalbaarheid groen gas uit bio-reststromen in Zeeland [feasibility study on bio-waste flows in Zeeland].
IEA (2010). ETSAP Industrial combustion boilers.
Instituut LB. (2007). Wortel- en knol- gewassen als alternatief voor bietenpulp [roots and tuber crops as alternative for beet pulp].
IRS (2018). Info over bieten. Opgehaald van www.irs.nl:
https://www.irs.nl/userfiles/ccmsupload/ccmsdoc/H06suikerproces.pdf. ISO (2016). Quarterly Market Outlook.
Jensen A and Morin B. (2015). Energy and the envirionment in beet sugar production. Johansson K. (2005). Hydrogen as fuel for turbines and engines.
Klenk I, Landquist B and de Imana O. (2012). The product carbon footprint of EU beet sugar. Klop E. (2015). Steaming ahead with MVR.
Latre J, Wambacq E and Van Dijk L. (2014). Basisregels bij het inkuilen [basic rules for ensilaging]. Wageningen University, Wageningen.
Merino Gómez A. (2001). Modelling and simulation of distributed processes: Diffusers in sugar industry. 1st meeting of EcosimPro Useers UNED, pp. 1–10. Madrid.
Merino A, Alves R, Acebes L and Prada C. (2017). Modeling and Simulation of a Beet Pulp Training Simulator. Dryin Technology - An International Journal, 1–55.
Michal Pietzrak MM. (2015). Market Delimitation on the Exapmle of the Sugar Sector. Problems of Agricultural Economics, 119–140.
Omroep Brabant (2018). Kassen gebruiken restwater van de suikerfabriek: 'De aubergines groeien er prima op' [greenhouses use waste water from the suger factory]. Dinteloord, Braant.
Persson M, Jönsson O and Wellinger A. (2006). Biogas upgrading to vehicle fuel standards and grid injection. IEA Bioenregy.
Pesta G. (2007). Anaerobic Digestion of Organic Residues and Wastes. In O. V., & R. W., Utilization of by-products and treatment of waste in the food industry, pp. 53–72. Springer. Piringer H. (2017). Lime Shaft Kilns. Energy Procedia, pp. 75–95.
Platform groene grondstoffen (2006). Biomass in the Dutch Energy Infrastructure in 2030. Processinnovation.nl (2016). Persen, drogen of vergisten [pressing, drying or fermenting]. Rabobank (2015). Thema update suiker [theme sugar update].
Royal Cosun (2014a). Betacal - de beste kalkmeststof voor uw bedrijf [the best lime fertiliser for uw business].
Royal Cosun (2014b). Sugar Production: the Dutch approach. Norfolk Farming Conference. Royal Cosun (2016). Jaarverslag 2016 [annual report 2016].
Royal Cosun (2017a). Cosun in 2017 hoger resultaat, betere bietenprijs [better result, better beetroot prices 2017].
Royal Cosun (2017b). Jaarverslag 2017 [annual report 2017]. Royal Cosun (2019). Betacal. https://www.cosunleden.nl/betacal.
RVO (2009) Proceswater van suikerfabriek levert biogas [biogas from process water from sugar factory].
RVO (2018a) Resultatenbrochure convenanten [brochure of results from covenants].
RVO (2018b) Stimulering Duurzame Energieproductie [stimulating sustainable energy production]. www.rvo.nl: https://www.rvo.nl/subsidies-regelingen/stimulering-duurzame-energieproductie. RVO (2018c). The Netherlands list of fuels.
RVO (2019). Energiebesparing in industriele productieprocessen door flexibele inzet van thermische damprecompressie.
Schrik Y, Van den Akker J, Mulder M, Van Lange K, Van Hees M, Oskam I and Van Kasteren H. (2017). Decentrale organische reststroomverwerking [local organic waste flow processing]. Hogeschool van Amsterdam.
Simoglou A, Georgieva P, Martin E, Morris A and Feyo de Azevedo S. (2005, May 15). On-line monitoring of a sugar crystallization process. Computers & Chemical Engineering , pp. 1411– 1422.
SKIL (2018). Sugar Knowledge International. http://www.sucrose.com/.
Smejkal Q, Bagherzadeh A and Schick R. (2008). Influence of reduced temperatures in evaporation and crystallisation on the sugar quality and energy consumption in sugar production.
Smit A and Janssens S. (2016). Reststromen suikerketen. Südzucker (2018). The Südkzucker Group Profile 2018.
Suiker Unie (2010). Duurzaamheidsverslag 2010 [sustainability report 2010]. Nederland: Suiker Unie.
Suiker Unie (2014a). Duurzaamheidverslag 2014 [sustainability report 2014]. Suiker Unie (2014b). Suiker Unie Green Energy. pp. 1–32. Suiker Unie. Suiker Unie (2016). Suiker Unie wint EZ Energy Award 2016.
Suiker Unie (2017a). Heiwerkzaamheden Biovergister [pile driving Bio-gas digester]. Suiker Unie (2017b). Suiker Unie produceert 100 miljoenste kuub Groen Gas [Suiker Unie
procudes the 100,000,000th cubic metre of green gas].
Suiker Unie (2018a). Geschiedenis van Suiker Unie [Suiker Unie’s history]. https://www.suikerunie.nl/Geschiedenis.
Suiker Unie (2018b). Groen Gas productie [green gas production].
https://www.suikerunie.nl/Duurzaamheid/Environmental-sustainability/Groen-gas-productie. Suiker Unie (2018c). Stimuleer WKKs [stimulate WKKs].
https://www.suikerunie.nl/Duurzaamheid/Plant-and-Planet/Klimaat---Energie/Energiebesparing/Suiker-Unie-in-gesprek-met-Ad-Backx,-Manager-Milie.aspx Suiker Unie (2019). Werken bij Suiker Unie [working for the Suiker Unie].
https://www.suikerunie.nl/Werken-bij-Suiker-Unie.
Thermona (2010). Operation and maintenance manual for electric boilers.
Thielen W. (2018). Rundveehouderij neemt steeds meer bietenpulp af [cattle husbandry uses increasingly more beetroot pulp].
USDOE (2016). CHP Steam Turbine.
Van Dam P. (2014). Snijmolen assistent. pp. 1–17. Axions, Suiker Unie. Van der Veen A. (2014). Information digester.
Varelius E. (2014). Optimizing the reaction efficiency of carbon dioxide in a sugar refinery carbonatation process.
VNP (2018). Decarbonising the steam supply of the Dutch paper and board industry.
Walmsley TG, Atkins MJ, Ong BH, Klemeš JJ, Walmsley MR and Varbanov PS. (2017). Total site heat integration of multi-effect evaporators with vapour recompression for older kraft mills. Chemical engineering transactions, 61, 265–270. Accessed on 18 March 2019, at