D.P.J. Swart | M.C. van Zanten | W.A.J. van Pul
National Insitute for Public Health and the Environment
Ammonia exchange measurements over
a corn field in Lelystad, the Netherlands
in 2009
Colofon
© RIVM 2010
Parts of this publication may be reproduced, provided acknowledgement is given to the 'National Institute for Public Health and the Environment', along with the title and year of publication.
R.J. Wichink Kruit
H. Volten
M. Haaima
D.P.J. Swart
M.C. van Zanten
W.A.J. van Pul
Contact:
H. Volten
Centre for Environmental Monitoring (CMM)
hester.volten@rivm.nl
This investigation has been performed by order and for the account of the Ministry of Housing, Spatial Planning and the Environment (VROM), within the framework of Project Ammonia
Abstract
Ammonia exchange measurements over a corn field in Lelystad, the Netherlands in 2009
In the Netherlands, ammonia is present in the atmosphere mainly (90%) due to agricultural emission. The emissions are registered and reported as the official emission numbers in the Emission Inventory. From the analysis and
interpretation of the ammonia gap it appeared that some emission sources are still missing (Van Pul et al., 2008). One of these is the emission by agricultural crops that takes place mainly at higher temperatures and during senescence (ripening) of the crop. However, the uncertainty in these emissions is rather high.
Here, we report ammonia exchange values (fluxes) that were measured over a green (fodder) corn field in Lelystad, the Netherlands, in 2009. Owing to circumstances (theft of computers halfway the measurement campaign) a substantial amount of relevant data was lost. Therefore, in this report we mainly explain and record the techniques used, and we interpret the remaining data. The results show that the measurements of the two DOAS systems (Differential Optical Absorption Spectroscopy) are sufficiently accurate and stable to measure the exchange of ammonia with the surface.
The ammonia exchange measurements over the corn field in Lelystad have shown that the corn generally absorbs ammonia during nighttime. The corn canopy and the bare soil can emit ammonia, especially during warm and sunny days in the growth season. Emissions due to senescence could not be
distinguished, probably because of loss of data in a crucial episode of the campaign due to the theft of equipment, and because the corn was harvested early, before the ripening took place.
Keywords:
Rapport in het kort
Ammoniakuitwisselingsmetingen boven een snijmaïsveld in Lelystad, Nederland in 2009
Ammoniak in de buitenlucht is in Nederland voor het merendeel (90%)
afkomstig van agrarische activiteiten. De emissies worden in beeld gebracht en gerapporteerd als de officiële emissiecijfers onder regie van de
EmissieRegistratie. Uit de analyse en duiding van het ammoniakgat is naar voren gekomen dat er nog ontbrekende emissieposten bestaan (Van Pul et al., 2008). Een van die posten is de emissie van landbouwgewassen die
voornamelijk plaatsvindt bij hogere temperaturen en tijdens het afrijpen
(afsterven) van het gewas. De onzekerheid in deze emissies is echter vrij groot. In dit rapport wordt verslag gedaan van emissiemetingen van ammoniak boven een snijmaïsveld in Lelystad in 2009. Door omstandigheden (diefstal van computers halverwege de meetperiode) is een groot deel van de relevante metingen verloren gegaan. In dit rapport wordt daarom voornamelijk de gebruikte techniek uitgelegd en vastgelegd en een interpretatie van de overgebleven metingen gegeven.
De resultaten laten zien dat de metingen met de twee DOAS-systemen (Differentiële Optische Absorptie Spectroscopie) nauwkeurig en stabiel genoeg zijn om de uitwisseling van ammoniak aan het oppervlak te kunnen meten. De ammoniakuitwisselingsmetingen boven het snijmaïsveld in Lelystad laten zien dat de snijmaïsplanten over het algemeen ’s nachts ammoniak opnemen. De snijmaïsplanten en de kale grond stoten ook ammoniak uit, vooral op warme en zonnige dagen tijdens de groeiperiode. Er zijn echter nauwelijks
afrijpingsemissies waargenomen, waarschijnlijk omdat de metingen in de daarvoor interessante periode verloren zijn gegaan door de inbraak en omdat het gewas relatief vroeg is geoogst, waardoor het afrijpingsproces nog niet begonnen was.
Trefwoorden:
Contents
Managementsamenvatting—6 Summary—8
1 Introduction—11
2 Site description and instrumentation—13
2.1 Site description—13
2.2 Ammonia flux instrumentation—14 2.3 Meteorological instrumentation—16 2.4 Flux calculations—17
2.5 Calibration of the DOAS system—18
3 Overview of the NH3 flux measurements—21
3.1 General overview measurement campaign—21 3.2 Growth period—24
3.3 Bare soil—28
3.4 Measured fluxes compared with modelled fluxes—32
4 Conclusion and Recommendations—36
References—38
Managementsamenvatting
Achtergrond
Ammoniak in de buitenlucht is in Nederland voor het merendeel (90%)
afkomstig van agrarische activiteiten. Ammoniak komt vrij bij verdamping uit de mest in stallen, bij beweiding en bij het uitrijden van mest op gras- en
bouwland. Ook uit kunstmest verdampt nog een deel ammoniak. Al deze emissies worden in beeld gebracht en gerapporteerd als de officiële
emissiecijfers onder regie van de EmissieRegistratie. Uit de analyse en duiding van het ammoniakgat is naar voren gekomen dat er nog ontbrekende
emissieposten bestaan (Van Pul et al., 2008). Een van die posten is de emissie van landbouwgewassen die voornamelijk plaatsvindt bij hogere temperaturen en tijdens het afrijpen (afsterven) van het gewas. Op basis van literatuurgegevens is een schatting van deze emissies gemaakt, die nationaal uitkomt op 5 kton per jaar. Dit bedraagt ongeveer 4% van de huidige ammoniakemissies. De
onzekerheid in dit cijfer is echter vrij groot. De huidige ammoniakemissies worden geraamd op 130 kton en liggen daarmee net boven de afgesproken EU-doelen vanuit de National Emission Ceiling Directive (NECD). De relevantie van de extra emissieposten is dan ook dat ze het halen van de emissiedoelen uit de NECD bemoeilijken. Vandaar dat een goede kwantificering van deze posten belangrijk is. Dit is de reden dat vanuit I&M/DGM opdracht gegeven is aan RIVM en PRI om de ammoniakemissies van gewassen beter in beeld te brengen. In dit rapport wordt verslag gedaan van de metingen van ammoniak die door RIVM verricht zijn boven een snijmaïsveld.
Doel van het onderzoek en rapport
In de zomer van 2009 zijn metingen verricht boven een snijmaïsveld in Lelystad. Deze metingen worden gebruikt om te bepalen of snijmaïs ammoniak aan de lucht afgeeft tijdens warme, droge periodes en aan het einde van het
groeiseizoen ten gevolge van de afrijping (of afsterving) van het gewas, ook wel afrijpingsemissie genoemd.
Door omstandigheden (diefstal van computers halverwege de meetperiode) is een groot deel van de relevante metingen verloren gegaan. In dit rapport wordt daarom voornamelijk de gebruikte techniek uitgelegd en vastgelegd en een interpretatie van de overgebleven metingen gegeven.
Werkwijze
Om de emissie van ammoniak van landbouwgewassen te meten is een meetsysteem ontwikkeld dat gebaseerd is op twee DOAS-systemen (Differentiële Optische Absorptie Spectroscopie). Deze systemen meten de ammoniakconcentraties in de lucht op twee hoogtes door middel van
lichtabsorptie in een specifiek golflengtebereik over een pad van ongeveer 50 m. De concentratieverschillen tussen beide hoogtes zijn gecombineerd met
turbulentiemetingen (door middel van de aerodynamische gradiënt methode (AGM)) om de uitwisseling van ammoniak met het oppervlak te bepalen. Behalve turbulentie- en concentratiemetingen zijn aanvullende meteorologische gegevens verzameld voor de interpretatie van de metingen, zoals kort- en langgolvige straling, temperatuur, relatieve vochtigheid en druk. De
meetperiode bestreek de periode van groei van de maïs waarbij het gewas de bodem niet geheel bedekte tot en met de oogst van de maïs en de metingen die daarna boven kale grond zijn uitgevoerd. Door de diefstal van de computers zijn vier weken aan meettijd in de periode augustus-september verloren gegaan.
Resultaten
De resultaten laten zien dat de metingen nauwkeurig en stabiel genoeg zijn om de uitwisseling van ammoniak met het oppervlak te kunnen meten. De
onzekerheid in een seizoensgemiddelde meting is ca. 30%. De fluxmetingen boven het snijmaïsveld in Lelystad laten zien dat de snijmaïsplanten over het algemeen ’s nachts ammoniak opnemen. De snijmaïsplanten en de kale grond stoten ook ammoniak uit. Dit gebeurde vooral op warme en zonnige dagen tijdens de groeiperiode. Er zijn echter nauwelijks afrijpingsemissies
waargenomen, waarschijnlijk omdat de metingen in de interessante periode verloren zijn gegaan door de inbraak en omdat het gewas relatief vroeg is geoogst, waardoor het afrijpingsproces nog niet begonnen was.
Summary
Context
In the Netherlands, ammonia is present in the atmosphere mainly (90%) due to agricultural emission.
Ammonia is released during the storage of slurry and manure in or near livestock houses and during the land spreading of slurries. Also artificial fertilizers may release ammonia. The emissions are registered and reported as the official emission numbers in the Emission Inventory. From the analysis and interpretation of the so-called ammonia gap (Van Pul et al., 2008) it appeared that more emission sources exist. One of these sources is the emission by agricultural crops that primarily takes place at higher temperatures and during senescence (ripening) of the crop. Based on literature data an estimate has been made of these emissions. On a national scale this amounts to 5 kton per year, about 4% of the current ammonia emissions. The uncertainty in this number is, however, rather large. The current ammonia emissions are estimated at 130 kton, which is just above the EU-targets in the National Emission Ceiling Directive (NECD). The relevance of the extra emission sources is that they complicate reaching the emission targets of the NECD. Therefore, a good quantification of the emission sources is important. For this reason I&M/DGM have asked RIVM and PRI to investigate potential ammonia emissions of
agricultural crops. Here, we report ammonia exchange values (fluxes) that were measured over a green (fodder) corn field.
Goal of the research and report
In the summer of 2009 we have performed ammonia exchange measurements over a corn field in Lelystad, the Netherlands. These measurements are used to determine whether corn emits ammonia, e.g. during warm and dry episodes or at the end of the growing season due to senescence of the plants.
Owing to circumstances (theft of computers halfway the measurement campaign) a substantial amount of relevant data was lost. Therefore, in this report we mainly explain and record the techniques used, and we interpret the remaining data.
Method
In order to be able to perform ammonia exchange measurements, a measurement system has been developed based on two DOAS (Differential Optical Absorption Spectroscopy) systems. These systems measure ammonia concentrations in air at two altitudes, using light absorption in a specific wavelength range over a path length of about 50 m. The concentration differences between both altitudes combined with turbulence measurements (using the aerodynamic gradient method (AGM)) determine the exchange of ammonia with the surface. In addition to turbulence and concentration
measurements, ancillary meteorological data were recorded in order to be able to interpret the exchange measurements, such as short-wave and long-wave radiation, temperature, relative humidity and pressure. The measurement campaign covered the growth period of the corn with the plants not completely covering the canopy until the harvest of the corn and continued with bare soil measurements. Due to the theft of the computers four weeks of measurement time were lost in August and September.
Results
The results show that the measurements are sufficiently accurate and stable in order to determine the exchange of ammonia with the surface. The uncertainty
in a season-averaged value is about 30%. The ammonia exchange
measurements over the corn field in Lelystad show that the corn generally absorbs ammonia during nighttime. The corn canopy and the bare soil also emit ammonia, especially during warm and sunny days in the growth season.
Emissions due to senescence could not be distinguished, probably because of loss of data in a crucial episode of the campaign due to the theft of equipment, and because the corn was harvested early, before the ripening took place.
1
Introduction
Ammonia is present in the atmosphere mainly due to agricultural emission, which covers approximately 90% of the total anthropogenic ammonia emission. Agricultural emission primarily occurs during the storage of slurry and manure in or near livestock houses (50%) and during the land spreading of slurries (33%). About 10% of the emission comes from artificial fertilizer application and the remaining 7% is emitted during grazing of cattle (Milieu- en Natuurcompendium, 2008). All these emissions are included in the official emission inventory. From the analysis and interpretation of the so-called ammonia gap (Van Pul et al., 2008) it appeared that more emission sources exist. The ammonia concentration in the atmosphere also depends on the amount of ammonia that is exchanged between the atmosphere and the surface, i.e. vegetation, water or soil. In particular, ammonia can be emitted by natural and agricultural vegetation, especially during warm and dry periods (Wichink Kruit et al., 2007; Van Pul et al., 2008). The emission of ammonia by the vegetation can be caused by different sources:
- the soil underneath the vegetation, including leaf litter - the stomata, i.e. an internal plant concentration;
- the external leaf surface, i.e., others than through the stomata; - the senescence of crops.
The first source is difficult to quantify, as produced ammonia in or at the soil surface might be recaptured by the overlying vegetation, resulting in a
decreasing ammonia concentration with height within the vegetation. However, the net flux above the canopy is not shown to be significantly influenced by this in-canopy concentration gradient (Denmead et al., 1976; Nemitz et al., 2000). After harvesting, also ammonia emissions may occur from decomposition of plant material that is left on the field. De Ruijter et al., 2010, estimated that this could amount up to 3 million kg of ammonia in the Netherlands, which is 2-3% of the national agricultural emissions.
The second source is the internal plant concentration, also known as
compensation point (Farquhar et al., 1980). The compensation point is rather well investigated for many different types of vegetation, although the methods to determine the compensation point differ and lead to different results. Most studies concern agricultural crops (Husted and Schjoerring, 1996; Mattsson et al., 1997; Loubet et al., 2002; Wichink Kruit et al., 2007; Burkhardt et al., 2009), but some also concern natural vegetation (Wyers and Erisman, 1998; Flechard and Fowler, 1998; Milford et al., 2001b; Nemitz et al., 2004; Neirynck and Ceulemans, 2008).
Generally, the external leaf surface is assumed to be an effective sink for ammonia (Van Hove et al., 1988; Benner et al., 1992; Wyers et al., 1993; Sutton and Fowler, 1993; Erisman et al., 1994b; Sutton et al., 1995b). However, in more polluted areas, the external leaf surface seems to be a less effective sink (Sutton et al., 1997; Wyers and Erisman; 1998; Flechard et al., 1999; Wichink Kruit et al., 2010). This has resulted in many different
parameterizations describing this process.
Very little is known about senescence of plants as a source of ammonia, but measurements over oilseed rape, wheat, barley and pea carried out in Denmark
indicate that the amounts (in the order of 1-5 kg NH3 ha-1) may be considerable
(Schjoerring en Mattsson, 2001). If these measurements are valid for the Netherlands, this would mean an extra emission of 5 million kg of ammonia on a national basis (Van Pul et al., 2008). In order to check this number, a
measurements program was started. About 30% of crops grown in the Netherlands consist of corn. Therefore, it was decided to carry out flux measurements above a corn field in Lelystad. A novel ammonia flux
measurement system was used based on the Differential Optical Absorption Spectroscopy (DOAS) technique. The measurements started in June 2009 when the corn started to germinate, and finished some weeks after the crops were harvested.
The objectives of this research are:
- to get insight into the ammonia exchange between the corn canopy and the atmosphere focusing on the effect of senescence of the corn canopy; - to get insight into the ammonia exchange between bare soil and the
atmosphere;
- to show that the ammonia flux measurement system based on the DOAS technique is accurate and stable enough to measure NH3 exchange in an
operational way;
- to compare measured exchange fluxes with modelled fluxes. For this modelling, new parameterizations (Wichink Kruit et al., 2010), which have been implemented in the updated DEPAC module (Van Zanten et al., 2010), are used.
2
Site description and instrumentation
2.1 Site description
The reported NH3 flux measurements are calculated from concentration profiles
measured above a corn field in Lelystad opposite Runderweg 5, in the
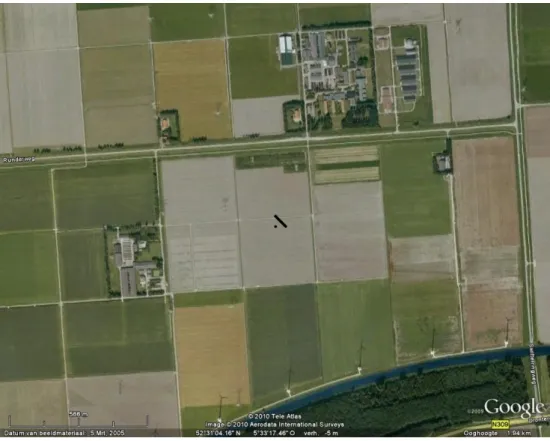
Netherlands. The exact location of the site is 52o31'05''N and 5○33'18''E. Figure
1 shows an aerial overview of the site and its surroundings. The black line shows the location of the ammonia flux instrumentation. The black dot shows the location of the meteorological observations. The average elevation of the measurement site is 5m below mean sea level.
Figure 1. Aerial overview of the measurement site and its direct surroundings
The black line shows the location of the ammonia flux instrumentation. The black dot shows the
location of the meteorological observations.The farm shown to the west was demolished, except
for the (closed) manure storage containers.
The selected measurement site had to fulfil a number of requirements apart from being a corn field with large enough proportions. This site has dimensions of about 275 x 300 m. Another requirement is the absence of other ammonia sources. In this site in the near surroundings few animals were kept, but there is a small farm located 700 m to the north-northeast. The farm shown on Figure 1 to the west was demolished, except for the (closed) manure storage containers. The measurements performed in the direction of the farm to the north-northeast were excluded from the final results. The orientation of the instrumentation was chosen such that for the most prevailing winds, from the southwest, the fetch was clear from obstacles and ammonia sources. Monteith and Unsworth (1990) proposed a typical ratio between measurement height and fetch of 1:100 (for
short vegetation). In neutral conditions, the fetch for a measurement height of 4 m should then be at least 400 m. In stable conditions the required fetch, in principle, should be larger, and in unstable conditions it reduces to smaller distances. In general, the fetch over the corn field in the wind directions between 85 (roughly east) and 265 (roughly west) degrees north are large enough to let the measured fluxes be representative for corn.
2.2 Ammonia flux instrumentation
In order to be able to determine the amount of ammonia deposited on or emitted by corn, ammonia concentrations in air need to be determined at at least two heights with high precision and a good stability. The measurements discussed in this report were performed at a height of about 5 m and at a height of roughly 50 cm above the corn. The ammonia concentrations were measured with two DOAS systems developed at the RIVM (see for a more detailed
description Volten et al., 2010). The Differential Optical Absorption Spectroscopy (DOAS) principle is based on open path measurements. Ammonia concentrations are determined over an open path of about 50 m between a telescope and a retroreflector. The telescope directs the UV and visual light produced by a Xe-lamp towards the retroreflector that reflects the light back to the telescope (see Figure 2). Thus, the total path length over which is measured is 100 m.
Figure 2. Schematic overview of a DOAS deposition system
Subsequently, the known spectrum of the Xe-lamp, i.e. the reference spectrum, is compared with the spectrum of the light that travelled over the open path. By relating the differences between the two normalized spectra to the known absorption lines of ammonia, the ammonia concentration in the air can be retrieved. The DOAS systems are placed in the field in two containers placed on top of each other (see Figure 3). Each container has a number of windows and is equipped with a movable optical table in order to easily adjust the height of the DOAS system. As the corn grows, the height of the lowest systems is adapted to the height of the corn; the height of the lowest retroreflector (see Figure 4) is adapted accordingly.
telescope
0851
0851
Height 5 m, length 50 m
Variable height; 0.5 m above plants
Concentration measurements are obtained by averaging spectra over 5-minute intervals. These 5-minute values typically have a standard deviation of 0.15 µg/m3. The times of both DOAS systems are synchronized by a DCF77 clock.
Each half hour the DOAS instruments enter an automatic alignment mode in order to optimize the signal.
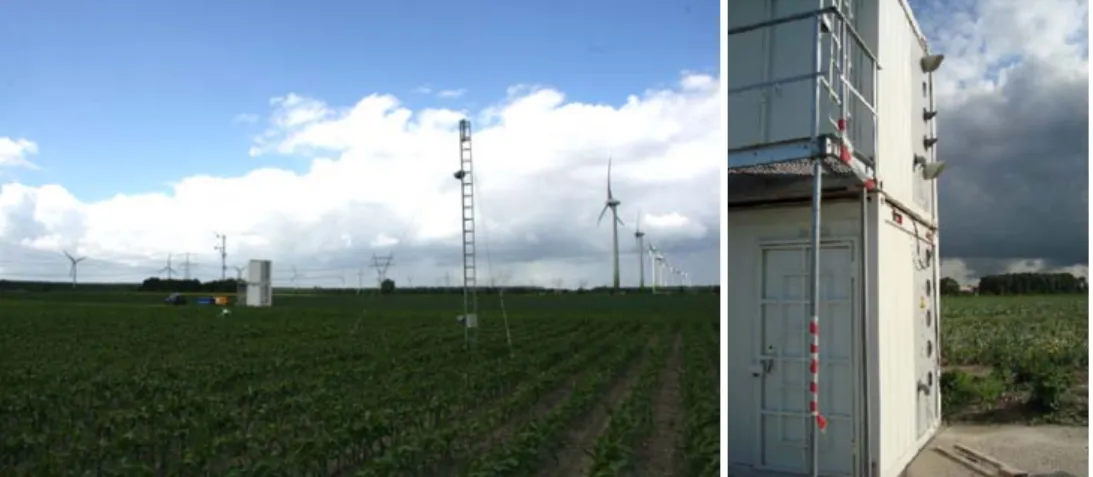
Figure 3. The DOAS systems placed in the field
The DOAS systems are placed in two portacabins placed on top of each other. As the corn grows, the
height of the lowest system is adapted to the corn height.
Figure 4. The retroreflectors of the DOAS systems
To the left of the picture, the mast with the retroreflectors of the DOAS systems is visible.
Atmospheric turbulence is measured with a sonic anemometer on top of the mast on the right side of the picture. In addition, meteorological variables like temperature, relative humidity, pressure and radiation are measured with a meteorological weather station in the right mast.
The height of the corn canopy was measured several times during the measurement campaign and is represented by the blue dots in Figure 5. The figure also shows the modelled height of the corn canopy (green line) and the 2 measurement heights (red and black line). The low measurement path is adapted to the height of the canopy. On 21 September (day of year 264), the equipment was removed from the field for the harvest of the corn and the subsequent tillage of the field. On 30 September, the equipment was returned to the field to continue the flux measurements over bare soil.
Figure 5. Growth of the corn canopy
Height of the corn canopy (measured = blue dots; modelled = green line) and the heights of the DOAS instruments (red = high path; black = low path)
2.3 Meteorological instrumentation
A micrometeorological weather station was placed in the corn field
approximately halfway between the DOAS flat and the retroreflector tower mast (see Figure 1 and Figure 4). The weather station mast was equipped with a 3-D sonic anemometer (Campbell Scientific CSAT3) that measured turbulence with a frequency of 20 Hz at a height of 4.7 m. From the turbulence measurements 30-minute averages of the friction velocity, sensible heat flux and Obukhov length were calculated. These variables are needed in the flux calculation (see section 2.4). Wind speed and wind direction were also derived from the turbulence measurements and were logged once every minute.
In addition, other meteorological variables were measured to support the interpretation of the flux measurements:
- temperature and relative humidity (Campbell Scientific Model CS215 in a 41303-5A radiation shield);
- barometric pressure (Campbell Scientific Model CS100);
- short wave (Qs), long wave (Ql), and net (Qnet) radiation (Campbell
These meteorological variables are logged as 1-minute averages. All
meteorological variables are finally converted to 30-minute averages to support the evaluation of the ammonia flux.
2.4 Flux calculations
At present, no operational fast response sensor for ammonia exists. As a consequence, the ammonia fluctuations, χ', cannot be measured and the ammonia flux, Fχ
w' χ' , can not be derived directly with the eddy covariance method.Therefore, we have to rely on a commonly used method to derive the ammonia flux: the gradient or flux-profile technique (see Wichink Kruit et al., 2009, for a detailed description). In brief, this method relates the flux of ammonia to the vertical gradient of ammonia analogous to the description of molecular diffusion by Fick's law:
z
F
K
(1)where ∂χ/∂z is the concentration gradient, i.e. the concentration difference, ∂χ, over a height difference, ∂z, and Kχ is the eddy diffusion coefficient for
ammonia. Kχ is a property of the flow and depends largely on turbulence in that
flow. The eddy diffusion coefficient for ammonia can be written as:
z
ku
K
(2)where k is the von Karman's constant (=0.4), u* is the friction velocity, z is the
height and Φχ(ζ) is the flux-profile relationship (or stability function) for
ammonia (Dyer and Hicks, 1970; Businger et al., 1971; Webb et al., 1980). The dimensionless flux-profile relationship Φχ is a function of the atmospheric
stability parameter ζ = z/L, where L is the Obukhov length scale defined by:
'
'
3T
w
u
kg
T
L
(3)where T is the air temperature, g is the gravitational acceleration and
w
'T
'
is the sensible heat flux.By integrating equation (1), the following formulation for the ammonia flux is obtained:
L
z
L
z
z
z
z
z
ku
F
1 2 1 2 1 2ln
(4)where ψχ(ζ) is the integrated stability function for ammonia; z1 and z2 are the
measurement heights. In this report we use the integrated stability functions of Paulson (1970) and Dyer (1974) for unstable conditions (i.e. L < 0) and the integrated stability functions of Beljaars and Holtslag (1991) for stable conditions (i.e. L > 0).
We obtained u* (and L) directly from eddy covariance measurements using a
sonic anemometer. The vertical concentration gradients are measured by the DOAS gradient system.
L
z
L
z
z
z
z
z
ku
F
1 2 1 2 1 2ln
(5)Deposition velocities can be derived from the measured fluxes by dividing the measured ammonia flux by the (calculated) ammonia concentration at reference height (z-d = 1 m): ref ref d
F
v
, (6)where vd,ref is the deposition velocity at reference height, Fχ is the ammonia flux
and χref is the concentration at reference height.
This deposition velocity is restricted by the maximum deposition velocity that is determined by the amount of turbulence in the atmosphere. The maximum deposition velocity at reference height can be calculated from the friction velocity (squared) and the wind speed at reference height:
ref d,max
u
u
v
2 *
(7)2.5 Calibration of the DOAS system
In order to be able to determine ammonia fluxes, the concentration measurements of the DOAS systems have to be accurate, and systematic differences between the high and low DOAS systems have to be accounted for. Therefore the DOAS systems were calibrated by placing them at the same height next to each other in the laboratory in Bilthoven. These measurements at the same height were carried out over an open path of about 50 m through the windows in the laboratory wall. The measurements took place from the end of April until the end of May 2009, i.e. before the measurement campaign. The concentration measurements of the high and low DOAS systems are shown in Figure 6. The correlation between both instruments is very good (R2=0.99). In
relatively clean conditions, i.e., concentrations smaller than about 5 µg m-3, the
high DOAS system appears to be smaller than the low DOAS system, while for higher concentrations the opposite seems to be true. This is also shown in the scatter plot between the two instruments in Figure 7. The differences between the two instruments are quantified and results of a linear fit are used to correct the data.
Our intention was to perform a similar calibration measurement during the campaign, a so called ‘cross measurement’. During a cross measurement the two DOAS systems are checked relative to each other by directing their light beams towards the retroreflector of the other system; i.e. the upper DOAS uses the lower retroreflector and vice versa, thus crossing the light paths. If the ammonia concentration fields are homogeneous in the horizontal direction, the two DOAS systems should produce the same concentration values.
Unfortunately, the cross measurement performed in mid-campaign was lost due to the theft of laptops.
-2 0 2 4 6 8 10 12 14 16 18 2009/04/18 00:00 2009/04/25 00:00 2009/05/02 00:00 2009/05/09 00:00 2009/05/16 00:00 2009/05/23 00:00 2009/05/30 00:00 time [UTC] NH 3 con cen tra ti on [µ g m -3] DOAS high DOAS low
Figure 6. Calibration measurements for the high and low DOAS systems
In order to perform calibration measurements, both systems were placed at the same height next to each other. y = 1.0400x - 0.2365 R2 = 0.9958 -2 0 2 4 6 8 10 12 14 16 -2 0 2 4 6 8 10 12 14 16
NH3 concentration DOAS low [µg m-3]
NH 3 con cent ratio n DO AS h igh [ µ g m -3]
3
Overview of the NH
3flux measurements
3.1 General overview measurement campaign
In this section, an overview of the available concentration and flux
measurements is given. Table 1 shows the different periods in the measurement campaign. The calibration measurements were obtained in the laboratory in April and May 2009. The flux measurement started in July. On 26 August we had to deal with the theft of two laptops in the DOAS containers and two weeks of data were lost. Unfortunately, this included the mid-campaign calibration
measurements (cross measurements of the two systems). About two weeks after the theft, the measurements were resumed and they continued until the end of September when the retroreflector mast and the meteomast had to be removed from the field for the harvesting of the corn. Since the green corn was of a so called early type, the harvesting of the corn took place at a relatively early date. The masts were placed back into the field after the harvest and turnover of the soil. The flux measurements over bare soil were continued until the end of October 2009.
Table 1 Overview of the total measurement period
Agenda Start DOY End DOY
Calibration measurements in the laboratory
24-04-2009 114 31-05-2009 151 Flux measurements over corn in
Lelystad
03-07-2009 184 14-08-2009 226 Calibration measurements in
Lelystad (cross measurements)
14-08-2009 226 26-08-2009 238 Theft of the laptops (data lost
from 14-08-2009 on)
26-08-2009 238 Flux measurements over corn in
Lelystad continued
16-09-2009 259 21-09-2009 264 Harvest and turnover of the soil 23-09-2009 266
Flux measurements over bare soil in Lelystad
30-09-2009 273 24-10-2009 297
The overall data coverage during the flux measurement periods mentioned in Table 1 amounts to a total of 2550 half-hourly measurements and is calculated on basis of the available concentration gradients and the turbulence
measurements in the period between 03-07-2009 (DOY 184) and 24-10-2009 (DOY 297), excluding the theft and harvest period.
In order to select the reliable ammonia fluxes, a selection from the half-hourly data was made based on several quality and selection criteria (see also Wichink Kruit et al., 2009). The percentage of total rejected data (in parenthesis) of these 2550 half-hourly measurements is given per additional criteria.
Standard deviation errors in the concentration measurements should be smaller than 0.3 µg m-3 for concentrations ≤ 20 μg m-3 and smaller than
1.5% for concentrations >20 μg m-3 (13.7%). This selection criterion is
used to remove data with a weak signal of the DOAS systems due to fog, a condensed retroreflector or other reasons, that result in large standard deviation errors.
The wind direction should be between 85 (east) and 265 degrees (west) in order to measure fluxes over the corn canopy (50.8%).
The concentrations should be larger than 0.1 μg m-3 (51.5%).
The deposition velocity must be smaller than the maximum deposition velocity (77.5%).
The final number of half-hourly measurements after applying these criteria is 573 (or 22.5% of the available fluxes). This means that, out of the available 2550 half-hourly measurements, 573 are used for further analysis.
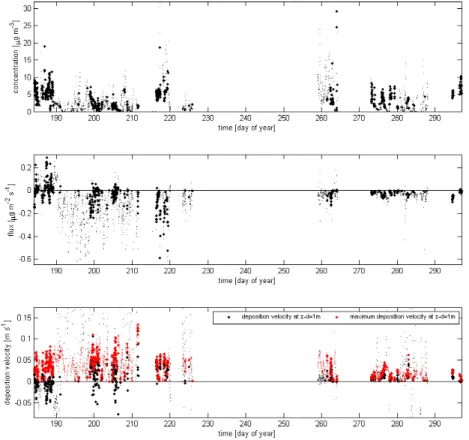
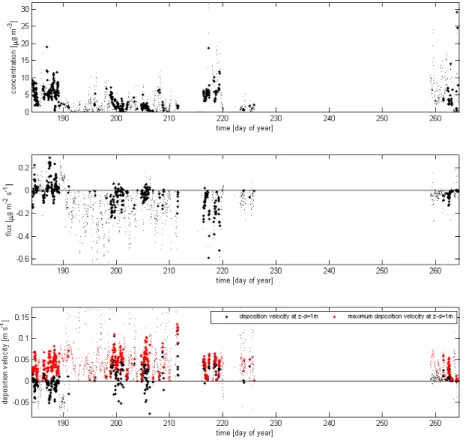
In Figure 8, ammonia concentration measurements, ammonia fluxes and deposition velocities are shown for the entire field campaign demonstrating the high uptime of the two DOAS instruments. The small dots represent
observations that satisfy the first criterion (small enough errors in the
concentration, i.e., 2201 half-hourly measurements). The large dots represent observations that satisfy all criteria, i.e., 573 half-hourly measurements. The two main gaps in the data were caused by data loss due to the stolen computers (between 14-08-2009 and 16-09-2009, i.e., between DOY 226 and 259) and due to the harvest of the corn (between 21-09-2009 and 30-09-2009, i.e., between DOY 264 and 273), respectively.
Figure 8. Ammonia concentrations (upper panel), ammonia fluxes (middle panel) and (maximum) deposition velocities (lower panel) during the field campaign
The small dots represent observations that satisfy the first criterion (small enough errors in the concentration). The large dots represent observations that satisfy all criteria. The two main gaps in the data were caused by data loss due to stolen computers and to the harvesting of the corn, respectively.
The concentrations are generally below 10 µg m-3 and occasionally become
larger than 10 µg m-3. The fluxes are generally between 0.2 and -0.4 µg m-2 s-1.
The mean random error in these NH3 flux half hour values is 0.028 µg m-2 s-1.
The larger positive (emission) fluxes primarily occur in the first period (before 14-08-2009, i.e., DOY 226) of the measurement campaign. The second period (after 16-09-2009, i.e., DOY 259) is characterized by relatively small deposition fluxes. These measurements are mainly after the harvest of the corn over bare soil. 3 6 0 10 20 30 40 50 60 70 80 90 100 110 120 130 140 150 160 170 180 190 200 210 220 230 240 250 260 270 280 290 300 310 320 330 340 350
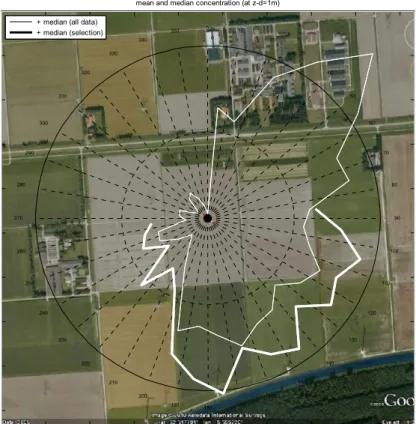
mean and median concentration (at z-d=1m) + median (all data)
+ median (selection)
Figure 9. Wind rose of the ammonia concentration measurements during the field campaign Figure 9 shows a wind rose of the ammonia concentrations before (thin lines) and after (thick lines) applying the selection criteria. The farm in the north-northeast is clearly visible in this wind rose, but these data are not considered in the final data evaluation due to the data selection criteria.
Especially the low concentrations to the northwest are remarkable. These low concentrations are likely due to the very clean upwind conditions, e.g. the IJsselmeer, and the absence of any intensive agricultural activities in this wind direction. The highway (running north-south) at about 1.5 km distance to the west of the measurement site did not seem to increase the ammonia
concentration. The relatively high concentrations to the south might partly be caused by agricultural activities on the fields to the south of our measurement site. However, the field adjacent to our field to the south is grown with grain and is not supposed to affect the concentration in this wind direction significantly. The high concentrations are therefore supposed to come from further away.
In the following two sections, we will analyze the measurements in more detail. For this purpose, we split up the measurement campaign into two periods: the growth period and the bare soil period. A weekly overview of the collected data is given in Appendix A.
3.2 Growth period
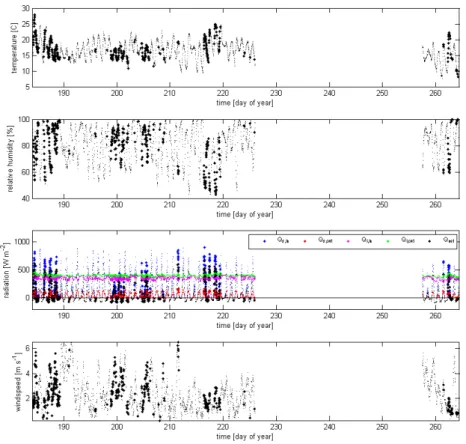
In Figure 10 ammonia concentration measurements, ammonia fluxes and deposition velocities are shown for the growth period. Figure 11 shows the temperature, relative humidity, radiation and wind speed during the growth period. Especially in the first few days of the measurement campaign the ammonia fluxes are bidirectional, which means that both deposition and emission occur. The emission events from the canopy are primarily during daytime and are most likely the result of soil emission. In theory, the corn itself can also emit ammonia in warm, dry conditions; however, it is not very likely that the rapidly growing corn canopy emits ammonia in this period, because of the high nitrogen demand for its growth. As the canopy is not full-grown yet, the emission is more likely the result of emission from the soil. The exchange
between the air above the canopy and the soil is rather efficient as long as the leaf area density is small. Although the binding capacity of the clayey soil is strong, the relatively high temperatures and dry conditions in the first few days may have caused the emission, due to evaporation of ammonia from the soil.
Figure 10. Ammonia concentration, flux and deposition velocity during the growth period
See caption of Figure 8 for explanation of symbols. The large gap between DOY 226 and 259 (between 14-08-2009 and 16-09-2009) is caused by the theft of the laptops.
Emission was not observed in the period between DOY 215 and 220 (between 03-08-2009 and 08-08-2009). This is remarkable because the temperatures are rather high and humidity is low, which are ideal conditions for the emission of ammonia. Probably, the high nitrogen-use efficiency during the growth of the corn prevented emission of ammonia from the stomata, and the high leaf area density prevented emission of ammonia from the soil during these days. We did not observe emission of ammonia due to the senescence of the corn at the end of the growth period between DOY 259 and 264 (between 16-09-2009 and 21-09-2009). This is likely because the conditions in this period were rather cool and wet, i.e. conditions that favour deposition. It is uncertain if emissions as a consequence of senescence did occur in the period in which data were missing due to the stolen computers (between 14-08-2009 and 16-09-2009, i.e., between DOY 226 and 259).
Figure 11. Temperature, relative humidity, radiation and wind speed during the growth period
See caption of Figure 8 for explanation of symbols.
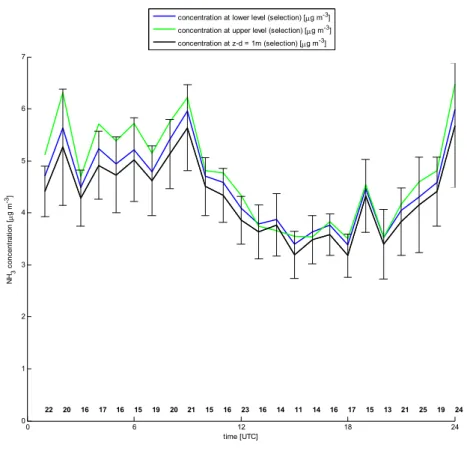
Figure 12 shows the diurnal cycle of the measured ammonia concentrations at the two measuring heights (blue and green lines) and at 1 m above zero-displacement height (black lines) during the growth period. The solid lines represent the selected data. The error bars represent the standard deviation of the mean for each hour (only given for the concentration at z-d = 1 m). The numbers at the bottom of the figure are the number of measurements on which the mean is calculated. It is clear that the concentrations are generally high at night and low in the afternoon. This effect is mainly caused by the growing and mixing of the boundary layer during daytime. On average, the air concentration
at 1 m above zero-displacement height is about 4.4 ± 0.2 µg m-3 for the data
selection. We also see that the concentration differences between the two measuring heights are larger at night than during daytime, which is caused by the generally more stable conditions at night.
0 6 12 18 24 0 1 2 3 4 5 6 7 time [UTC] NH 3 c onc ent ra tion [ g m -3] 22 20 16 17 16 15 19 20 21 15 16 23 16 14 11 14 16 17 15 13 21 25 19 24
concentration at lower level (selection) [g m-3]
concentration at upper level (selection) [g m-3]
concentration at z-d = 1m (selection) [g m-3]
Figure 12. Diurnal cycle of the selected ammonia concentrations
Diurnal cycle of the selected ammonia concentrations at the two measurement heights (blue and green) and the corresponding calculated ammonia concentration at 1 m above
zero-displacement height (black) during the growth period. The error bars represent the standard deviation of the mean for each hour (only given for the concentration at z-d = 1 m). The numbers at the bottom of the figure are the number of measurements on which the mean is calculated.
The diurnal cycle of the measured ammonia flux is shown in Figure 13. The figure shows that the fluxes are negative (deposition) during nighttime and tend to become closer to zero or even positive (emission) in the afternoon. The spreading in the data is larger during daytime than during nighttime, because the concentration gradients are generally larger during nighttime and therefore more clearly defined. The concentration gradients are relatively small during daytime, which makes that the errors in the concentrations create relatively large errors in the concentration gradients and therefore the final ammonia fluxes during daytime. As the concentrations at the upper measurement level are generally higher than the concentrations at the lower measurement level, the direction of the flux is downward, i.e., towards the surface. In the morning the flux becomes more negative due to increasing turbulence which causes increased exchange with the surface. In the afternoon, the small concentration
gradient sometimes reverses, i.e., emission events occur. At night the flux is directed towards the surface again.
0 6 12 18 24 -0.12 -0.1 -0.08 -0.06 -0.04 -0.02 0 0.02 0.04 0.06 time [UTC] NH 3 fl ux [ g m -2 s -1] 22 20 16 17 16 15 19 20 21 15 16 23 16 14 11 14 16 17 15 13 21 25 19 24
mean NH3 flux (selection) [g m-2 s-1]
Figure 13. Diurnal cycle of the selected ammonia fluxes at 1 m above zero-displacement height during the growth period
The error bars represent the standard deviation of the mean for each hour. The numbers at the bottom of the figure are the number of measurements on which the mean is calculated.
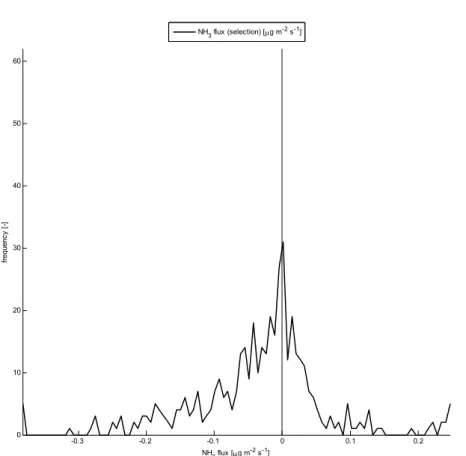
Figure 14 shows the frequency distribution of the ammonia flux at 1 m above the zero-displacement height. The figure shows the highest frequency of fluxes around zero with slightly more deposition than emission events. The mean NH3
-0.3 -0.2 -0.1 0 0.1 0.2 0 10 20 30 40 50 60 NH3 flux [g m-2 s-1] fr equ enc y [ -] NH3 flux (selection) [g m-2 s-1]
Figure 14. Frequency distribution of the selected ammonia fluxes at 1 m above zero-displacement height during the growth period
3.3 Bare soil
In Figure 15 ammonia concentration measurements, ammonia fluxes and deposition velocities are shown for the bare soil period. Figure 16 shows the temperature, relative humidity, radiation and wind speed during the bare soil period. Many measurements do not meet the selection criteria, mainly because the wind direction was not over the former corn field. Despite this, deposition seems to prevail in the selected data as well as in all available data. This is likely because the adjacent fields were also bare soil at that time and therefore have the same characteristics and behaviour as the bare soil of the former corn field. It is remarkable that the fluxes are much smaller than the fluxes in the growth period. This can be explained by the much smaller roughness of bare soil compared to the roughness of the corn canopy. Because of this, the soil intercepts less ammonia from the air than the corn canopy. In addition, the temperatures during this period were rather low and humidity was high, i.e. conditions that favour deposition. Given the large number of nights with negative net radiation (black dots in 3rd panel of Figure 16), there were many
nights with dew formation in this period. These wet surface conditions also favour the deposition of ammonia on the soil surface.
Figure 15. Ammonia concentration, flux and deposition velocity during the bare soil period
Figure 16. Temperature, relative humidity, radiation and wind speed during the bare soil period
Figure 17 shows the diurnal cycle of the measured ammonia concentrations at the two measuring heights (blue and green lines) and at 1 m above zero-displacement height (black lines) during the bare soil period. The solid lines represent the selected data. The diurnal cycle of the ammonia concentration is less well defined in this figure compared with the diurnal cycle in Figure 12. This is likely because the number of points is rather limited. On average, the air concentration at 1 m above zero-displacement height is about 4.3 ± 0.2 µg m-3.
0 6 12 18 24 0 1 2 3 4 5 6 7 8 time [UTC] NH 3 c onc ent ra tion [ g m -3] 7 8 5 7 8 8 9 5 8 6 4 4 6 6 5 6 4 4 5 6 7 7 6 7
concentration at lower level (selection) [g m-3]
concentration at upper level (selection) [g m-3]
concentration at z-d = 1m (selection) [g m-3]
Figure 17. Diurnal cycle of the selected ammonia concentrations during the bare soil period
Diurnal cycle of the selected ammonia concentrations at the two measurement heights (blue and green) and the corresponding calculated ammonia concentration at 1 m above
zero-displacement height (black) during the bare soil period.
The diurnal cycle of the measured ammonia flux is shown in Figure 18. This figure shows that the flux is rather constant during the day. This is because regardless of the wind direction, the fluxes are representative for bare soil, as the adjacent field to the north is also bare soil. Note that the scale of the y-axis in Figure 18 is equal to that of Figure 13. The spreading in the data is small during the whole day, reflecting the rather constantly turbulent and windy conditions in this wet and cool autumn period. The mean NH3 flux was -0.030 ±
0 6 12 18 24 -0.12 -0.1 -0.08 -0.06 -0.04 -0.02 0 0.02 0.04 0.06 time [UTC] NH 3 fl ux [ g m -2 s -1] 7 8 5 7 8 8 9 5 8 6 4 4 6 6 5 6 4 4 5 6 7 7 6 7
mean NH3 flux (selection) [g m-2 s-1]
Figure 18. Diurnal cycle of the selected ammonia flux at 1 m above zero-displacement height during the bare soil period
3.4 Measured fluxes compared with modelled fluxes
We compared our flux measurements with the modelled fluxes using the
parameterization proposed by Wichink Kruit et al. (2010). This parameterization is also used in the updated DEPAC model (Van Zanten et al., 2010). The
necessary parameter settings with regard to ammonia in the parameterization were derived from the measurements. Values for the meteorological variables were obtained from the site specific measurements as well. Figure 19 shows the mean diurnal cycle of the measured (black lines) and modelled (red lines) ammonia flux during the growth period. Only data that satisfy the data selection criteria are plotted. The diurnal cycle of the ammonia flux is well simulated by the model, although the deposition is slightly overestimated during nighttime. In the late morning, the model slightly underestimates the deposition flux. On average the measured deposition flux (-0.036 ± 0.005 µg m-2 s-1) is
overestimated by the model (-0.045 ± 0.002 µg m-2 s-1). Especially, the
calculated deposition fluxes during the night are significantly different from the measured fluxes.
0 6 12 18 24 -0.12 -0.1 -0.08 -0.06 -0.04 -0.02 0 0.02 0.04 0.06 time [UTC] flu x [g m -2 s -1] 22 20 16 17 16 15 19 20 21 15 16 23 16 14 11 14 16 17 15 13 21 25 19 24 measured flux [g m-2 s-1] modelled flux [g m-2 s-1]
Figure 19. Diurnal cycle of the ammonia flux at 1 m above zero-displacement height during the growth period for the selected data
The red line represents the model results. The black line represents the measurements. The plotted numbers are the number of data points used to calculate the mean value and the standard deviation (error bars).
Although the number of data points after applying the selection criteria is rather limited during the bare soil period, the model excellently describes the daily cycle of the ammonia flux (Figure 20). For the bare soil period the mean measured flux is -0.030 ± 0.001 µg m-2 s-1, while the mean modelled flux is
-0.029 ± 0.002 µg m-2 s-1. In this bare soil period, the modelled fluxes do not
0 6 12 18 24 -0.12 -0.1 -0.08 -0.06 -0.04 -0.02 0 0.02 0.04 0.06 time [UTC] flu x [g m -2 s -1] 7 8 5 7 8 8 9 5 8 6 4 4 6 6 5 6 4 4 5 6 7 7 6 7 measured flux [g m-2 s-1] modelled flux [g m-2 s-1]
Figure 20. Diurnal cycle of the ammonia flux at 1 m above zero-displacement height during the bare soil period for the selected data
The red line represents the model results. The black line represents the measurements. The plotted numbers are the number of data points used to calculate the mean value and the standard deviation (error bars).
4
Conclusion and Recommendations
In this study, we report the ammonia fluxes that were measured above a corn canopy in Lelystad, the Netherlands, during the growth season of 2009. A new measurement technique based on Differential Optical Absorption Spectroscopy (DOAS) technique was applied. The DOAS systems used in this measurement campaign were able to accurately measure small concentration differences, which were combined with turbulence measurements from a sonic anemometer to obtain reliable fluxes. The mean random error in the half hour NH3 flux values
is 0.028 µg m-2 s-1. The uptime of the device is quite promising (73%), but the
data reduction due to the wind direction selection is large (> 50%). In future campaigns, the uptime of the DOAS instruments may be improved with a better computer connection (to detect errors earlier) and an automatic DOAS
alignment system (to keep a strong signal/small measurement errors).
In order to calibrate the DOAS systems they were placed in the laboratory at the same height to perform a series of concentration measurements. The systems showed very good agreement with a R2 of 0.99. The small systematic differences
between the two systems is reflected in a slope and offset between the instruments. All concentration measurements during the measurement campaign are corrected for this slope and offset.
In order to investigate whether the systematic differences remain constant in the field, an experiment with cross measurements was set up to serve as a field calibration. These measurements were unfortunately lost due to the theft of equipment. We therefore relied on the lab calibration to correct the
measurements. For future measurement campaigns, it is recommended to carry out regular field calibrations by cross measurements in order to check whether the systematic differences between the instruments remain constant in time. The flux measurements over corn at the measurement site in Lelystad have shown that the corn canopy generally absorbs ammonia during nighttime. The corn canopy can emit ammonia, especially during warm and sunny days during the growth period. Flux measurements over bare soil during a cool and humid period succeeding the harvest of the corn only showed small deposition fluxes. The potential senescence of the corn canopy, one of the points of interest, could not be distinguished in our measurements, because of the loss of data due to the theft of equipment. Limited periods of emission were observed, especially in the beginning of the growing season, when the canopy was not covering the soil. In the calculation of the exchange fluxes no correction has been applied with respect to a possible distortion of the measured profiles due to the very close proximity of the top of the corn. It is recommended to sort out for future field campaigns whether such correction would be necessary.
The net NH3 flux from the corn canopy to the atmosphere during the growing
season was -0.036 ± 0.005 µg m-2 s-1 (= 11 kg NH
3/ha y = 9.3 kg N/ha y = ca.
670 mol /ha y) for the data selection. The negative sign means that there is net deposition. The net flux is the result of deposition and emission. A net emission due to the senescence of plants has not been observed, but – as mentioned above – this could easily be due to the loss of data in a critical part of the campaign and/or because of the relatively early harvest of the corn. In order to
determine whether the senescence of corn contributes to significant emissions of ammonia in the Netherlands a new campaign is desirable. For such a future campaign it is recommended to use a corn field planted with a type of corn that is left on the field to ripen for a longer period.
A comparison of the measured fluxes with model calculations using the parameterization proposed by Wichink Kruit et al. (2010) showed good agreement. Especially, the wet and cool autumn period over bare soil is well simulated by the model. The modelled deposition during the growth period is overestimated with about 25%. This is well within the uncertainty in the flux measurements.
References
Beljaars A.C.M., Holtslag A.A.M., 1991. Flux parameterization over land surface for atmospheric models. Journal of Applied Meteorology 30, 327-341.
Benner W.H., Ogorevc B., Novakov T., 1992. Oxidation of SO2 in thin water films
containing NH3. Atmospheric Environment 26, 1713-1723.
Burkhardt J., Flechard C.R., Gresens F., Mattsson M., Jongejan P.A.C., Erisman J.W., Weidinger T., Meszaros R., Nemitz E., Sutton M.A., 2009. Modelling the dynamic chemical interactions of atmospheric ammonia with leaf surface wetness in a managed grassland canopy. Biogeosciences 6, 67-84. Businger J.A., Wyngaard J.C., Izumi Y., Bradley E.F., 1971. Flux-profile relationships in the atmospheric surface layer. Journal of the Atmospheric Sciences 28, 181-189.
Denmead O.T., Freney J.R., Simpson J.R., 1976. A closed ammonia cycle within a plant canopy. Soil Biology and Biochemistry 8, 161-164.
De Ruijter F.J., Huijsmans J.F.M., Rutgers B., 2010. Ammonia volatilization from crop residues and frozen green manure crops. Atmospheric Environment 44, 3362-3368.
Dyer A.J., Hicks B.B., 1970. Flux gradient relationships in the constant flux layer. Quarterly Journal of the Royal Meteorological Society 96, 715-721. Dyer A.J., 1974. A review of flux-profile relationships. Boundary-Layer Meteorology 7, 363-372.
Erisman J.W., Van Pul W.A.J., Wyers P., 1994b. Parameterization of surface resistance for the quantification of atmospheric deposition of acidifying compounds and ozone. Atmospheric Environment 28, 2595-2607. Farquhar G.D., Firth P.M., Wetselaar R., Weir B., 1980. On the gaseous exchange of ammonia between leaves and the environment: Determination of the ammonia compensation point. Plant Physiology 66, 710-714.
Flechard C.R., Fowler D., 1998. Atmospheric ammonia at a moorland site. II: Long-term surface-atmosphere micrometeorological flux measurements. Quarterly Journal of the Royal Meteorological Society 124, 759-791.
Flechard C.R., Fowler D., Sutton M.A., Cape J.N., 1999. A dynamic chemical model of bi-directional ammonia exchange between semi-natural vegetation and the atmosphere. Quarterly Journal of the Royal Meteorological Society 125, 2611-2641.
Husted S., Schjoerring J.K., 1996. Ammonia flux between oilseed rape plants and the atmosphere in response to changes in leaf temperature, light intensity, and air humidity: interactions with leaf conductance and apoplastic NH4+ and H+
Loubet B., Milford C., Hill P.W., Tang Y.S., Cellier P., Sutton M.A., 2002. Seasonal variability of apoplastic NH4+ and pH in an intensively managed
grassland. Plant and Soil 238, 97-110.
Mattsson M., Hausler R.E., Leegood R.C., Lea P.J., Schjoerring J.K., 1997. Leaf-atmosphere NH3 exchange in Barley mutants with reduced activities of
glutamine synthetase. Plant Physiology 114, 1307-1312.
Milieu- en Natuurcompendium, 2008. Ammoniakemissie door de land- en tuinbouw, 1990-2007. MNP, Bilthoven, CBS, Voorburg, and WUR, Wageningen, PBL/MNC/jul08/0101.
Milford C., Hargreaves K.J., Sutton M.A., 2001b. Fluxes of NH3 and CO2 over
upland moorland in the vicinity of agricultural land. Journal of Geophysical Research 106, 24169-24181.
Monteith J.L., Unsworth M.H, 1990. Principles of environmental physics 2nd edn. Edward Arnold, London, 291.
Neirynck J., Ceulemans R., 2008. Bidirectional ammonia exchange above a mixed coniferous forest. Environmental Pollution 154, 424-438.
Nemitz E., Sutton M.A., Gut A., San Jose R., Husted S., Schjoerring J.K., 2000. Sources and sinks of ammonia within an oilseed rape canopy. Agricultural and Forest Meteorology 105, 385-404.
Nemitz E., Sutton M.A., Wyers G.P., Jongejan P.A.C., 2004. Gas-particle interactions above a Dutch heathland: I. Surface exchange fluxes of NH3, SO2,
HNO3 and HCl. Atmospheric Chemistry and Physics 4, 989-1005.
Paulson C.A., 1970. The mathematical representation of wind speed and temperature profiles in the unstable atmospheric surface layer. Journal of Applied Meteorology 9, 857-861.
Schjoerring J.K., Mattsson M., 2001. Quantification of ammonia exchange between agriculturalcropland and the atmosphere: Measurements over two complete growth cycles of oilseed rape, wheat, barley and pea. Plant and Soil 228, 105–115.
Sutton M.A., Fowler D., 1993. A model for inferring bidirectional fluxes of ammonia over plant canopies. Proceedings of the WMO Conference on the Measurement and Modelling of Atmospheric Composition Changes Including Pollution Transport. WMO/GAW-91, WMO Geneva, 179-182.
Sutton M.A., Fowler D., Burkhardt J.K., Milford C., 1995b. Vegetation
atmosphere exchange of ammonia: canopy cycling and the impacts of elevated nitrogen inputs. Water, Air and Soil Pollution 85, 2057-2063.
Sutton M.A., Milford C., Dragosits U., Singles R., Fowler D., Ross C., Hill R., Jarvis S.C., Pain B.F., Harrison R., Moss D., Webb J., Espenhahn S., Halliwell C., Lee D.S., Wyers G.P., Hill J., ApSimon H.M., 1997. Gradients of atmospheric ammonia concentrations and deposition downwind of ammonia emissions: First results of the ADEPT Burrington Moor Experiment. Pp. 131-139 in Gaseous nitrogen emissions from grasslands. Eds S.C. Jarvis and B.F. Pain. CAB International, Oxford, UK.
Van Hove L.W.A., Tonk W.J.M., Pieters G.A., Adema E.H., Vredenberg W.J., 1988. A leaf chamber for measuring the uptake of pollutant gases at low concentrations by leaves, transpiration and carbon dioxide assimilation. Atmospheric Environment 22, 2515-2523.
Van Pul W.A.J., Van den Broek M.M.P., Volten H., Van der Meulen A., Berkhout S., Van der Hoek K.W., Wichink Kruit R., Huijsmans J.F.M., Van Jaarsveld J.A., De Haan B., Koelemeijer R., 2008. Het ammoniakgat: onderzoek en duiding. RIVM Report 680150002, Bilthoven, the Netherlands, 97 p.
Van Zanten M.C., Sauter F.J., Wichink Kruit R.J., Van Jaarsveld J.A., Van Pul W.A.J., 2010. Description of the DEPAC module: Dry deposition modelling with DEPAC_GCN2010. RIVM Report 680180001, Bilthoven, the Netherlands, 72 p. Volten H., Lolkema D.E., Bergwerff J.B., Berkhout A.J.C., Haaima H., Van der Hoff G. R., Potma C.J.M., Van Pul W.A.J., Swart D.P.J., 2010. Two instruments based on differential optical absorption spectroscopy (DOAS) to measure
accurate ammonia concentrations in the atmosphere, Atmospheric Measurement Techniques, To be submitted.
Webb E.K., Pearman G.I., Leuning R., 1980. Correction of flux measurements for density effects due to heat and water vapour transfer. Quarterly Journal of the Royal Meteorological Society 106, 85-100.
Wichink Kruit R.J., Van Pul W.A.J., Otjes R.P., Hofschreuder P., Jacobs A.F.G., Holtslag A.A.M., 2007. Ammonia fluxes and derived canopy compensation points over non-fertilized agricultural grassland in the Netherlands using the new gradient ammonia − high accuracy − monitor (GRAHAM). Atmospheric Environment 41, 1275-1287.
Wichink Kruit R.J., Stolk A., Van Pul W.A.J., 2009. NH3 flux estimates at the
micrometeorological weather station in Wageningen, the Netherlands. RIVM Report 680150004, Bilthoven, the Netherlands, 56 p.
Wichink Kruit R.J., Van Pul W.A.J., Sauter F.J., Van den Broek M., Nemitz E., Sutton M.A., Krol M., Holtslag A.A.M., 2010. Modeling the surface-atmosphere exchange of ammonia. Atmospheric Environment 44, 945-957.
Wyers G.P., Otjes R.P., Slanina J., 1993. A continuous flow denuder for the measurement of ambient concentrations and surface fluxes of ammonia. Atmospheric Environment 27, 2085-2090.
Wyers G.P., Erisman J.W., 1998. Ammonia exchange over coniferous forest. Atmospheric Environment 32, 441-451.
Appendix A. Weekly overview
See Table 1 for data coverage during the measurement campaign. Possible jumps in the DOY numbers due to missing data are described in this table. Growth period 185 186 187 188 189 190 191 0 5 10 15 20
time [day of year]
conc ent ra tion [ g m -3] 185 186 187 188 189 190 191 -0.1 0 0.1 0.2 0.3
time [day of year]
flu x [g m -2 s -1] 185 186 187 188 189 190 191 -0.05 0 0.05 0.1
time [day of year]
depo si tio n v el oc ity [ m s -1]
deposition velocity at z-d=1m maximum deposition velocity at z-d=1m
Figure 21. Ammonia concentrations (upper panel), ammonia fluxes (middle panel) and (maximum) deposition velocities (lower panel) during the field campaign
The small dots represent observations that satisfy the first criterion (small enough errors in the concentration). The large dots represent observations that satisfy all criteria. Data are shown for the period between 03-07-2009 (DOY 184) and 10-07-2009 (DOY 191).
Figure 22. Temperature, relative humidity, radiation and wind speed during the growth period
See caption of Figure 21 for explanation of symbols. Data are shown for the period between 03-07-2009 (DOY 184) and 10-03-07-2009 (DOY 191).
192 193 194 195 196 197 198 0 1 2 3 4 5
time [day of year]
co nc ent rat io n [ g m -3] 192 193 194 195 196 197 198 -0.04 -0.02 0 0.02 0.04
time [day of year]
flu x [g m -2 s -1] 192 193 194 195 196 197 198 -0.02 0 0.02 0.04 0.06 0.08
time [day of year]
depo si tio n v el oc ity [ m s -1]
deposition velocity at z-d=1m maximum deposition velocity at z-d=1m
Figure 23. Ammonia concentrations (upper panel), ammonia fluxes (middle panel) and (maximum) deposition velocities (lower panel) during the field campaign
See caption of Figure 21 for explanation of symbols. Data are shown for the period between 10-07-2009 (DOY 191) and 17-10-07-2009 (DOY 198).
Figure 24. Temperature, relative humidity, radiation and wind speed during the growth period
Data are shown for the period between 10-07-2009 (DOY 191) and 17-07-2009 (DOY 198). See caption of Figure 21 for explanation of symbols.
199 200 201 202 203 204 205 0
2 4 6
time [day of year]
co nc ent rat io n [ g m -3] 199 200 201 202 203 204 205 -0.25 -0.2 -0.15 -0.1 -0.05 0 0.05
time [day of year]
flu x [g m -2 s -1] 199 200 201 202 203 204 205 -0.05 0 0.05 0.1
time [day of year]
depo si tio n v el oc ity [ m s -1]
deposition velocity at z-d=1m maximum deposition velocity at z-d=1m
Figure 25. Ammonia concentrations (upper panel), ammonia fluxes (middle panel) and (maximum) deposition velocities (lower panel) during the field campaign
Data are shown for the period between 17-07-2009 (DOY 198) and 24-07-2009 (DOY 205). See caption of Figure 21 for explanation of symbols.
Figure 26. Temperature, relative humidity, radiation and wind speed during the growth period
Data are shown for the period between 17-07-2009 (DOY 198) and 24-07-2009 (DOY 205). See caption of Figure 21 for explanation of symbols.
206 207 208 209 210 211 212 0
2 4 6
time [day of year]
co nc ent rat io n [ g m -3] 206 207 208 209 210 211 212 -0.2 -0.15 -0.1 -0.05 0 0.05
time [day of year]
flu x [g m -2 s -1] 206 207 208 209 210 211 212 -0.05 0 0.05 0.1 0.15
time [day of year]
depo si tio n v el oc ity [ m s -1]
deposition velocity at z-d=1m maximum deposition velocity at z-d=1m
Figure 27. Ammonia concentrations (upper panel), ammonia fluxes (middle panel) and (maximum) deposition velocities (lower panel) during the field campaign
Data are shown for the period between 24-07-2009 (DOY 205) and 31-07-2009 (DOY 212). See caption of Figure 21 for explanation of symbols.
Figure 28. Temperature, relative humidity, radiation and wind speed during the growth period
Data are shown for the period between 24-07-2009 (DOY 205) and 31-07-2009 (DOY 212). See caption of Figure 21 for explanation of symbols.
213 214 215 216 217 218 219 0 5 10 15 20
time [day of year]
co nc ent rat io n [g m -3] 213 214 215 216 217 218 219 -0.6 -0.5 -0.4 -0.3 -0.2 -0.1 0
time [day of year]
flu x [g m -2 s -1] 213 214 215 216 217 218 219 0 0.02 0.04 0.06 0.08
time [day of year]
depo si tio n v el oc ity [ m s -1]
deposition velocity at z-d=1m maximum deposition velocity at z-d=1m
Figure 29. Ammonia concentrations (upper panel), ammonia fluxes (middle panel) and (maximum) deposition velocities (lower panel) during the field campaign
Data are shown for the period between 31-07-2009 (DOY 212) and 07-08-2009 (DOY 219). See caption of Figure 21 for explanation of symbols.
Figure 30. Temperature, relative humidity, radiation and wind speed during the growth period
Data are shown for the period between 31-07-2009 (DOY 212) and 07-08-2009 (DOY 219). See caption of Figure 21 for explanation of symbols.