Colophon
© RIVM 2015
Parts of this publication may be reproduced, provided acknowledgement is given to: National Institute for Public Health and the Environment, along with the title and year of publication.
A.J. Verschoor (auteur), RIVM
Contact:
Dr. ir. Anja Verschoor
Centre for Safety of Substances and Products anja.verschoor@rivm.nl
Reviewed by: Dr. Els Smit , Drs. André van Vliet
This investigation has been performed by order and for the account of the Ministry of Infrastructure and the Environment, within the
framework of the project M607711 Soil quality and Risk assessment.
This is a publication of:
National Institute for Public Health and the Environment
P.O. Box 1 | 3720 BA Bilthoven The Netherlands
Publiekssamenvatting
Actualisatie van risicogrenzen voor nikkel in bodem
Het RIVM doet een voorstel voor nieuwe Nederlandse risicogrenzen voor nikkel in de bodem. Deze grenzen geven aan bij welke concentraties nikkel negatieve effecten op het ecosysteem in de bodem kan
veroorzaken. Het voorstel is gebaseerd op de meest recente data en inzichten in Europa.
Met deze grenzen worden de risico’s van een nikkelverontreiniging realistischer ingeschat. Als gevolg daarvan zullen de normen strenger zijn voor enkele typen bodems, zoals bodems waar meer nikkel uit vrijkomt. Voor het merendeel van de bodems zullen de normen soepeler uitvallen.
Nieuw is dat bij deze normen rekening wordt gehouden met de mate waarin bodemorganismen worden blootgesteld aan de vervuilende stof, de zogeheten biobeschikbaarheid. Uit de bodem komt namelijk niet de totale concentratie vrij, omdat een deel aan bodemdeeltjes ‘vast blijft zitten’. In welke mate dat gebeurt, is afhankelijk van de samenstelling van de bodem en verschilt daarom per bodemtype. In het onderzoek is ook een correctiemethode ontwikkeld waarmee de totale concentratie van een stof in de bodem kan worden omgerekend naar de concentratie die vrijkomt.
De huidige bodemnormen voor nikkel dateren van 2001 en zijn
gebaseerd op drie testgegevens met regenwormen. De laatste 15 jaar is er binnen de Europese Unie veel experimenteel onderzoek gedaan naar de mate waarin nikkel giftig is voor bodemorganismen. Het RIVM heeft op basis van deze 184 testresultaten, verdeeld over 43 verschillende soorten organismen of bodemprocessen, nieuwe maximaal toelaatbare risico- (MTR) en ernstige risicoconcentraties (ER) in de bodem afgeleid. Kernwoorden: nikkel, biobeschikbaarheid, veroudering, bodem,
Synopsis
Update of ecological risk limits of nickel in soil
RIVM proposes new Dutch risk limits for nickel in soil. These limits indicate the concentrations above which nickel can have negative effects on the soil ecosystem. The proposed risk limits are derived based on the latest insights in Europe on risk assessment.
By using these new risk limits, the risks of nickel pollutions are predicted more realistically. As a result, the standards will be more stringent for some types of soils, such as soils that release more nickel but for the majority of the soils, the risk limits are lower than the current values. New to these standards is that bioavailability of the contaminant is taken into account. Part of the total contaminant concentration is trapped in the soil. The soil therefore does not release all of the contaminant. To what extent this occurs is dependent on the
composition of the soil, and varies per type of soil. This study therefore also developed a correction method with which the total concentration of a substance can be converted into the a bioavailable concentration. The current soil standards for nickel date from 2001 and are based on three tests with earthworms. The last 15 years there has been much experimental research on the nickel toxicity on soil organisms within the European Union. Based on 184 test results, spread over 43 different species of organisms or soil processes, RIVM derived new maximum permissible risk (MPR) values and serious risk concentrations (ER) for soil.
Contents
Summary — 9
1 Introduction — 11
1.1 Background of the report — 11
1.2 Relevant risk limits — 11
1.3 Using ecotoxicity data: data quality and treatment of results — 12
1.4 Readers guide — 13
2 Ecotoxicity of nickel to soil organisms — 15
2.1 Previous assessment 15
2.2 Selection criteria for toxicity data in EU-RAR — 15
3 Method for derivation of risk limits — 17
3.1 Risk assessment options — 17
3.2 Derivation of HC5 and HC50 — 18
3.3 Calculation of soil-specific risk limits — 18
3.4 Derivation of MPC and SRC — 22
4 Results — 23
4.1 Added concentrations — 23
4.2 Correction for soil-type specific bioavailability — 23
4.3 MPC and SRC values and soil-type corrections — 24
5 Discussion and conclusions — 27
References — 29
Appendix 1 Glossary — 33
Appendix 2 Species and records EU-RAR — 35
Appendix 3 EU-RAR terrestrial toxicity data used for derivation of ecological risk limits of nickel — 37
Appendix 4 Overview of parameter b according to EU-RAR — 43
Summary
This report updates the scientific background of maximum permissible added concentrations (MPCadded), maximum permissible total aged
concentrations (MPCtotal), serious risk addition (SRCadded) and serious risk
concentrations (SRCtotal) of nickel in soil. The last update dated back to
2001, when only 3 terrestrial ecotoxicity studies were used. In 2008 the EU Risk Assessment Report of nickel was finalized, which evaluated an overwhelming number of recent terrestrial ecotoxicity studies of nickel. This information formed the basis of the derivation of updated MPC and SRC values. Besides updating the generic ecological risk limits, we adopted the method proposed in the EU-RAR, to calculated soil-specific risk limits. Based on a total of 184 terrestrial soil toxicity data, the MPC and SRC values are computed for added concentrations, and soil specific ecological risk limits expressed as total aged concentrations as a
function of the cation exchange capacity.
The MPCadded and SRCadded are respectively 10 and 144 mg Ni/kg.
Because they reflect bioavailable fractions, they should be compared with concentrations that are extracted with 0.43 M HNO3 or another mild
extractant.
Nickel concentrations added in toxicity tests are corrected for ageing in order to reflect field conditions. Ageing is dependent of the pH in the test and a correction is applied for tests with a exposure time of less than 120 days, to convert the added NOEC or EC10 value to a value that is relevant for the chemical availability under field conditions. The
bioavailability of nickel is further determined by the cation exchange capacity of the soil. If measured CEC values are not available, the CEC may eventually be computed by an appropriate transfer function. Seven species-specific regression models for bioavailability were present: for plants (2), soft-bodied (1) and hard-bodied invertebrates (1) and
enzymatic and microbial processes (3). These regression functions were used to calculate soil-specific NOEC or EC10 values for each species and each test. By read-across (looking at similar uptake pathways) these models are assigned to species for which no specific model was present. In order to enable routine calculation of soil-specific risk limits, we derived simple soil-type corrections for MPC and SRC:
2.7 and 22 .
The calculated risk limits reflect the total aged nickel concentrations, therefore it should be compared with concentrations that are extracted with aqua regia or a comparable “total” extraction method. For a Dutch standard soil with 10% organic matter and 25% clay a MPCtotal of 81
mg Ni/kg soil was proposed, and a SRCtotal of 660 mg Ni/kg soil.
The relation is valid for soils with CEC between 1.8 and 52.8 cmol/kg. This is the CEC-range in soils used for the BLM-derivation. For higher CEC values a cut-off value of 52.8 cmol/kg could be used, or MPC and SRC should be maximized to values of respectively 150 and 1200 mg Ni/kg.
1
Introduction
1.1 Background of the report
Ecological risk limits play an important role in the Dutch soil protection policy. Together with human health related risk limits, they are used for assessment of soil quality in the context of decision making on
remediation, re-use of soil and risk management in case of chemical spills or other emergency situations.
The derivation of most risk limits was performed in 2001 [1], mostly based on data from ecotoxicity tests that had been evaluated previously [2-6], but using an adapted methodology. Since then, risk limits for some (groups of) compounds have been updated, by adding new data to the already available datasets and taking into account methodological developments [7, 8], but the majority of the currently used ecological risk limits originates from the 2001-report. Upon request of the Dutch Ministry of Infrastructure and the Environment, it was investigated to what extent the existing ecological risk limits for soil can (should) be improved to meet new scientific developments and to solve practical problems that arise when using those risk limits in practice [9]. As a follow-up, a scoring method was developed to rank the existing
ecological risk limits with respect to uncertainty related to data quality and changes in the methodology [10]. Based on this evaluation arsenic, nickel, drins and DDT/DDE/DDD were selected for a closer review in 2014.
This report deals with the evaluation of new data and methodologies in order to derive up-to-date ecological risk limits for nickel in soil. Arsenic, drins and DDT/DDE/DDD are evaluated in separate reports. Before focusing on nickel, the following sections provide some background information on the risk limits considered in this report and the aspects that are considered most important when discussing the scientific validity of the previously derived risk limits.
1.2 Relevant risk limits
The relevant ecological risk limits in the context of this report are the Maximum Permissible Concentration (MPC) and the Serious Risk Concentration (SRC).
The MPCsoil is defined as the concentration in soil at which no negative
effect on ecosystems is expected [11, 12]. The MPCsoil is derived
considering direct ecotoxicity to soil organisms and/or bacterial or enzymatic processes and then indicated as MPCsoil, eco. If deemed
necessary in view of compound characteristics, secondary poisoning of predatory birds and mammals may also be considered by deriving an MPCsoil, secpois. Considering the protection level and methodology, the
MPCsoil, eco is comparable to a Predicted No Effect Concentration (PNEC)
as derived in various international frameworks [13, 14].
The SRCsoil, eco is the environmental concentration at which possibly
serious ecotoxicological effects on soil organisms and/or processes are to be expected, meaning that 50% of the species or processes is
potentially affected. The SRCsoil is usually derived for direct ecotoxicity to
soil organisms and/or processes only. In some cases, secondary
For Nickel secondary poisoning is deemed not relevant and is therefore not included in de SRC [17]. Detailed guidance for the derivation of the MPC and SRC for soil is given in [16].
1.3 Using ecotoxicity data: data quality and treatment of results The derivation of ecological risk limits basically follows a four step approach: collection of literature, evaluation of the scientific reliability, selection of relevant endpoints and using the endpoints to derive the risk limits. It can be imagined that if new data were generated since the last evaluation, this may potentially lead to a different result. This is the case for nickel, for which a huge amount of terrestrial ecotoxicity data has become available since 2001.
However, even if this is not the case and the same literature data would be used, newly derived risk limits will differ from those derived in 2001. Re-evaluation of the literature according to current insights may lead to different conclusions regarding the quality of the data, and the way risk limits are derived given a certain dataset has been adapted in several ways during the past years.
1.3.1 Changes in data treatment
Once reliable and relevant ecotoxicity endpoints are selected, the available data can be used in different ways to derive risk limits. If the number of data is limited, an assessment factor is put on the lowest endpoint. If more data are available, statistical extrapolation using Species Sensitivity Distributions (SSDs) can be applied. Changes in the requirements for using the latter were identified as an important factor when considering the uncertainty related to the previously derived risk limits [10]. An SSD displays the fraction of species potentially affected as a function of the exposure concentration. The Hazardous
Concentration for 5% and 50% of the species (HC5 and HC50), are used as input for the MPCsoil, eco and SRCsoil, eco, respectively.
Application of SSDs for terrestrial species is possible in rare cases only. In 2001, SSDs were applied when data for at least four taxonomic groups were available1, regardless of the trophic levels represented in
the dataset. The HC5 and HC50 were used without any additional assessment factors. With the implementation of the European Technical Guidance Document (TGD) for risk assessment of new and existing substances in 2003 [13], the requirements for performing SSDs have been extended. At present, SSDs can only be performed when at least 10 (preferably 15) values are available for at least eight different taxonomic groups, representing primary producers, and primary and secondary consumers. For the aquatic compartment, it is specified in detail which are the required taxonomic groups. This not the case for soil, but the requirements with respect to the number of data and the inclusion of at least three trophic levels are considered to be the same. For the SRCsoil, eco, whether or not performing an SSD is not a major
change if No Observed Effect Concentrations (NOECs) are present for at least two trophic levels. The 50th percentile of the SSD that was used previously, is equal to the geometric mean of the NOECs that will be used now.
European risk assessment of nickel
The European Risk Assessment Report of Nickel (EU-RAR) will form the basis for the update of ecological risk limits in the Netherlands [17]. In the late 1990s, nickel metal, nickel sulphate, nickel chloride, nickel nitrate and nickel carbonate were prioritized and selected for extensive hazard and risk assessment by the European Union under the former European Existing Substances Regulation (EEC 793/93). Denmark acted as Rapporteur Member State for the Nickel Risk Assessment (NiRA) for the EU. The process, in which other European Member States were enabled to comment, took more than eight years and included a hazard
evaluation and classification, a risk data set generation, a risk
assessment (RA), and finally a risk reduction strategy (RRS). The Risk
Assessment Report (EU-RAR) was finalized in 2008 and is considered the most thorough, up-to-date risk assessment, with wide agreement
amongst Member States and the nickel industries. 1.4 Readers guide
In the present report, a closer look is taken at the underlying data and methodology of the nickel RAR of 2008. High quality soil toxicity data were adopted from the RAR (Chapter 2). After the Dutch derivation of nickel risk limits in 2001, a lot of new research was published about the (bio)availability of nickel in soil. This resulted in a methodology to calculate soil specific risk limits, which is described in Chapter 3. Chapter 4 shows the calculated generic risk limits (MPCsoil, eco and
SRCsoil, eco) and soil specific functions that were derived using the RAR
2
Ecotoxicity of nickel to soil organisms
2.1 Previous assessment
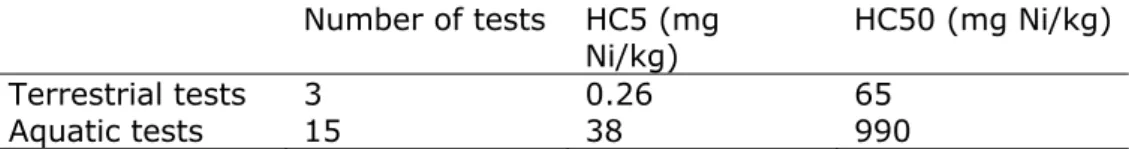
At the time of the previous RIVM assessment in 2001 [1] only 3 reliable terrestrial data were available, and 15 aquatic toxicity data. The HC5 and HC50 values that were derived from aquatic ecotoxicity test (n=15) when using equilibrium partitioning, were higher than the NOEC and EC50 values from the terrestrial tests. A logKp value of 3.3 was employed.
Table 1 HC5 and HC50 values derived in 2001, based on aquatic and terrestrial toxicity tests.
Number of tests HC5 (mg
Ni/kg) HC50 (mg Ni/kg) Terrestrial tests 3 0.26 65
Aquatic tests 15 38 990
The ultimate set of soil quality criteria is based on policy decision. The current maximum permissible concentration (MPC) in soil were set to the background-concentration in soil (35 mg Ni/kg) [18]. The current Serious Risk Concentration was set to 100 mg/kg.
2.2 Selection criteria for toxicity data in EU-RAR
In the EU-RAR reliable chronic terrestrial ecotoxicity test results are selected. Sufficient terrestrial data were thus available for the derivation of nickel risk limits in soil and it was not necessary to include aquatic toxicity data. Selected tests include 184 standard and non-standard tests comprising 43 species: 11 plants, 6 invertebrates, 19 microbial species or processes and 7 different enzymatic processes. We adopted all these data for revision of the new Dutch risk limits. Here a summary is given of the selection criteria that were used in the EU-RAR [17]. An overview of species and number of records is provided in Appendix 2. The complete list with toxicity data is provided in Appendix 3.
Test compound
The toxicity of nickel depends on the type of nickel-compound used in the test, mainly caused by differences in solubility. Only test results with soluble nickel salts (NiCl2 and NiSO4) are
selected. Test results of poorly soluble nickel compounds (NiO and metallic Ni) were excluded.
Soil types
Only test results with natural or artificial soils were selected. Tests with other substrates, for instance agar agar, nutrient
solutions, pure quartz sand or manure were excluded.
Tests with soils from deeper soil layers were excluded due to low organic matter content.
Tests with soil from sub-tropical and tropical areas outside Europe, were excluded because they are considered to be not representative for the European situation.
Only soils with cation exchange capacity (CEC) between 1.8 en 52.8 cmol/kg, pH between 3.3 and 7.7 and clay content between 0.4 and 55.5% were selected, because these were within the applicability domain of the developed bioavailability models.
Chemical analyses
Tests with measured (with strong acid extraction) as well as nominal (total added) nickel concentrations were selected. Elimination of tests with nominal concentrations only would have resulted in an unacceptable reduction of the number of tests, while for nickel differences between nominal and actual total concentrations due to e.g. biodegradation are not relevant. In case a study did not report whether concentrations are measured or not, it was assumed that it concerned nominal concentrations. Background concentrations that were estimated based on
regression models were not taken into account. Instead, the median background concentration for European topsoils from the FOREGS database was used (that is 14 mg Ni/kg dry soil) [17]. For OECD standard soil (artificial soil) there is no background
concentration. In that case it was assumed that the reported nominal concentration was equal to the total concentration.
Effects
For plants and invertebrates only single species tests with endpoints survival, growth or reproduction were selected. Microbial tests were included when involving litter breakdown,
respiration, microbial growth, carbon- or nitrogen-mineralization. These are multispecies tests, which are considered representative for the activity of terrestrial microbial ecosystems.
Soil enzymatic tests were only included when they were
performed in buffered soil suspensions at a pH-value that is equal (± 0.5 pH-unit) to that of undisturbed soil.
Effects on cell metabolism, chlorosis and cell membrane stability were excluded because the results are difficult to interpret at the population level.
Concentrations with 10% effect (lethal LC10 or sublethal, EC10)
were considered to be similar to No Observed Effect
Concentrations (NOECs). When both were reported, the EC10 was
selected.
Reliability
The following criteria were considered to assess the reliability of a test: Negligible mortality or loss of body weight in controls
Appropriate controls
Random distribution of organisms in test containers Sufficient replica’s for a sound statistical analysis No multi-metal exposure
Effect concentrations were excluded when based on visual estimation or when the statistical method was not described At least one control and two test concentrations were required for
3
Method for derivation of risk limits
3.1 Risk assessment options
For a proper risk assessment it is important that the measured nickel concentration and soil risk limits refer to the same metal pool. Changing or updating the risk limits requires a critical evaluation of extraction methods too.
Since decades, risk limits for soil are expressed as total concentrations, which are compared with soil concentrations measured by aqua regia extraction (a near-total extraction). This way of risk assessment is perceived to be a rather conservative, worst case method, because risk limits are mostly based on freshly contaminated soils whereas many studies have shown that ageing and soil properties lower the actual toxicity. In current legislation, these phenomena are corrected by background concentrations and soil type corrections.
An alternative, more direct, way to deal with bioavailability would be to employ a mild extraction to soil samples (extracting the bioavailable nickel fraction) and compare the measured bioavailable fraction with a soil risk limit that also reflects the bioavailable fraction. Experts agree [19] that an extraction with 0.43 M HNO3 reflects the potentially
bioavailable fraction. It extracts the actual bioavailable fraction, present in the pore water plus the fraction that is weakly bound to the soil matrix. Concentrations measured by 0.43 M HNO3 are therefore
considered appropriate for comparison with soil risk limits that account for added test concentrations.
We will provide two options for ecological risk limits of nickel:
1. Risk limits expressed as added concentrations, for comparison with 0.43 HNO3 extracted nickel concentrations,
2. Risk limits expressed as total concentrations in a standard soil for comparison with aqua regia extracted nickel concentrations. Risk limits are subject to a soil-type correction that account for the influence of ageing and bioavailability on nickel toxicity. In principle these options aims at the same protection level; i.e protection of 95% of the species/processes for the MPCsoil and 50% of
3.2 Derivation of HC5 and HC50
HC5 and HC50 values were derived by statistical extrapolation using a species sensitivity distribution (SSD). In the SSD the toxicity dataset was aggregated to 43 data points, each test species or tested process was represented by its most sensitive endpoint.
The SSD comprises plants, invertebrates, microbial processes and enzyme activities.2 If several data were available for the same endpoint, the geometric mean was calculated.
The aggregated toxicity data were fitted with a log-normal distribution model, according to recommendations in the EU-RAR. Other
mathematical fits were tested in the RAR and (i.e. gamma distribution, log-logistic, Weibull) resulted in HC5 and HC50 values that differed a factor 1.2 at the most. Statistical uncertainty is one of the elements that determine the choice of an assessment factor (see paragraph 3.4). All calculations were implemented in R statistical software. The HC5 and HC50 values were computed with the R-package fitdistrplus [20]. 3.3 Calculation of soil-specific risk limits
The calculation of soil-specific risk limits contains a correction for
fixation in the toxicity test (expressed by a leaching/ageing factor) and a correction for bioavailability taking into account differences in soil
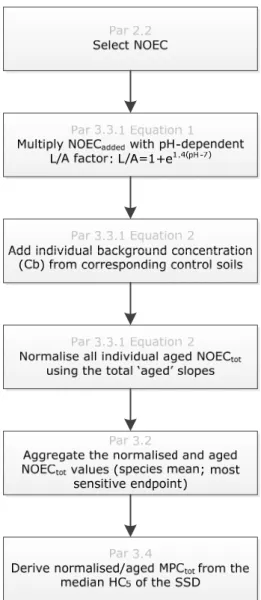
properties between test and soil of interest. The whole procedure for calculation of a soil-specific HC5 is shown in Figure 1.
2 The ecological relevance of enzymatic assays can be discussed for several reasons. The enzymatic activities
are measured at conditions that are not representative for in situ conditions. Several assays are conducted in pH buffered soil suspensions (some tests even at pH>10) and since the metal-enzyme interaction is pH dependent, this might obscure the relationship with effects in the soil. Almost all assays use saturating substrate concentrations (typically several mM), a condition that is unlikely to occur in situ. The in situ effect of metals on an enzymatic reaction may be rather insensitive to the enzyme capacity (as measured with the enzyme assays) if substrate supply is the rate-limiting step. Not considering the incorporation of the enzymatic toxicity data in the terrestrial database resulted, for the scenarios considered, in higher HC5 values. The factor of difference is factor of 1.2, which is considered negligible (EU-RAR, 2008).
Figure 1 Calculation steps for normalization of nickel toxicity data.
Corresponding paragraphs (grey) contain more detailed information about the procedure.
3.3.1 Correction for leaching/ageing and bioavailability
The bioavailability of nickel in soil is dependent of soil type and the duration between nickel application and measurement of effects (leaching/ageing).
Effect concentrations observed in toxicity tests are normalized for the duration between nickel application and measurement of effects.
Leaching is an effect that occurs at longer time periods when macro-ions are leached, causing a change in ion strength. Lower ion strength leads to higher bioavailability because there are less competitive ions that compete with nickel for binding to cell membranes. Ageing is a factor that indicates stronger binding and potential incorporation of nickel in the soil particles. Ageing reduces the nickel concentrations in pore water and leads to a lower observed toxicity. Both effects are combined in a leaching/ageing factor.
The EU-RAR described the following procedure for calculation of the leaching/ageing (L/A) factor. The L/A factor was studied on 16 soil types, and appeared to be dependent on the pH:
L/A 1 e
1 . 4× p H ‐ 7 . 0 (1)Where the pH is pH-CaCl2. If pH was measured in KCl is was
transformed to pH(CaCl2) by: pH-CaCl2 = 0.795+0.894*pH-KCl
The L/A factor is only applied on added concentrations, with an equilibration time of ≤ 120 days.
EC
x,
a g e dEC
x , a d d e d× L/A
(2)After correction for leaching/ageing, the background concentration is added. The remaining differences in nickel toxicity between soil types can be best explained by differences in CEC (compared to pH, organic matter and clay). A high CEC, implies that high concentrations of cations such as Ca2+, Mg2+, Na+ or K+ are available in the soil solution. These
cations suppress the toxicity of Ni2+, because they hinder the binding of
Ni2+ to biological targets, and they supplement potential deficiencies of
these macro-ions caused by the toxic effects of Ni2+. Regression
functions for the relation between CEC and NOEC or EC10 values were derived for seven different soil organisms.
log EC
x , a g e dCb
a b×log CEC
(3)The applicability range of the regression functions is pH 3.3-7.7, organic matter content 0.4-56.8%, CEC 1.8-52.8 cmol/kg and 1-113 mg Ni/kg. The applicability range was determined by the range of soil properties of the 16 soils used for derivation of the regression functions.
The overall correction is described by the following formula:
, , / (4)
For organisms with no experimental regression functions, read-across was applied according to EU-RAR recommendations. The values for the parameter b and the read-across rationale is included in Appendix 4. The effect of the bioavailability correction on the nickel HC5 and HC50 is demonstrated for 2 Dutch soil types that were also selected in the EU-RAR. These data are used to check if we implemented the bioavailability calculations correctly.
Table 2 Properties of 2 soils in The Netherlands used in the EU-RAR to calculate normalized HC5 and HC50 values.
pH OM% Clay% CEC Loam 7.5 2.2 26 20
Peat 4.7 40 24 35 OM=Organic matter content (%)
3.3.2 Derivation of a relation between HC5, HC50 and CEC
A simplification of the whole leaching ageing and bioavailability
procedure is very useful for routine risk assessments. The full procedure described in the RAR comprises a non-linear correction of each individual NOEC or EC10 value in the SSD (see equation 4). The exponential factor b is species-dependent and varies from 0.95 to 1.34. As a consequence the magnitude of the correction is dependent of the species and the test conditions (CECtest). This implies that the ranking of species in
the SSD is not always the same and may change between reference soil types.
For application of nickel bioavailability in routine assessments a relation between soil properties (for instance CEC) and HC5 or HC50 would be very more useful and straightforward, because risk assessors may skip the procedure of normalisation for individual species, constructing SSDs and fitting distributions. In addition to the RAR procedure, we
investigated the potential of a relation between nickel toxicity and CEC. The HC5 and HC50 were computed for 17 hypothetical soils with CEC between 1.8 and 52.8 cmol/kg, with intervals of 3 cmol/kg. Individual corrected NOEC and EC10 values were calculated for these 17
hypothetical soils, SSDs were constructed and HC5 and HC50 were derived. Subsequently, linear regression was applied to derive the transfer function between HC5, HC50 and CEC. A discussion about uncertainties is given in paragraph 4.3.
3.3.3 Estimation of CEC
The CEC describes the interaction between dissolved and adsorbed cation in the soil. The CEC can be estimated from measured cation concentrations in the pore water and on the soil matrix [21]. A simpler approach is to estimate the CEC from basic soil properties such as clay content, organic matter content and/or pH.
Organic matter and clay are standard parameters in routine soil analysis in the Netherlands, whereas CEC is not. Therefore a relation of HC5 and HC50 with OM and clay content would be more practical. In general the CEC is also dependent upon the pH; in most soils increasing pH lead to increasing CEC [22]:
30 4.4 34.7 29.7 (5)
where CEC is expressed in meq/100 g soil=cmol/kg, Fclay=fraction of clay, Fom= fraction organic matter, and pH=pH-KCl3. This equation is used in the EU-RAR, and in (slightly different form) in several Dutch studies ( i.e. [23, 24])
3 The underlying study was performed in the 1960’s. Measuring pH in a KCl solution was quite common then.
Nowadays pH is mostly measured in a CaCl2 solution. The relation between both pH’s is: pH-CaCl2 = 0.795+0.894*pH-KCl.
However, when the pH has not been measured or is not present in a database the CEC may be estimated from an equation without pH [25]:
1.5 % 0.6 % (6)
where CEC is expressed in meq/100 g soil = cmol/kg.
A thorough discussion about the validity of each equation to estimate CEC from soil properties is beyond the scope of our report. The message is that a relation of HC5total or HC50total with CEC may be transformed to
a relation of HC5total or HC50total with clay, OM and/or pH, if measured
CEC values are not available. 3.4 Derivation of MPC and SRC
It is common practice in risk assessment methodology to apply assessment factors that account for different types of variations and uncertainties [26]. When MPC is derived using the SSD-method, an assessment factor between 1 and 5 is put on the HC5, to be justified on a case by case basis. The following aspects are considered:
1. Overall quality of the database and the endpoints 2. Diversity and representativity of the taxonomic groups 3. Mode of action data
4. Statistical uncertainties around the HC5 estimate 5. Effects data from the field.
After setting an appropriate assessment factor (AF), the maximum permissible concentration and the serious risk concentrations are computed as follows:
5/ (7)
The SRA or SRC is based on the geometric mean of the available NOEC/EC10-values, which is equivalent to using the HC50 without an additional assessment factor.
4
Results
4.1 Added concentrations
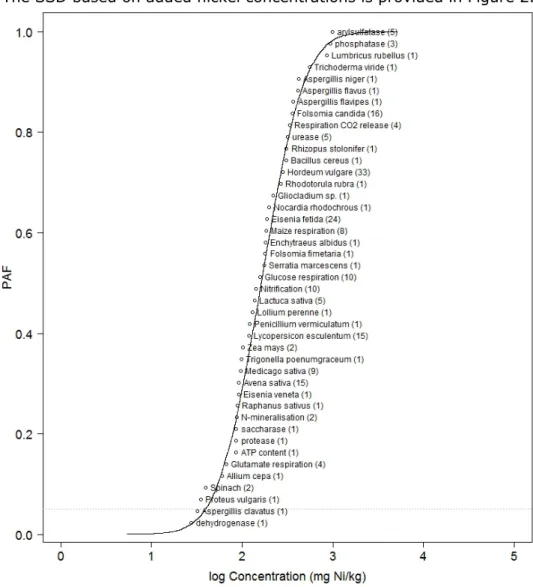
The SSD based on added nickel concentrations is provided in Figure 2.
Figure 2 Species sensitivity distribution based on added nickel NOEC or EC10 values. Between brackets the number of underlying data. PAF = Potentially Affection Fraction of species.
The graph is illustrative because it shows all the species for which nickel-toxicity data are available, and their relative sensitivity. The NOECs or EC10 values in this graph are not corrected for bioavailability. The HC5 and HC50 values are therefore not reported because they cannot be related to a reference soil.
4.2 Correction for soil-type specific bioavailability
The variability of NOECs could best be explained by variation of the CEC. The effect of bioavailability on the nickel HC5 and HC50 is demonstrated for two soil types that were also selected in the EU-RAR. This is done to verify our implementation of the bioavailability correction. The estimated
HC5 and HC50 values are listed in Table 3. The agreement between the EU-RAR and our own estimates is good. The minor differences in HC5 may be caused by using different software to fit the log-normal distribution.
Table 3 Normalized HC5 and HC50 values (mg Ni/kg soil) for 2 soil types in The Netherlands. Between brackets the values that were estimated in the EU-RAR.
HC5 (mg Ni/kg soil) HC50
Loam 99 (100) 408
Peat 186 (189) 746
The relation between CEC and HC5 and HC50 for soil types with CEC between 1.8 and 52.8 cmol/kg is shown in Figure 3 and can be described by linear functions:
5 5.40 [8]
50 21.6 [9]
Figure 3 Relation between HC5, HC50 and the CEC of the soil.
The applicability domain of the bioavailability regression functions is restricted to CEC between 1.8 and 52.8 cmol/kg. If higher CEC values are measured or predicted, cut-off values are proposed:
maximum HC5 = 293 mg Ni/kg and maximum HC50 = 1162 mg Ni/kg. 4.3 MPC and SRC values and soil-type corrections
Acknowledging the large number of high quality terrestrial ecotoxicity studies, covering 8 taxonomic groups, the EU-RAR recommended an assessment factor (AF) of 2. In addition to the EU-RAR reasoning we considered the fact that in the aquatic ecosystem snails and molluscs belong to the most sensitive organisms as far as nickel is concerned. In the terrestrial toxicity database there are no snails or molluscs included. A summary of the uncertainties indicated by the EU-RAR is given in Appendix 5.
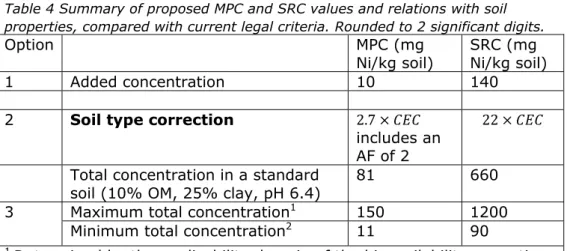
Given the AF of 2 the following ecological risk limits are proposed (seeTable 4).
Table 4 Summary of proposed MPC and SRC values and relations with soil properties, compared with current legal criteria. Rounded to 2 significant digits.
Option MPC (mg
Ni/kg soil)
SRC (mg Ni/kg soil) 1 Added concentration 10 140
2 Soil type correction 2.7
includes an AF of 2
22 Total concentration in a standard
soil (10% OM, 25% clay, pH 6.4) 81 660 3 Maximum total concentration1 150 1200
Minimum total concentration2 11 90 1 Determined by the applicability domain of the bioavailability correction 2 Calculated for a standard soil with 2% OM and 2% clay
The MPCadded of 10 mg Ni/kg reflects the chemically available fraction,
which can be extracted with 0.43 M HNO3. The MPCadded is independent
of soil type, but it ignores the effect of other cations on the bioavailability of nickel. The same reasoning holds for SRCadded.
To account for bioavailability, relations were derived between MPCtotal
and SRCtotal and the CEC. If the CEC is not measured, it may be
estimated from transfer functions. This introduces an additional uncertainty to the correction of MPC and SRC values.
To facilitate comparison with current legal ecological risk limits for nickel in soil, MPCtotal and SRCtotal were calculated for a standard soil with 25%
clay and 10% organic matter. The standard soil would have an estimated CEC of 30 cmol/kg according Equation 6. According to Equation 5, this standard soil would have a pH of 6.4. Taking into account ageing and bioavailability (option 3), the MPCtotal for such a
standard soil is 81 mg Ni/kg. The SRCtotal for a standard soil is 657 mg
Ni/kg soil.
For soils and sediments with very low clay and organic matter contents the current legislation recommends to use minimum contents of 2% in the soil type correction [27]. This would imply a minimum MPCtotal of 11
5
Discussion and conclusions
The current legal MPCtotal (35 mg Ni/kg) and SRCtotal (100 mg Ni/kg) of
nickel are defined for a standard soil of 25% clay and are independent of organic matter content. These current legal ecological risk limits ignore the effect of organic matter and pH. Beside this uncertainty, the weight-of-evidence of the current ecological risk limits is small; only 3 toxicity tests were considered and the methodology of derivations of the environmental quality criteria was out-of-date.
It is up to policy makers to decide if and how the current ecological risk limits for nickel in soil will be replaced. This will also depend on choices on how to deal with bioavailability of metals in general, and what extraction methods are to be prescribed. These issues are outside the scope of this report. This report contains ecological risk limits for the two extraction methods that are currently considered: i.e. the
0.43 M HNO3 extraction and the aqua regia extraction.
The proposed new ecological risk limits are based on a state-of-the-art assessment of 184 terrestrial soil toxicity data, distributed over 43 species or soil processes together with application of the most up-to-date guidelines for derivation of environmental quality criteria. The proposed MPCadded is 10 mg Ni/kg and the SRCadded is 140 mg
Ni/kg. They reflect the potentially available fraction, which can be extracted with 0.43 M HNO3. The MPCadded is independent of soil type,
but it ignores the competitive effect of other cations on the bioavailability of nickel. The same reasoning holds for SRCadded.
The soil-type corrections of the ecological risk limits with CEC are:
2.7 and 22 .
Where CEC is the cation exchange capacity in cmol/kg. In these
equations the ageing and bioavailability of nickel are accounted for. The resulting MPC- and SRC-values should be compared with aqua regia extracted nickel concentrations. If measured CEC values are not available, the CEC may eventually be computed by an appropriate transfer function.
For a standard soil with 10% organic matter, 25% clay a CEC of 30 cmol/kg is estimated. This results in MPCtotal = 81 mg Ni/kg and
SRCtotal = 660 mg Ni/kg for a standard soil with 10% OM and 25%
References
1. Verbruggen, E.M.J., R. Posthumus and A.P. Van Wezel, 2001, Ecotoxicological Serious Concentrations for soil, sediment and (ground)water: updated proposals for first series of compounds. Report no. 711701020, Bilthoven, The Netherlands, pag.
2. Crommentuijn, T., et al., 1997, Maximum Permissible Concentrations and Negligible Concentrations for pesticides. Report no. 601501002, Bilthoven, The Netherlands, pag.
3. Crommentuijn, T., M.D. Polder and E.J. Van de Plassche, 1997, Maximum Permissible Concentrations and Negligible
Concentrations for metals, taking background concentrations into account. Report no. 601501001, Bilthoven, The Netherlands, pag.
4. Denneman, C.A.J. and C.A.M. Van Gestel, 1990,
Bodemverontreiniging en bodemecosystemen: voorstel voor C-(toetsings) waarden op basis van ecotoxicologische risico's. Report no. 725201001, Bilthoven, The Netherlands, pag. 5. Van de Meent, D., et al., 1990, STREVEN NAAR WAARDEN.
Achtergrondstudie ten behoeve van de nota
"Milieukwaliteitsnormering water en bodem’. Report no. 670101002, Bilthoven, The Netherlands pag.
6. Van de Plassche, E.J., 1994, Towards integrated environmental quality objectives for several compounds with a potential for secondary poisoning. Report no. 679101012, Bilthoven, The Netherlands, pag.
7. Verbruggen, E.M.J., 2012, Environmental risk limits for polycyclic aromatic hydrocarbons (PAHs). For direct aquatic, benthic, and terrestrial toxicity. Report no. 607711007, Bilthoven, The Netherlands, pag.
8. Van Vlaardingen, P.L.A., R. Posthumus and C.J.A.M. Posthuma-Doodeman, 2005, Environmental Risk Limits for Nine Trace Elements. Report no. 601501029, Bilthoven, The Netherlands, pag.
9. Mesman, M. and J.P.A. Lijzen, 2012, Discussienotitie
normstelling ecologische risico’s. Onderzoeksprogramma 2012-2014. Report no. 607711008, Bilthoven, The Netherlands, pag. 10. Brand, E., et al., 2013, Onderbouwing ecologische
risicogrenswaarden voor bodem. Report no. 607711012, Bilthoven, The Netherlands, pag.
11. VROM, in Environmental risk limits in the Netherlands. A review of environmental quality standards and their policy framework in the Netherlands1999, Ministry of Housing, Spatial Planning and
the Environment: The Hague, The Netherlands.
12. VROM, (Inter)nationale Normen Stoffen, 2004, Ministry of
Housing, Spatial Planning and the Environment: Den Haag, The Netherlands.
13. EC, 2003, Technical Guidance Document on risk assessment in support of Commission Directive 93/67/EEC on risk assessment for new notified substances, Commission Regulation (EC) No 1488/94 on risk assessment for existing substances and Directive 98/8/EC of the European Parliament and of the Council
concerning the placing of biocidal products on the market. Ispra, Italy, pag.
14. ECHA, 2008, Guidance on information requirements and chemical safety assessment. Chapter R.10: Characterisation of dose [concentration]-response for environment. Helsinki, Finland, 65 pag.
15. Lijzen, J.P.A., et al., 2002, Evaluatie onderbouwing
BodemGebruiksWaarden. Report no. 711701029, Bilthoven, The Netherlands, pag.
16. Van Vlaardingen, P.L.A. and E.M. Verbruggen, J, Guidance for the
derivation of environmental risk limits within the framework of "International and national environmental quality standards for substances in the Netherlands" (INS). 2007, National Institute for
Public Health and the Environment (RIVM): Bilthoven, The Netherlands.
17. Denmark, 2008, European Union risk assessment report. Nickel and nickel compounds. Prepared by The Danish Environmental Protection Agency, on behalf of the European Union., pag. 18. van den Hoop, M.A.G.T., 1995, Literatuurstudie naar
achtergrondgehalten van zware metalen in bodem, sediment, oppervlaktewater en grondwater. RIVM, Report no. 711701020, Bilthoven, The Netherlands, 263 pag.
19. Lijzen, J., et al., 2014, Visiedocument Gebruik van
biobeschikbaarheid in bodembeoordeling. Mogelijkheden voor gebruik van biobeschikbaarheid van metalen bij beoordeling kwaliteit van bodem en waterbodem. RIVM, Report no. 607711xxx/2014, Bilthoven, The Netherlands, 67 pag. 20. Delignette-Muller, M.L., C. Dutang and R. Pouillot, 2014,
Package 'fitdistrplus'. http://cran.r-project.org/web/packages/fitdistrplus/.
21. De Vries, W. and M. Posch, 2003, Derivation of cation exchange constants for sand, loess, clay and peat soils on the basis of field measurements in the Netherlands. Alterra, Report no. 701, Wageningen, 50 pag.
22. Helling, C.S., G. Chesters and R.B. Corey, 1964, Contribution of organic matter and clay to soil cation exchange capacity as affected by the pH of the saturating solution. Soil Science Society
America, 28(517-520): 517-520.
23. De Vries, J., P.F.A.M. Römkens and J.C.H. Voogd, 2004,
Prediction of the long-term accumulation and leaching of zinc in Dutch agricultural soils: a risk assessment study. Alterra, Report no. 1030, Wageningen, The Netherlands, 93 pag.
24. Posch, M., J.-P. Hettelingh and J. Slootweg, 2003, Manual for dynamic modelling of soil response to atmospheric deposition. RIVM, Report no. 259101012, Bilthoven, The Netherlands, 71 pag.
25. Boumans, L.J.M., et al., 1987, Kwetsbaarheid van het grondwater. Kartering van kenmerken van de nederlandse bodem in relatie tot de kwetsbaarheid van het grondwater voor verontreiniging. RIVM, Report no. 840387003, Bilthoven, The Netherlands, pag.
26. EC, Common implementation strategy for the Water Framework Directive (2000/60/EC) Guidance document No. 27. Technical guidance for deriving environmental quality standards, 2011,
[EC] European Commission.
27. VROM and VW, 2007, Regeling bodemkwaliteit.Regeling van 13 december 2007, nr. DJZ2007124397, houdende regels voor de uitvoering van de kwaliteit van de bodem. Staatscourant, 247: 67-157.
28. University of Ghent/EURAS, 2005, NiPERA research project on the ‘Bioavailability and ageing of Nickel in soils: invertebrate toxicity testing’.
29. Lock, K. and C.R. Janssen, 2002, Ecotoxicity of nickel to Eisenia fetida, Enchytraeus albidus and Folsomia candida. Chemosphere,
46: 197-200.
30. Scott-Fordsmand, J.J., P.H. Krogh and S.P. Hopkin, 1999, Toxicity of nickel to a soildwelling springtail, Folsomia fimetaria (Collembola: Isotomidae). Ecotoxicol. Environ. Saf., 43: 57-61. 31. Ma, W., 1982, The influence of soil properties and worm-related
factors on the concentration of heavy metals in earth worms.
Pedobiologia, 24: 109-119.
32. Smolders, E., 2000, The effect of NiSO4.6H20, elemental Ni and green NiO on nitrogen transformation in soil. Katholieke
Universiteit Leuven, Belgium, pag.
33. University of Leuven, 2005, NiPERA research project on the ‘development of a predictive model of bioavailability and toxicity of Nickel in soils: microbial toxicity’.
34. Babich, H. and G. Stotsky, 1982, Toxicity of nickel to microorganisms in soil: influence of some physiochemical characteristics. Environ. Pollut., 29: 303-315.
35. Doelman, P. and L. Haanstra, 1984, Short-term and long-term effects of cadmium, chromium, copper, nickel, lead and zinc on soil microbial respiration in relation to abiotic soil factors. Plant
and Soil, 79: 317-327.
36. Saviozzi, A., et al., 1997, The influence of heavy metals on carbon dioxide evolution from a typic xerochrept soil. Water, Air
and Soil Pollution, 93: 409-417.
37. Wilke, B.M., 1988, Long-term effects of inorganic pollutants on microbial activity of a sandy cambisol. Z. Pflanzenernahr.
Bodenk., 151: 131-136.
38. Haanstra, L. and P. Doelman, 1984, Glutamic acid decomposition as sensitive measure of heavy metal pollution in soil. Soil Biol.
Biochem., 16(6): 595-600.
39. Rothamsted Research, 2005, NiPERA research project on the ‘development of a predictive model of bioavailbility and toxicity of Nickel in soils:Plant toxicity’.
40. Willaert, G. and M.G. Verloo, 1988, Biological effects of nickel species and their determination in plant and soil. Plant and Soil,
41. Halstead, R.L., B.J. Finn and A.J. MacLean, 1969, Extractability of nickel added to soils and its concentration in plants. Canadian
Journal of Soil Science, 49: 335-342.
42. Liang, C.N. and M.A. Tabatabai, 1977, Effects of trace elements on nitrogen mineralisation in soils. Environ. Pollut., 12(2): 141-147.
43. Bai, W., et al., 2010, Toxicity of zinc oxide nanoparticles to zebrafish embryo: a physicochemical study of toxicity mechanism. J Nanopart Res, 12(5): 1645-1654.
44. Frossard, R., F.X. Stadelman and J. Niederhauser, 1989, Effects of different heavy metals on fructan, sugar and starch content of ryegrass. Journal of Plant Physiology, 134: 180-185.
45. Gupta, S.K., et al., 1987, The effect of graded doses of nickel on the yield, the nickel content of lettuce and the soil respiration.
Toxicological and Environmental Chemistry,, 14: 1-9.
46. De Haan, S., H. Rethfeld and W. van Driel, 1985, Acceptable levels of heavy metals (Cd, Cr, Cu, Ni, Pb, Zn) in soils, depending on their clay and humus content and cation-exchange capacity. I.v. Bodemvruchtbaarheid, Haren, The Netherlands, pag. 47. Metwally, A.I. and M.H. Rabie, 1989, Effect of Ni addition on
plant growth and nutrient uptake in two soils. Egyptian Journal of
Soil Science, 29(3): 261-274.
48. Doelman, P. and L. Haanstra, 1986, Short- and long-term effects of heavy metals on urease activity in soils. Biology and Fertility of
Soils, 2: 213-218.
49. Doelman, P. and L. Haanstra, 1989, Short- and long-term effects of heavy metals on phosphatase activity in soils: an ecological dose-response model approach. Biology and Fertility of Soils, 8: 235-241.
50. Haanstra, L. and P. Doelman, 1991, An ecological dose-response model approach to short and long-term effects of heavy metals on arylsulphatase activity in soil. Biology and Fertility of Soils,
11: 18-23.
51. Welp, G., 1999, Inhibitory effects of the total and water-soluble concentrations of nine different metals on the dehydrogenase activity of a loess soil. Biology and Fertility of Soils, 30: 132-139. 52. Wilke, B.M., 1991, Effects of single and successive additions of
cadmium, nickel and zinc on carbon dioxide evolution and
dehydrogenase activity in a sandy luvisol. Biology and Fertility of
Appendix 1 Glossary
Abbreviation Explanation
AF Assessment Factor
CEC Cation Exchange capacity; property of soil to reflect the potential to hold and exchange cations.
EC10 Effect Concentration where 10% effect is observed compared to untreated control. This statistically derived concentration of a substance in an environmental medium expected to produce a 10% effect compared to the control.
ER Dutch synonym for SRC: “Ernstig Risico Concentratie” EU-RAR European Union Risk Assessment Report
HC5 Hazard Concentration 5%. This concentrations is statistically derived from a SSD and reflects a
concentration at which 5% of species in an ecosystem may be adversely affected.
HC50 Hazard Concentration 50%. This concentrations is statistically derived from a SSD and reflects a
concentration at which 50% of species in an ecosystem may be adversely affected.
MPC Maximum Permissible Concentration. This is a legal risk limit reflecting a concentration that protects the
ecosystem. It is derived from the HC5, eventually divided by an assessment factor. English synonym for MTR.
MTR Dutch synonym for MPC: “Maximaal Toelaatbare Risico-concentratie”
NOEC No Observed Effect Concentration. This parameter represents the concentration of a pollutant that will not harm the species involved, with respect to the effect that is studied.
OC Organic Carbon OM Organic Matter
Abbreviation Explanation
SRC Serious Risk Concentrations. This is a legal risk limit, used in the Netherlands, reflecting a concentration that induces additional investigation and possible risk management (intervention). It is derived from the HC50.
SSD Species Sensitivity Distribution. A SSD is an important probabilistic tool for environmental risk assessment (ERA) and accounts for differences in species sensitivity to a chemical.
Appendix 2 Species and records EU-RAR
EC10added for the most sensitive endpoint, total number of underlying
data (n). Between brackets the original RAR data, when different.
Species or proces n EC10added
(mg Ni/kg) Enzymatic processes 18 arylsulfatase 5 993 dehydrogenase 1 7.9 N-mineralisation 2 72 phosphatase 3 875 protease 1 77 saccharase 1 77 urease 5 281 invertebrates 44 Eisenia fetida 24 (17) 149 (179) Eisenia veneta 1 85 Enchytraeus albidus 1 180 Folsomia candida 16 275 Folsomia fimetaria 1 173 Lumbricus rubellus 1 842 microbial growth or processes 50 Aspergillis clavatus 1 13 Aspergillis flavipes 1 347 Aspergillis flavus 1 393 Aspergillis niger 1 400 ATP content 1 77 Bacillus cereus 1 285 Gliocladium sp. 1 200 Glucose respiration 10 127 Glutamate respiration 4 55 Maize respiration 8 152 Nitrification 10 116 Nocardia rhodochrous 1 177 Penicillium vermiculatum 1 102 Proteus vulgaris 1 15
Respiration CO2 release 4 299
Rhizopus stolonifer 1 288 Rhodotorula rubra 1 247 Serratia marcescens 1 155 Trichoderma viride 1 530 plants 85 Allium cepa 1 46 Avena sativa 15 76 Hordeum vulgare 33 (16) 235 (296) Lactuca sativa 5 104 Lollium perenne 1 110 Lycopersicon esculentum 15 103
Species or proces n EC10added (mg Ni/kg) Medicago sativa 9 78 Raphanus sativus 1 80 Spinach 2 32 Trigonella poenumgraceum 1 84 Zea mays 2 48
Species Medium Location pH OC clay Cb CEC Eq.Period Duration Parameter Endpoint EC-added (mg Ni/kg) Ref.
invertebrates
Folsomia candida Loamy sand Houthalen 3.6 1.73 0.4 1 1.84 7 28d EC10 reproduction 36.4 [28] Folsomia candida Sandy clay loam Zegveld 4.1 33.05 34 26 52.75 7 28d EC10 reproduction 558 Folsomia candida Loamy sand Montpellier 4.1 0.25 25.3 16 8.39 7 28d EC10 reproduction 120 Folsomia candida Loamy sand Rhydtalog 4.2 12.52 12.7 3 11.91 7 28d EC10 reproduction 527 Folsomia candida Jyndevad 4.5 1.32 1.5 1 1.84 7 28d EC10 reproduction 104 Folsomia candida Clay Aluminosa 5.6 0.9 46.9 19 19.26 7 28d EC10 reproduction 101 Folsomia candida Borris 5.6 1.33 4.3 3 4.91 7 28d EC10 reproduction 180 Folsomia candida Sandy clay loam Woburn 6.1 4.3 35.3 39 28.87 7 28d EC10 reproduction 622 Folsomia candida Silt loam Ter Munck 6.7 1.09 9.6 11 7.8 7 28d EC10 reproduction 269 Folsomia candida Clay Souli 7 0.45 33.2 81 12.85 7 28d EC10 reproduction 384 Folsomia candida Clay Marknesse 7.6 1.14 19.9 19 19.44 7 28d EC10 reproduction 662 Folsomia candida Clay Brecy 7.5 1.37 49.2 113 23.57 7 28d NOEC reproduction 828 Folsomia candida Cordoba 2 7.6 0.49 55.4 24 35.26 7 28d EC10 reproduction 1100 Folsomia candida Cordoba 1 7.6 0.53 19.8 18 13.35 7 28d EC10 reproduction 61.7 Folsomia candida Loam Guadalajara 7.7 0.31 17.2 11 13.27 7 28d EC10 reproduction 562 Eisenia fetida Loamy sand Houthalen 3.6 1.73 0.4 1 1.84 7 28d EC10 reproduction 49.8 Eisenia fetida Sandy clay loam Zegveld 4.1 33.05 34 26 52.75 7 28d EC10 reproduction 1110 Eisenia fetida Loamy sand Montpellier 4.1 0.25 25.3 16 8.39 7 28d EC10 reproduction 54.5 Eisenia fetida Loamy sand Rhydtalog 4.2 12.52 12.7 3 11.91 7 28d EC10 reproduction 362 Eisenia fetida Jyndevad 4.5 1.32 1.5 1 1.84 7 28d EC10 reproduction 46.5 Eisenia fetida Sandy loam Kovlinge II 5.1 2.47 3.9 2 4.31 7 28d EC10 reproduction 182 Eisenia fetida Clay Aluminosa 5.6 0.9 46.9 19 19.26 7 28d EC10 reproduction 230 Eisenia fetida Borris 5.6 1.33 4.3 3 4.91 7 28d EC10 reproduction 66.1 Eisenia fetida Sandy clay loam Woburn 6.1 4.3 35.3 39 28.87 7 28d EC10 reproduction 151 Eisenia fetida Silt loam Ter Munck 6.7 1.09 9.6 11 7.8 7 28d EC10 reproduction 172 Eisenia fetida Clay Souli 7 0.45 33.2 81 12.85 7 28d NOEC reproduction 297 Eisenia fetida Clay Marknesse 7.6 1.14 19.9 19 19.44 7 28d EC10 reproduction 233 Eisenia fetida Clay Brecy 7.5 1.37 49.2 113 23.57 7 28d EC10 reproduction 239
Eisenia fetida Loam Guadalajara 7.7 0.31 17.2 11 13.27 7 28d EC10 reproduction 198
Eisenia fetida OECD 207 6 5.8 10 20 14.5 21d NOEC reproduction 180 [29] Enchytraeus albidus OECD 207 6 5.8 10 20 14.5 42d NOEC reproduction 180 Folsomia candida OECD 207 6 5.8 10 20 14.5 28d NOEC reproduction 320
Eisenia veneta Loamy sand LUFA 2.2 5.5 2.3 5 6 7.9 EC10 reproduction 85 [30] Folsomia fimetaria Loamy sand LUFA 2.2 5.5 2.3 5 6 7.9 EC10 reproduction 173 Lumbricus rubellus Sandy loam b 7.3 4.7 17 17 25.3 EC10 mortality 842 [31]
microbial growth or processes
N-mineralisation Nethen 6.2 1.07 10 8 6.5 28d EC10 257 [32] N-mineralisation Nethen_NH4 6.2 1.07 10 8 6.5 28d EC10 20 Nitrification Sandy clay loam Zegveld 4.1 33.05 34 26 52.75 4-28d EC10 170 [33] Nitrification Loamy sand Rhydtalog 4.2 12.52 12.7 3 11.91 4-28d EC10 111 Nitrification Clay Aluminosa 5.6 0.9 46.9 19 19.26 4-28d EC10 44 Nitrification Borris 5.6 1.33 4.3 3 4.91 4-28d EC10 137 Nitrification Silt loam Ter Munck 6.7 1.09 9.6 11 7.8 4-28d EC10 67 Nitrification Clay Souli 7 0.45 33.2 81 12.85 4-28d EC10 214 Nitrification Clay Brecy 7.5 1.37 49.2 113 23.57 4-28d EC10 439 Nitrification Cordoba 2 7.6 0.49 55.4 24 35.26 4-28d EC10 169 Nitrification Cordoba 1 7.6 0.53 19.8 18 13.35 4-28d EC10 53 Nitrification Loam Guadalajara 7.7 0.31 17.2 11 13.27 24h EC10 67 Glucose respiration Loamy sand Montpellier 4.1 0.25 25.3 16 8.39 24h EC10 22 Glucose respiration Clay Aluminosa 5.6 0.9 46.9 19 19.26 24h EC10 254 Glucose respiration Sandy clay loam Woburn 6.1 4.3 35.3 39 28.87 24h EC10 376 Glucose respiration Silt loam Ter Munck 6.7 1.09 9.6 11 7.8 24h EC10 45 Glucose respiration Clay Souli 7 0.45 33.2 81 12.85 24h EC10 242 Glucose respiration Clay Marknesse 7.6 1.14 19.9 19 19.44 24h EC10 116 Glucose respiration Clay Brecy 7.5 1.37 49.2 113 23.57 24h EC10 302 Glucose respiration Cordoba 2 7.6 0.49 55.4 24 35.26 24h EC10 167 Glucose respiration Cordoba 1 7.6 0.53 19.8 18 13.35 24h EC10 140 Glucose respiration Loam Guadalajara 7.7 0.31 17.2 11 13.27 24h EC10 56 Maize respiration Loamy sand Houthalen 3.6 1.73 0.4 1 1.84 28d EC10 42
Maize respiration Sandy clay loam Woburn 6.1 4.3 35.3 39 28.87 28d EC10 121 Maize respiration Clay Souli 7 0.45 33.2 81 12.85 28d EC10 88 Maize respiration Clay Brecy 7.5 1.37 49.2 113 23.57 28d EC10 203 Maize respiration Cordoba 2 7.6 0.49 55.4 24 35.26 28d EC10 446 Maize respiration Loam Guadalajara 7.7 0.31 17.2 11 13.27 28d EC10 370 Aspergillis flavipes Kitchawan 4.9 3.34 9.4 20 8.15 several days EC10 hyphal growth 347 [34] Aspergillis flavus Kitchawan 4.9 3.34 9.4 20 8.15 several days EC10 hyphal growth 393 Aspergillis clavatus Kitchawan 4.9 3.34 9.4 20 8.15 several days EC10 hyphal growth 13 Aspergillis niger Kitchawan 4.9 3.34 9.4 20 8.15 several days EC10 hyphal growth 400 Penicillium vermiculatum Kitchawan 4.9 3.34 9.4 20 8.15 several days EC10 hyphal growth 102 Rhizopus stolonifer Kitchawan 4.9 3.34 9.4 20 8.15 several days EC10 hyphal growth 288 Trichoderma viride Kitchawan 4.9 3.34 9.4 20 8.15 several days EC10 hyphal growth 530 Gliocladium sp. Kitchawan 4.9 3.34 9.4 20 8.15 several days EC10 hyphal growth 200 Serratia marcescens Kitchawan 4.9 3.34 9.4 20 8.15 several days EC10 colony count 155 Proteus vulgaris Kitchawan 4.9 3.34 9.4 20 8.15 several days EC10 colony count 15 Bacillus cereus Kitchawan 4.9 3.34 9.4 20 8.15 several days EC10 colony count 285 Nocardia rhodochrous Kitchawan 4.9 3.34 9.4 20 8.15 several days EC10 colony count 177 Rhodotorula rubra Kitchawan 4.9 3.34 9.4 20 8.15 several days EC10 colony count 247 Respiration CO2
release Sandy loam a 6 3.3 9 2 11 42w NOEC 400 [35] Respiration CO2
release Clay b 7.5 1.86 60 39 30 80w EC10 2542
Respiration CO2
release Sandy peat a 4.4 7.4 5 4 52.5 82w EC10 291 Respiration CO2
release Typic Xerochrept a 5.2 1.4 8 14 13.1 28d NOEC 27 [36] ATP content Sandy cambisol a 6 1.2 9 9 10.3 9y NOEC 77 [37] Glutamate respiration Sand a 7 0.9 2 8 1.5 1.5y NOEC 55 [38] Glutamate respiration Sandy peat a 4.4 7.4 5 4 52.5 1.5y NOEC 55 Glutamate respiration Clay b 7.5 1.86 60 39 30 1.5y NOEC 55 Glutamate respiration Sandy loam a 6 3.31 9 2 11 1.5y NOEC 55
Hordeum vulgare Sandy clay loam Zegveld 4.1 33.05 34 26 52.75 7 4d EC10 root length 1101 Hordeum vulgare Loamy sand Montpellier 4.1 0.25 25.3 16 8.39 7 4d EC10 root length 90 Hordeum vulgare Loamy sand Rhydtalog 4.2 12.52 12.7 3 11.91 7 4d EC10 root length 249 Hordeum vulgare Jyndevad 4.5 1.32 1.5 1 1.84 7 4d EC10 root length 46 Hordeum vulgare Sandy loam Kovlinge II 5.1 2.47 3.9 2 4.31 7 4d EC10 root length 123 Hordeum vulgare Clay Aluminosa 5.6 0.9 46.9 19 19.26 7 4d EC10 root length 261 Hordeum vulgare Borris 5.6 1.33 4.3 3 4.91 7 4d EC10 root length 128 Hordeum vulgare Sandy clay loam Woburn 6.1 4.3 35.3 39 28.87 7 4d EC10 root length 398 Hordeum vulgare Silt loam Ter Munck 6.7 1.09 9.6 11 7.8 7 4d EC10 root length 106 Hordeum vulgare Clay Souli 7 0.45 33.2 81 12.85 7 4d EC10 root length 211 Hordeum vulgare Silt loam Marknesse 7.6 1.14 19.9 19 19.44 7 4d EC10 root length 268 Hordeum vulgare Clay Brecy 7.5 1.37 49.2 113 23.57 7 4d EC10 root length 289 Hordeum vulgare Cordoba 2 7.6 0.49 55.4 24 35.26 7 4d EC10 root length 587 Hordeum vulgare Cordoba 1 7.6 0.53 19.8 18 13.35 7 4d EC10 root length 96 Hordeum vulgare Loam Guadalajara 7.7 0.31 17.2 11 13.27 7 4d EC10 root length 304 Lycopersicon
esculentum Loamy sand Houthalen 3.6 1.73 0.4 1 1.84 7 28d EC10 yield-shoots 21 Lycopersicon
esculentum Sandy clay loam Zegveld 4.1 33.05 34 26 52.75 7 28d EC10 yield-shoots 599 Lycopersicon
esculentum Loamy sand Montpellier 4.1 0.25 25.3 16 8.39 7 28d EC10 yield-shoots 16 Lycopersicon
esculentum Loamy sand Rhydtalog 4.2 12.52 12.7 3 11.91 7 28d EC10 yield-shoots 125 Lycopersicon esculentum Jyndevad 4.5 1.32 1.5 1 1.84 7 28d EC10 yield-shoots 10 Lycopersicon
esculentum Sandy loam Kovlinge II 5.1 2.47 3.9 2 4.31 7 28d EC10 yield-shoots 42 Lycopersicon esculentum Borris 5.6 1.33 4.3 3 4.91 7 28d EC10 yield-shoots 52 Lycopersicon
esculentum Sandy clay loam Woburn 6.1 4.3 35.3 39 28.87 7 28d EC10 yield-shoots 150 Lycopersicon
esculentum Silt loam Ter Munck 6.7 1.09 9.6 11 7.8 7 28d EC10 yield-shoots 118 Lycopersicon Clay Souli 7 0.45 33.2 81 12.85 7 28d EC10 yield-shoots 250
esculentum Silt loam Marknesse 7.6 1.14 19.9 19 19.44 7 28d EC10 yield-shoots 200 Lycopersicon
esculentum Clay Brecy 7.5 1.37 49.2 113 23.57 7 28d EC10 yield-shoots 504 Lycopersicon esculentum Cordoba 2 7.6 0.49 55.4 24 35.26 7 28d EC10 yield-shoots 224 Lycopersicon esculentum Cordoba 1 7.6 0.53 19.8 18 13.35 7 28d EC10 yield-shoots 144 Lycopersicon
esculentum Loam Guadalajara 7.7 0.31 17.2 11 13.27 7 28d EC10 yield-shoots 189
Spinach Sand b 4.55 3 7.4 10 30d NOEC yield 10 [40]
Spinach Heavy clay 8.1 20 19.6 10 30d NOEC yield 100 Avena sativa Sandy loam + P Grenville 7.2 2.32 14 13 60 110d EC10 yield-grains 453 [41] Medicago sativa Sandy loam + P Grenville 7.6 2.32 14 13 60 83d EC10 yield-tops 371 Medicago sativa Sandy loam + P Grenville 7.2 2.32 14 13 60 83d EC10 yield-tops 383 Avena sativa Sand 3 Uplands 5.5 0.81 14 6 60 110d EC10 yield-grains 43 Avena sativa Sand 3+P Uplands 5.5 0.81 14 6 60 110d EC10 yield-grains 47 Avena sativa Sand 3+L Uplands 6.3 0.81 14 6 60 110d EC10 yield-grains 64 Avena sativa Sand 3+P+L Uplands 6.2 0.81 14 6 60 110d EC10 yield-grains 53 Medicago sativa Sand 3+P Uplands 5.5 0.81 14 6 60 83d EC10 yield-tops 36 Medicago sativa Sand 3+L Uplands 6.3 0.81 14 6 60 83d EC10 yield-tops 44 Medicago sativa Sand 3+P+L Uplands 6.2 0.81 14 6 60 83d EC10 yield-tops 39 Avena sativa Sand 4 Uplands 5.2 2.38 14 11.7 60 110d EC10 yield-grains 49 Avena sativa Sand 4+P Uplands 5.1 2.38 14 11.7 60 110d EC10 yield-grains 238 Avena sativa Sand 4+L Uplands 6.4 2.38 14 11.7 60 110d EC10 yield-grains 238 Avena sativa Sand 4+P+L Uplands 6.1 2.38 14 11.7 60 110d EC10 yield-grains 253 Medicago sativa Sand 4 Uplands 5.2 2.38 14 11.7 60 83d EC10 yield-tops 34 Medicago sativa Sand 4+P Uplands 5.1 2.38 14 11.7 60 83d EC10 yield-tops 41 Medicago sativa Sand 4+L Uplands 6.4 2.38 14 11.7 60 83d EC10 yield-tops 92 Medicago sativa Sand 4+P+L Uplands 6.1 2.38 14 11.7 60 83d EC10 yield-tops 91
Avena sativa Clay a 7.5 1.34 9 8 14.6 60 to maturaty NOEC yield-grains 80 [42] Raphanus sativus Clay a 7.5 1.34 9 8 14.6 60 30d NOEC yield 80
Lactuca sativa Clay c 8.3 1.74 45 27 34.7 60 40d NOEC yield-leaves 40 Allium cepa xx 8.3 0.28 24 14 12.6 7 56d EC10 yield 46 [43]
Lactuca sativa Steinhof 4.9 16 8 63d EC10 yield-leaves 18 [45] Lactuca sativa Gansemos 5.6 17 41 63d EC10 yield-leaves 153 Lactuca sativa Erlach 7.7 26 10 63d EC10 yield-leaves 257 Lactuca sativa Gasel 6.6 21 20 63d EC10 yield-leaves 422 Avena sativa x 5.6 0.93 12 10 15 150d EC10 yield-grains 66 [46] Avena sativa x 5.4 1.4 40 26 21 150d EC10 yield-grains 45 Avena sativa x 5.2 1.86 58 46 33 150d EC10 yield-grains 47 Avena sativa x 5 1.98 4 2 9 150d EC10 yield-grains 16 Avena sativa x 5.4 3.95 5 1 19 150d EC10 yield-grains 40 Zea mays Loam Giza 7.9 26.6 54 17.3 45-50d EC10 119 [47] Zea mays sandy loam Nobaria 8.2 0.7 15.1 40 12.6 45-50d EC10 19
enzymatic processes
urease Sand a 7 0.9 2 8 1.5 1.5y EC10 120 [48]
urease Sandy loam a 6 3.31 9 2 11 1.5y EC10 2300
urease Silty loam a 7.7 1.4 19 25 16 42d EC10 130
urease Clay b 7.5 1.86 60 39 30 1.5y EC10 90
urease Sandy peat a 4.4 7.44 5 4 52.5 1.5y EC10 540 phosphatase Sandy loam a 6 3.31 9 2 11 1.5y EC10 7021 [49] phosphatase Silty loam a 7.7 1.4 19 25 16 1.5y EC10 251
phosphatase Clay b 7.5 1.86 60 39 30 42d EC10 380
arylsulfatase Sand a 7 0.9 2 8 1.5 42d EC10 372 [50] arylsulfatase Sandy loam a 6 3.31 9 2 11 42d EC10 610 arylsulfatase Silty loam a 7.7 1.4 19 25 16 42d EC10 2207 arylsulfatase Clay b 7.5 1.86 60 39 30 1.5y EC10 272 arylsulfatase Sandy peat a 4.4 7.44 5 4 52.5 1.5y EC10 7080
dehydrogenase haplic luvisol 7 1.1 15.2 19.4 12.4 EC10 7.9 [51] saccharase Sandy cambisol a 6 1.2 9 9 10.3 9y NOEC 77 [52]
Page 43 of 46
Appendix 4 Overview of parameter b according to EU-RAR
Overview of parameter b experimentally determined for 7 test organisms and read-across choices for other organisms, in order to enable bioavailability corrections of nickel NOEC or EC10 values for all species in the toxicity database (according to EU-RAR descriptions).
Test organism b Read across to: Reason
Lycopersicon esculentum
(tomato)
1.27
Hordeum vulgare
(barley) 1.12 All other plants in the database: Allium cepa,Avena sativa, Lactuca sativa,Lollium perenne, Medicago sativa, Raphanus sativus, Spinach, Trigonella poenumgraceum and Zea mays
Slopes quit similar to tomato. No critical choice according to RAR uncertaintly analysis
Eisenia fetida 0.95 To all soft bodied invertebrates: Eisenia
veneta, Lumbricus rubellus, Enchytraeus albidus
Based on dominant metal uptake route via their dermis.
Folsomia candida 1.17 To all hard bodied invertebrates: Folsomia fimetaria,
Based on dominant metal uptake route through gut wall. Substrate
induced respiration
1.34 Glutamate respiration, glucose
respiration, ATP content Indicators of biomass and ATP content Maize induced
respiration
1.22 Dehydrogenase,respiration Natural substrates and basal soil respiration Nitrification 1.00 N-mineralization, arylsulfatase,
phosphatase, protease, saccharase, urease
Processes related to the N-cycle, and all other microbial processes not covered by substrate induced or maize induced respiration